
Have Market-oriented Reforms Decoupled China’s CO2 Emissions from Total Electricity Generation? An Empirical Analysis

Abstract
:1. Introduction
2. Methods and Data
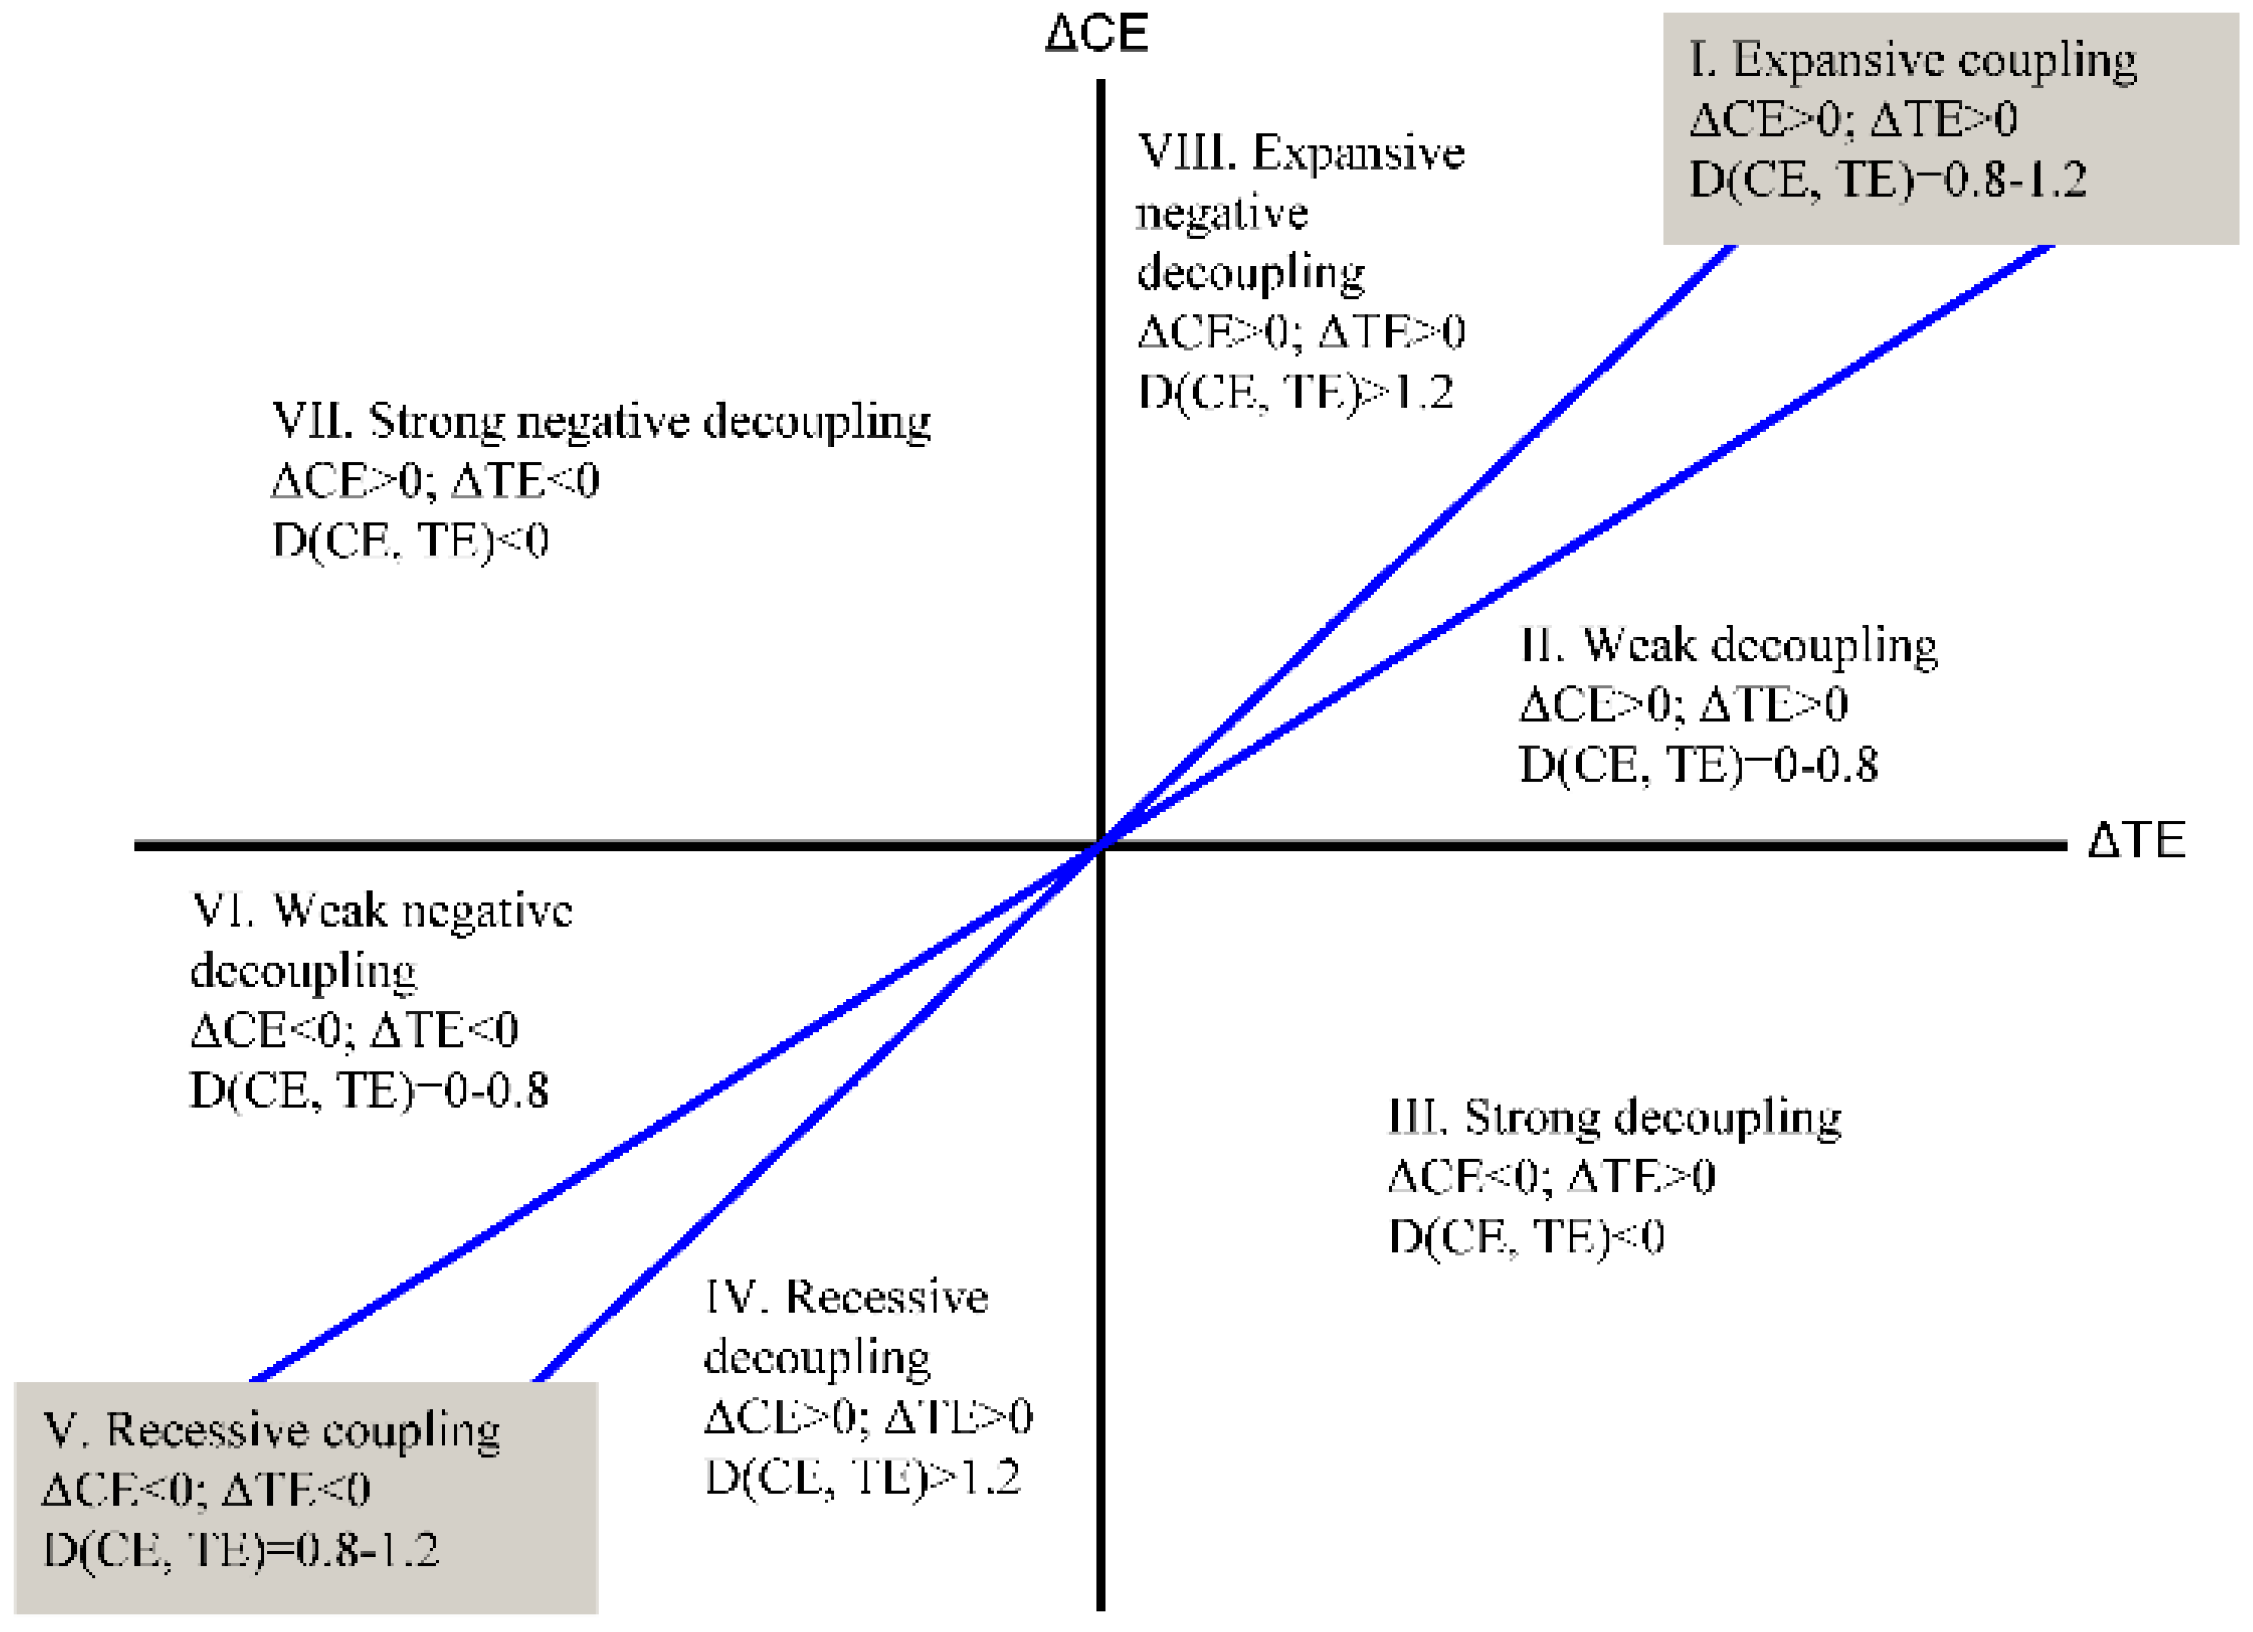
2.1. Tapio Decoupling Index
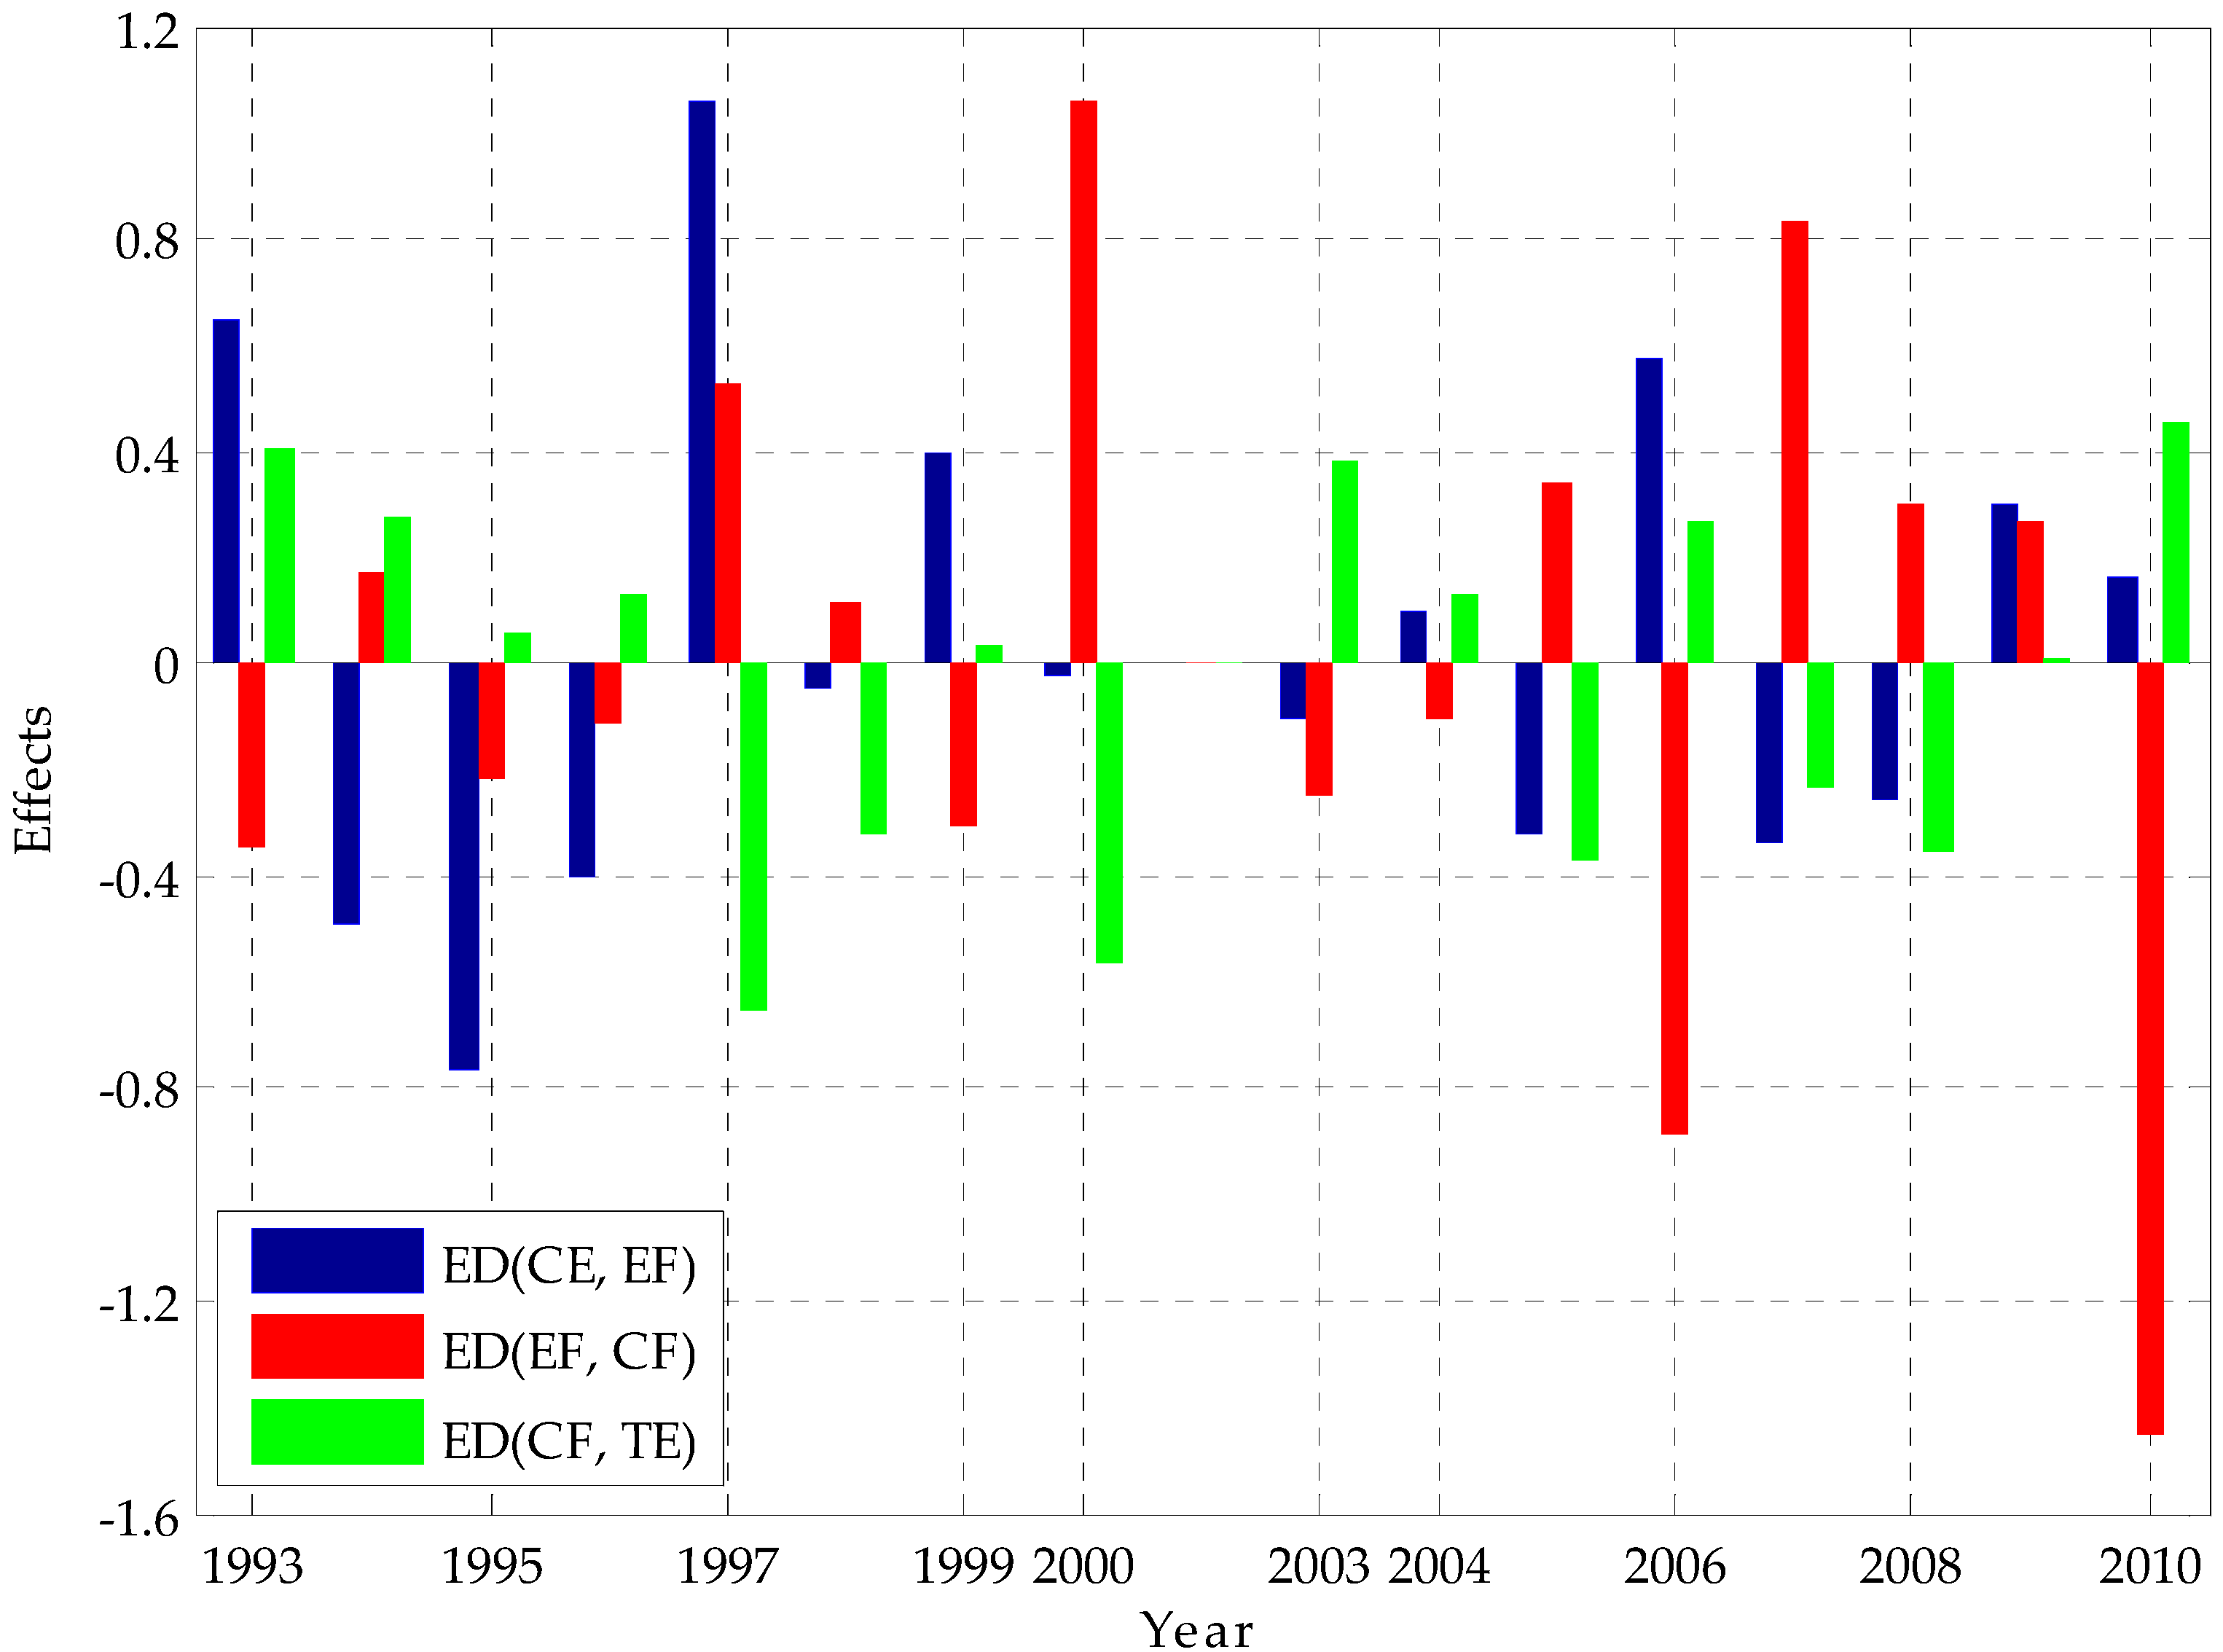
2.2. Laspeyres Decomposition
2.3. Data Selection
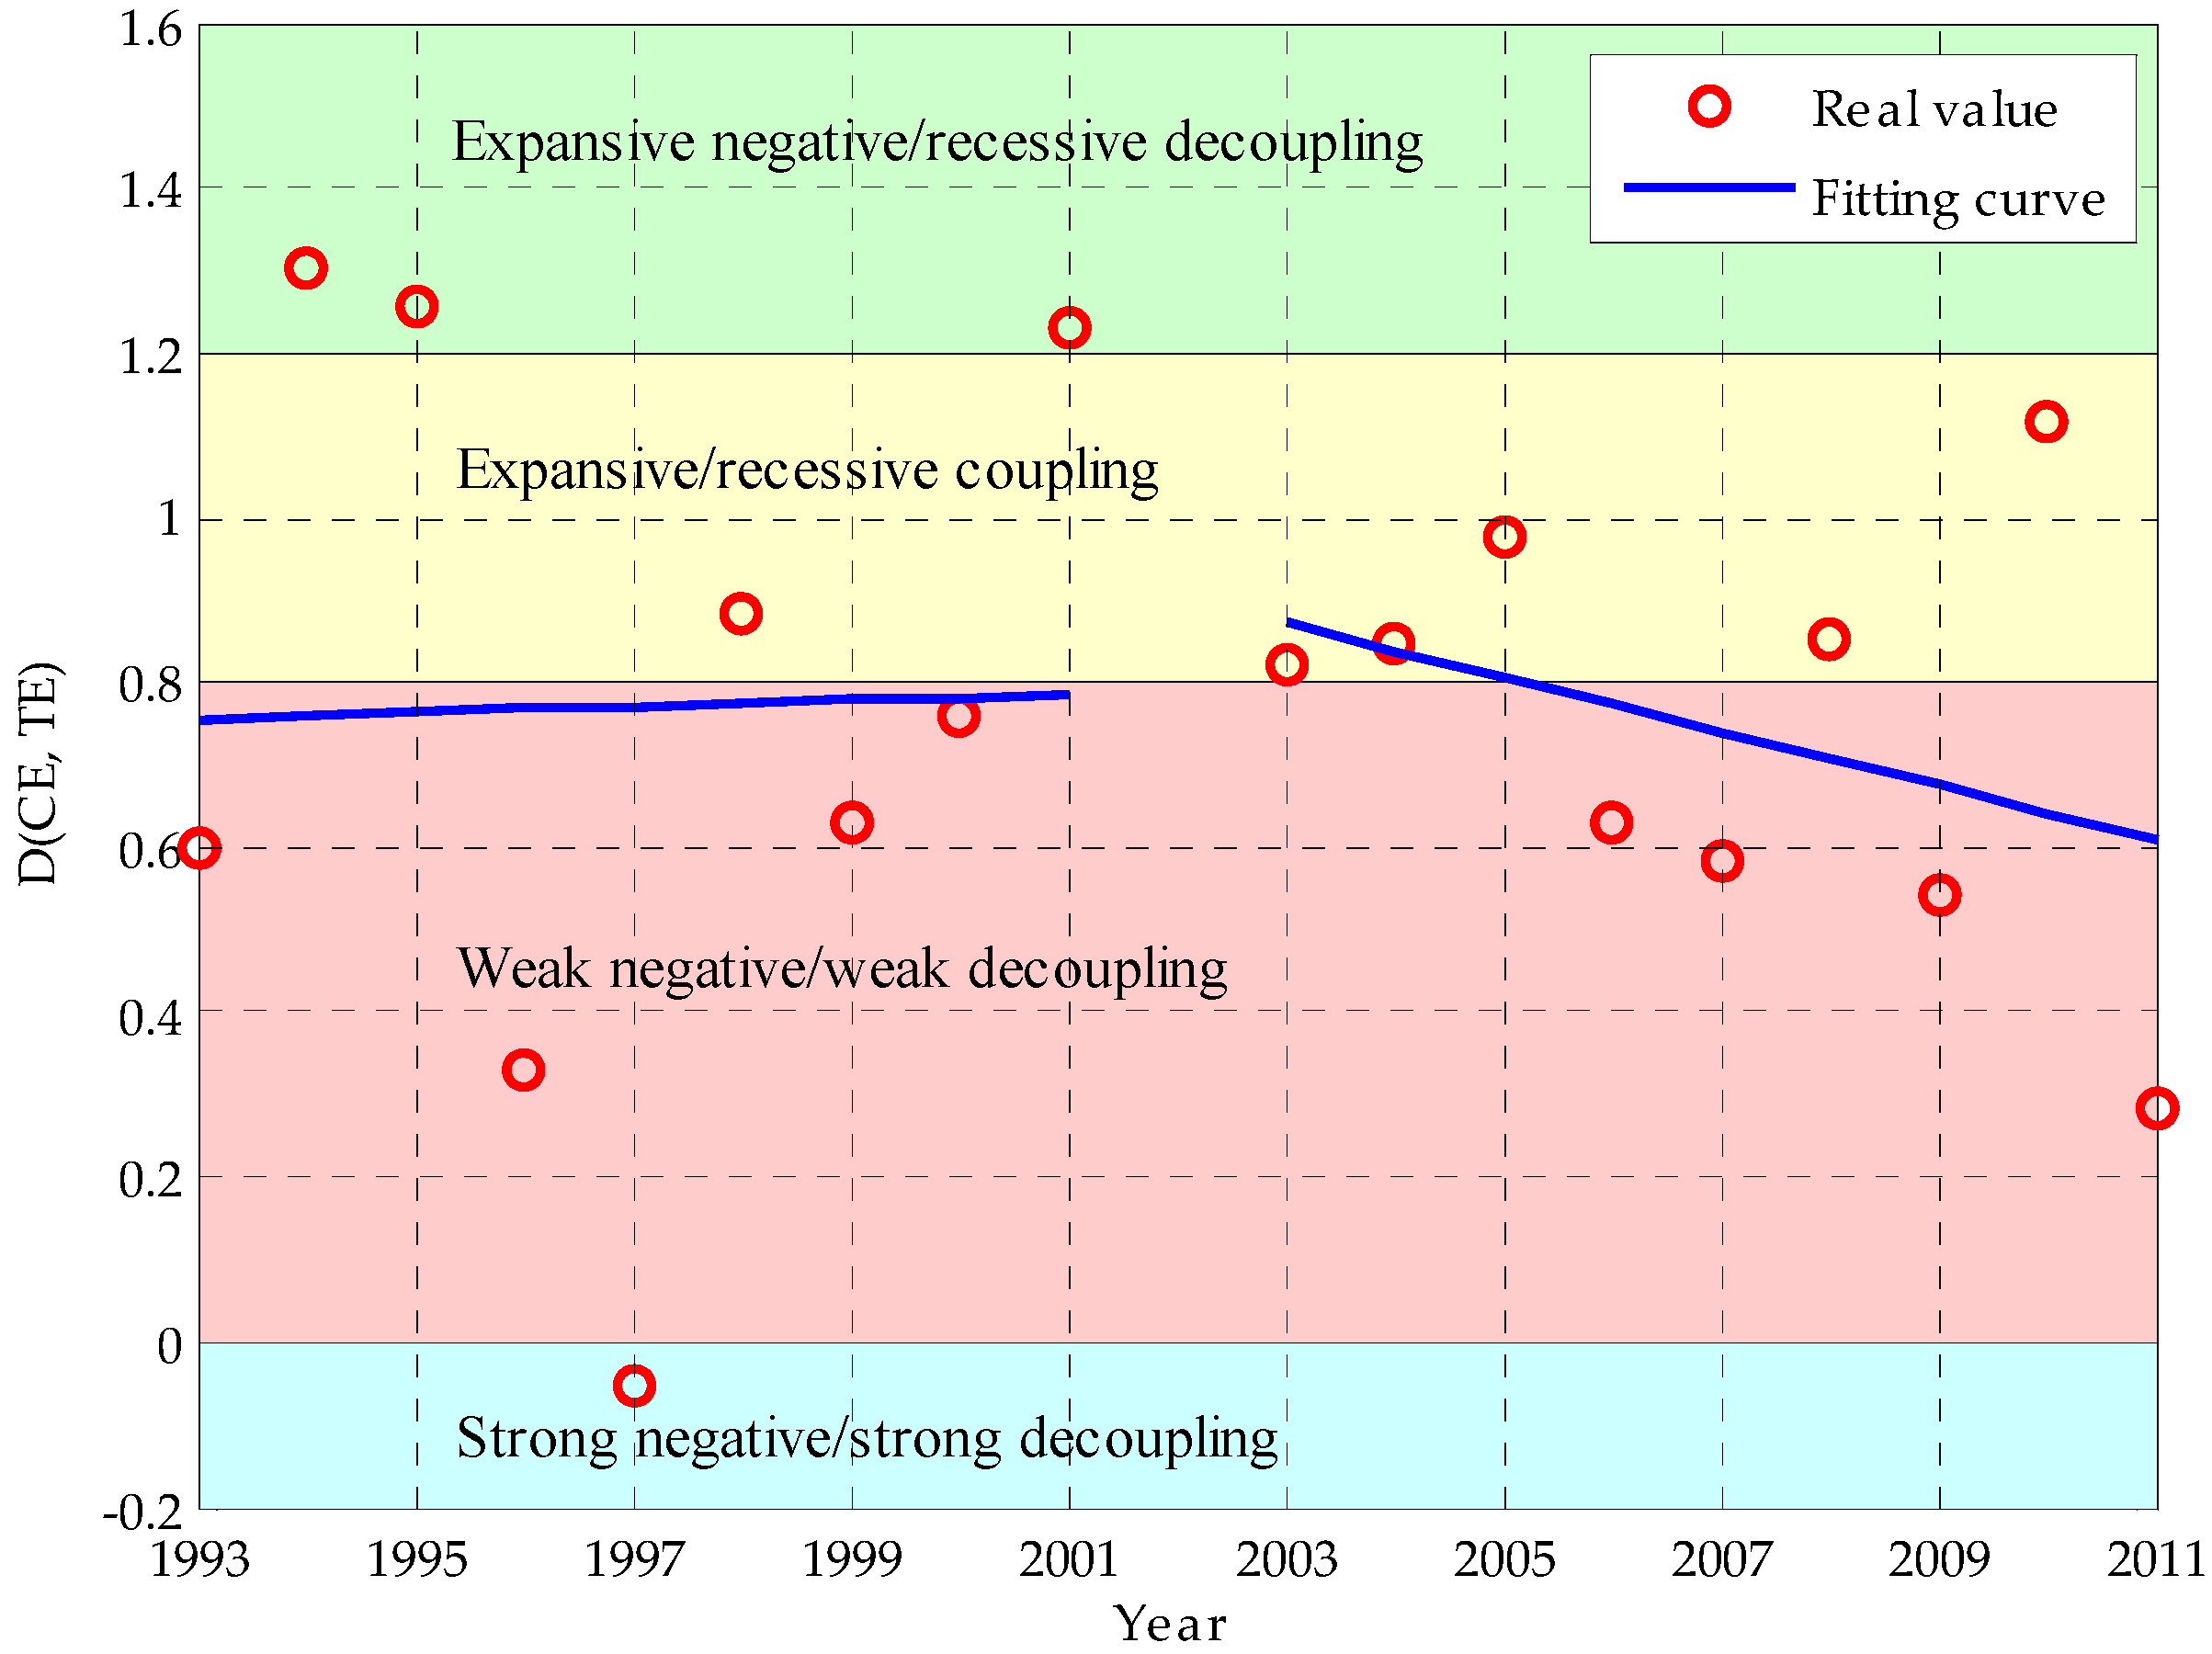
3. Results
4. Discussion
4.1. Outlier Analysis
4.2. Trend Analysis
4.3. Decomposition Result Analysis
5. Conclusions
Acknowledgments
Author Contributions
Conflicts of Interest
References
- Central Committee of the Chinese Communist Party, State Council. Further Strengthening the Institutional Reform of Electric Power Industry. Available online: http://www.ne21.com/news/show-64828.html (accessed on 4 January 2016). (In Chinese)
- National Development and Reform Commission, National Energy Administration. Six Subsidiary Documents for the New Electric Reforms were Released. Available online: http://politics.people.com.cn/n/2015/1130/c70731–27870919.html (accessed on 4 January 2016). (In Chinese)
- Shiu, A.; Lam, P.L. Electricity consumption and economic growth in China. Energy Policy 2004, 21, 47–54. [Google Scholar] [CrossRef]
- Yuan, J.; Zhao, C.; Yu, S.; Hu, Z. Electricity consumption and economic growth in China: Cointegration and co-feature analysis. Energy Econ. 2007, 29, 1179–1191. [Google Scholar] [CrossRef]
- BP. Statistical Review of World Energy 2015. Available online: http://www.bp.com/statisticalreview (accessed on 10 January 2016).
- National Bureau of Statistics of China. China Statistical Yearbook (1994–2014); China Statistical Press: Beijing, China, 1995–2015.
- Smol, J.P. Climate Change: A planet in flux. Nature 2012, 483, S12–S15. [Google Scholar] [CrossRef] [PubMed]
- Asian Development Bank. Toward an Environmentally Sustainable Future: Country Environmental Analysis of the People’s Republic of China. Available online: http://www.Adb.Org/publications/toward-environmentally-sustainable-future-country-environmental-analysis-prc (accessed on 15 January 2016).
- Zhang, X.Y.; Sun, J.Y.; Wang, Y.Q.; Li, W.J.; Zhang, Q.; Wang, W.G.; Quan, J.N.; Cao, G.L.; Wang, J.Z.; Yang, Y.Q.; et al. Factors contributing to haze and fog in China. Chin. Sci. Bull. 2013, 58, 1178–1187. (In Chinese) [Google Scholar] [CrossRef]
- Gao, Y.; Cheng, H.; Zhu, J.; Liang, H.; Li, P. The Optimal Dispatch of a Power System Containing Virtual Power Plants under Fog and Haze Weather. Sustainability 2016, 8, 71. [Google Scholar] [CrossRef]
- Kahrl, F.; Williams, J.H.; Hum, J. The political economy of electricity dispatch reform in China. Energy Policy 2013, 53, 361–369. [Google Scholar] [CrossRef]
- Du, L.; Mao, J.; Shi, J. Assessing the impact of regulatory reforms on China’s electricity generation industry. Energy Policy 2009, 37, 712–720. [Google Scholar] [CrossRef]
- Wang, Q.; Chen, X. China’s electricity market-oriented reform: From an absolute to a relative monopoly. Energy Policy 2012, 51, 143–148. [Google Scholar] [CrossRef]
- Shen, J.; Luo, C. Overall review of renewable energy subsidy policies in China—Contradictions of intentions and effects. Renew. Sustain. Energy Rev. 2015, 41, 1478–1488. [Google Scholar] [CrossRef]
- Zhao, X.; Ma, C. Deregulation, vertical unbundling and the performance of China’s large coal-fired power plants. Energy Econ. 2013, 40, 474–483. [Google Scholar] [CrossRef]
- Zeng, M.; Xue, S.; Li, L.; Wang, Y.; Wei, Y.; Li, Y. China’s large-scale power shortages of 2004 and 2011 after the electricity market reforms of 2002: Explanations and differences. Energy Policy 2013, 61, 610–618. [Google Scholar]
- Cherni, J.A.; Kentish, J. Renewable energy policy and electricity market reforms in China. Energy Policy 2007, 35, 3616–3629. [Google Scholar] [CrossRef]
- Zhao, X.; Lyon, T.P.; Song, C. Lurching towards markets for power: China’s electricity policy 1985–2007. Applied Energy 2012, 94, 148–155. [Google Scholar] [CrossRef]
- Du, L.; He, Y.; Yan, J. The effects of electricity reforms on productivity and efficiency of China’s fossil-fired power plants: An empirical analysis. Energy Econ. 2013, 40, 804–812. [Google Scholar] [CrossRef]
- Sun, X.; Guo, L.; Zeng, Z. Market entry barriers for foreign direct investment and private investors: Lessons from China’s electricity market. Energy Strateg. Rev. 2013, 2, 169–175. [Google Scholar]
- Tevie, J.; Grimsrud, K.M.; Berrens, R.P. Testing the Environmental Kuznets Curve Hypothesis for Biodiversity Risk in the US: A Spatial Econometric Approach. Sustainability 2011, 3, 2182–2199. [Google Scholar] [CrossRef]
- Balaguer, J.; Cantavella, M. Estimating the environmental Kuznets curve for Spain by considering fuel oil prices (1874–2011). Ecol. Indic. 2016, 60, 853–859. [Google Scholar] [CrossRef]
- Knight, K.W.; Schor, J.B. Economic Growth and Climate Change: A Cross-National Analysis of Territorial and Consumption-Based Carbon Emissions in High-Income Countries. Sustainability 2014, 6, 3722–3731. [Google Scholar] [CrossRef]
- Yuliya, K.; Leonardo, R.; Joao, P. Urban Economies Resource Productivity and Decoupling: Metabolism Trends of 1996–2011 in Sweden, Stockholm, and Gothenburg. Environ. Sci. Technol. 2015, 49, 8815–8823. [Google Scholar]
- Martin, M.; Danielsson, L. Environmental Implications of Dynamic Policies on Food Consumption and Waste Handling in the European Union. Sustainability 2016, 8, 282. [Google Scholar] [CrossRef]
- Organization for Economic Co-operation and Development. Indicators to Measure Decoupling of Environmental Pressure from Economic Growth. Available online: http://www.oecd.org/env/indicators-modelling-outlooks/1933638.pdf (accessed on 2 February 2016).
- Conrad, E.; Cassar, L.F. Decoupling Economic Growth and Environmental Degradation: Reviewing Progress to Date in the Small Island State of Malta. Sustainability 2014, 6, 6729–6750. [Google Scholar] [CrossRef]
- Tapio, P. Towards a theory of decoupling: Degrees of decoupling in the EU and the case of road traffic in Finland between 1970 and 2001. Transport Policy 2005, 12, 137–151. [Google Scholar] [CrossRef]
- Wang, Z.; Zhao, L.; Mao, G.; Wu, B. Factor Decomposition Analysis of Energy-Related CO2 Emissions in Tianjin, China. Sustainability 2015, 7, 9973–9988. [Google Scholar] [CrossRef]
- González, D.; Martínez, M. Decomposition analysis of CO2 emissions in the Mexican industrial sector. Energy Sustain. Dev. 2012, 16, 204–215. [Google Scholar] [CrossRef]
- Vehmas, J.; Malaska, P.; Luukkanen, J.; Kaivo-oja, J.; Hietanen, O.; Vinnari, M.; Ilvonen, J. Europe in the global battle of sustainability: Rebound strikes back? Advanced Sustainability Analysis; Publications of the Turku School of Economics and Business Administration: Turku, Finland, 2003. [Google Scholar]
- Sun, J.W. Changes in energy consumption and energy intensity: A complete decomposition model. Energy Econ. 1998, 20, 85–100. [Google Scholar] [CrossRef]
- National Bureau of Statistics of China. China Energy Statistical Yearbook (1994–2013); China Statistical Press: Beijing, China, 1995–2014.
- General Administration of Quality Supervision, Inspection and Quarantine of the People’s Republic of China. Standardization Administration of the People’s Republic of China. General Principles for Calculation of Total Production Energy Consumption; China Standard Press: Beijing, China, 2008.
- Malakoff, D. China’s peak carbon pledge raises pointed questions. Science 2014, 346, 903. [Google Scholar] [CrossRef] [PubMed]
- Li, L.; Wang, J. The Effects of Coal Switching and Improvements in Electricity Production Efficiency and Consumption on CO2 Mitigation Goals in China. Sustainability 2015, 7, 9540–9559. [Google Scholar] [CrossRef]


| Year | 1993 | 1994 | 1995 | 1996 | 1997 | 1998 | 1999 | 2000 | 2001 | 2002 |
| CE | 779.5 | 829.4 | 922 | 1004.2 | 1021.2 | 1019.7 | 1076.2 | 1140 | 1220 | 1395.9 |
| TE | 838.3 | 928.1 | 1007.7 | 1079.4 | 1134.5 | 1166.2 | 1239.3 | 1355.6 | 1480.8 | 1654.0 |
| EF | 683.9 | 745.9 | 804.3 | 877.7 | 924.1 | 944.1 | 1020.5 | 1114.2 | 1183.4 | 1338.1 |
| CF | 138.0 | 148.7 | 162.9 | 178.9 | 192.4 | 209.9 | 223.4 | 237.5 | 253.0 | 265.6 |
| Year | 2003 | 2004 | 2005 | 2006 | 2007 | 2008 | 2009 | 2010 | 2011 | 2012 |
| CE | 1667.1 | 1876.3 | 2090.5 | 2389.6 | 2608.2 | 2694.5 | 2858.7 | 3064.4 | 3476.3 | 3534 |
| TE | 1910.6 | 2203.3 | 2500.3 | 2865.7 | 3281.6 | 3466.9 | 3714.7 | 4207.2 | 4713 | 4987.6 |
| EF | 1580.4 | 1795.6 | 2047.3 | 2369.6 | 2722.9 | 2790.1 | 2982.8 | 3331.9 | 3833.7 | 3892.8 |
| CF | 289.8 | 329.5 | 391.4 | 483.8 | 556.1 | 602.9 | 651.1 | 709.7 | 768.3 | 819.7 |
| Year | 1993 | 1994 | 1995 | 1996 | 1997 | 1998 | 1999 | 2000 | 2001 |
| D(CE, TE) | 0.5974 | 1.3009 | 1.2543 | 0.3316 | −0.0525 | 0.884 | 0.6317 | 0.7598 | 1.2327 |
| D(CE, EF) | 0.7057 | 1.426 | 0.9771 | 0.3205 | −0.0678 | 0.6843 | 0.646 | 1.1292 | 1.1029 |
| D(EF, CF) | 1.168 | 0.8201 | 0.9339 | 0.6972 | 0.2387 | 1.2541 | 1.4531 | 0.9542 | 2.6376 |
| D(CF, TE) | 0.7249 | 1.1124 | 1.3746 | 1.4838 | 3.2463 | 1.0300 | 0.6729 | 0.7051 | 0.4237 |
| Year | 2003 | 2004 | 2005 | 2006 | 2007 | 2008 | 2009 | 2010 | 2011 |
| D(CE, TE) | 0.819 | 0.8471 | 0.9788 | 0.6305 | 0.5859 | 0.8527 | 0.5427 | 1.1179 | 0.2849 |
| D(CE, EF) | 0.9214 | 0.8142 | 0.909 | 0.6135 | 1.3417 | 0.8823 | 0.6147 | 0.8926 | 1.0765 |
| D(EF, CF) | 0.9938 | 0.7463 | 0.6664 | 0.9985 | 0.2931 | 0.8635 | 1.3008 | 1.8216 | 0.2307 |
| D(CF, TE) | 0.8944 | 1.394 | 1.6158 | 1.0292 | 1.4899 | 1.1192 | 0.6787 | 0.6876 | 1.1471 |
| Year | 1993 | 1994 | 1995 | 1996 | 1997 | 1998 | 1999 | 2000 |
| ED(CE, EF) | 0.6497 | −0.4907 | −0.7639 | −0.4036 | 1.0592 | −0.0439 | 0.4001 | −0.0256 |
| ED(EF, CF) | −0.3487 | 0.1689 | −0.2181 | −0.1109 | 0.5282 | 0.1129 | −0.3058 | 1.0614 |
| ED(CF, TE) | 0.4025 | 0.2752 | 0.0592 | 0.1304 | −0.651 | −0.3213 | 0.0338 | −0.563 |
| Year | 2003 | 2004 | 2005 | 2006 | 2007 | 2008 | 2009 | 2010 |
| ED(CE, EF) | −0.1056 | 0.1006 | −0.3205 | 0.5726 | −0.3385 | −0.256 | 0.2965 | 0.1619 |
| ED(EF, CF) | −0.2446 | −0.1037 | 0.3391 | −0.8883 | 0.8356 | 0.2985 | 0.2682 | −1.4481 |
| ED(CF, TE) | 0.3783 | 0.1348 | −0.3669 | 0.2711 | −0.2303 | −0.3525 | 0.0106 | 0.453 |
| Year | 1993 | 1994 | 1995 | 1996 | 1997 | 1998 | 1999 | 2000 | 2001 |
| Category | II | VIII | VIII | II | III | I | II | II | VIII |
| Year | 2003 | 2004 | 2005 | 2006 | 2007 | 2008 | 2009 | 2010 | 2011 |
| Category | I | I | I | II | II | I | II | I | II |
| Year | 2012 | 2013 | 2014 | 2015 | 2016 | 2017 | 2018 | 2019 | 2020 | 2021 |
| D(CE, TE) | 0.575 | 0.543 | 0.51 | 0.477 | 0.444 | 0.411 | 0.378 | 0.345 | 0.312 | 0.279 |
| Year | 2022 | 2023 | 2024 | 2025 | 2026 | 2027 | 2028 | 2029 | 2030 | 2031 |
| D(CE, TE) | 0.246 | 0.214 | 0.181 | 0.148 | 0.115 | 0.082 | 0.049 | 0.016 | −0.017 | −0.05 |
© 2016 by the authors; licensee MDPI, Basel, Switzerland. This article is an open access article distributed under the terms and conditions of the Creative Commons Attribution (CC-BY) license (http://creativecommons.org/licenses/by/4.0/).
Share and Cite
Shang, W.; Pei, G.; Walsh, C.; Meng, M.; Meng, X. Have Market-oriented Reforms Decoupled China’s CO2 Emissions from Total Electricity Generation? An Empirical Analysis. Sustainability 2016, 8, 468. https://0-doi-org.brum.beds.ac.uk/10.3390/su8050468
Shang W, Pei G, Walsh C, Meng M, Meng X. Have Market-oriented Reforms Decoupled China’s CO2 Emissions from Total Electricity Generation? An Empirical Analysis. Sustainability. 2016; 8(5):468. https://0-doi-org.brum.beds.ac.uk/10.3390/su8050468
Chicago/Turabian StyleShang, Wei, Guifen Pei, Conor Walsh, Ming Meng, and Xiangsong Meng. 2016. "Have Market-oriented Reforms Decoupled China’s CO2 Emissions from Total Electricity Generation? An Empirical Analysis" Sustainability 8, no. 5: 468. https://0-doi-org.brum.beds.ac.uk/10.3390/su8050468