Thermal and Fluid Dynamic Analysis within a Batch Micro-Reactor for Biodiesel Production from Waste Vegetable Oil


Department of Economic, Engineering, Society and Business Organization (DEIM), Tuscia University, 01100 Viterbo, Italy
*
Author to whom correspondence should be addressed.
Sustainability 2017, 9(12), 2308; https://0-doi-org.brum.beds.ac.uk/10.3390/su9122308
Submission received: 24 October 2017
/
Revised: 27 November 2017
/
Accepted: 6 December 2017
/
Published: 12 December 2017
(This article belongs to the Special Issue Small-Scale Energy Conversion of Agro-Forestry Residues for Local Benefits and European Competitiveness)
Abstract
:Biofuels represent an alternative solution to petroleum-based fuels. In particular, biodiesel is very interesting, especially if it is produced from waste vegetable oil. Biodiesel can be used in diesel engines. The aim of this work is to implement a 2D numerical analysis in Comsol Multiphysics in order to verify an uniform temperature field within a non-isothermal batch mixed micro-reactor. An immersion heater system has been studied as a suitable solution to increase the temperature of WVO (Waste Vegetable Oil) before the start of the transesterification reaction. Thus, the efficiency of the immersion heating system has been investigated. The results show that the temperature field is not uniform within the fluid domain, because of the convective flux with the external environment. These conditions could lead to a low overall conversion rate.
1. Introduction
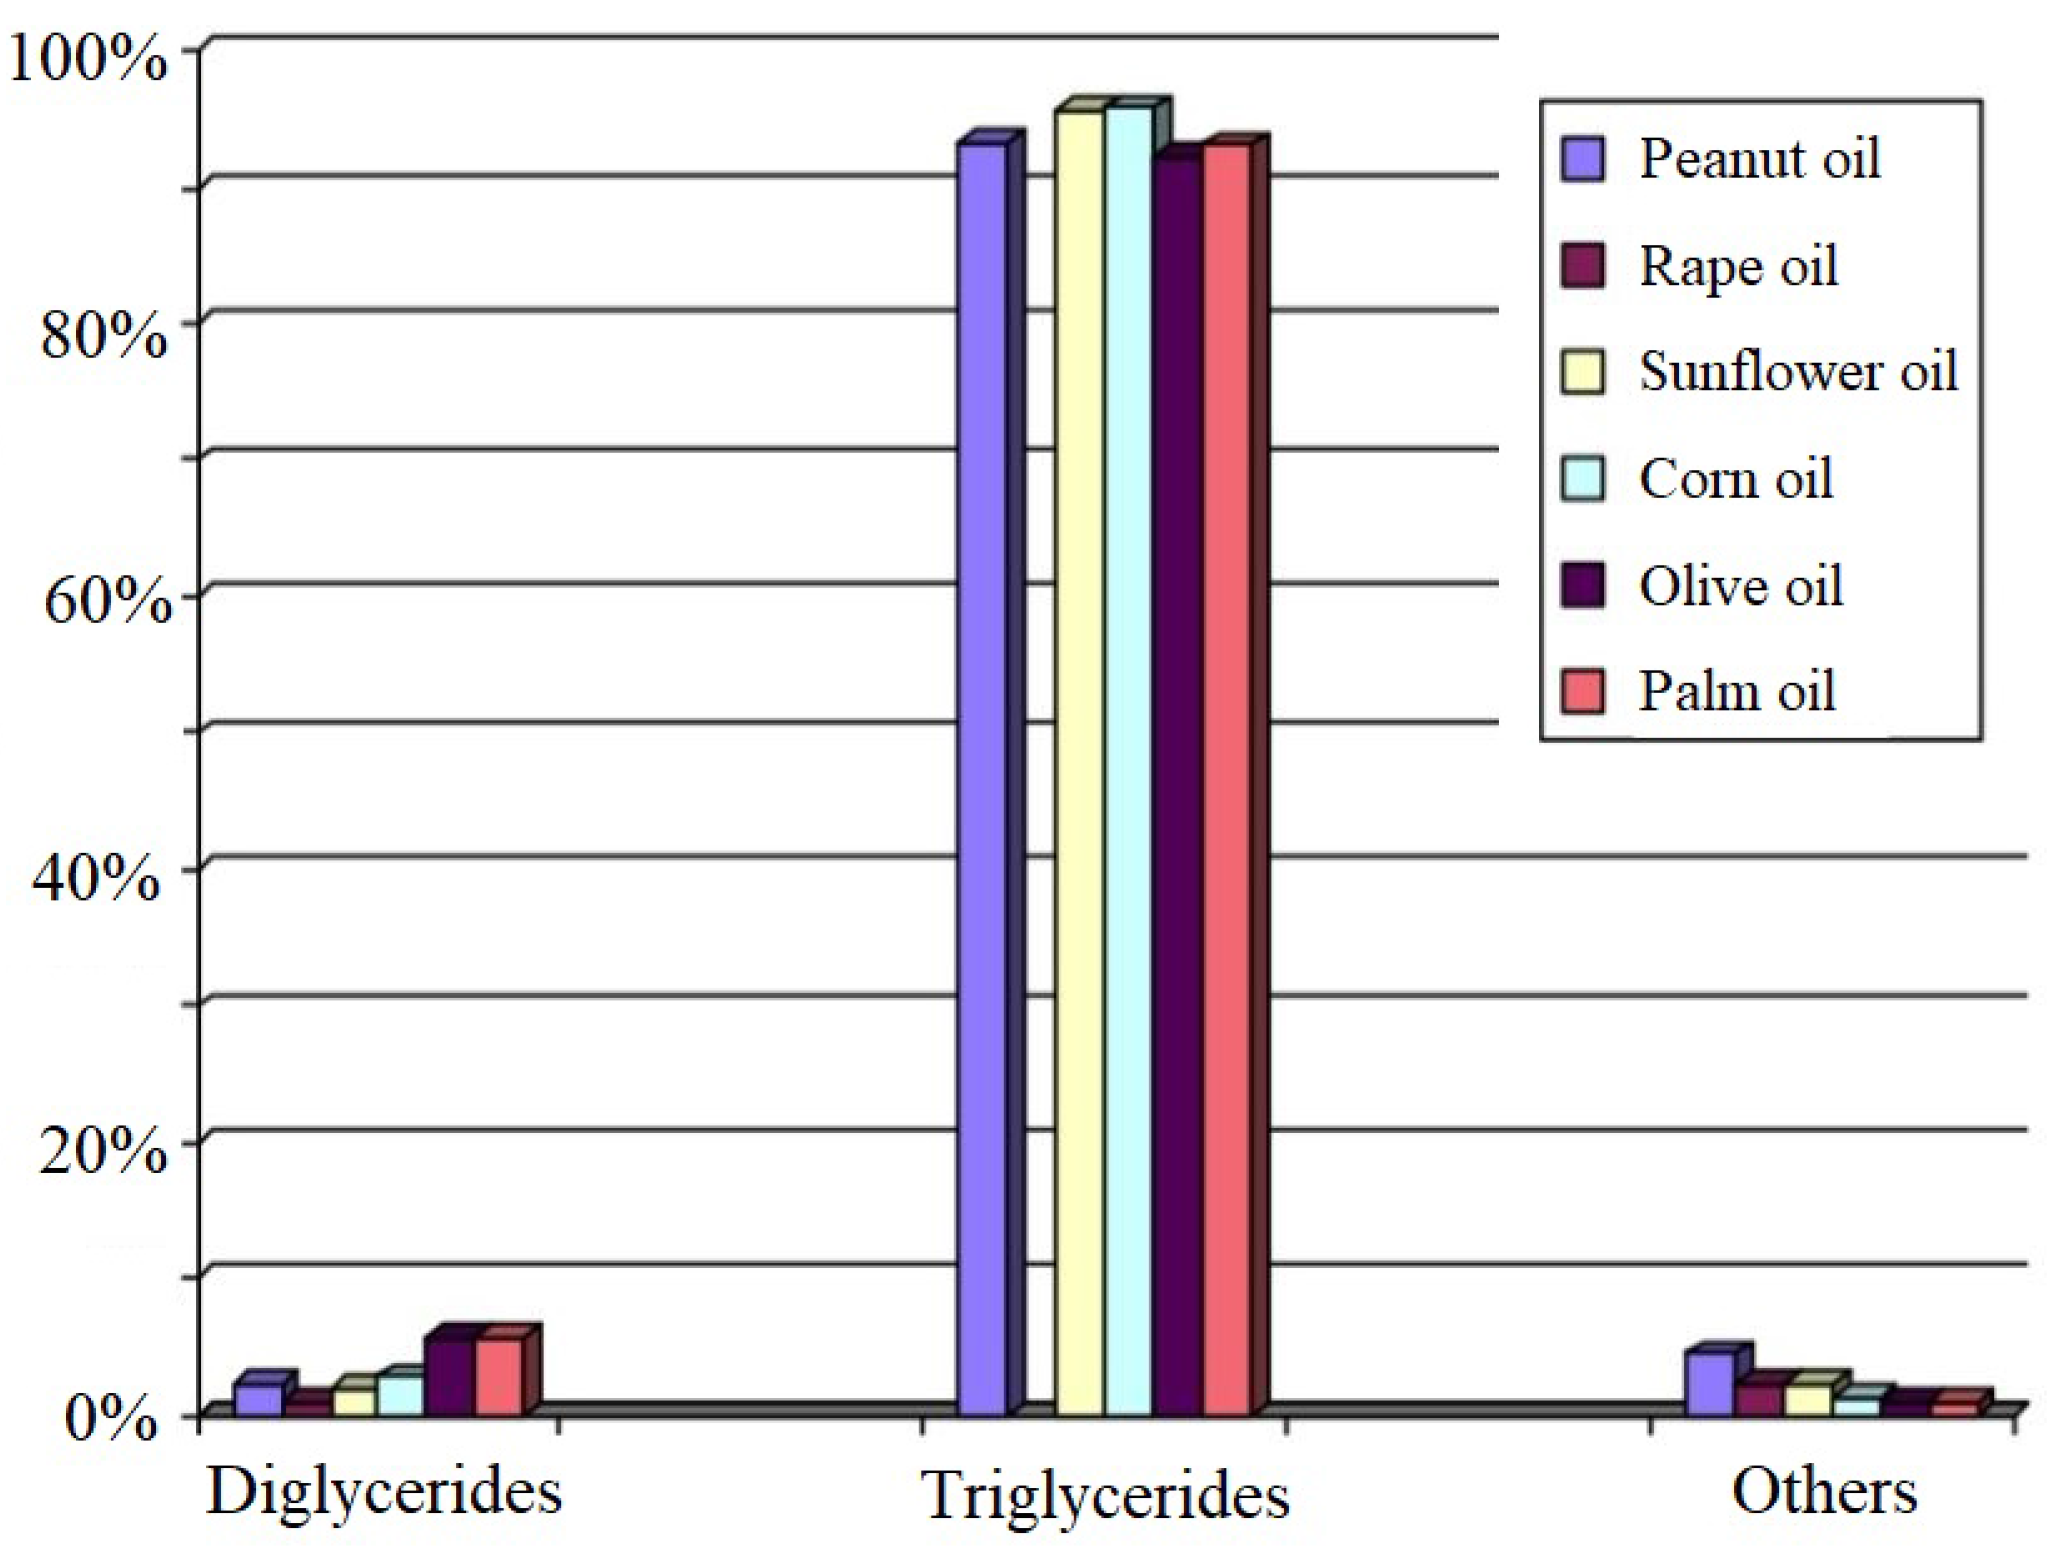
Energy demand has been increasingly influenced by new targets in order to achieve environmental pollution reduction and renewable waste management [1]. Energy systems efficiency has been growing during the last years [2,3]. Referring to European scenario, Directive 2009/28/EC—also known as Directive 20-20-20—and Energy Roadmap 2050 set climate and energy goals to be achieved by 2020: gases emissions reduction and energy efficiency improvement are some of the requirements. Biomass represents an alternative to petroleum-based energy production. Vegetable Oil (VO) is a natural fat produced by physical or chemical extraction applied to oil seeds. The VO is mainly composed by tryglycerides [4], as shown in Figure 1. It could be used to obtain BioDiesel (BD), a Fatty Acids Alchyl Ester (FAAE) which constitutes an alternative to the petroleum-based fuel [4,5]. The physical-chemical characteristics of the vegetable oil, for example, high viscosity, low volatility and presence of polyunsaturated bonds, does not allow its use in diesel engines. Thus, vegetable oils are frequently used in the transesterification proces for the production of biodiesel.
Biodiesel is characterized by a kinematic viscosity, flash point—as reported by UNI EN 14214— higher than diesel [6]. BD lower heating value (LHV) is about 40–41 MJ/kg, while petroleum-based alternative LHV is about 44–45 MJ/kg [7]. Biodiesel has an oxygen content equal to 10–11% in weight compared to 2–3% in weight of diesel. For this reason, combustion of biodiesel is better than diesel [8]. Moreover, the absence of aromatic compounds and reduced emissions due to combustion [4] make BD an efficient alternative to fossil diesel [9]. Furthermore, to use BD in commercialized diesel engines no modifications are required [10,11]. A comparison between biological and fossil fuel is available in Table 1.
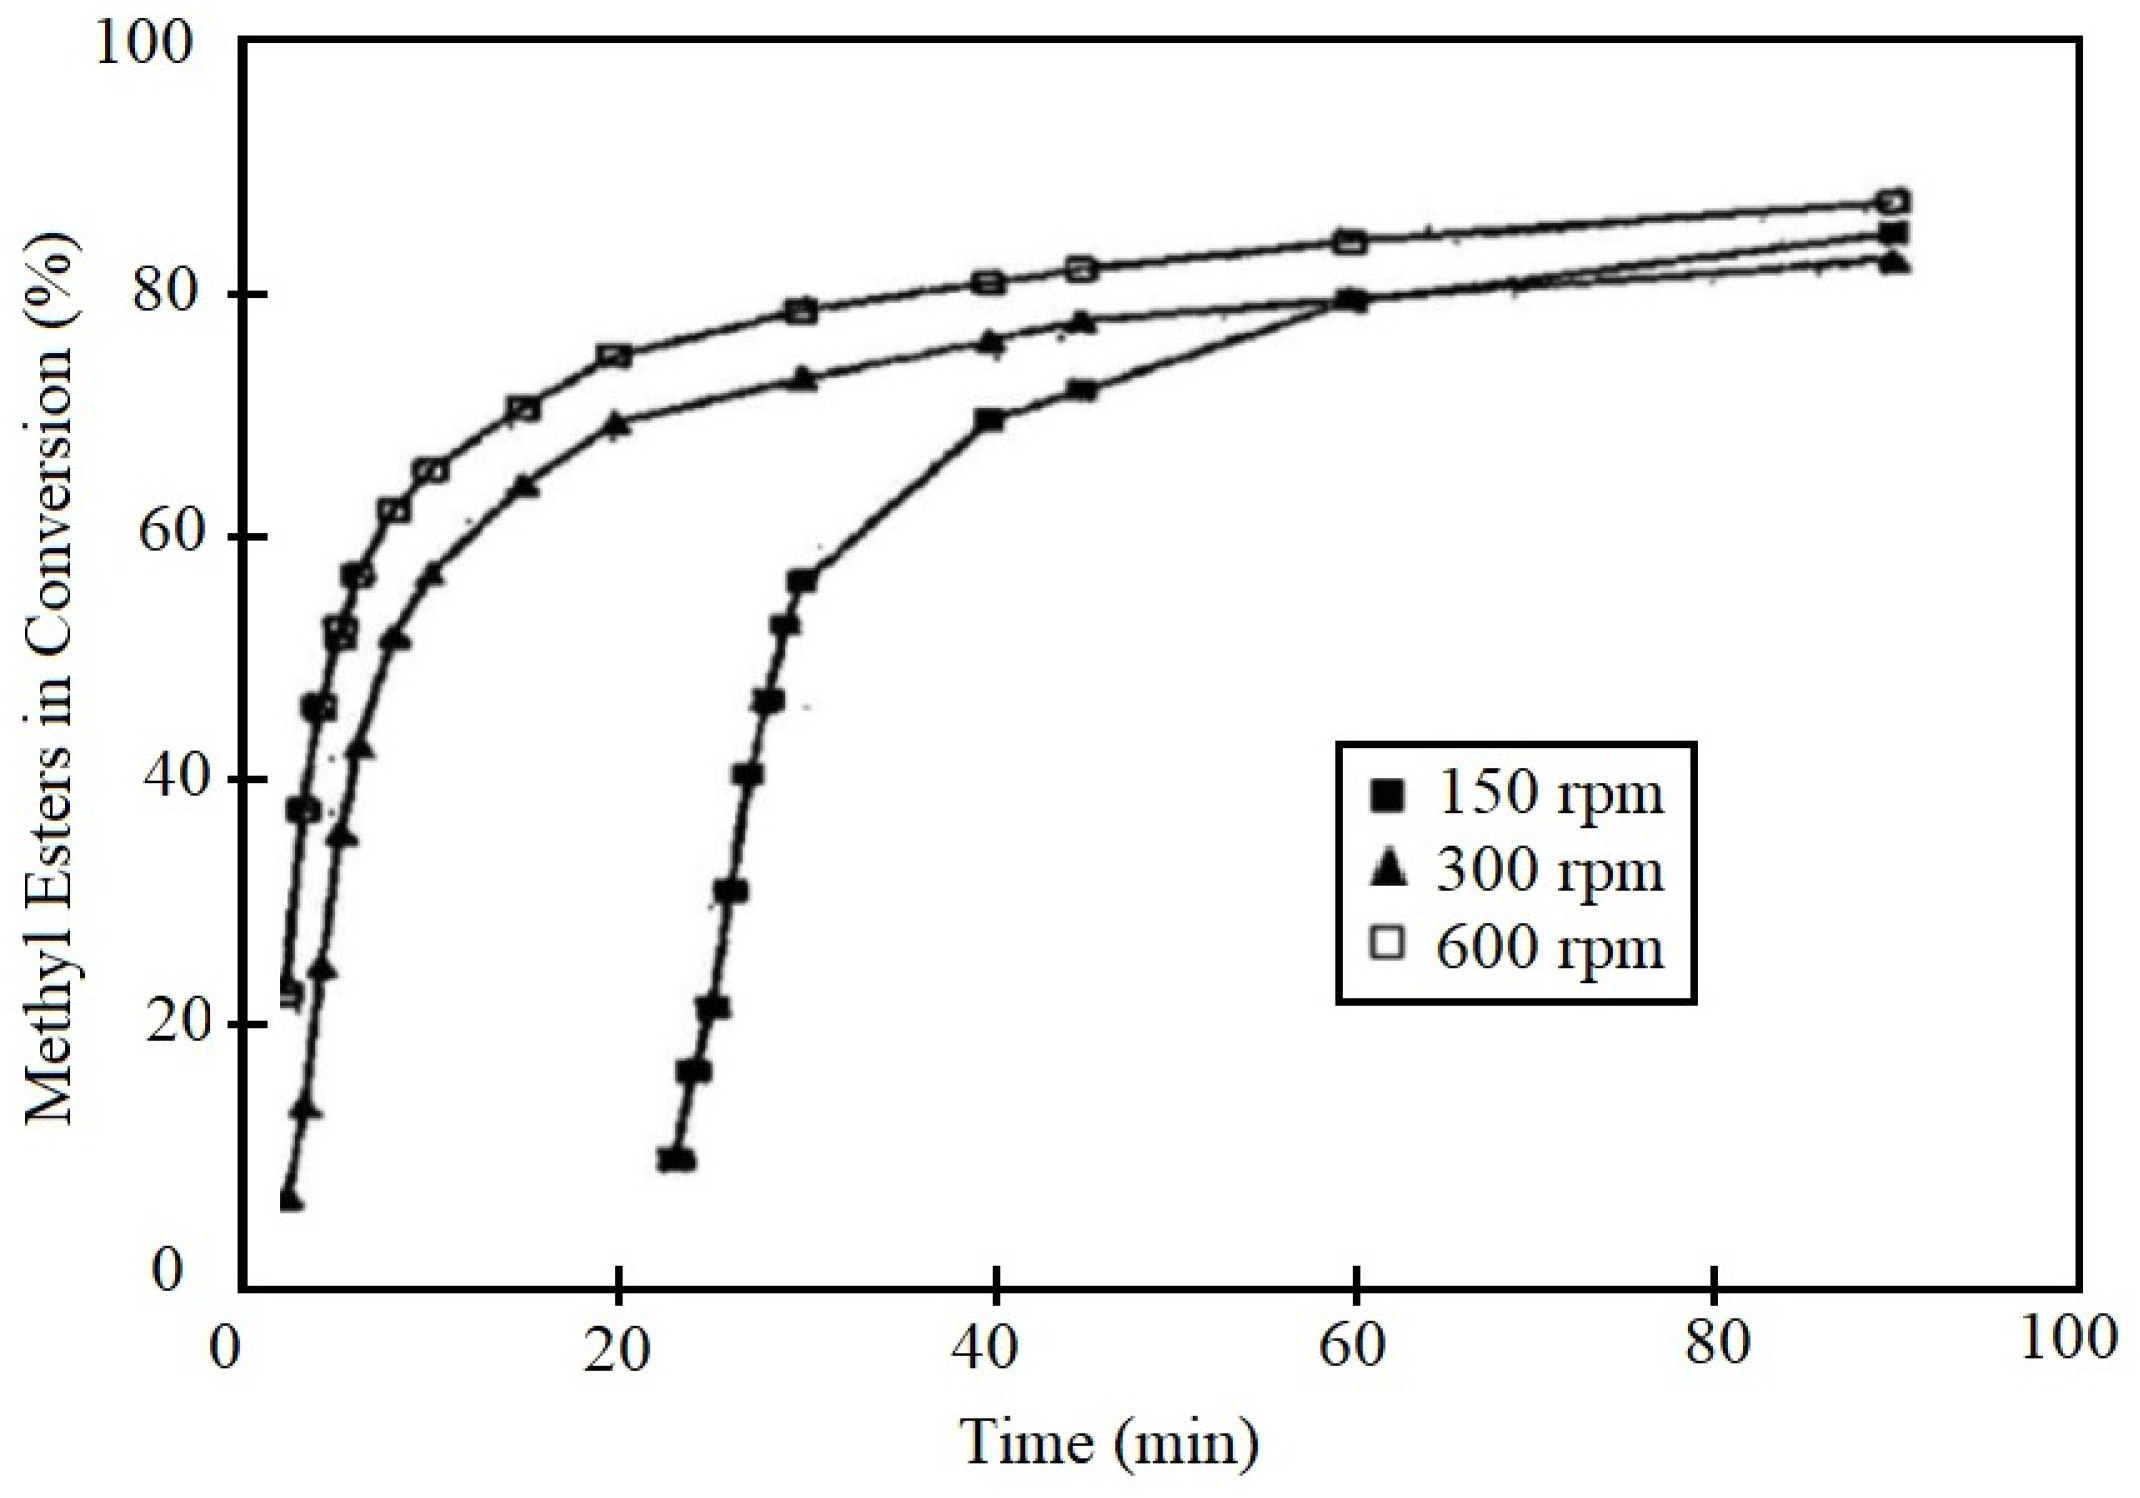
The transesterification reaction has been identified as the most economic method to convert tryglycerides of vegetable oil into biodiesel. The tryglycerides react with an alcohol, usually methanol, in the presence of a basic catalyst to give alchyl esters, biodiesel, and glicerol [5,14,15]. The chemical reaction takes place in a batch stirred reactor at temperatures between 60–70 C for a time of 60 min [5,16,17,18]. The correct operation of the batch reactor is essential to reach a high yield of the transesterification reaction. In detail, a constant heating and an adeguate degree of mixing are the parameters which influence mainly the yield of reaction. In Figure 2, the percentage conversion in biodiesel is verified in function of different mixing speeds in a batch reactor.
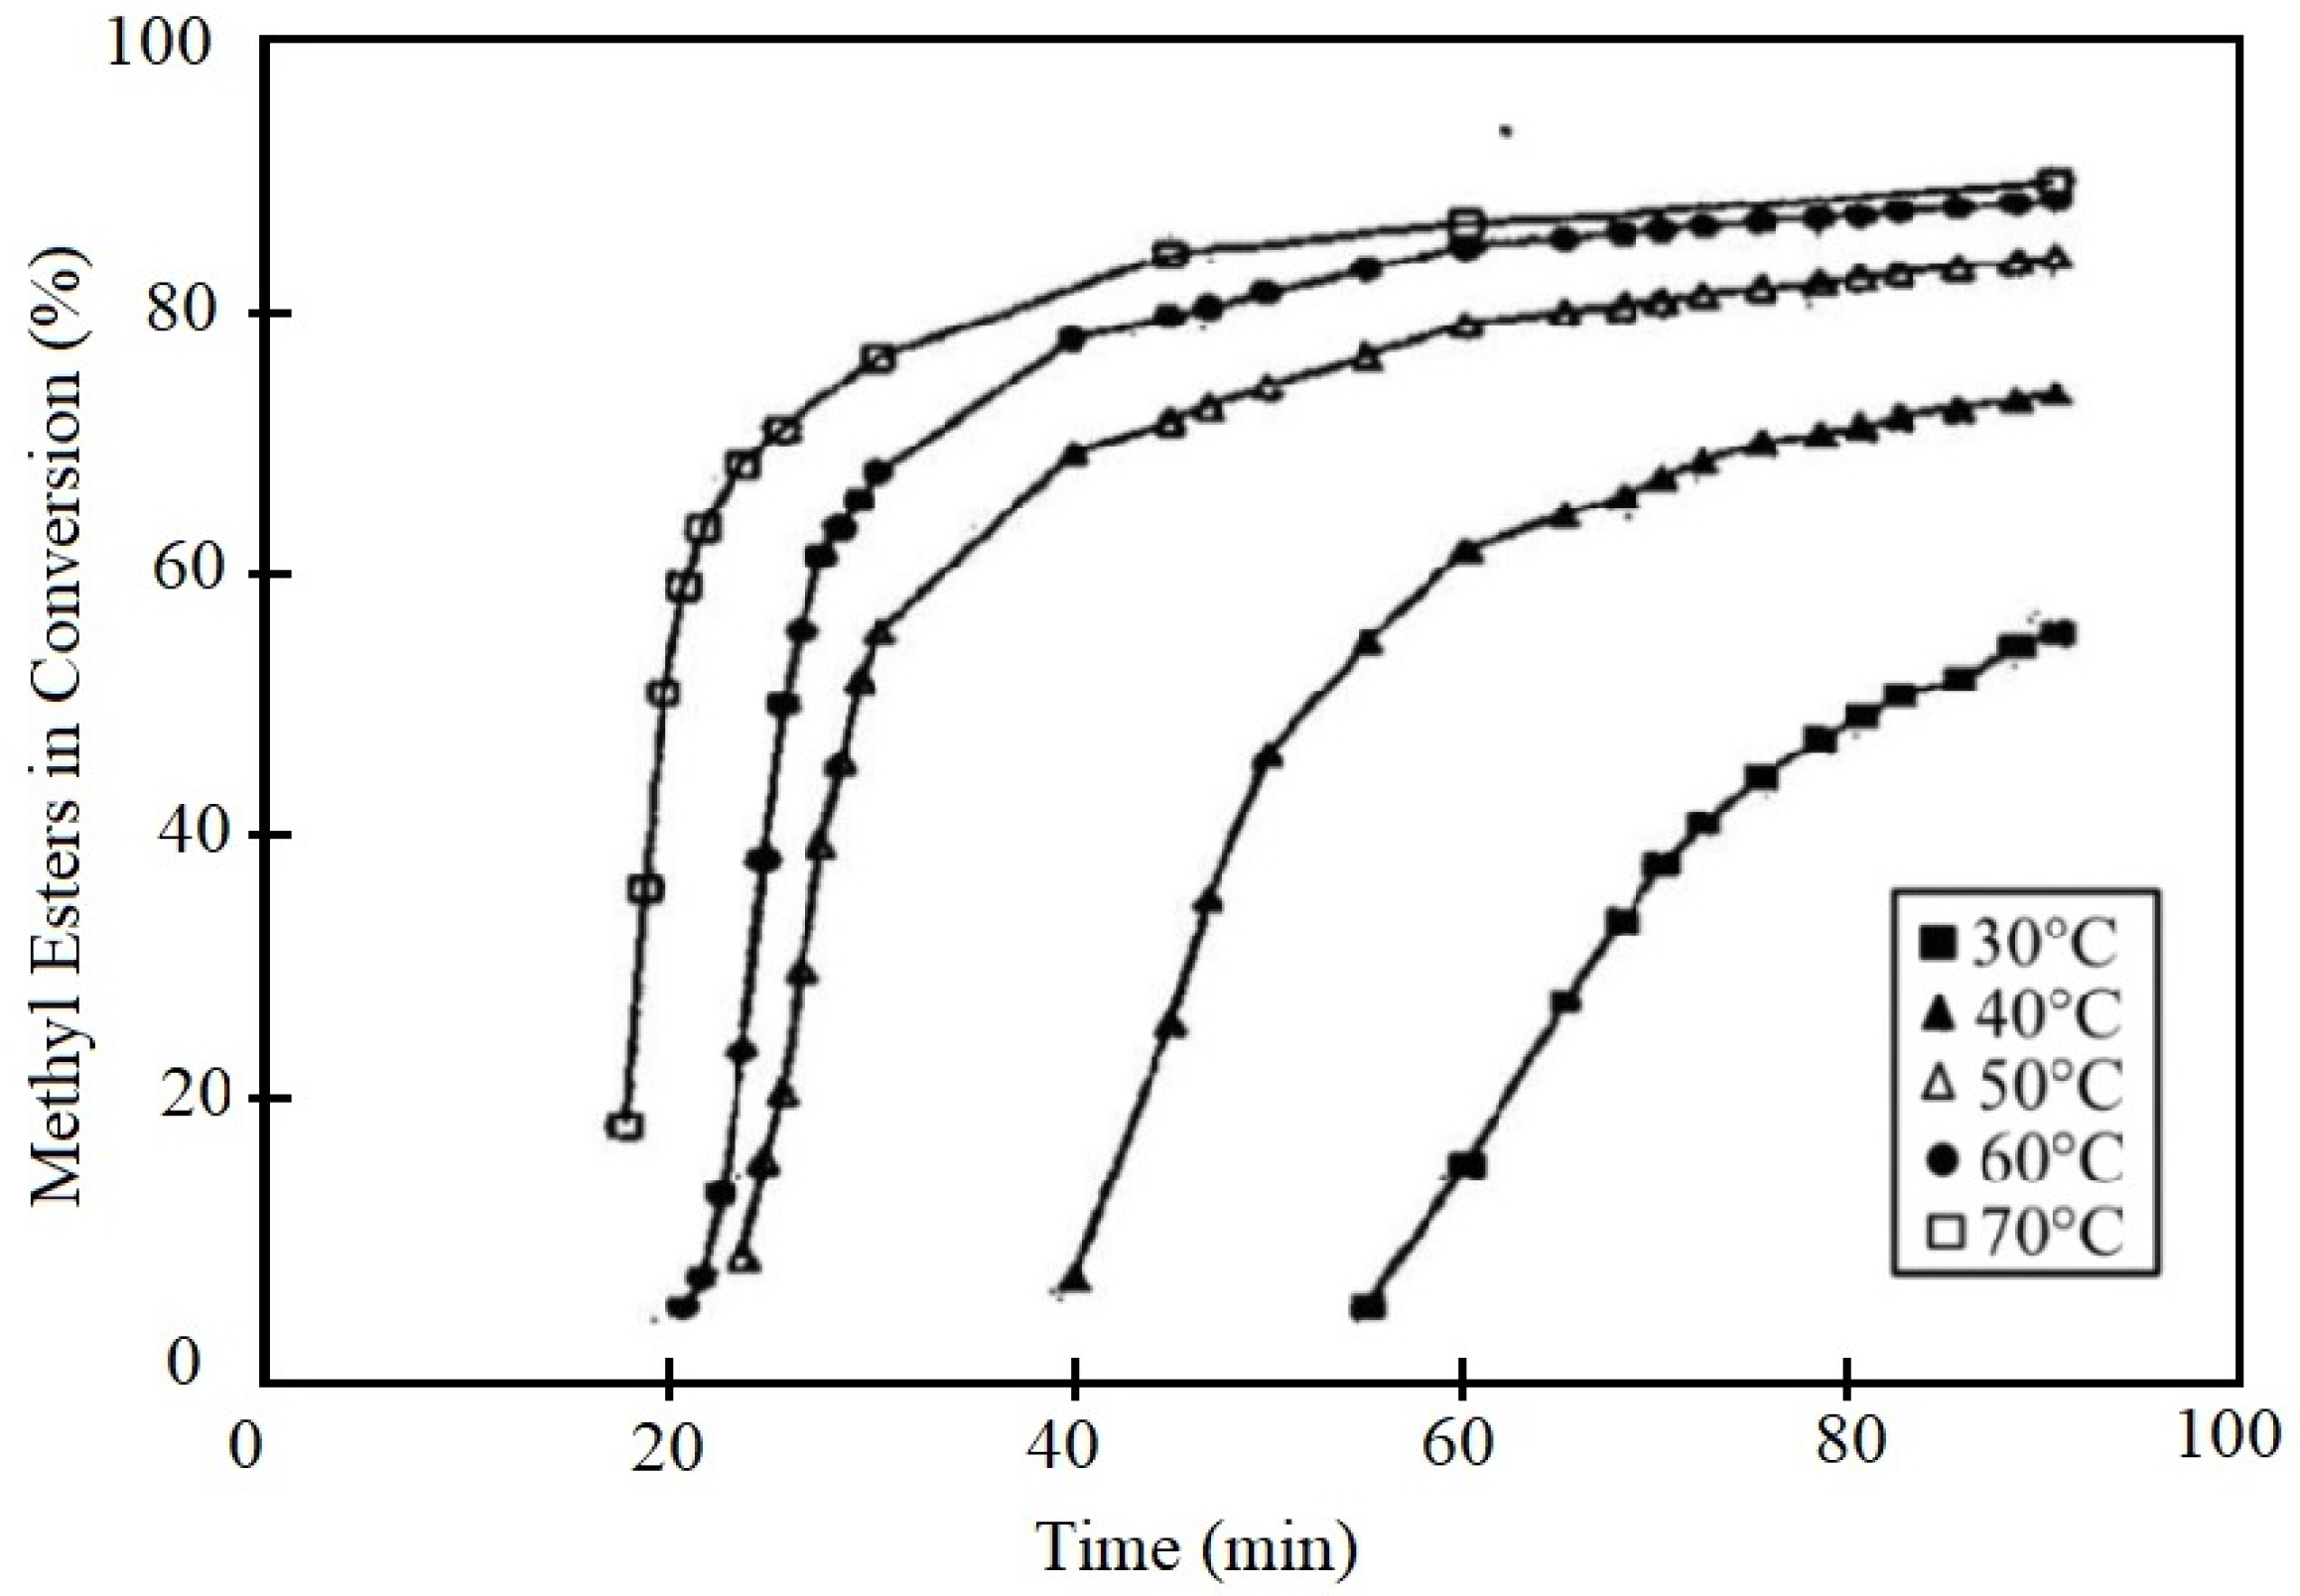
As shown, conversion time can be reduced by increasing mixing speed. In Figure 3, the percentage conversion in biodiesel is verified as a function of different temperatures in a batch reactor.
The maximum temperature of reaction depends on the boiling point of the used alcohol. In the case of methanol, the maximum temperature is 70 C. The heating and mixing systems of the reactor must be properly studied in order to ensure a uniform heating of the reactive mixture, avoid creating areas with abnormal thermal fluxes.
The aim of this work is to analyze the temperature trend inside the fluid domain of the micro batch reactor, in order to verify the heating and mixing process efficiency. In detail, different systems of reactor heating have been studied to identify the most suitable option.
The analysis refers to the heating process of vegetable oil. The temperature of the vegetable oil increases due to the thermal energy provided by an immersion heater. In particular, the ransient temperature effect is studied together with the flow field within the batch reactor, once an initial vegetable oil temperature of 20 C and a final temperature of 60 C have been chosen. The vegetable oil heating process up to 60 C is discussed in the following sections; the chemical reaction of transesterification has not been implemented in the simulation scenario, since the reaction only starts once methanol and catalyst are added into the system. Transesterification effects on the fluid domain properties will be analysed in further works.
2. Materials and Methods
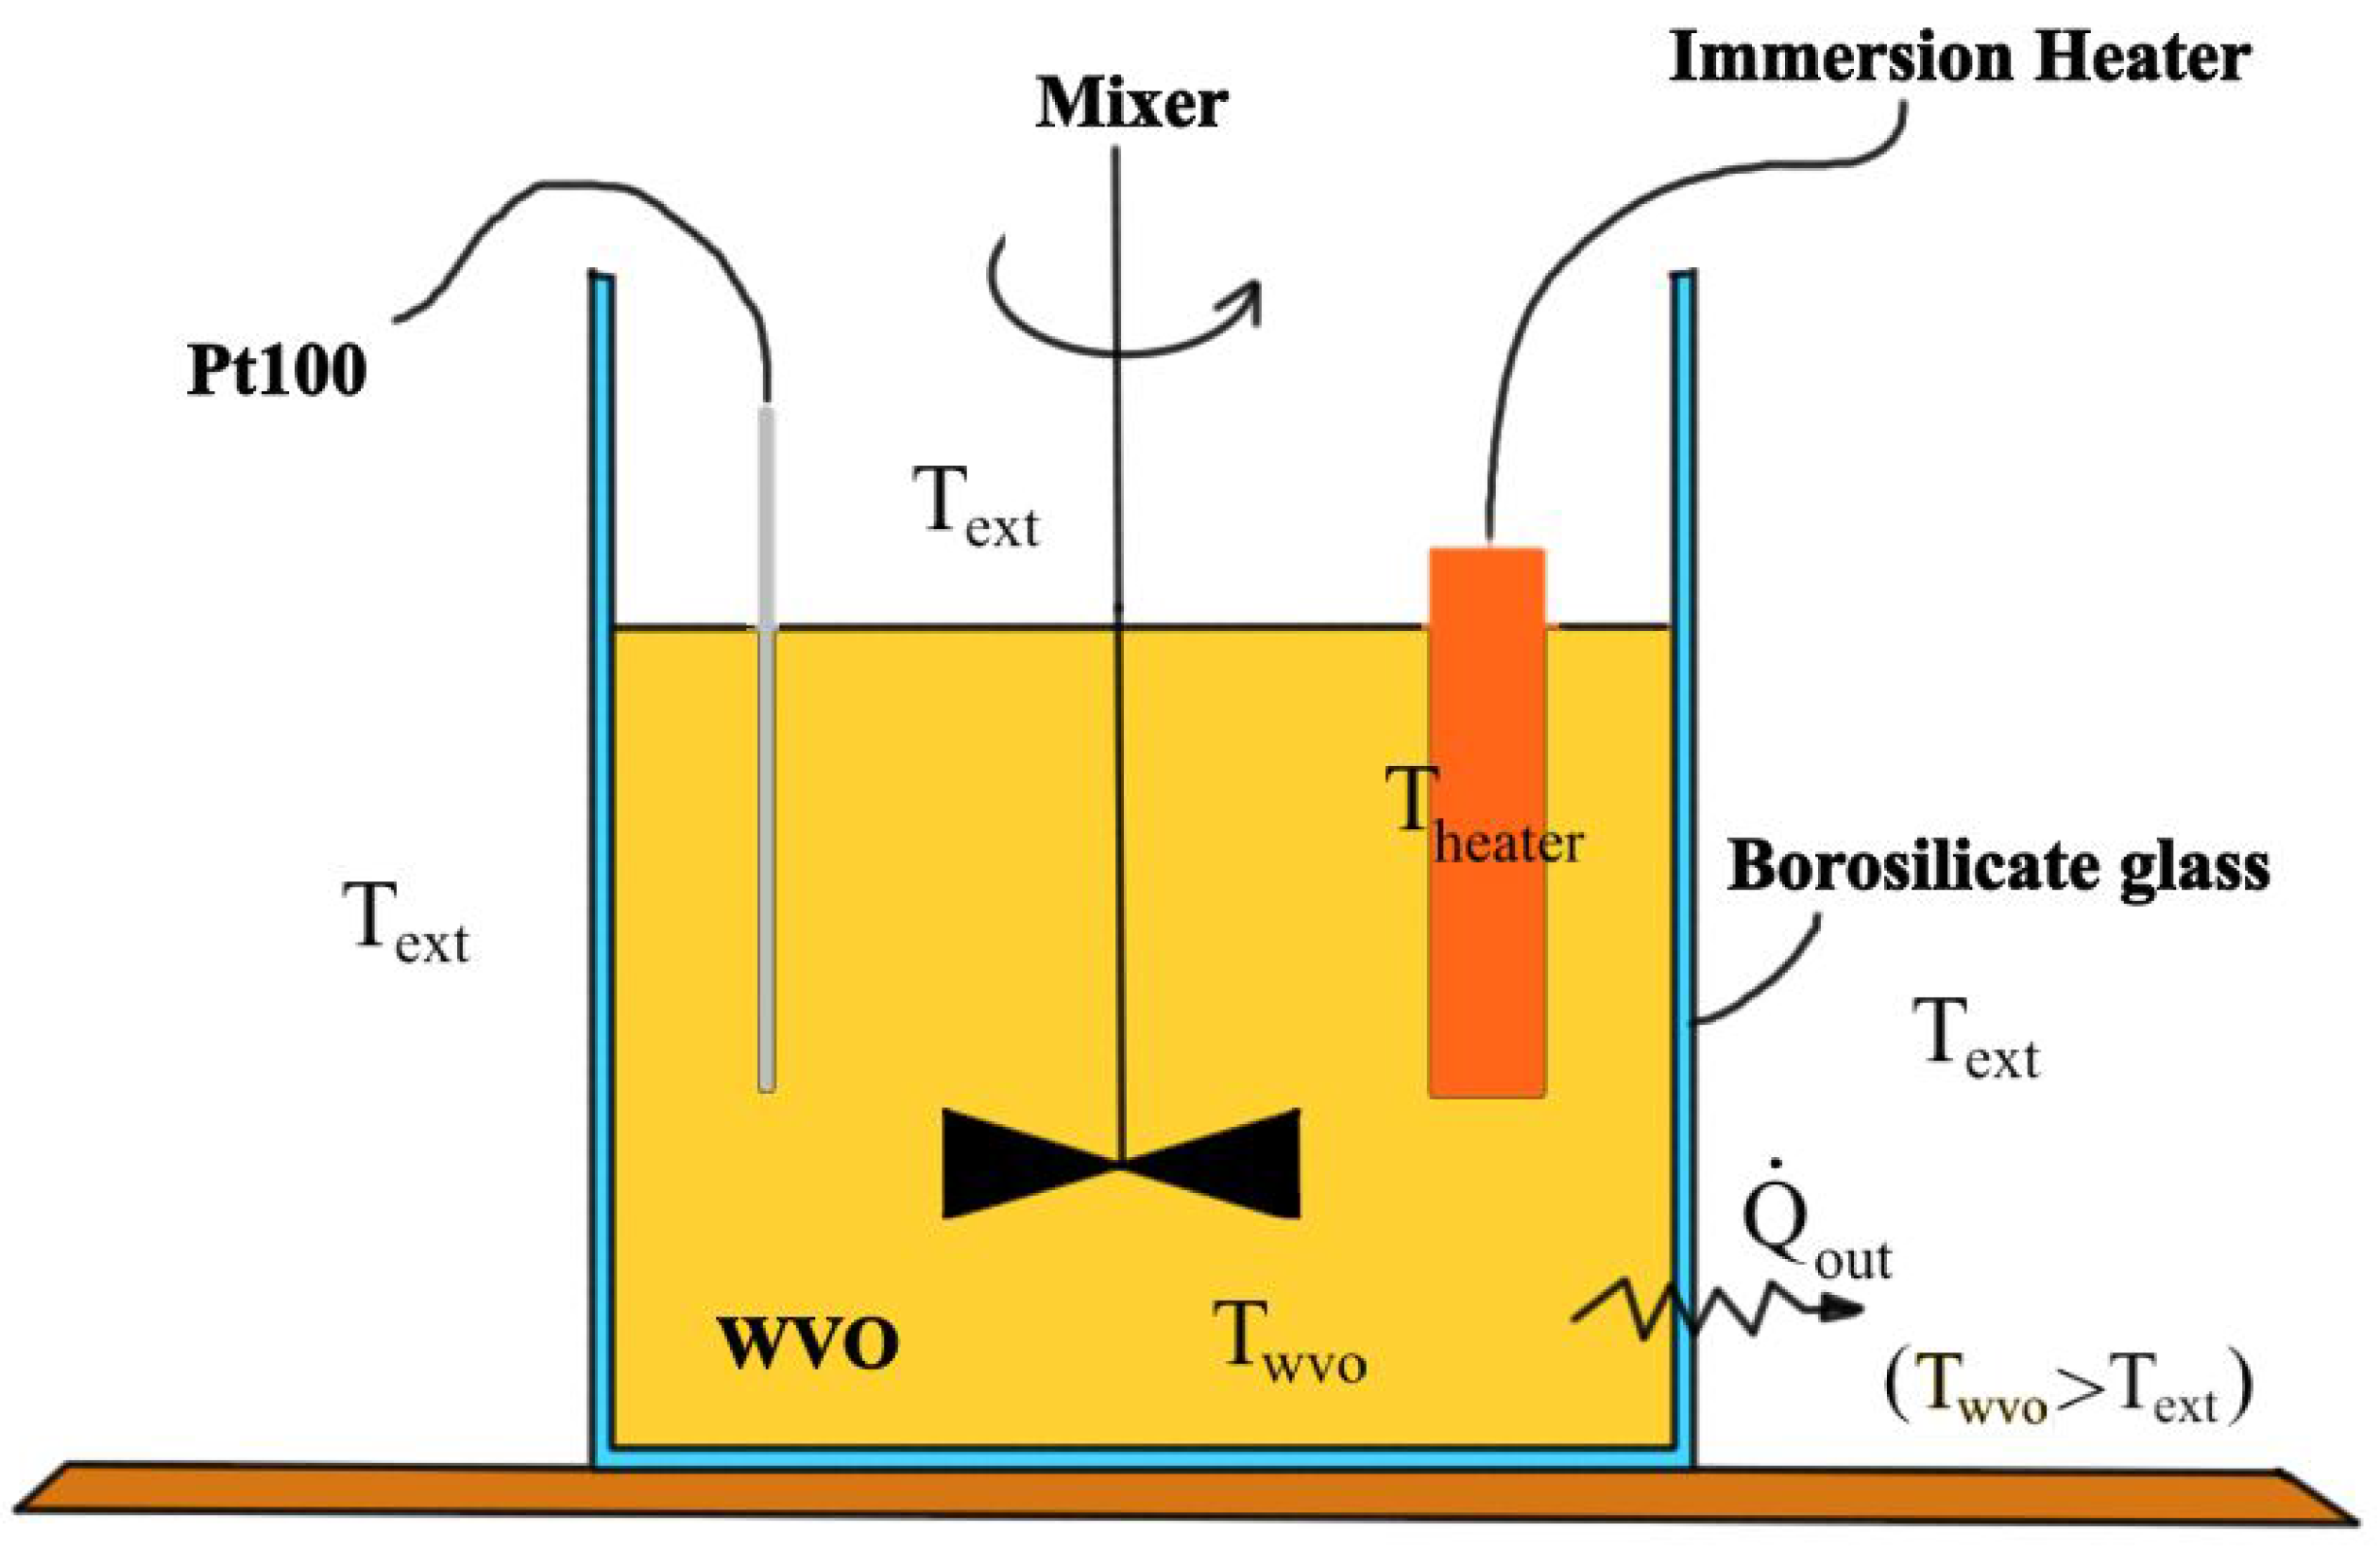
An experimental campaign has been conducted to analyze the heating system efficiency within a 0.1 L capacity batch micro reactor. A schematic view of the experiment configuration is available in Figure 4. An immersion heater—consisting of a resistence subjected to the Joule effect—provides an increasing temperature inside the fluid domain. Results from the simulation scenarios will be used to optimize heat transfer within the mini reactor.
A constant temperature boundary condition has been forced around the heater’s outer limit. This allowed us to avoid computing conductive heat flux through the immersion resistence domain. The solid wall material is borosilicate glass. Its initialized properties were density, heat capacity at constant pressure and conductivity, equal to 2.23 g/cm, 830 J/(kg·K) and 1.4 W/(m·K) respectively.
Therefore, in this work, a temperature field within a batch micro-reactor is discussed in order to verify an immersion resistence heating system efficiency. The fluid domain consists of dehydrated waste cooking oil. The simulation scenario represents the heating process of the waste cooking oil. Comsol Multiphysics v5.3 (CM) has been used to develop a finite element analysis. The CM interface has been particularly suitable for this kind of engineering applications [20]. The transesterification reaction has not been taken into account in the current simulation scenario, but its implementation will be considered in future works to analyse chemical composition changes while a reaction takes place.
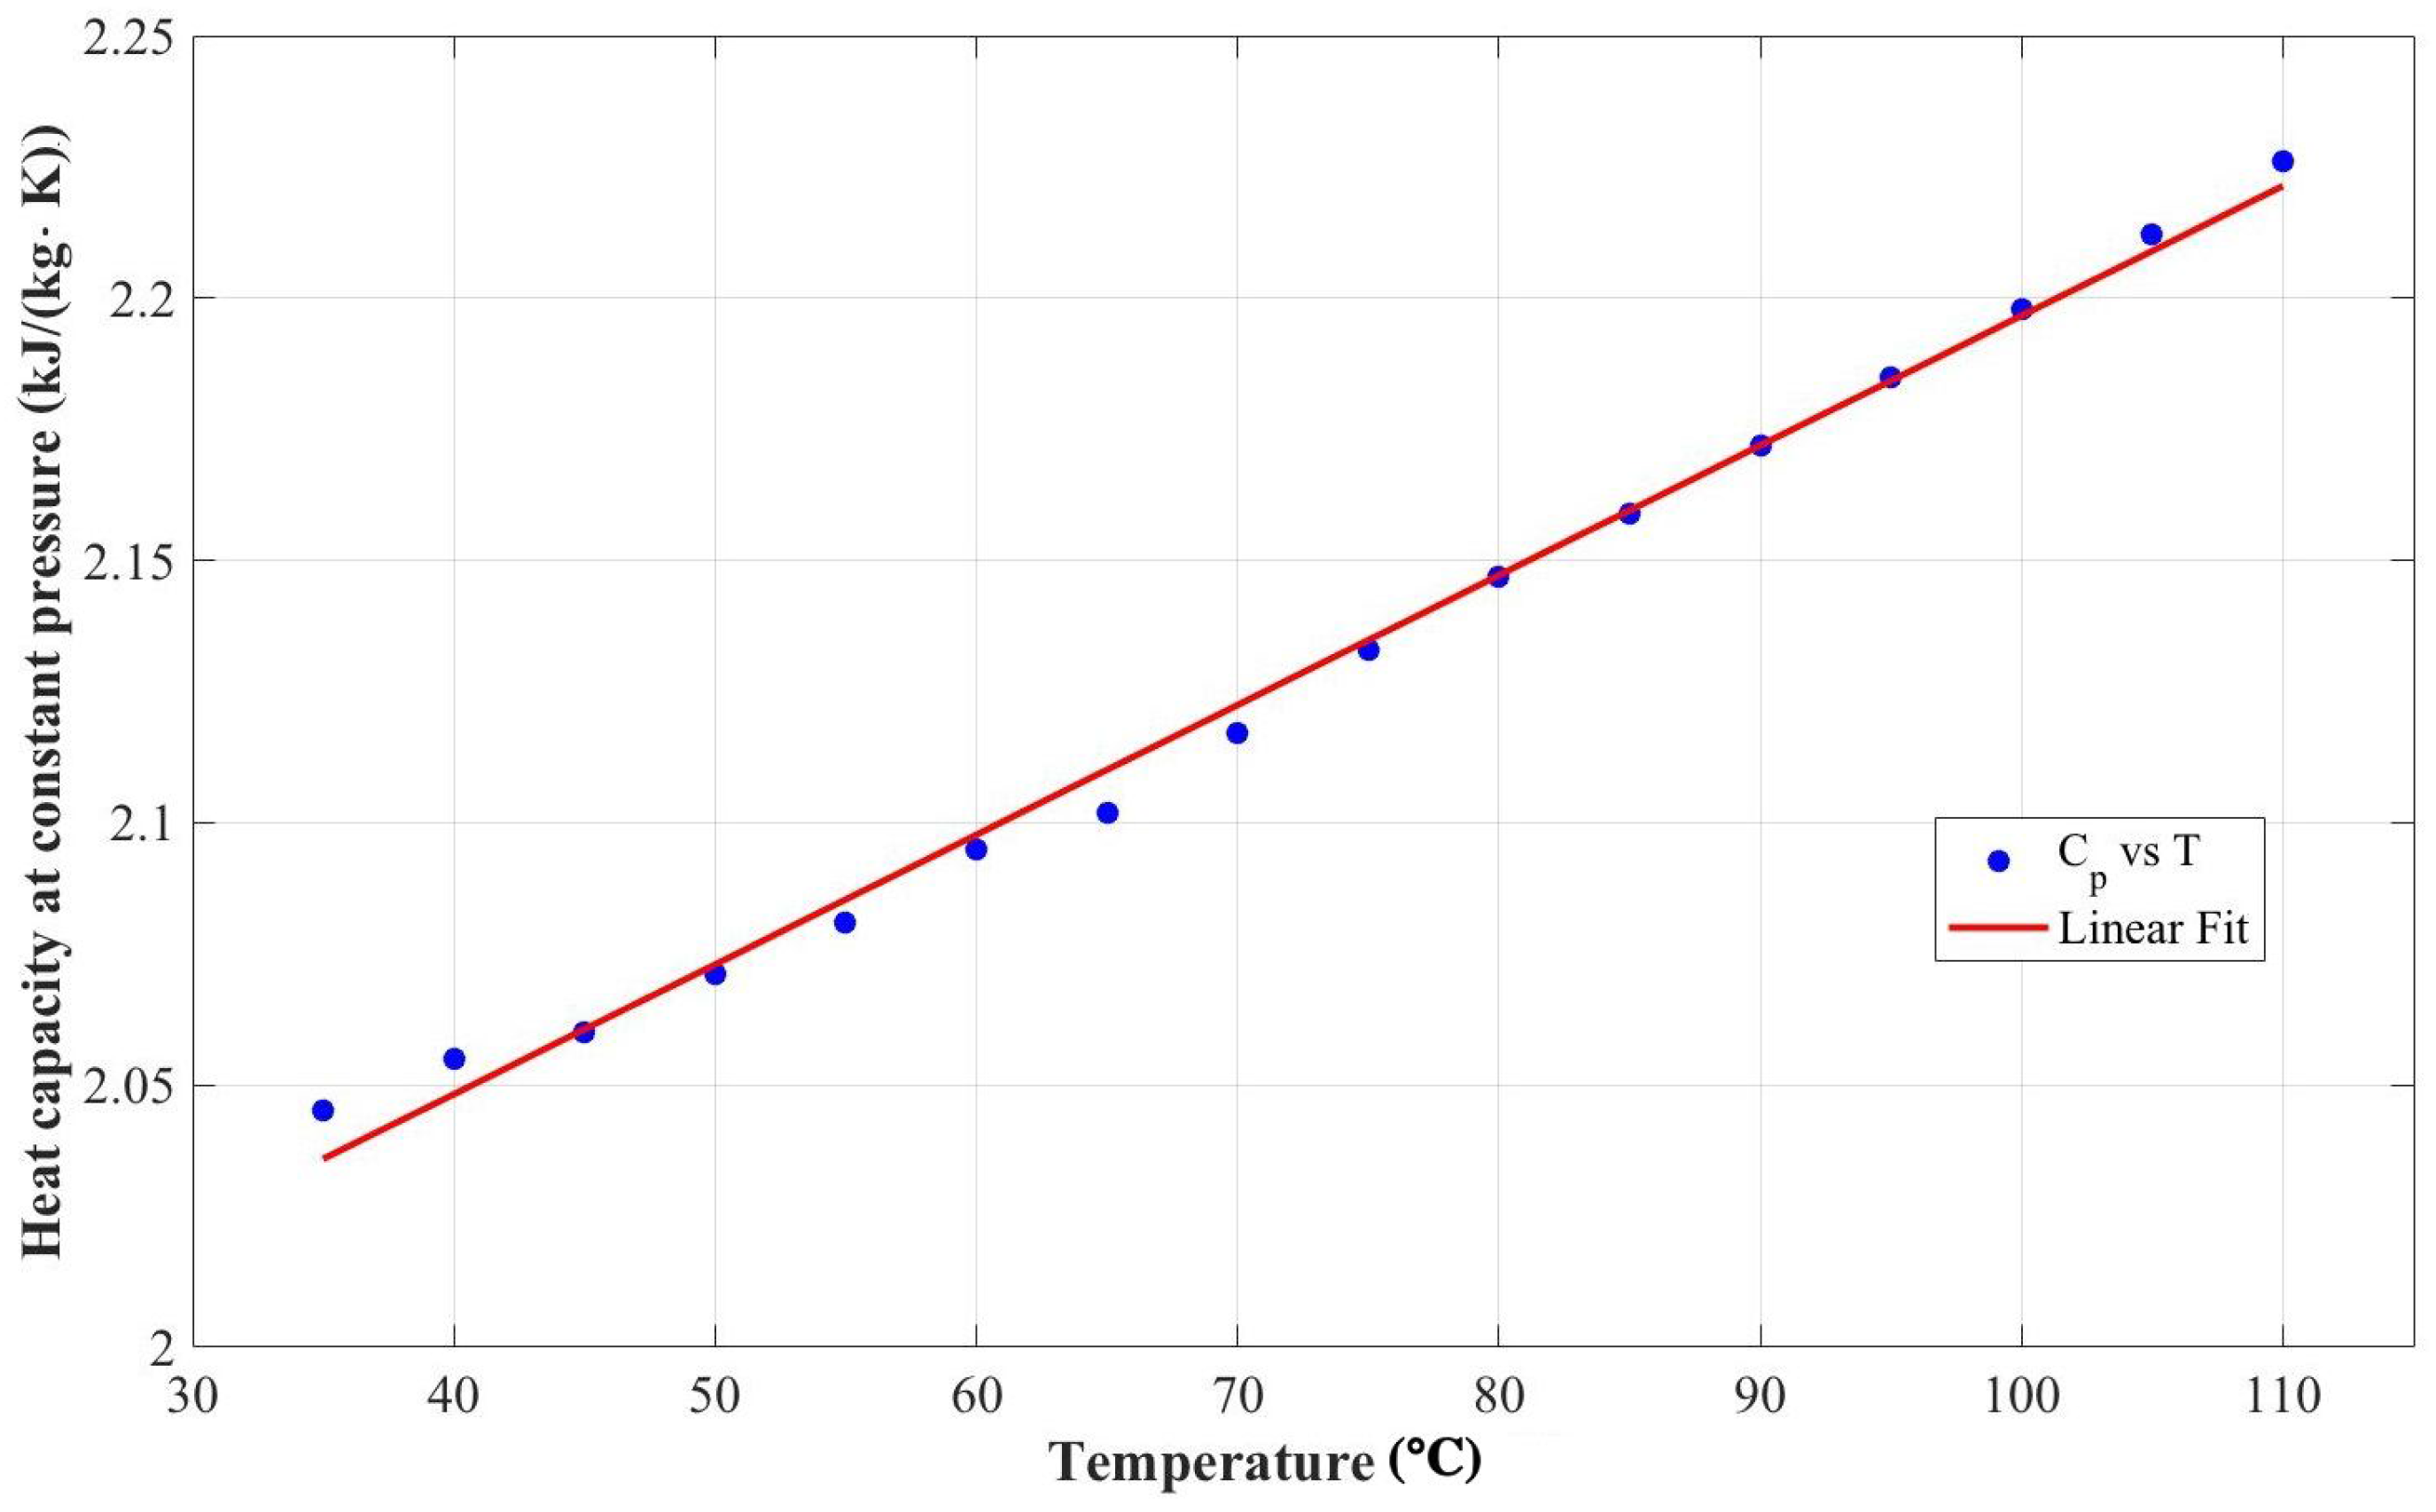
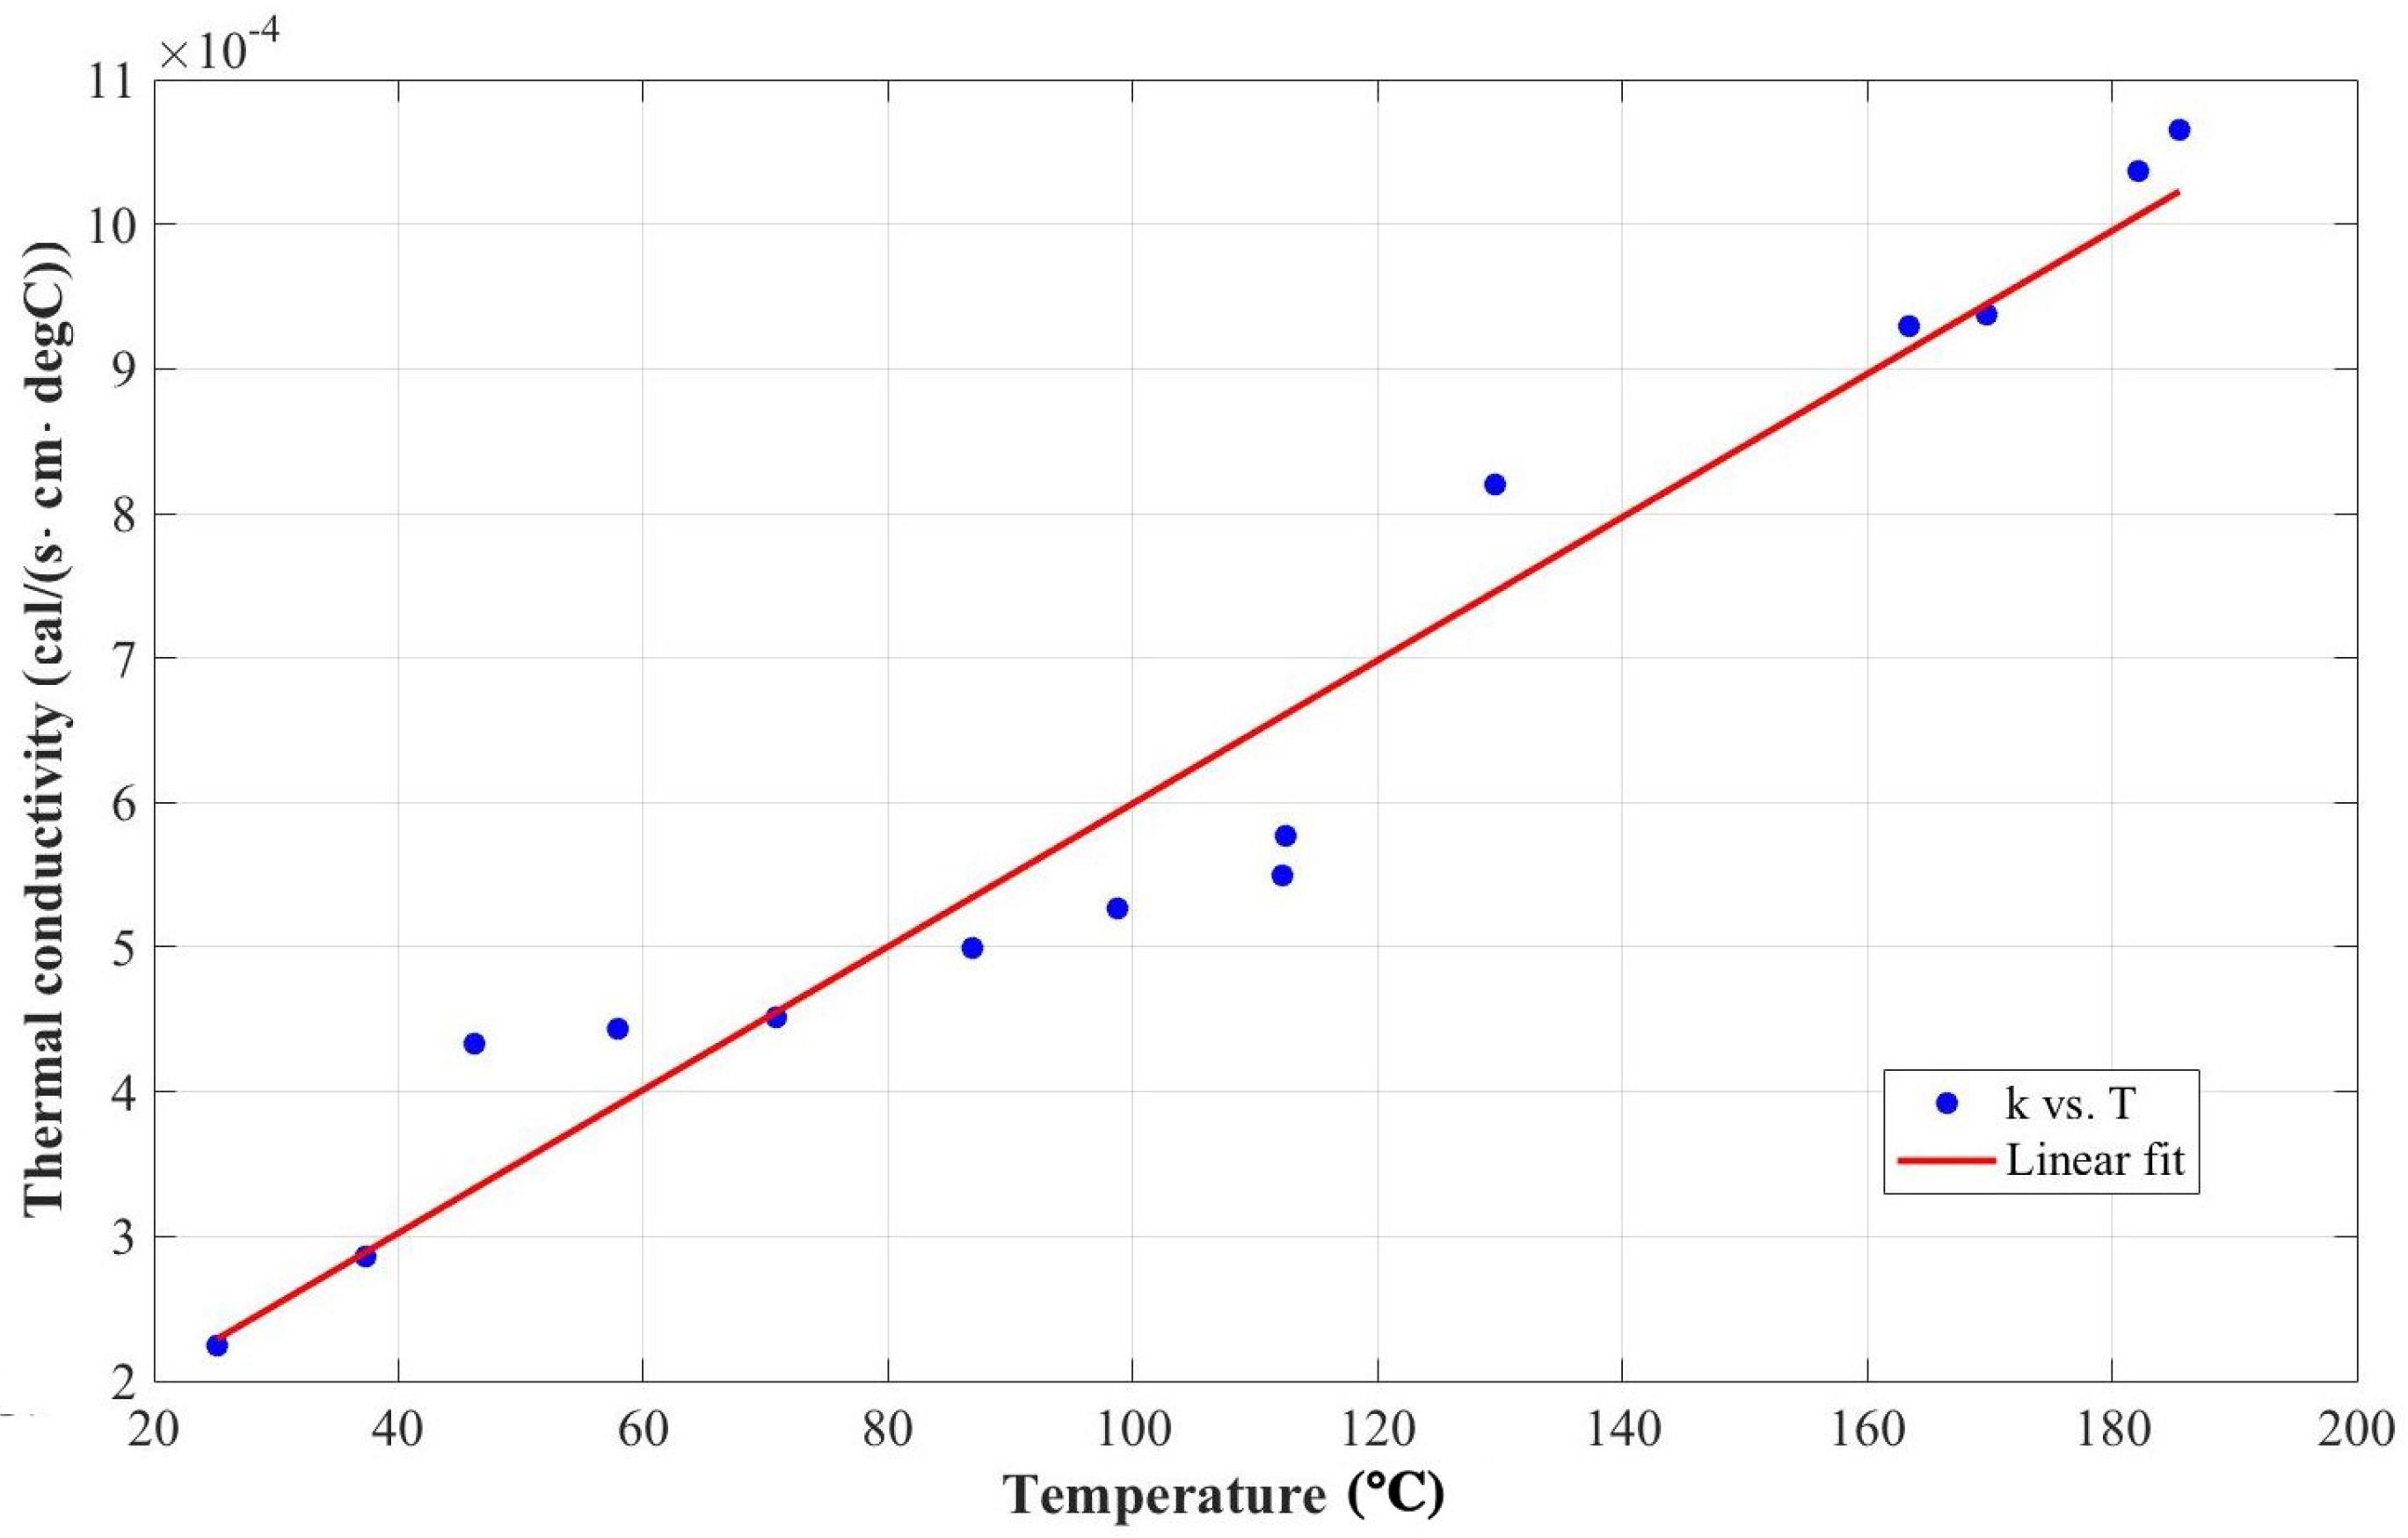
As discussed by the authors in [21,22,23,24,25], raw material needs to be characterized in terms of physical parameters [26]. Peanut oil properties, that is density (Table 2), heat capacity at constant pressure (Table 3), kinematic viscosity (Table 4) and thermal conductivity (Figure 5) have been initialized into the simulation scenario to reach the real flow field.
To analyze heat capacity and density values in relation to different peanut oil temperatures (refer to Table 3 and Table 5), linear fitting should be a good way to describe both and analytically, as shown by values distribution in Figure 5 and Figure 6.
Computed fitting function for has been:
while for the thermal conductivity k has been used:
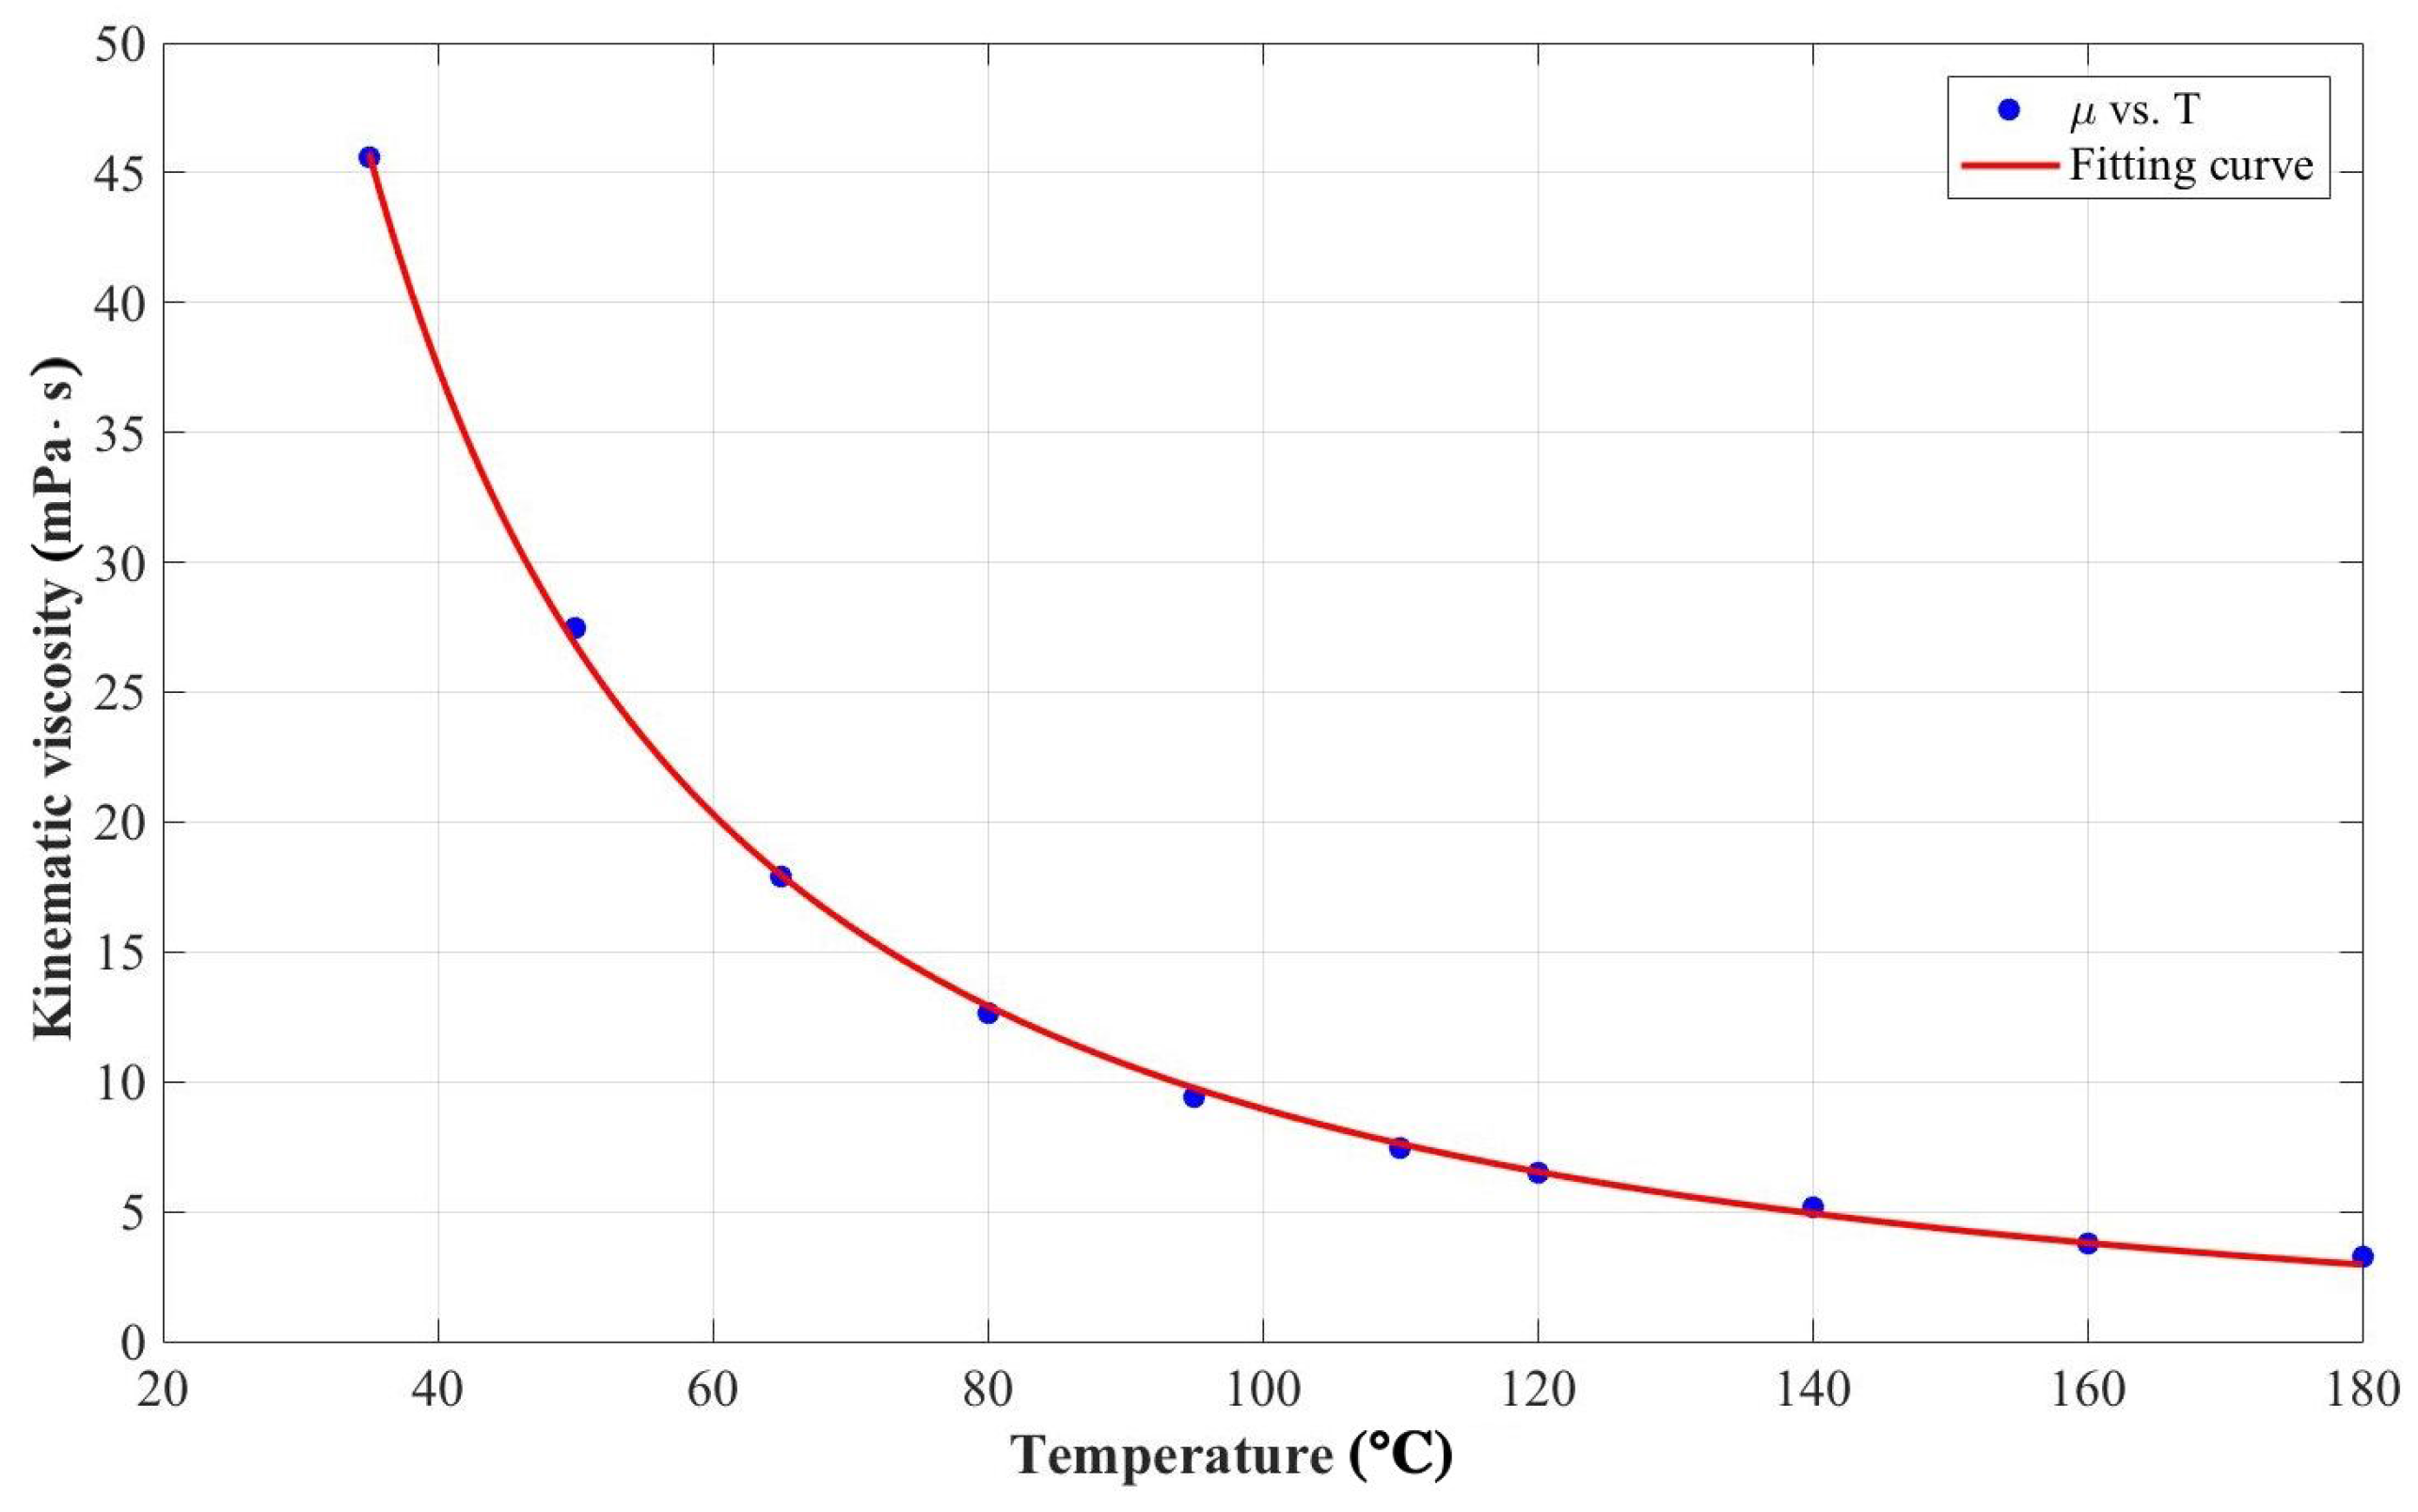
To describe the temperature dependence of kinematic viscosity, a polynomial has been used in order to fit experimental data distribution in Table 4. Thus, the following equation has been implemented in the simulation scenario:
Polynomial fitting result is shown in Figure 7.
Fitting coefficients are given in Table 6.
Both Navier-Stokes equations and energy balance have been solved to compute flow and temperature field respectively. The mathematical representation of the discussed scenario can be summerized by Equations (4)–(6):
where:
- is the fluid density, expressed in kg/m;
- is the velocity vector, expressed in m/s;
- p is the pressure, expressed in Pa;
- is the viscous stress tensor, expressed in Pa;
- is the volume forces vector, expressed in N/m;
- is the heat capacity at constant pressure, expressed in J/(kg·K);
- T is the absolute temperature, expressed in K;
- is the heat flux vector, expressed in W/m;
- Q contains all the heat sources, expressed in W/m;
- is the stress ratio tensor, defined as:
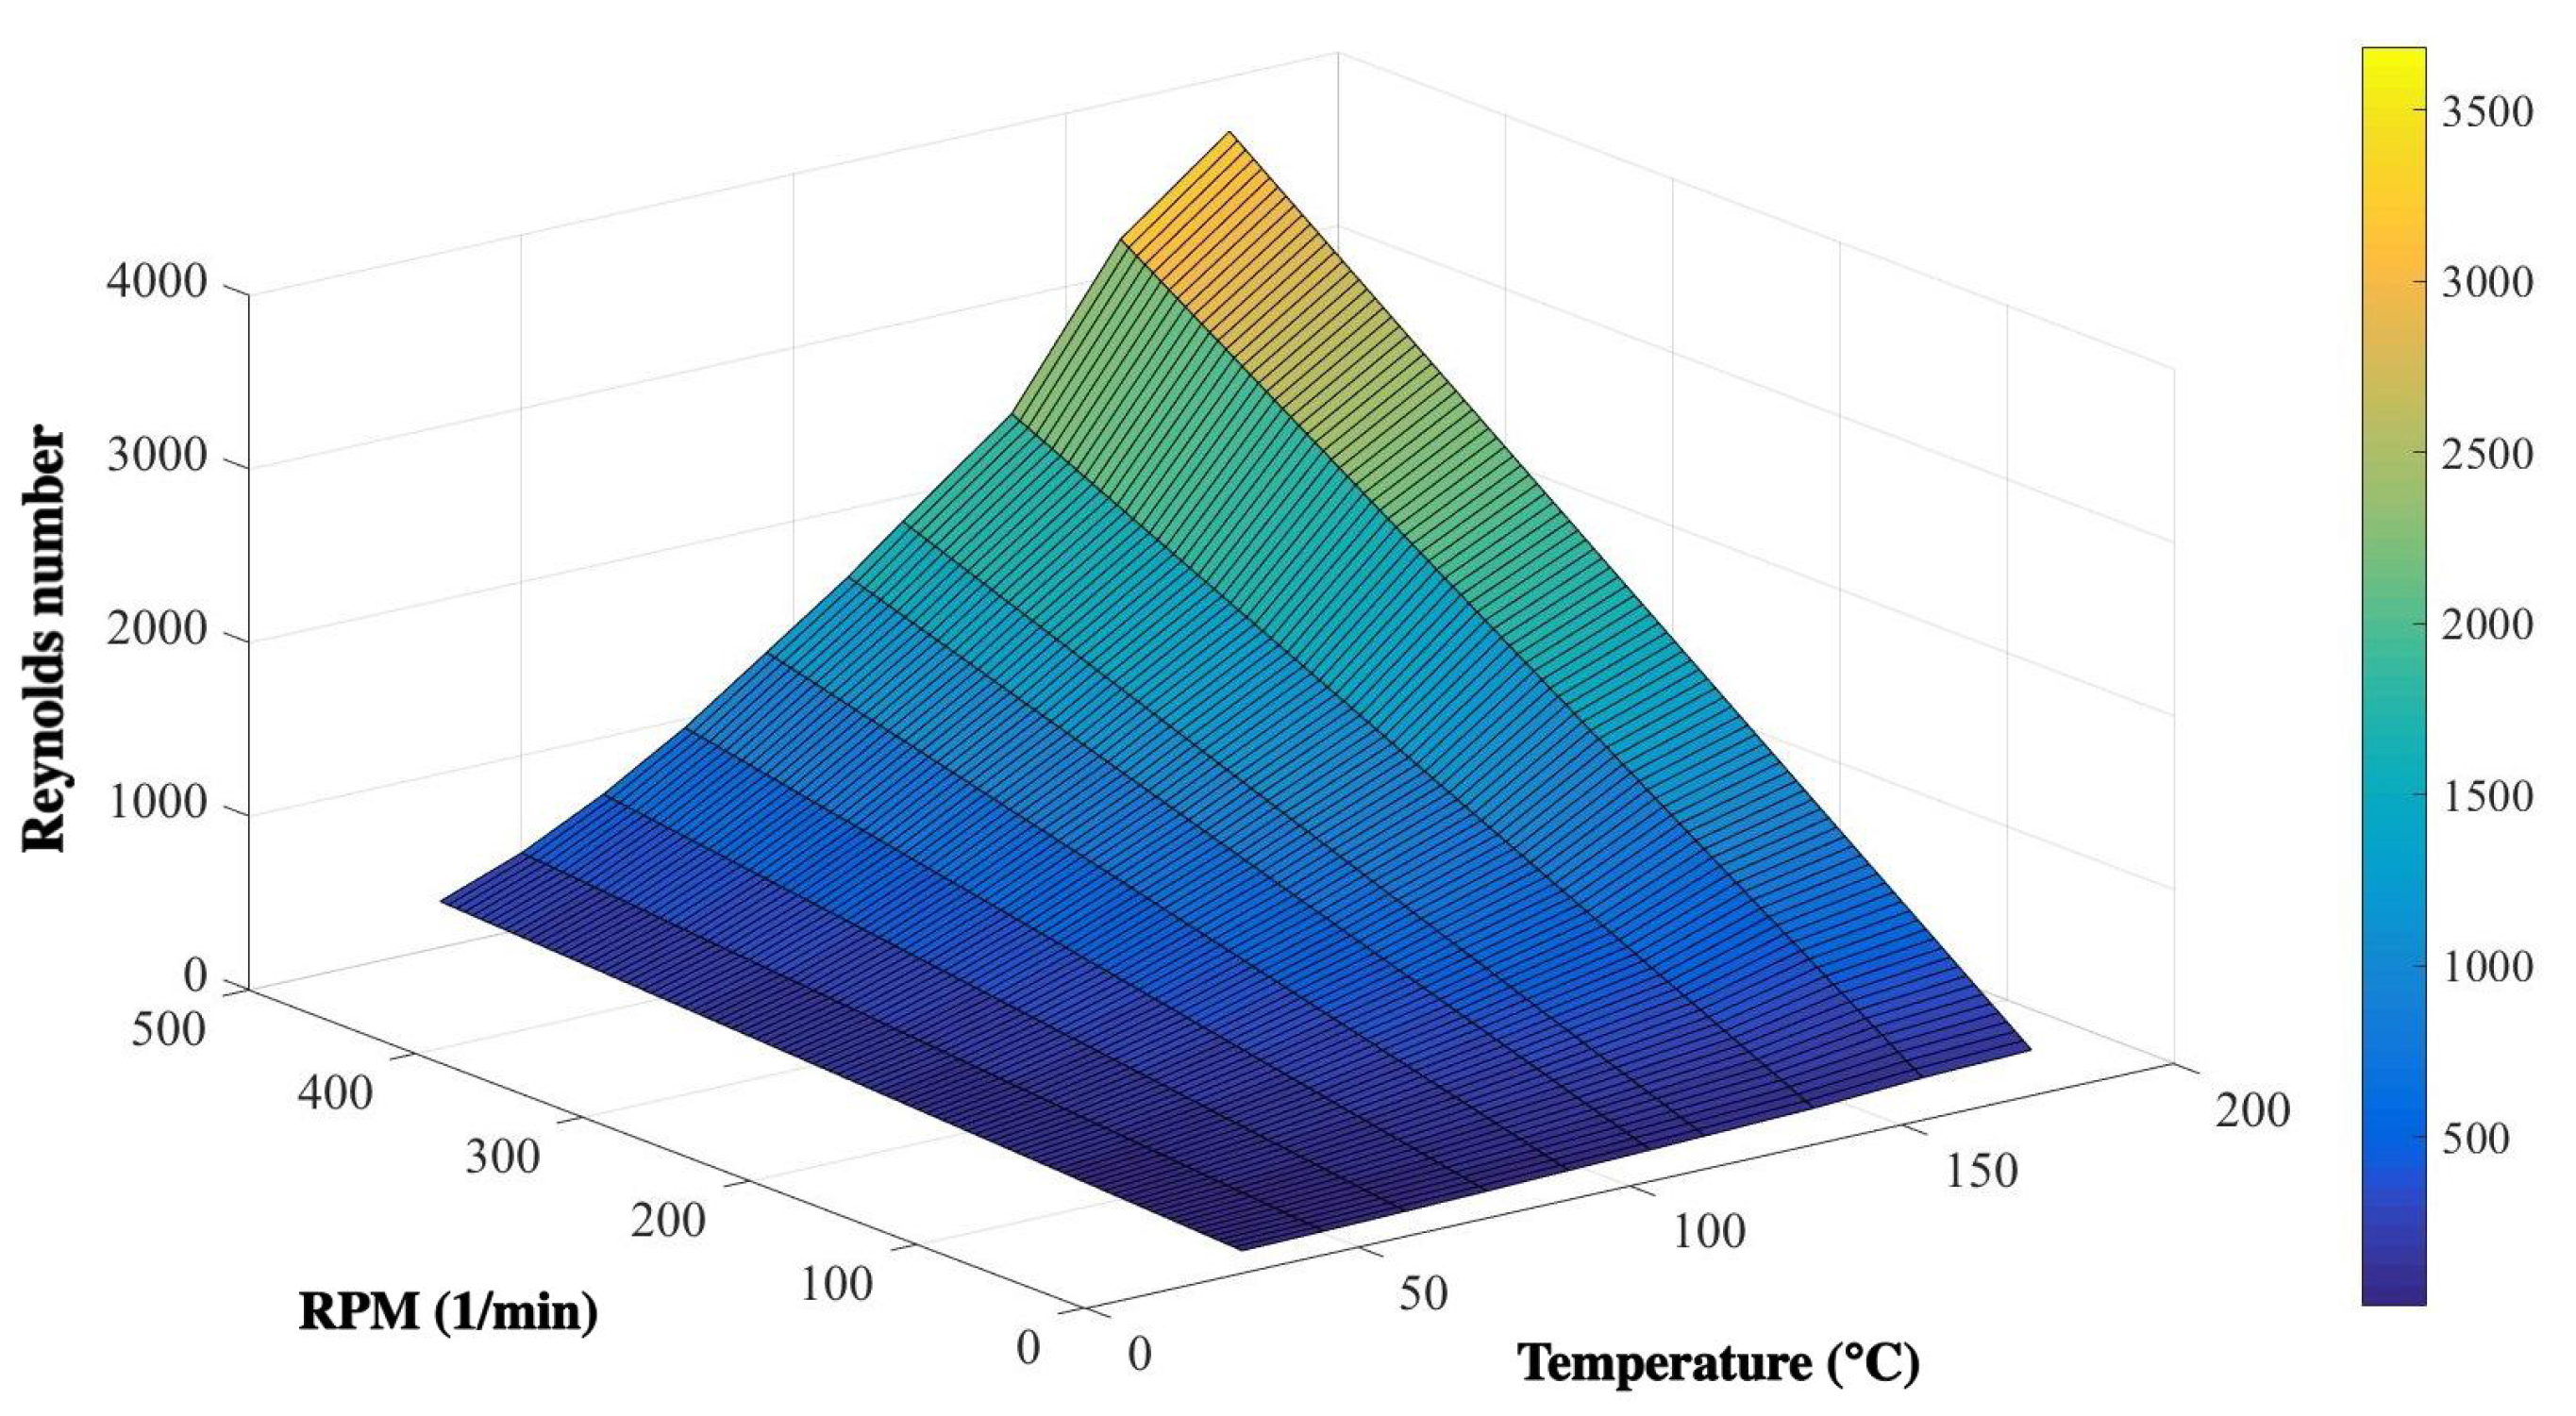
Because of the minimal density change around the considered temperature range, fluid density is considered to be constant and equal to 937.5 kg/m, as discussed by authors in [16,30]. In this way, the flow regime has been defined by using the Reynolds number, given from:
where N (expressed in rps) and (expressed in m) are the mixing speed and the diameter of the impeller respectively, is the fluid density and its kinematic viscosity. The dimensionless parameter described by Equation (8) has been computed using geometrical and operating conditions of the laboratory reacting system, available in Table 7.
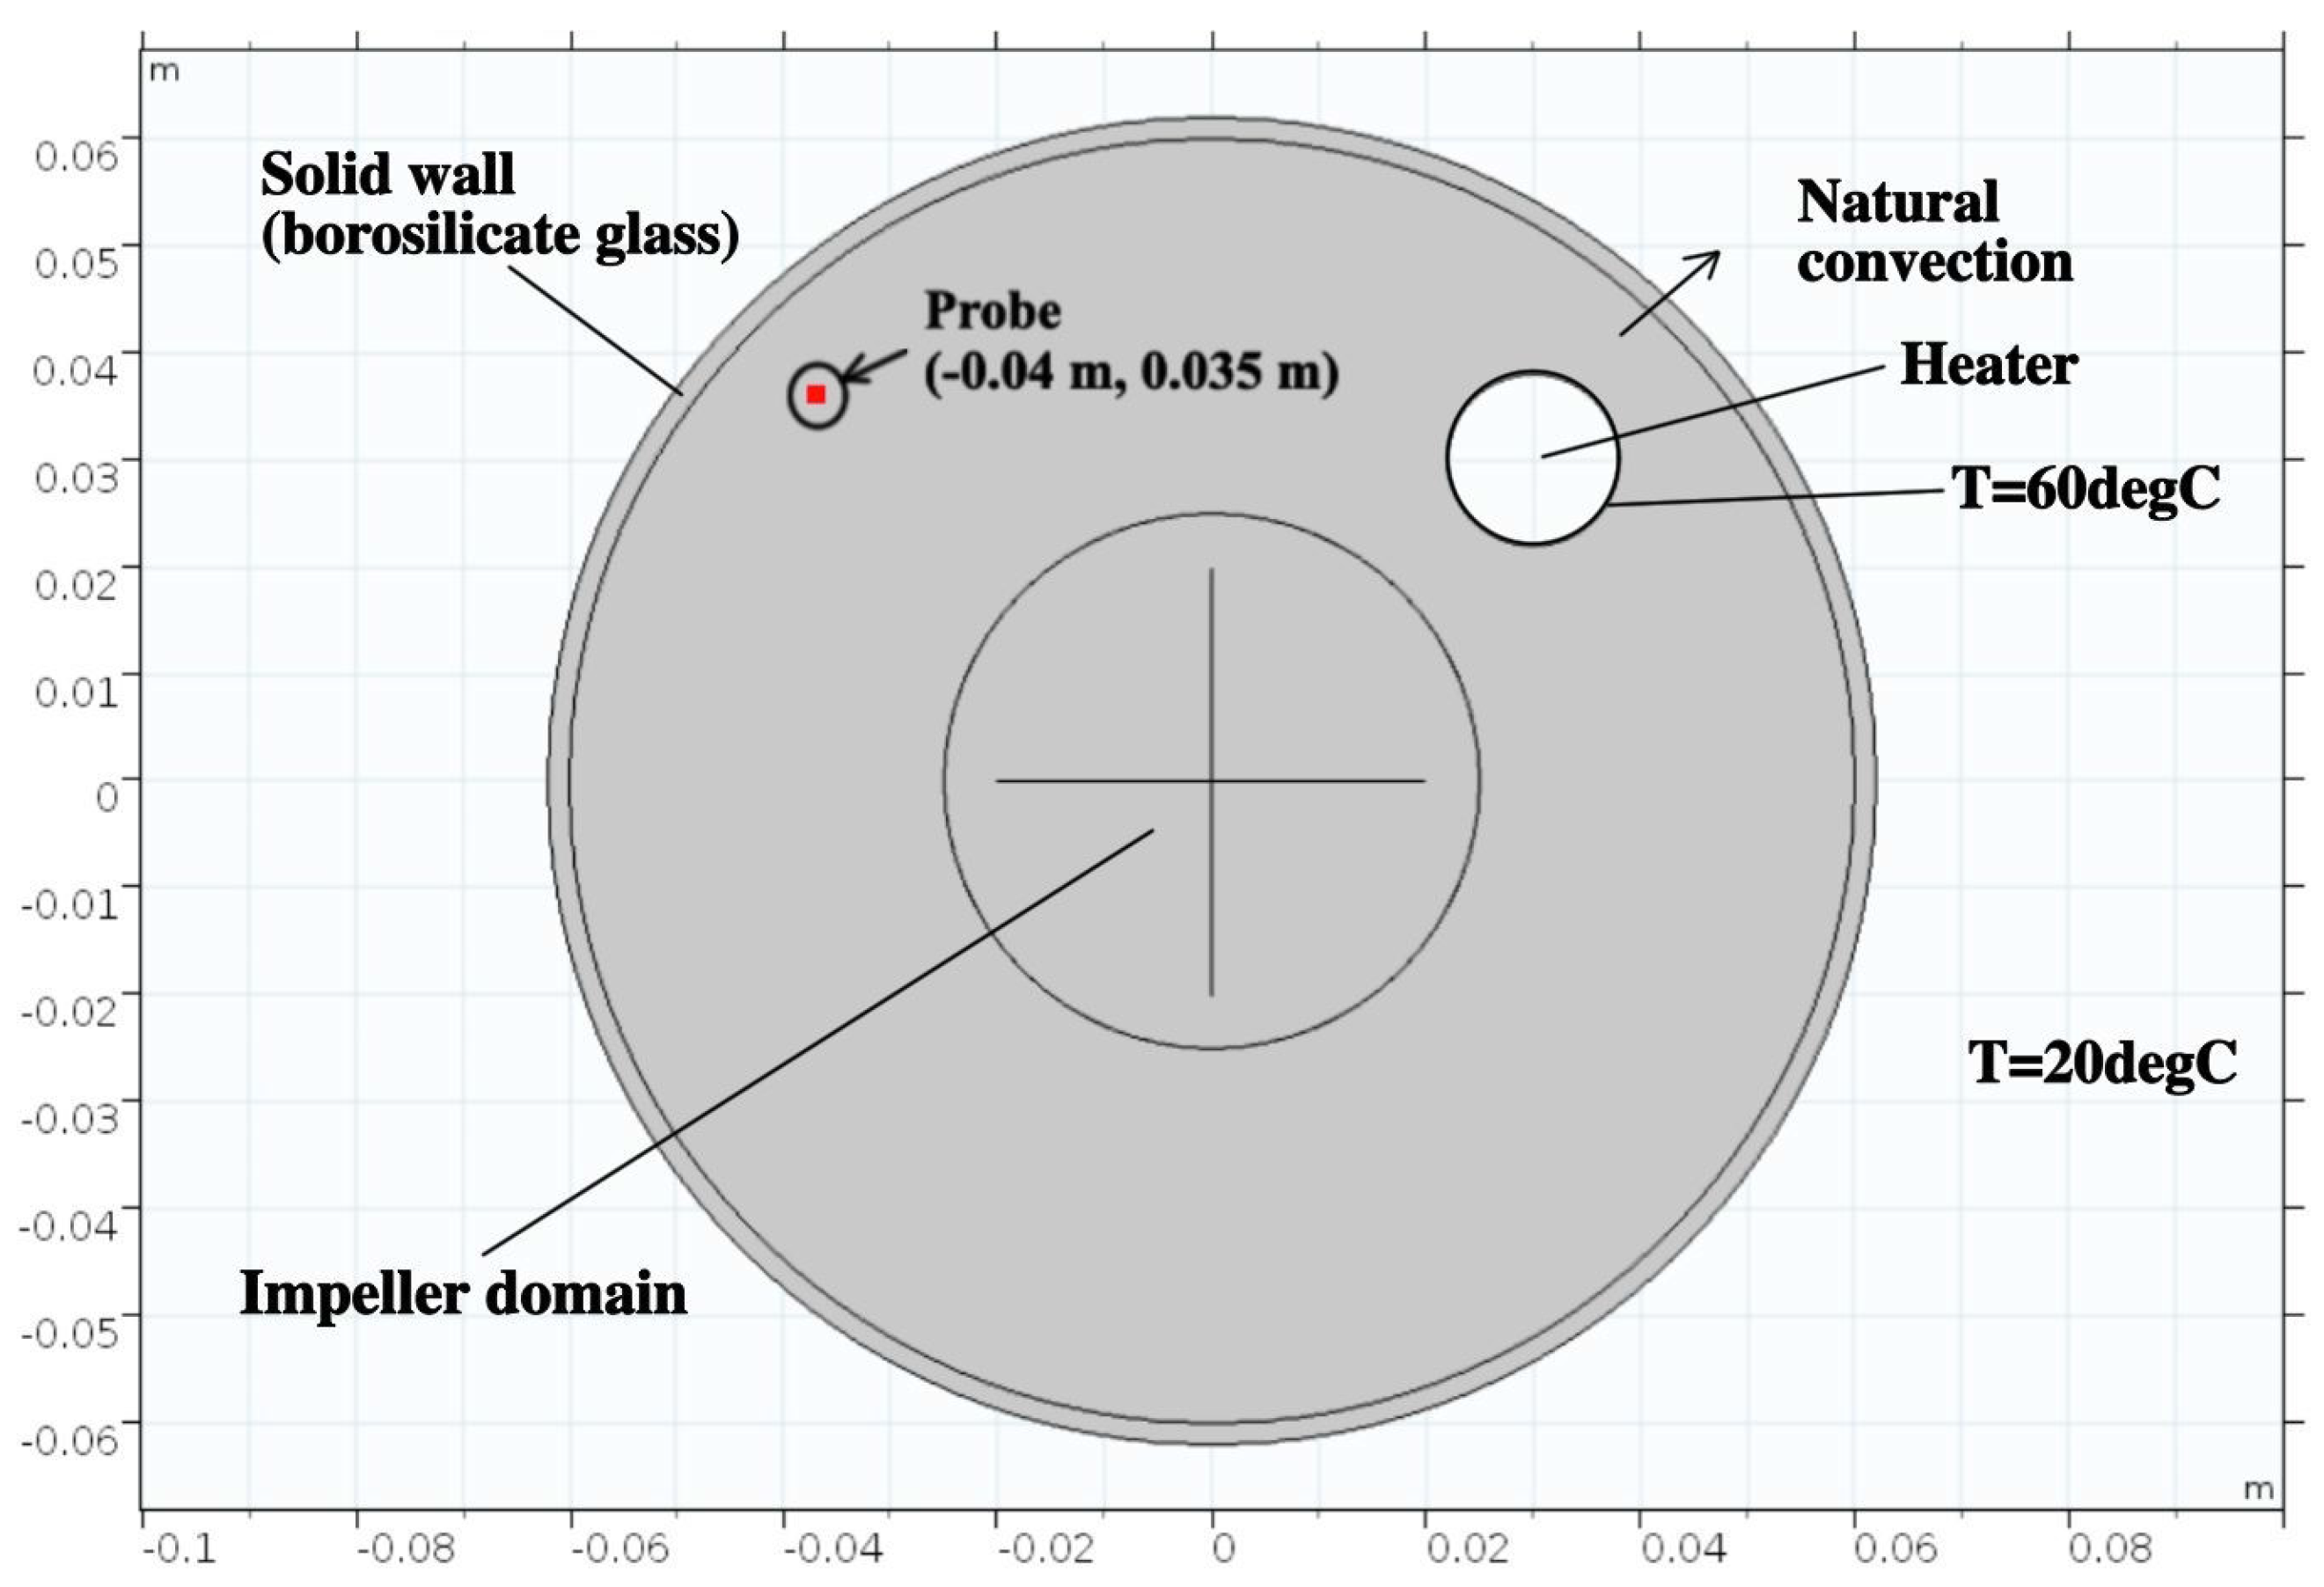
The previous analysis led to results in Figure 8 and they show how—for the analyzed ranges—the flow field can be considered as laminar [31]. Therefore, no turbulence model has been implemented for the simulation scenarios. Considering typical operation parameters used to reach an optimized conversion from WVO to BD, micro-reactor mixing speed has been studied from 40 rpm to 420 rpm. To complete the thermal and CFD [32] analysis it was necessary to simulate the reaching of a quasi-steady state regime. Once scalar quantities are characterized by very slow and soft fluctuations in time, a quasi-steady state regime is typically achieved. For that reason, a frozen-rotor (FR) study type has been implemented in Comsol. It can be considered as a very good starting point to conduct a transient analysis, since FR results are often used as initial conditions for time-dependent studies [31,33]. In order to simplify the simulation scenario, a 2D schematic representation has been implemented as geometric domain (Figure 9), to solve using Comsol Multiphysics. A probe has been placed near solid walls as described in Figure 4 and Figure 9, to plot temperature value within the fluid domain. The laboratory configuration of the micro match reactor also includes a Resistence Temperature Detector (RTD); in particular, a Pt100 has been placed within the fluid domain to check reaction temperature while transesterification occurs. Since waste vegetable oil temperature is higher than the external one (referring to the environmental temperature, that is 20 C), a convective thermal flux is established between the fluid domain and the environment. A conductive thermal flux through the solid walls has been taken into account. Conduction through the immersion heater has been neglected, because its outer surface has a constant temperature. RTD presence has been also neglected because of its thickness with respect to the other domain components.
3. Results
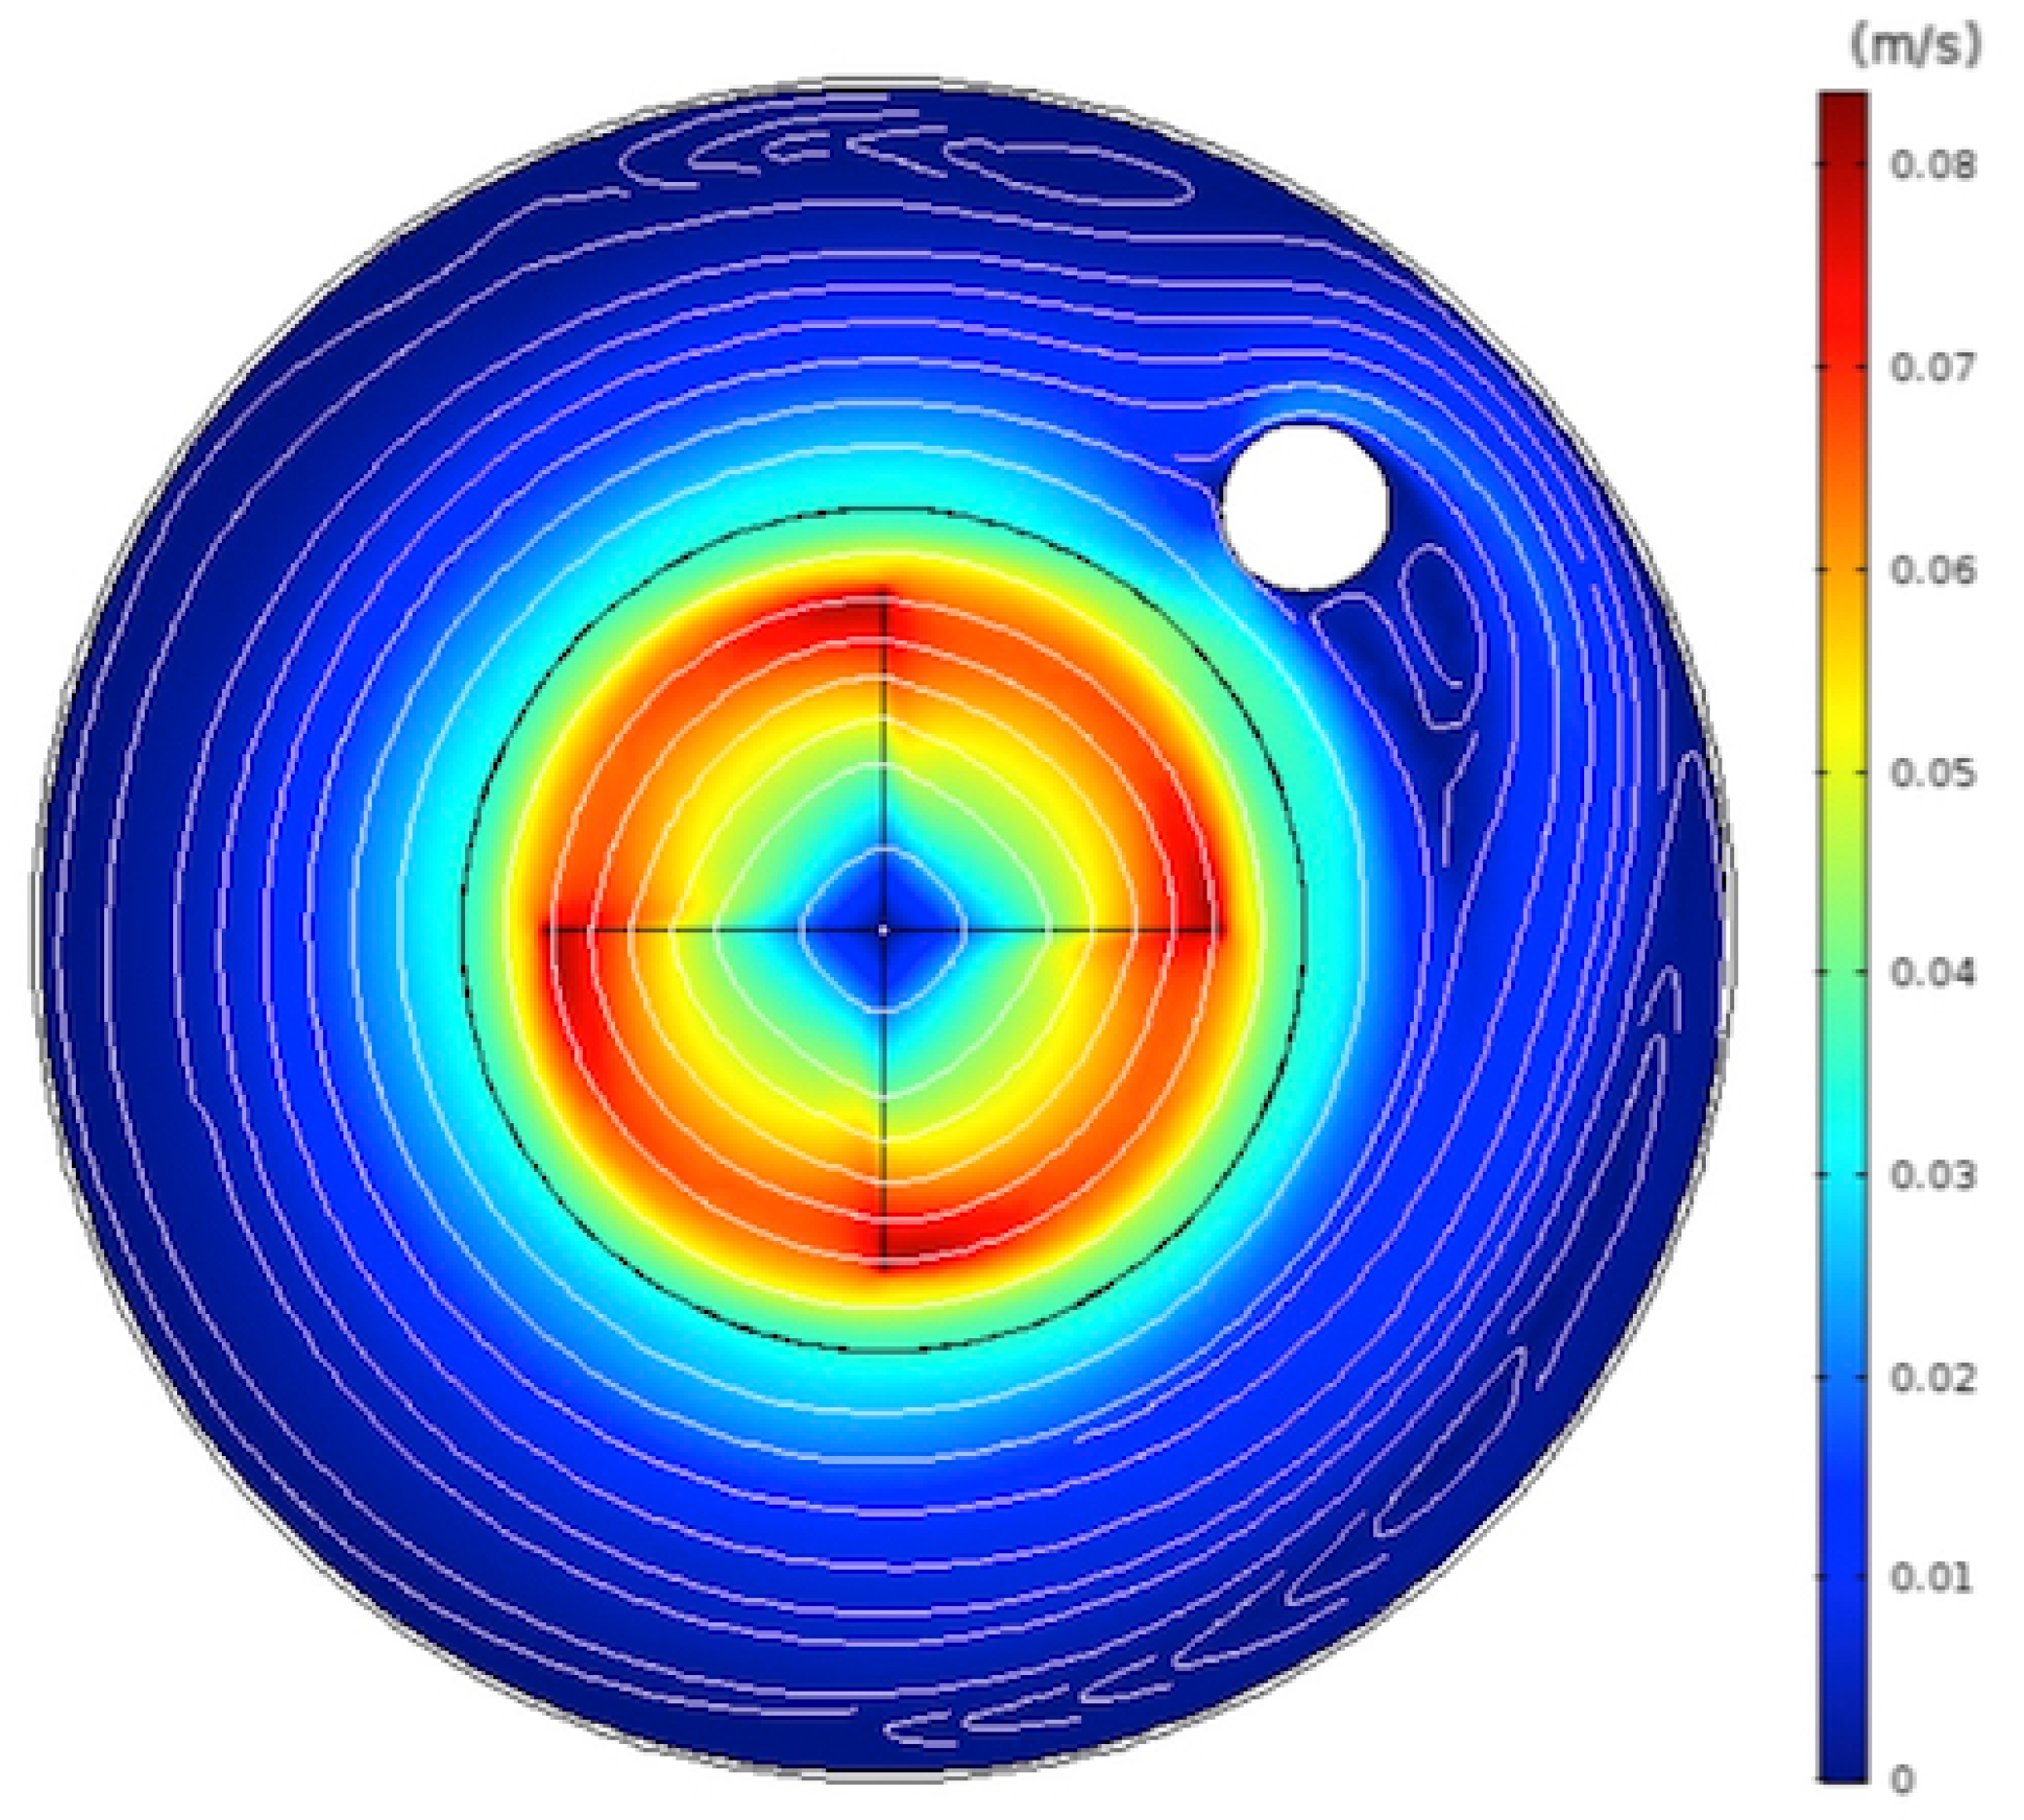
The induced mixing process produces a generic flow field like the one shown in Figure 10: the non-uniformity of fluid velocity due to the mixing process can be seen. In particular, streamlines are also included to visualize the flow field.
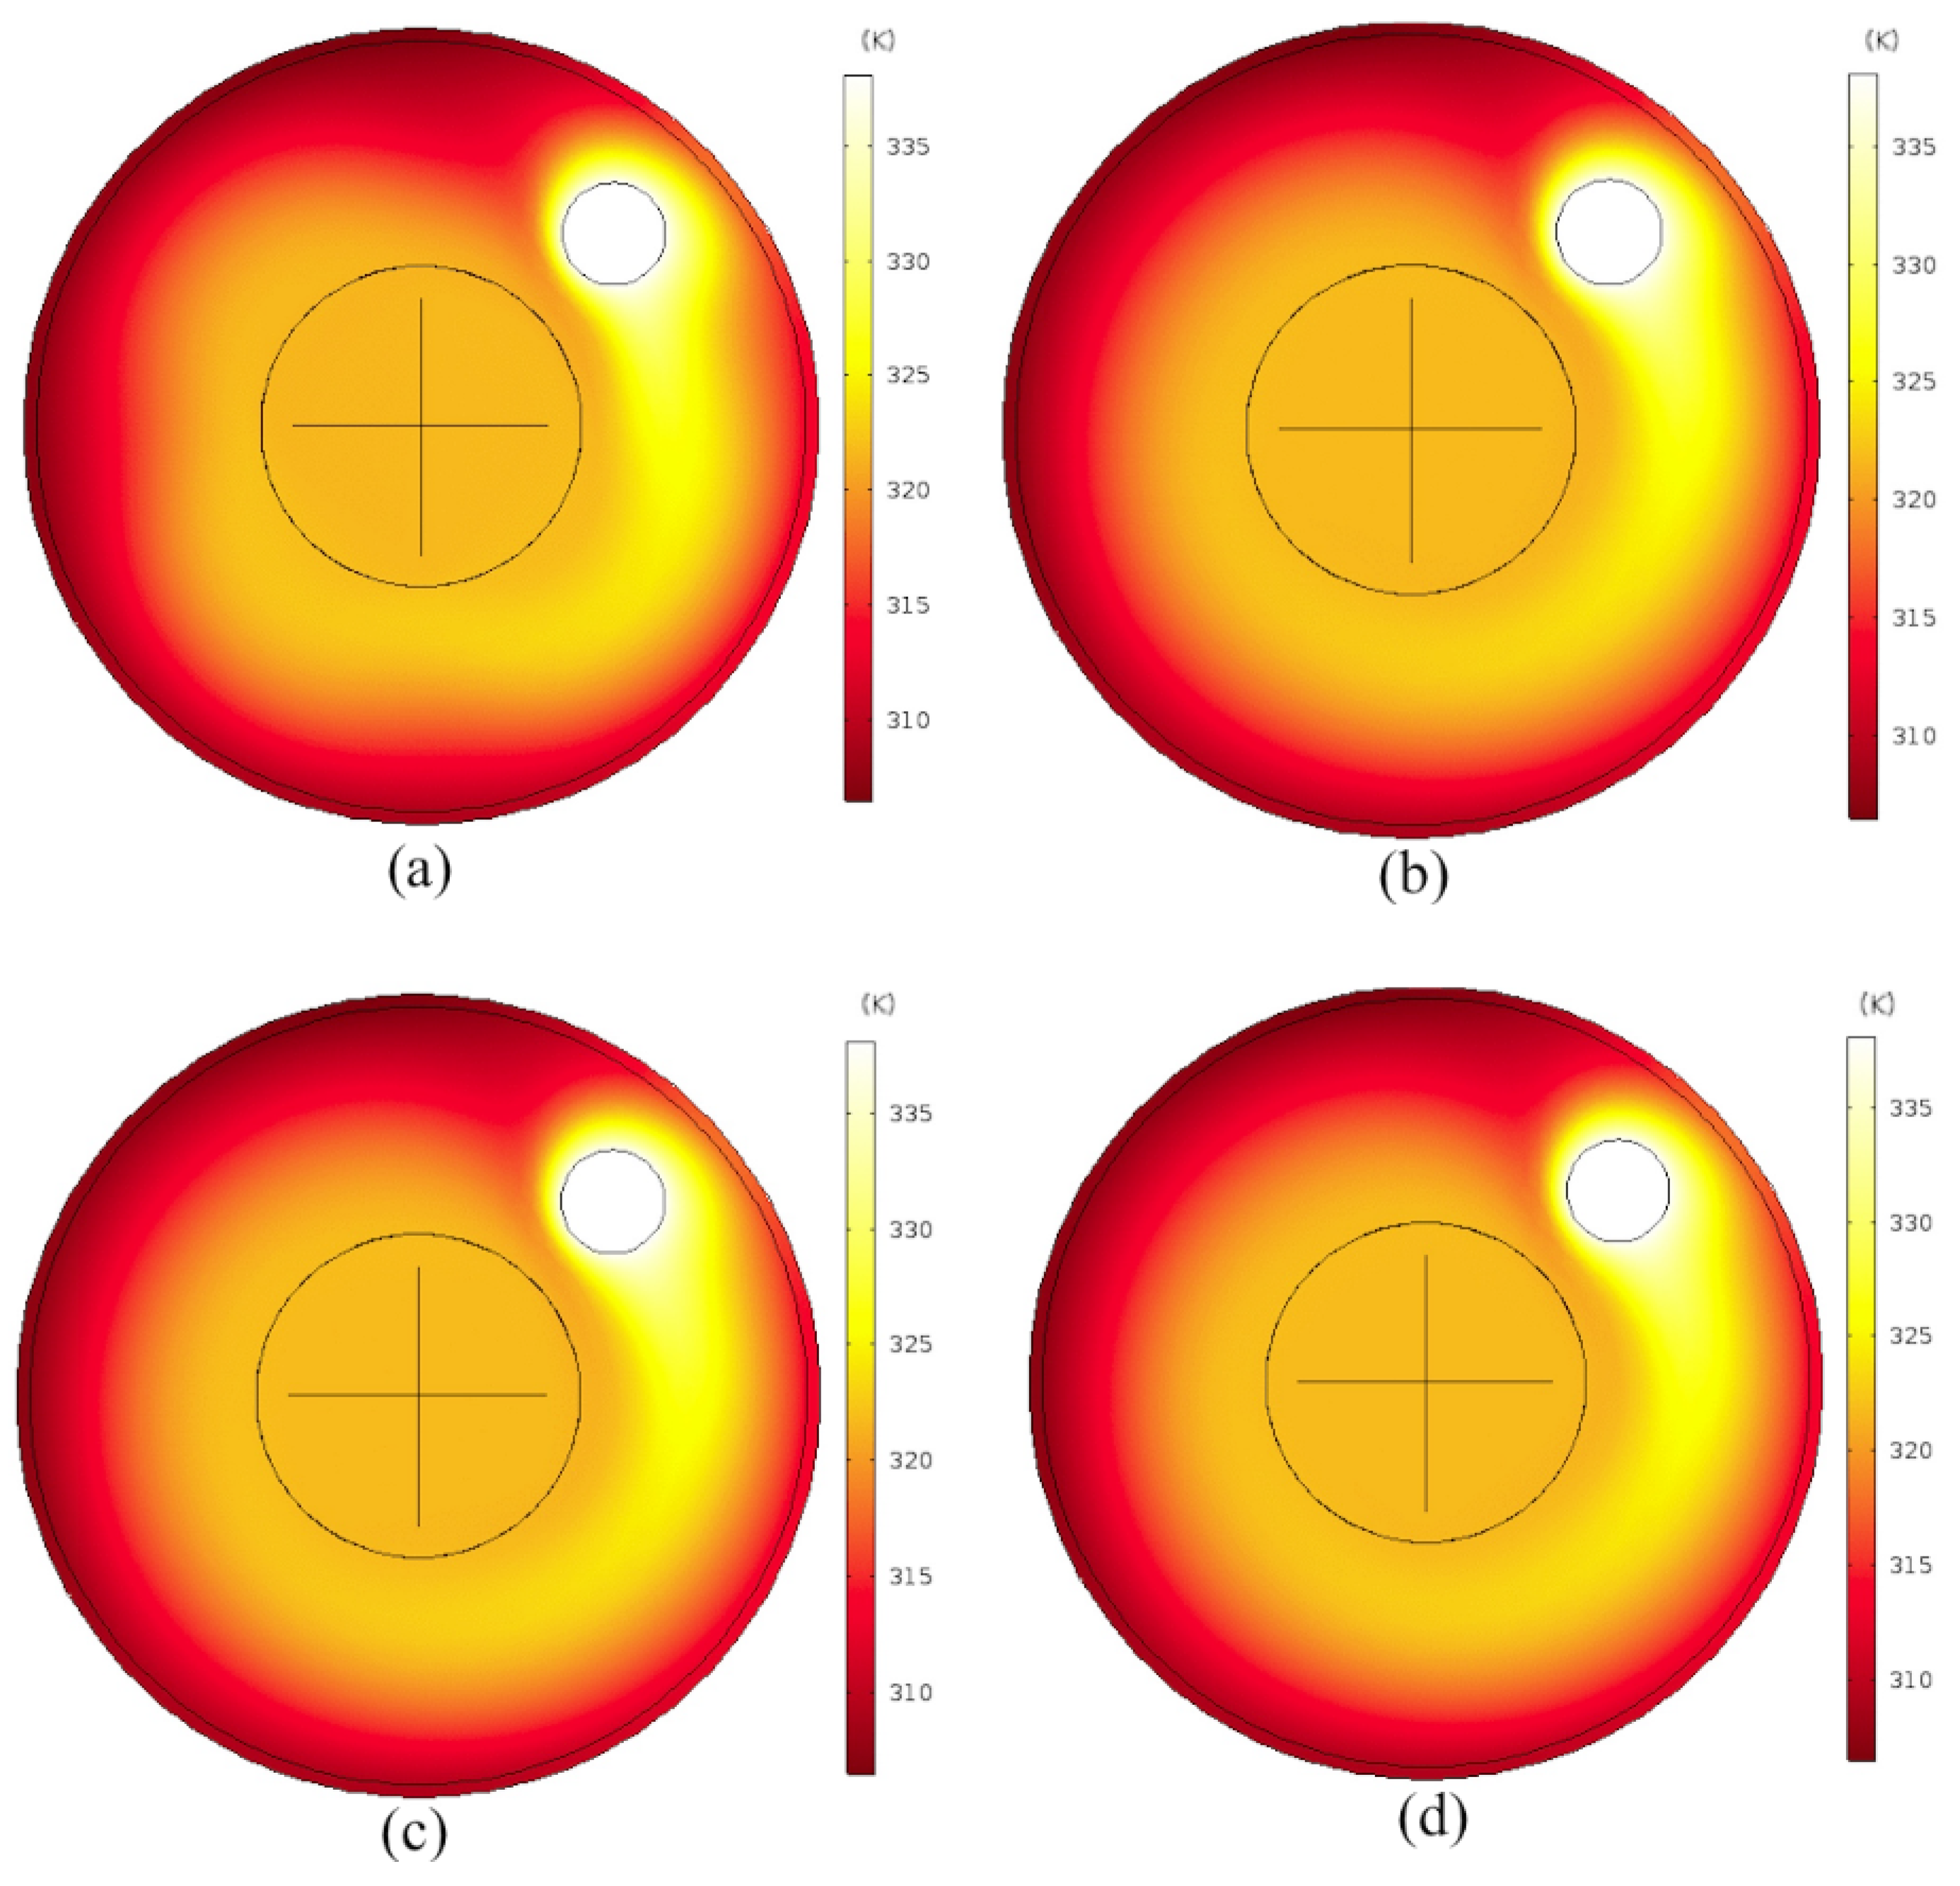
An alterated temperature field is reached through recirculation zones, because of some cold spots near the immersion heater. This is an expected result because the fluid at the cold spot has a longer residence time close to the solid wall and is thereby in less contact with the heated fluid closer to the center of the mixer [31]. A heat flux due to natural convection between the system and the external environment has been implemented as a boundary condition. To monitor the temperature value during the mixing process, a probe has been placed near solid walls, as described in Figure 9. Once an operational regime has been reached, the non-uniform temperature field persists (Figure 11). However, the transient thermal analysis of the batch micro-reactor used the frozen rotor simulation results as initial conditions. Even if the optimized temperature—that is 65 C—is satisfied around the heater boundaries, elsewhere such value will not be reached. The temperature profile in Figure 11 shows how its slope decreases in time, as a result of the convective thermal flow with the external environment. This thermal alteration within the fluid domain involves a non-uniform overall conversion rate, i.e., a transesterification reaction will not ensure a constant conversion all-over, because of its dependence on temperature as previously discussed (Figure 3).
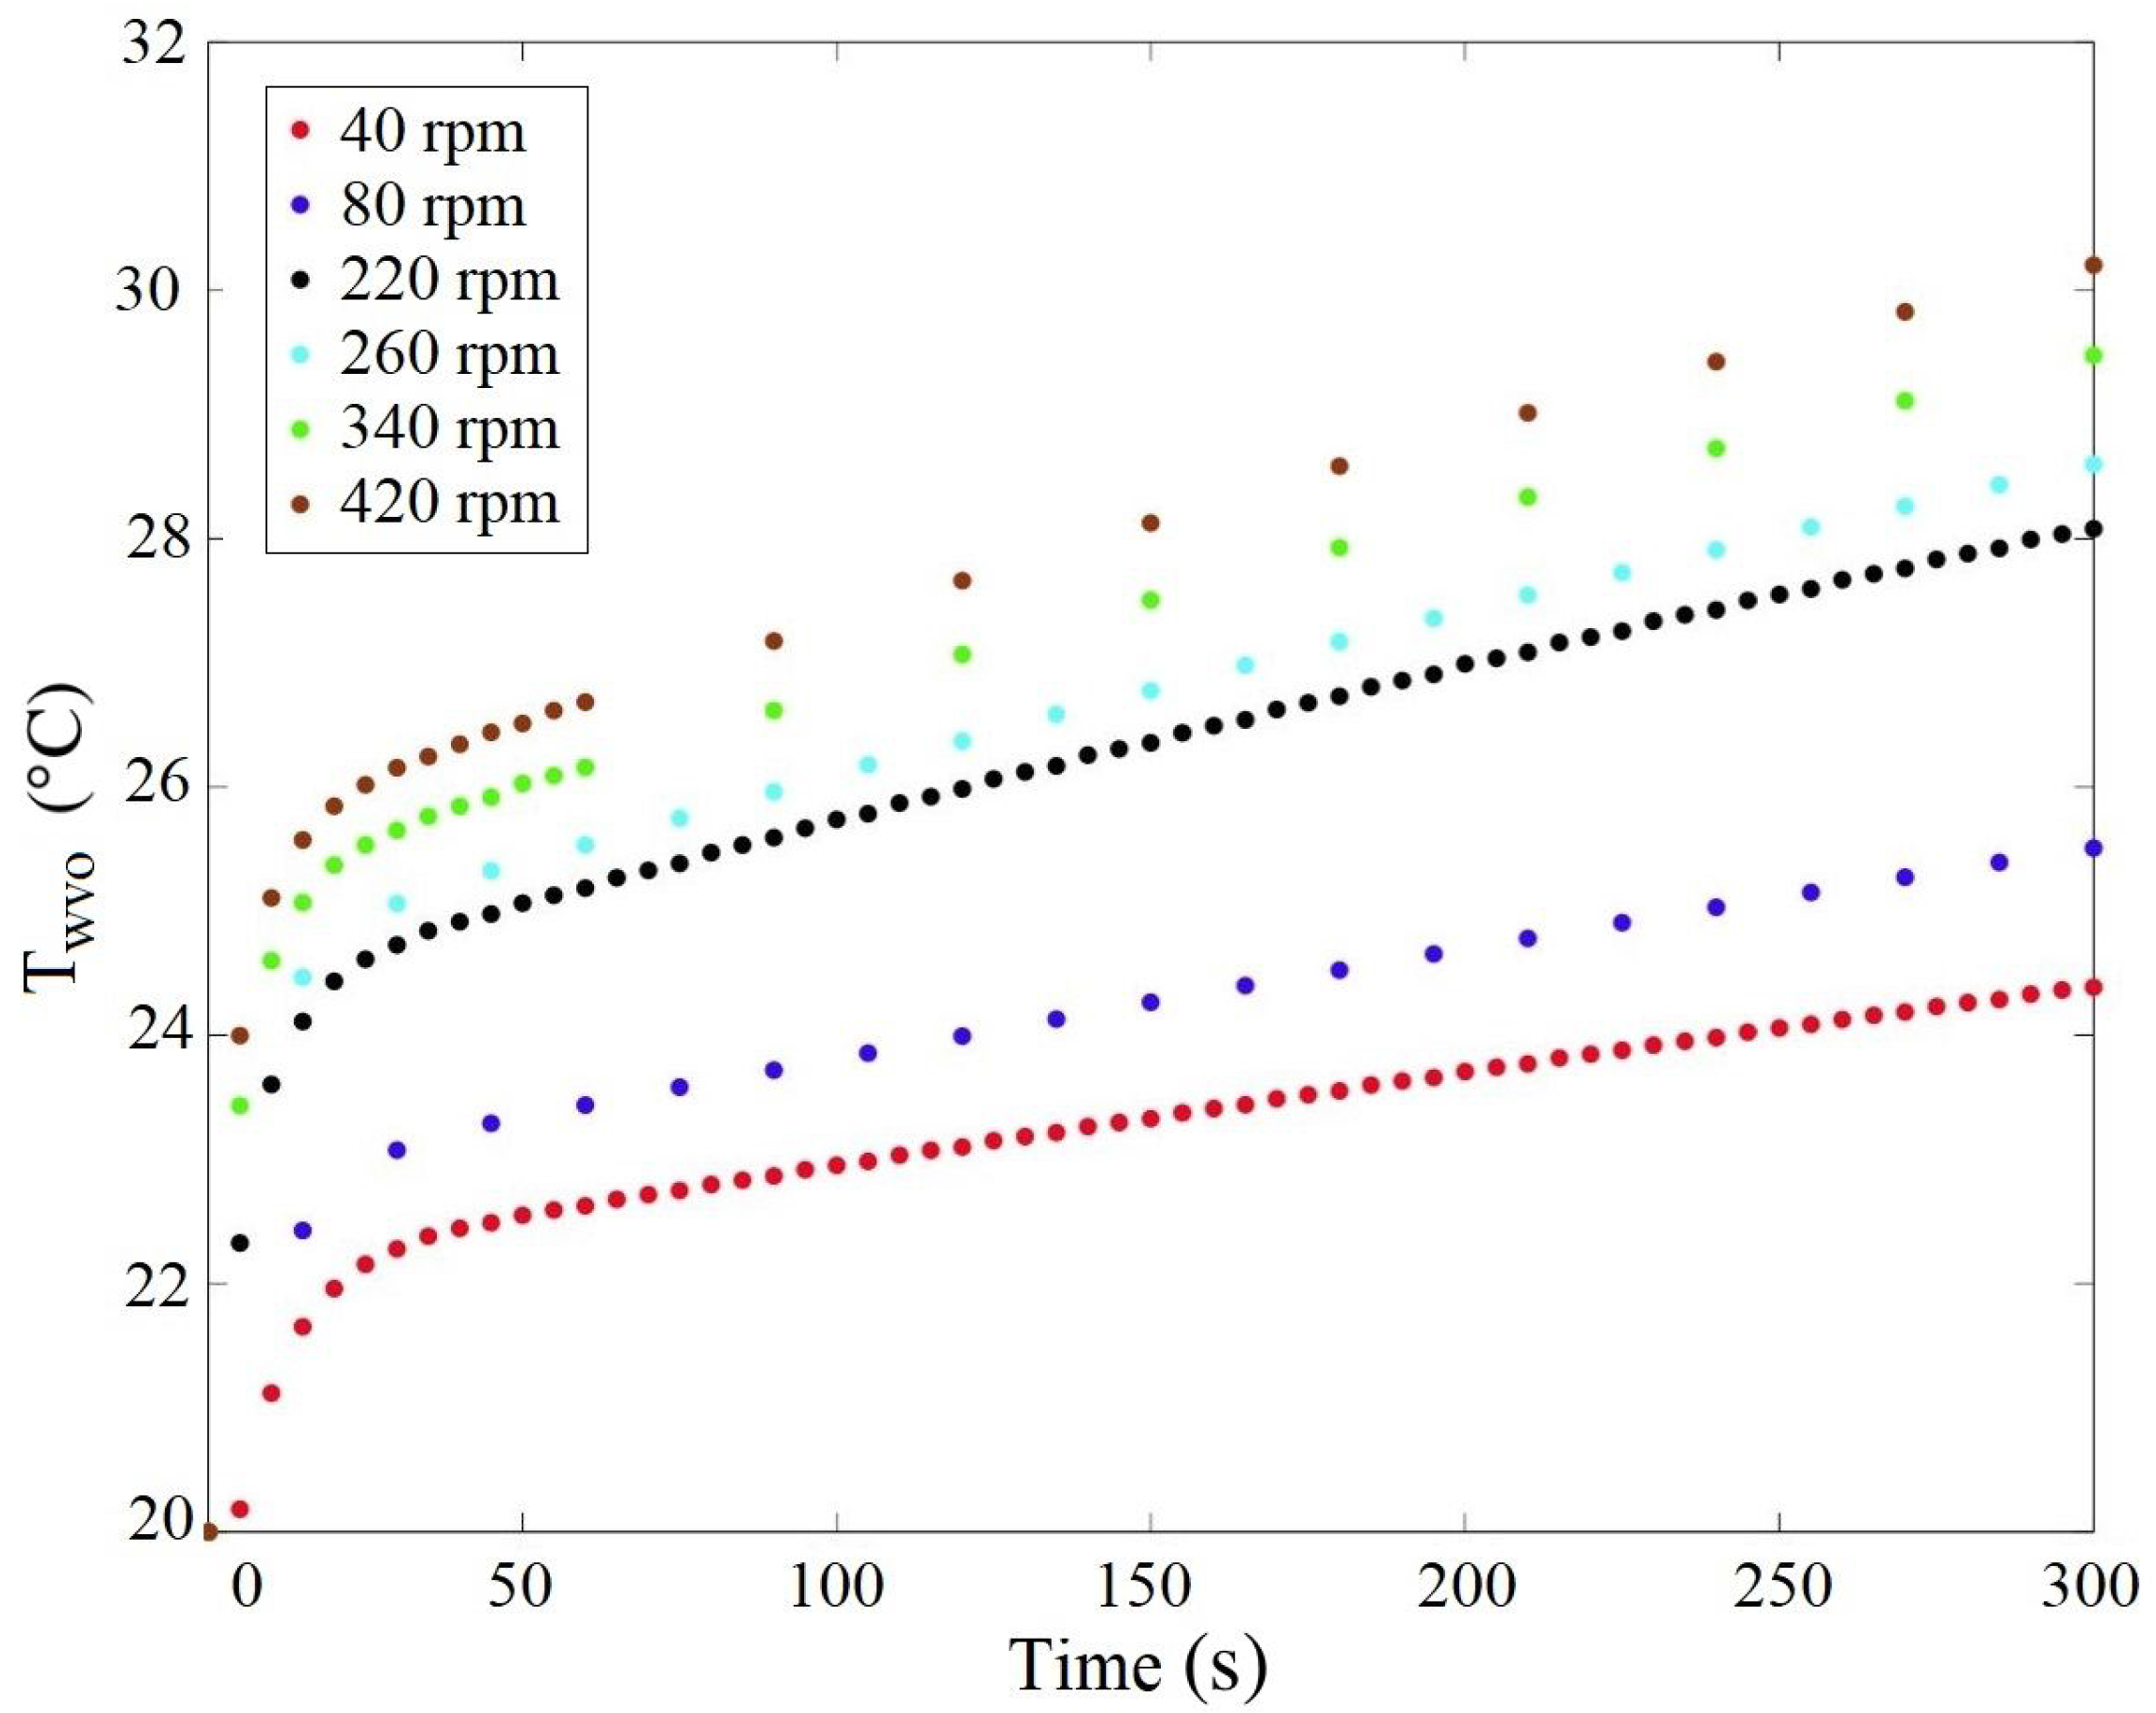
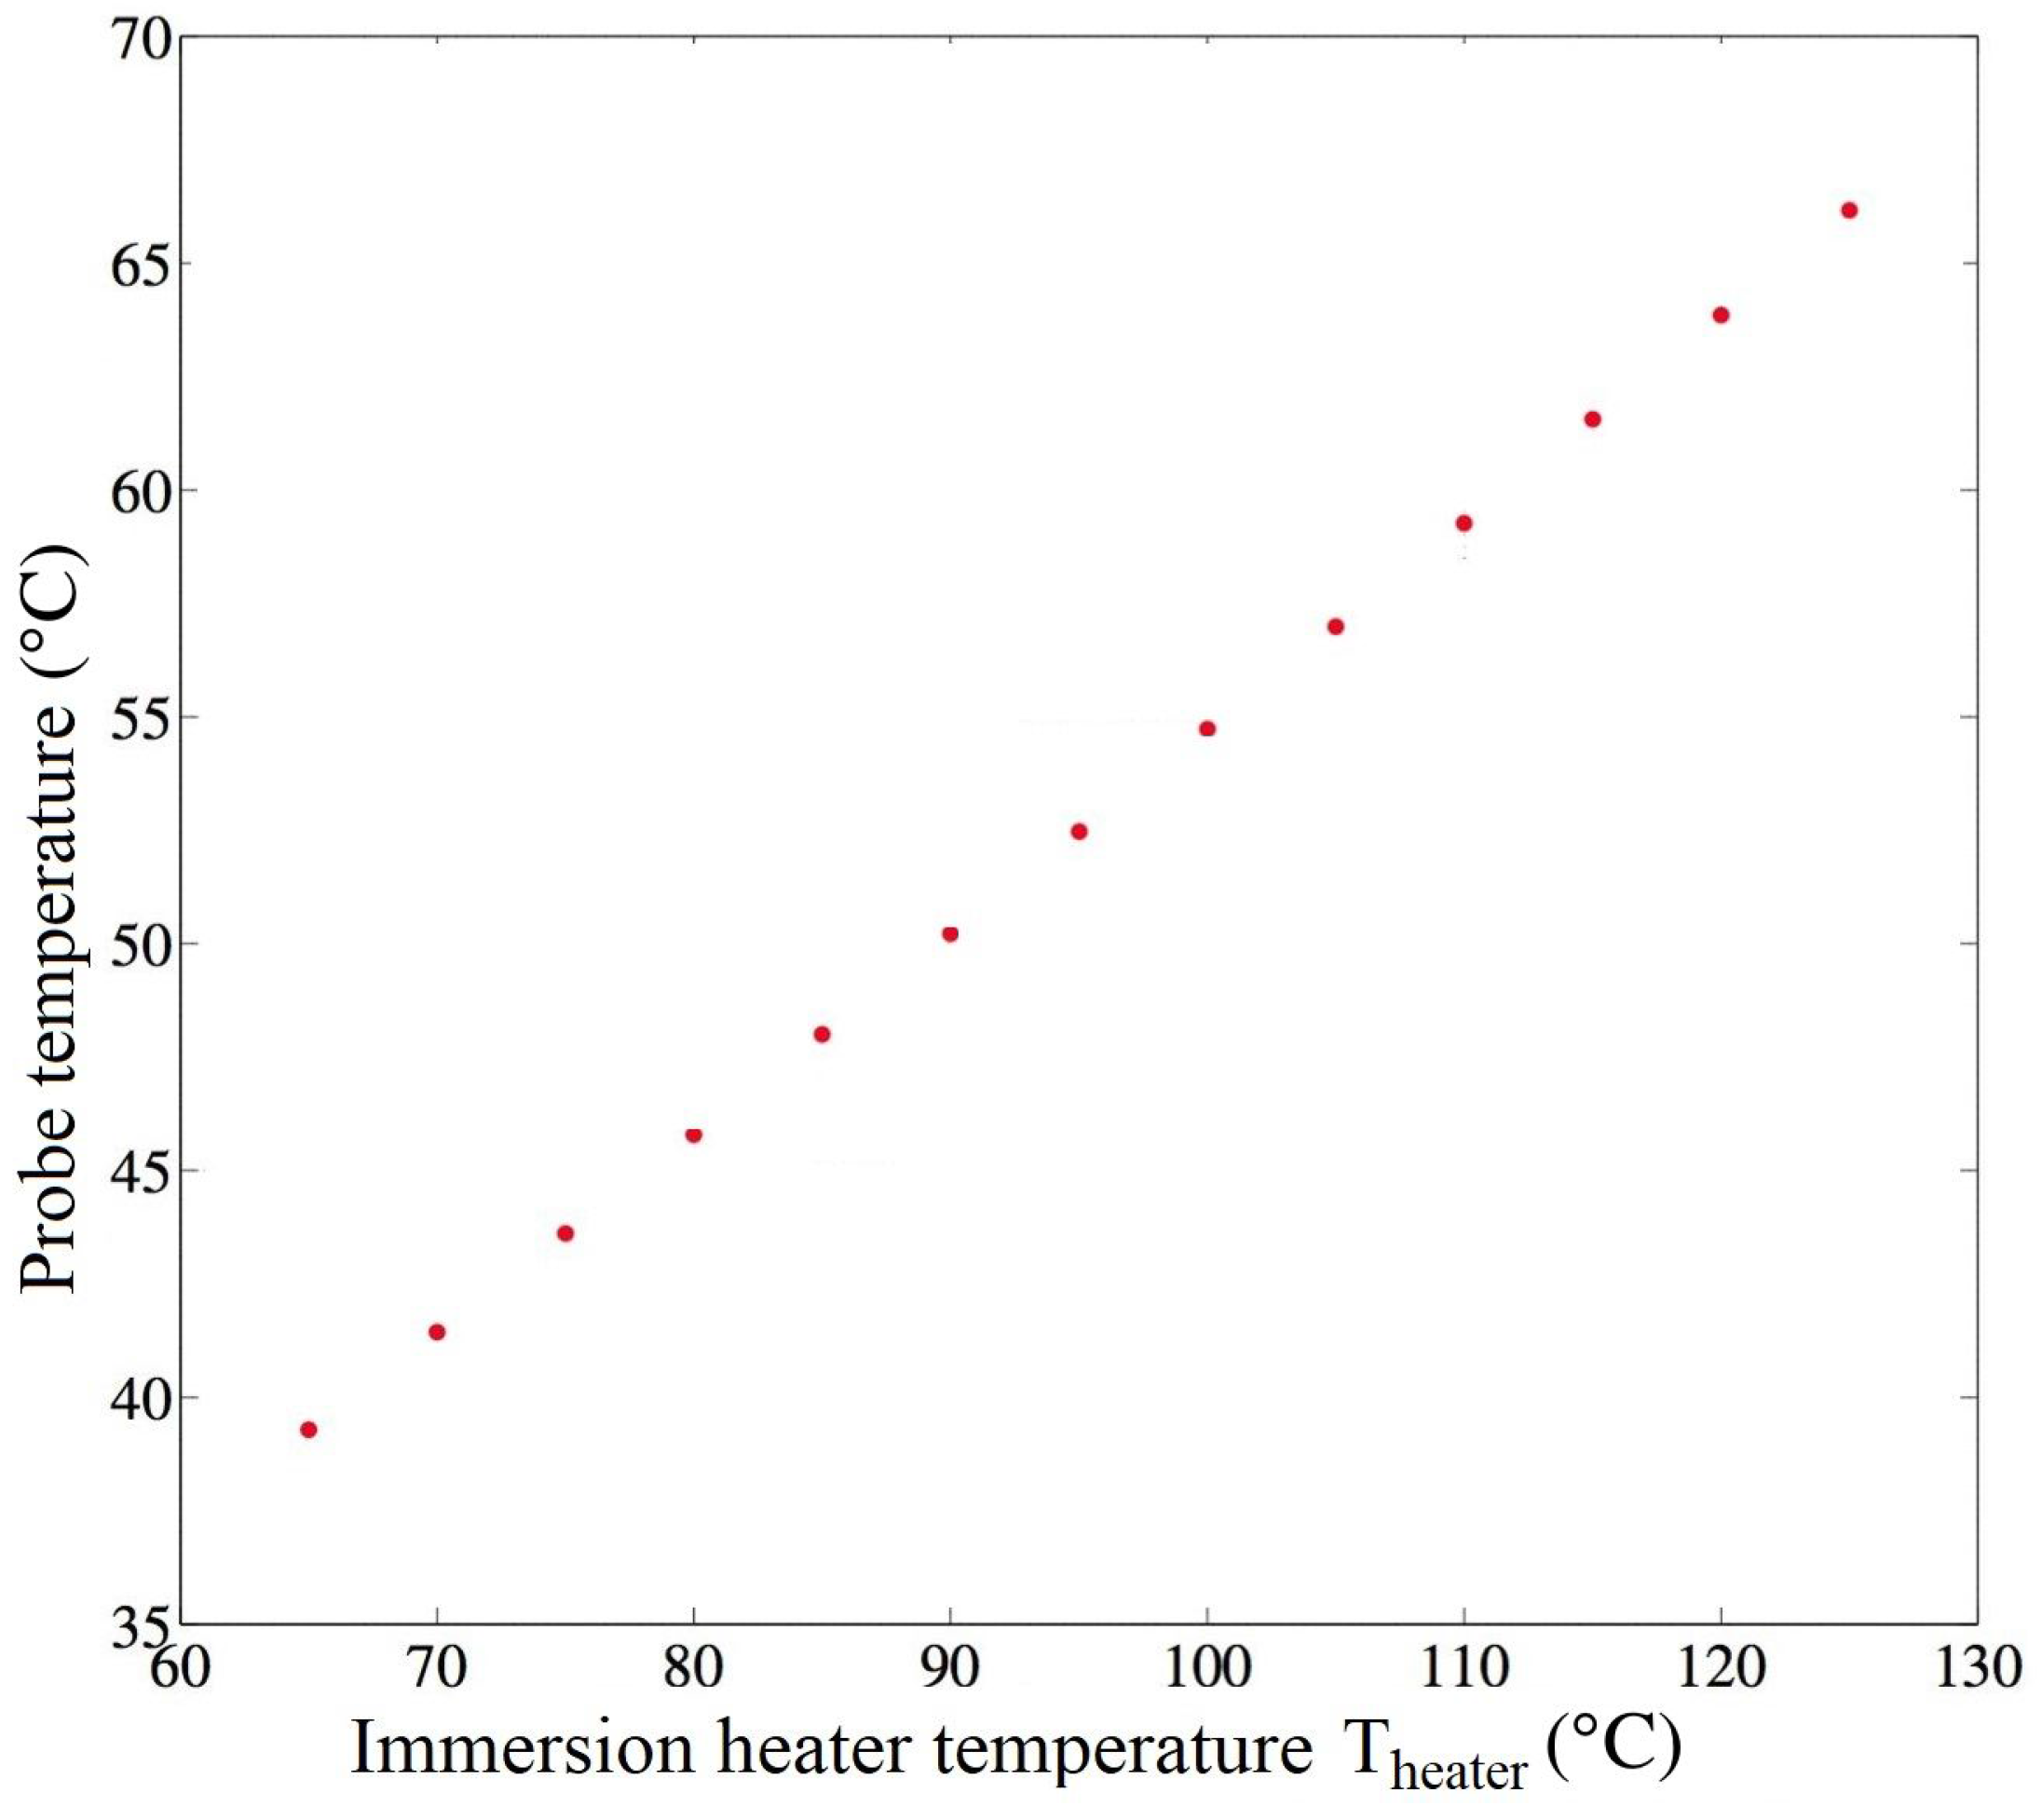
As shown in Figure 12, the established heat flux with the external environment prevents the system from reaching optimal thermal conditions within 5 min. In order to achieve the system thermal response while increasing the heater contours temperature, a point analysis—considering the same probe location previously discussed —has also been conducted providing results in Figure 13. Even by changing the immersion heater boundary temperature, a uniform thermal field cannot be achieved because of the existing convective flux from the fluid domain to the external one. Due to flow-related recirculation zones, the WVO around the heater outline is affected by its set temperature locally.
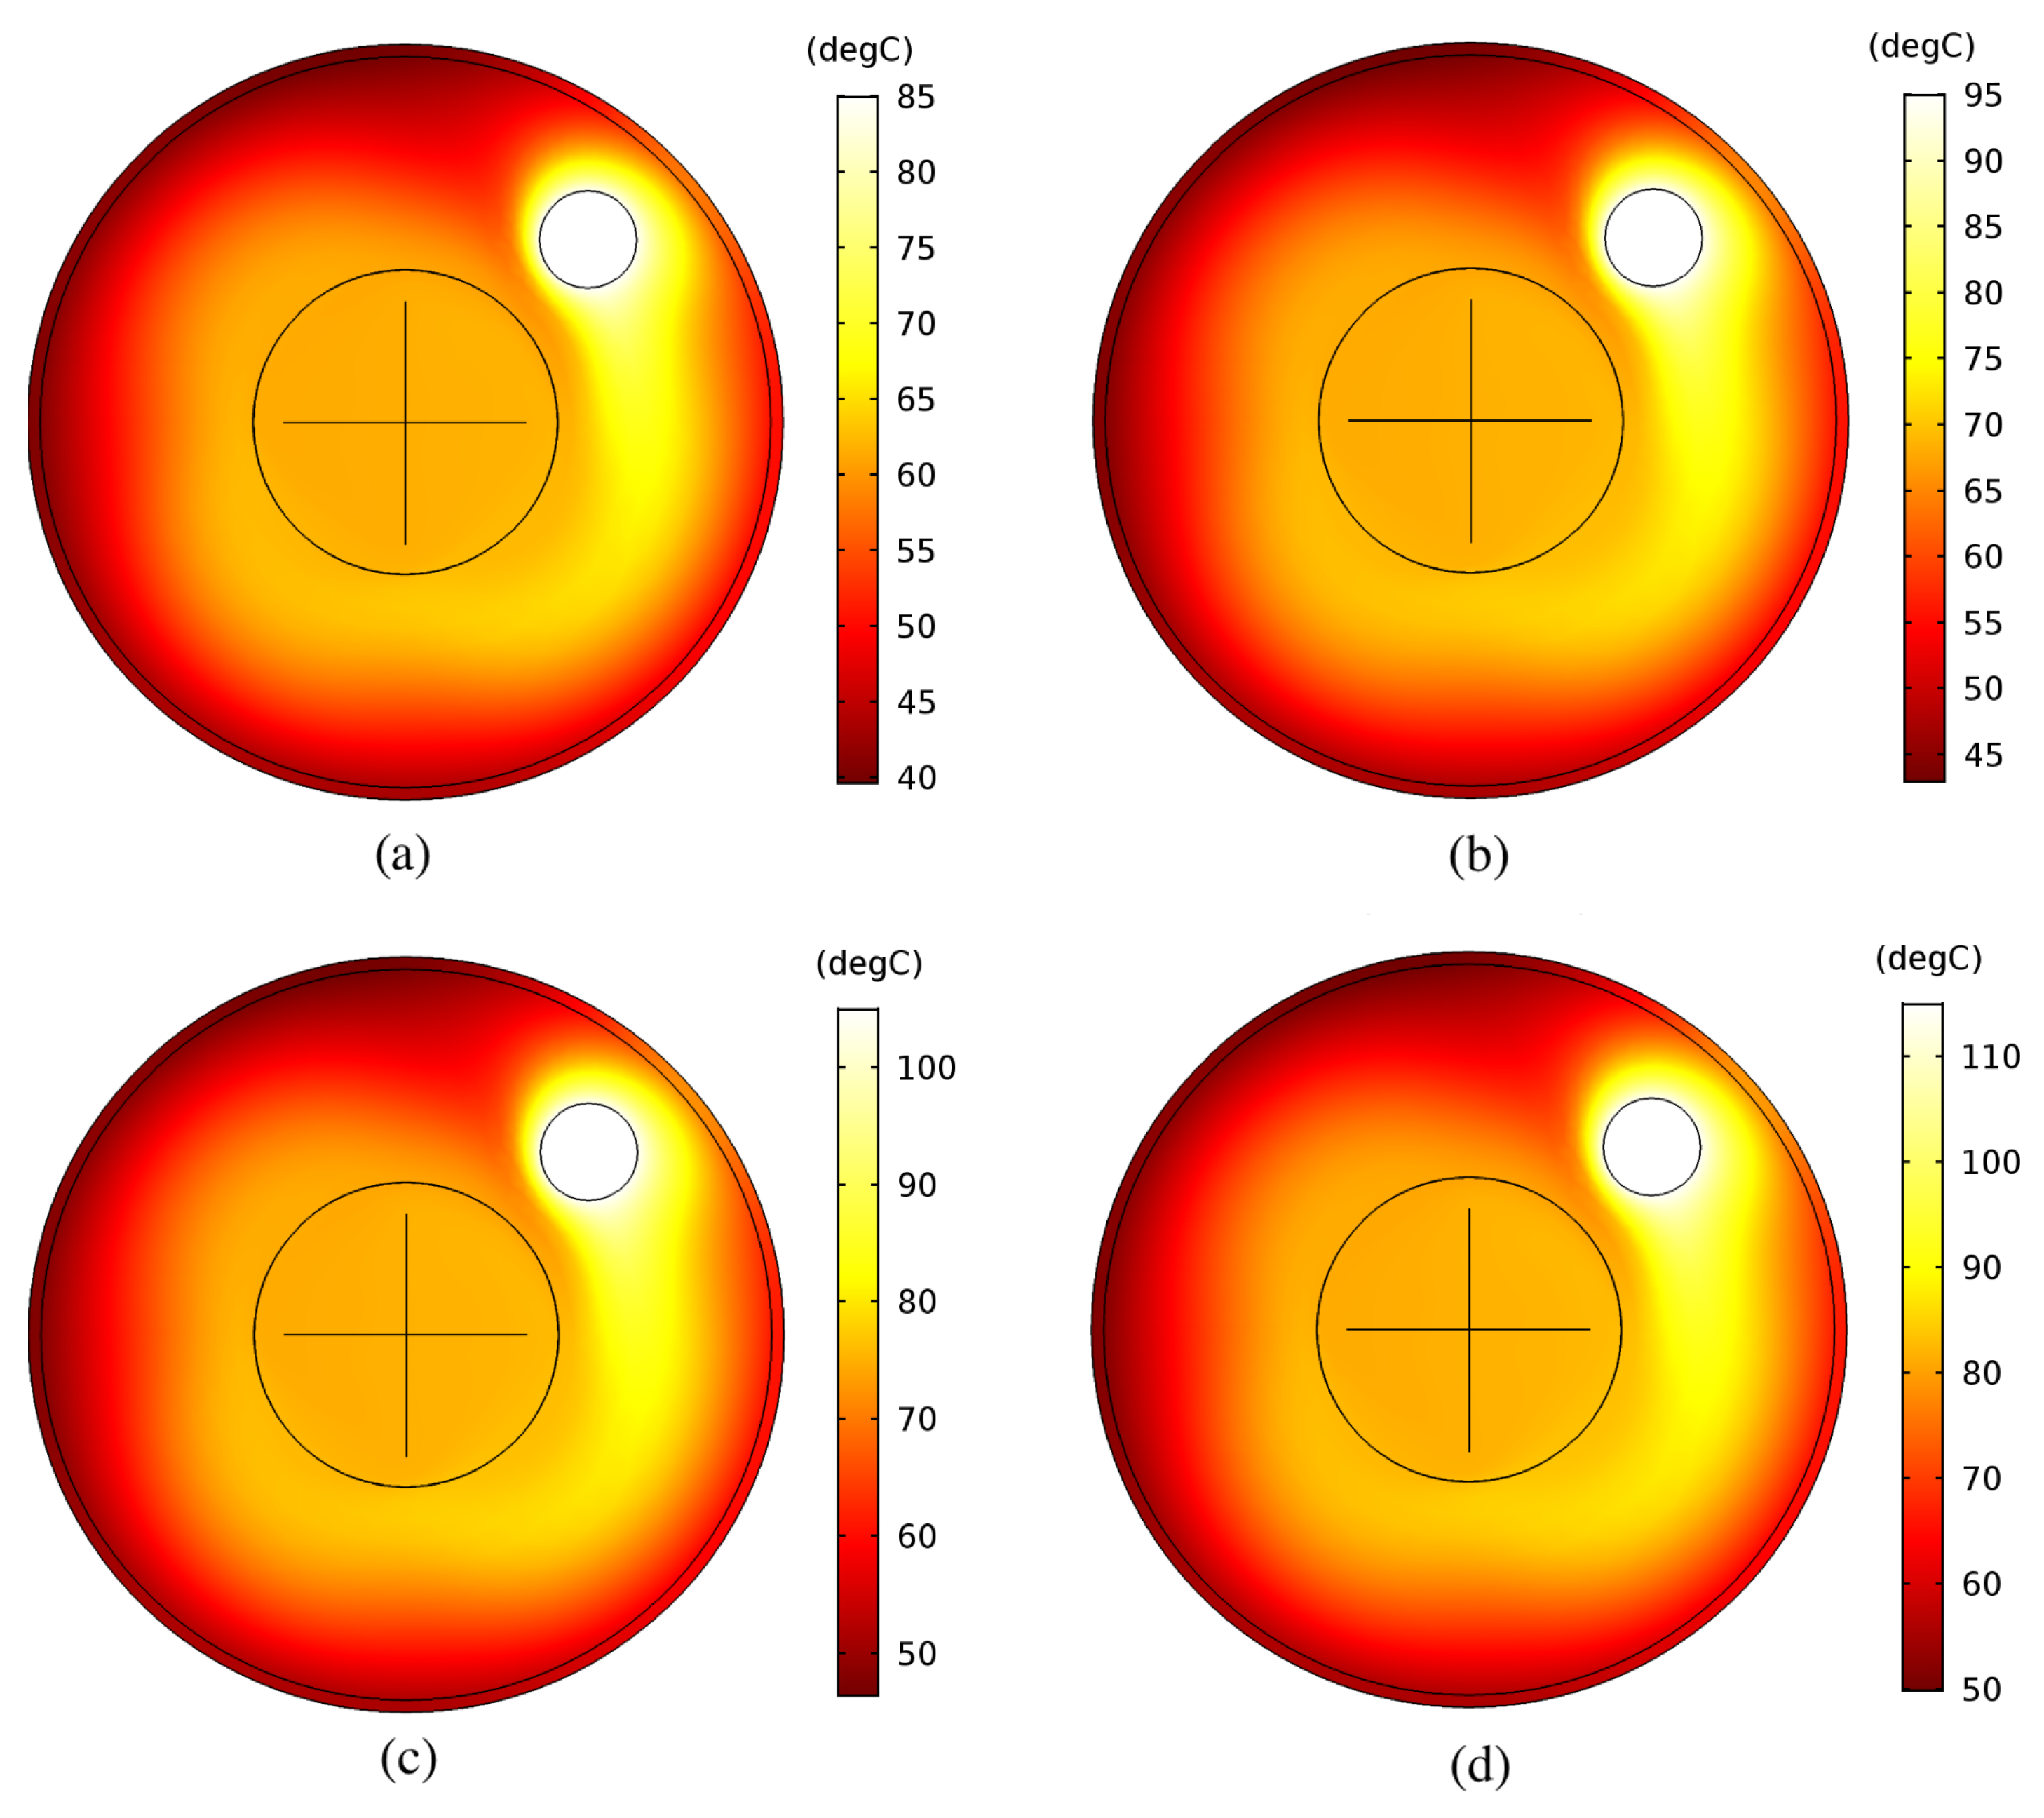
The optimal temperature is reached only in a few points within the fluid domain. Temperature distribution within the batch micro-reactor seems not to be modified by variations in heater temperature (Figure 14). Excessive heating found in some areas of the domain could inhibit conversion from WVO to BD: at a higher temperature, WVO oxidative processes are favored, and so is polymerization. Oxidative process are connected to the temperature increasing trend of oxygen to bind with long chains of fatty acids. A high number of unsaturated binds along fatty acids chains indicates a greater tendency to react with O. These WVO degradation processes can lead to the formation of foams and gums—due to polymerization—inside the fluid domain, which can adversely affect the chemical reaction and thus the methyl esters conversion percentage.
4. Conclusions
A batch micro-reactor used to produce biodiesel from waste vegetable oil has been simulated in Comsol Multiphysics. In particular, thermal and laminar flow fields—related to the mixing and constant temperature immersion heater system—have been studied. Fluid and solid wall material properties—such as density, heat capacity at constant pressure, kinematic viscosity, thermal conductivity—have been initialized into the simulation scenario to solve Navier-Stokes equations as well as energy balance related to thermal analysis. Referring to this reacting system configuration, the resulting temperature fields show how a uniform profile cannot be achieved inside the fluid domain. The fluid region closest to the heater is affected by a higher thermal flow which provides an increasing temperature locally: this causes a considerable thermal gradient within the domain, negatively affecting the yield of the chemical reaction. Moreover, vegetable oil degradation processes—like oxidation and polymerization—and alcohol evaporation should be induced at temperatures higher than 110 C. Therefore, it is preferable to install a heating jacket all around the reactor’s solid walls, which could even raise the inside temperature uniformly. An alternative heating method could be a heating plate on which the micro batch reactor should be positioned. In order to reach a uniform temperature field within the mixed fluid domain, a thermal power transient should be used, exploiting convective motions of waste vegetable oil due to established density gradients. Using a heating plate should be a good way to increase temperature within a micro batch reactor (0.1 L capacity approximately), since convective motion required time could be acceptable. While referring to a major scale batch reactor, convective motions are rather slow given the geometric scale of the system. For this reason, a jacketed vessel has been identified as the most performing solution in terms of uniformity of thermal flow and time required. Future studies will refer to chemical reaction implementation within the simulation scenario, coupled with the multi-physics of heat exchange and fluid dynamics. In this way, system chemical kinetics analysis will allow us to optimize the transesterification reaction and the overall conversion rate.
Author Contributions
Carlini Maurizio and Castellucci Sonia have conceived and designed the experiments; Castellucci Sonia has performed the experiments; Mennuni Andrea has analyzed the data to define, implement and solve simulation scenarios.
Conflicts of Interest
The authors declare no conflict of interest.
Abbreviations
The following abbreviations are used in this manuscript:
| BD | Biodiesel |
| CM | Comsol Multiphysics |
| FEM | Finite Element Method |
| PO | Peanut Oil |
| WVO | Waste Vegetable Oil |
References
- Aytav, E.; Kocar, G. Biodiesel from the perspective of Turkey: Past, present and future. Renew. Sustain. Energy Rev. 2014, 25, 335–350. [Google Scholar] [CrossRef]
- Carlini, M.; Villarini, M.; Esposto, S.; Bernardi, M. Performance analysis of greenhouses with integrated photovoltaic modules. In Lecture Notes in Computer Science; Springer: Berlin/Heidelberg, Germany, 2010. [Google Scholar] [CrossRef]
- Mosconi, E.; Carlini, M.; Castellucci, S.; Allegrini, E.; Mizzelli, L.; Arezzo Di Trifiletti, M. Economical assessment of large-scale photovoltaic plants: An Italian case study. In Lecture Notes in Computer Science; Springer: Berlin/Heidelberg, Germany, 2013. [Google Scholar] [CrossRef]
- Srivastava, A.; Prasad, R. Triglycerides-based diesel fuels. Renew. Sustain. Energy Rev. 2000, 4, 111–133. [Google Scholar] [CrossRef]
- Ali, Y.; Hanna, M.; Borg, J. Optimization of diesel, methyl tailowate and ethanol blend for reducing emissions from diesel engine. Bioresour. Technol. 1995, 52, 237–243. [Google Scholar] [CrossRef]
- Bozbas, K. Biodiesel as an alternative motor fuel: Production and policies in the European Union. Renew. Sustain. Energy Rev. 2008, 12, 542–552. [Google Scholar] [CrossRef]
- Lapuerta, M.; Armas, O.; Rodrìguez-Fernàndez, J. Effect of biodiesel fuels on diesel engine emissions. Prog. Energy Combust. Sci. 2008, 34, 198–223. [Google Scholar] [CrossRef]
- Banga, S.; Varshney, P. Effects of impurities on performance of biodiesel: A review. J. Sci. Ind. Res. India 2010, 69, 575–579. [Google Scholar]
- Pang, X.; Mu, Y.; Yuan, J.; He, H. Carbonyls emission from ethanol-blended gasoline and biodiesel-ethanol-diesel used in engines. Atmos. Environ. 2008, 42, 1349–1358. [Google Scholar] [CrossRef]
- Wang, W.; Lyons, D.; Clark, N.; Gautam, M. Emissions from Nine Heavy Trucks Fueled by Diesel and Biodiesel Blend without Engine Modification. Environ. Sci. Technol. 2000, 34, 933–939. [Google Scholar] [CrossRef]
- Clark, S.; Wagner, L.; Schrock, M.; Piennaar, P. Methyl and ethyl soybean esters as renewable fuels for diesel engines. J. Am. Oil Chem. Soc. 1984, 61, 1632–1638. [Google Scholar] [CrossRef]
- UNI EN 14214:2014, Liquid Petroleum Products—Fatty Acid Methyl Esters (FAME) for Use in Diesel Engines and Heating Applications—Requirements and Test Methods. Start Validity Date: 6 February 2014. ICS: 75.160.20. Available online: https://0-shop-bsigroup-com.brum.beds.ac.uk/ProductDetail/?pid=000000000030314027 (accessed on 11 December 2017).
- UNI EN 590:2017, Automotive Fuels—Diesel—Requirements and Test Methods. Start Validity Date: 20 July 2017. ICS: 75.160.20. Available online: https://global.ihs.com/doc_detail.cfm?&rid=TIA&input_doc_number=&input_doc_title=&item_s_key=00200629&item_key_date=850831&origin=DSSC (accessed on 11 December 2017).
- Fukuda, H.; Kondo, A.; Noda, H. Biodiesel Fuel Production by Transesterification of Oils. J. Biosci. Bioeng. 2001, 92, 405–416. [Google Scholar] [CrossRef]
- Formo, M. Ester Reactions of Fatty Materials. J. Am. Oil Chem. Soc. 1954, 31, 548–559. [Google Scholar] [CrossRef]
- Cardarelli, A. La Transesterificazione dell’olio Vegetale Esausto: Analisi del Processo di Produzione e Ottimizzazione della Reazione. Bachelor’s Thesis, DEIm, Industrial Engineering School, University of Tuscia, Viterbo, Italy, 2017. [Google Scholar]
- Gutiérrez-Zapata, C.; Martìnez, D.; Collazos, C. Productions of sunflower oil biodiesel and used cooking oil through heterogeneous catalysts compared to conventional homogeneous catalysts. J. Phys. 2017, 786, 1. [Google Scholar] [CrossRef]
- Ayoub, M.; Ullah, S.; Inayat, A. Process optimization for biodiesel production from waste frying oil over montmorillonite clay k-30. Procedia Eng. 2016, 148, 742–749. [Google Scholar] [CrossRef]
- Bergamin, F. Ottimizzazione della Produzione di Biodiesel di Seconda Generazione a Partire da olio di Jatropha. Master’s Thesis, Industrial Engineering Department, University of Padova, Padua, Italy, 2013. [Google Scholar]
- Carlini, M.; Mennuni, A.; Allegrini, E.; Castellucci, S. Energy Efficiency in the Industrial Process of Hair Depigmentation: Analysis and FEM Simulation. Energy Procedia 2016, 101, 550–557. [Google Scholar] [CrossRef]
- Kawentar, W.A.; Budiman, A. Synthesis of biodiesel from second-used cooking oil. Energy Procedia 2013, 32, 190–199. [Google Scholar] [CrossRef]
- Phan, A.N.; Phan, T.M. Biodiesel production from waste cooking oils. Fuel 2008, 87, 3490–3496. [Google Scholar] [CrossRef]
- Moradi, G.; Mohadesi, M.; Karami, B. Densities and Kinematic Viscosities in Biodiesel–Diesel Blends at Various Temperatures. J. Chem. Eng. Data 2013, 58, 99–105. [Google Scholar] [CrossRef]
- Davis, J.; Geller, D.; Faircloth, W.; Sanders, T. Comparisons of Biodiesel Produced from Unrefined Oils of Different Peanut Cultivars. J. Am. Oil Chem. Soc. 2009, 86, 353–361. [Google Scholar] [CrossRef]
- Kumbár, V.; Skřivánek, A. Temperature Dependence Viscosity and Density of Different Biodiesel Blends. Acta Univ. Agric. Silvic. Mendelianae Brun. 2015, 63, 1147–1151. [Google Scholar] [CrossRef]
- Carlini, M.; Castellucci, S.; Cocchi, S. A Pilot-Scale Study of Waste Vegetable Oil Transesterification with Alkaline and Acidic Catalysts. Energy Procedia 2014, 45, 198–206. [Google Scholar] [CrossRef]
- Noureddini, H.; Teoh, B.; Davis Clements, L. Densities of vegetable oils and fatty acids. J. Am. Oil Chem. Soc. 1992, 69, 1184–1188. [Google Scholar] [CrossRef]
- Fasina, O.O.; Colley, Z. Viscosity and specific heat of vegetable oils as a function of temperature: 35 °C to 180 °C. Int. J. Food Prop. 2008, 11, 738–746. [Google Scholar] [CrossRef]
- Ingley, H. Vegetable Oils: Liquid Coolants for Solar Heating and Cooling Applications; Technical Report; US Department of Energy: Washington, DC, USA; Solar Energy and Energy Conversion Laboratory, University of Florida: Gainesville, FL, USA, 1979.
- Rodenbush, C.; Hsieh, F.; Viswanath, D. Density and viscosity of vegetable oils. J. Am. Oil Chem. Soc. 1999, 76, 1415–1419. [Google Scholar] [CrossRef]
- COMSOL. Mixer Module: Application Library Manual. Available online: https://www.comsol.eu/mixer-module (accessed on 11 December 2017).
- Savuto, E.; Di Carlo, A.; Bocci, E.; D’Orazio, A.; Villarini, M.; Carlini, M.; Foscolo, P. Development of a CFD model for the simulation of tar and methane steam reforming through a ceramic catalytic filter. Int. J. Hydrogen Energy 2015, 40, 7991–8004. [Google Scholar] [CrossRef]
- Rice, M. High Resolution Simulation of Laminar and Transitional Flows. Ph.D. Thesis, Virginia Polytechnic Institute and State University, Blacksburg, VA, USA, 2011. [Google Scholar]
Figure 1.
Vegetable oils composition.

Figure 2.
Transesterification reaction critical parameters [19]: mixing speed.
Figure 2.
Transesterification reaction critical parameters [19]: mixing speed.

Figure 3.
Transesterification reaction critical parameters [19]: temperature (150 rpm).
Figure 3.
Transesterification reaction critical parameters [19]: temperature (150 rpm).

Figure 4.
Experiment schematic configuration.

Figure 5.
Temperature dependence of peanut oil heat capacity at constant pressure.

Figure 6.
Temperature dependence of peanut oil thermal conductivity.

Figure 7.
Temperature dependence of peanut oil kinematic viscosity.

Figure 8.
Reynolds analysis related to reaction operating conditions.

Figure 9.
Geometric domains and implemented boundary conditions.

Figure 10.
Flow field within the batch micro-reactor.

Figure 11.
Temperature field within the batch micro-reactor at different time steps: (a) s; (b) s; (c) s; (d) s.
Figure 11.
Temperature field within the batch micro-reactor at different time steps: (a) s; (b) s; (c) s; (d) s.

Figure 12.
Probe temperature trend in time.

Figure 13.
Temperature probe records.

Figure 14.
Temperature field related to heater temperature variations: (a) 85 C; (b) 95 C; (c) 105 C; (d) 115 C.
Figure 14.
Temperature field related to heater temperature variations: (a) 85 C; (b) 95 C; (c) 105 C; (d) 115 C.


| Parameter | Biodiesel | Diesel Fuel |
|---|---|---|
| Density | 0.86 ÷ 0.90 g/cm | 0.82 ÷ 0.85 g/cm |
| Viscosity | 3.5 ÷ 5.5 mm/s | 2.2 ÷ 4.5 mm/s |
| Cetane number | >51 | >51 |
| Flash point | >110 C | >55 C |
| Sulphur content | <0.001% | <0.035% |
| Total acidity | <0.5 mg/g | <0.3 mg/g |
| Lower calorific value | 33,175 kJ/L | 35,700 kJ/L |
Table 2.
Initialized fluid properties: density of some vegetable oils (data by [27]).
Table 2.
Initialized fluid properties: density of some vegetable oils (data by [27]).
| Temperature (C) | Oil Density (g/mL) | ||||||
|---|---|---|---|---|---|---|---|
| Crambe | Rape | Corn | Soybean | Milkweed | Palm | Argan | |
| 23.9 | 0.9078 | 0.9073 | 0.9188 | 0.9193 | 0.9203 | 0.9398 | |
| 37.8 | 0.8977 | 0.8987 | 0.9082 | 0.9082 | 0.9097 | 0.9107 | 0.9307 |
| 48.9 | 0.8898 | 0.8908 | 0.9028 | 0.9023 | 0.9018 | 0.9033 | 0.9229 |
| 60 | 0.8829 | 0.8839 | 0.8939 | 0.8939 | 0.8934 | 0.8949 | 0.9152 |
| 82.2 | 0.8681 | 0.8686 | 0.88 | 0.8795 | 0.879 | 0.8795 | 0.8999 |
| 100 | 0.8564 | 0.8579 | 0.8679 | 0.8674 | 0.8684 | 0.8669 | 0.8879 |
| 110 | 0.8501 | 0.8511 | 0.861 | 0.8615 | 0.8605 | 0.8605 | 0.883 |
Table 3.
Initialized fluid properties: heat capacity of some vegetable oils (data by [28]).
Table 3.
Initialized fluid properties: heat capacity of some vegetable oils (data by [28]).
| Temperature | Oil Heat Capacity at Constant Pressure (kJ/(kg· K)) | |||||||||
|---|---|---|---|---|---|---|---|---|---|---|
| (C) | Peanut | Safflower | Corn | Almond | Hazelnut | Walnut | Olive | Sunflower | Grape | Soybean |
| 35 | 2.045 | 2.076 | 1.673 | 2.354 | 1.726 | 2.034 | 1.746 | 2.244 | 1.572 | 1.675 |
| 40 | 2.055 | 2.09 | 1.684 | 2.368 | 1.731 | 2.046 | 1.742 | 2.257 | 1.576 | 1.692 |
| 45 | 2.06 | 2.098 | 1.692 | 2.375 | 1.734 | 2.054 | 1.738 | 2.263 | 1.579 | 1.702 |
| 50 | 2.071 | 2.11 | 1.702 | 2.388 | 1.742 | 2.068 | 1.742 | 2.276 | 1.586 | 1.715 |
| 55 | 2.081 | 2.122 | 1.714 | 2.4 | 1.75 | 2.082 | 1.747 | 2.287 | 1.595 | 1.728 |
| 60 | 2.095 | 2.137 | 1.728 | 2.417 | 1.761 | 2.095 | 1.756 | 2.302 | 1.606 | 1.741 |
| 65 | 2.102 | 2.147 | 1.738 | 2.427 | 1.767 | 2.105 | 1.76 | 2.311 | 1.615 | 1.751 |
| 70 | 2.117 | 2.164 | 1.754 | 2.444 | 1.78 | 2.121 | 1.769 | 2.328 | 1.63 | 1.765 |
| 75 | 2.133 | 2.18 | 1.769 | 2.462 | 1.792 | 2.136 | 1.777 | 2.345 | 1.642 | 1.779 |
| 80 | 2.147 | 2.195 | 1.783 | 2.477 | 1.803 | 2.15 | 1.783 | 2.359 | 1.654 | 1.798 |
| 85 | 2.159 | 2.21 | 1.8 | 2.492 | 1.814 | 2.164 | 1.787 | 2.374 | 1.667 | 1.809 |
| 90 | 2.172 | 2.224 | 1.817 | 2.508 | 1.826 | 2.179 | 1.79 | 2.388 | 1.679 | 1.822 |
| 95 | 2.185 | 2.239 | 1.837 | 2.523 | 1.837 | 2.193 | 1.791 | 2.403 | 1.691 | 1.836 |
| 100 | 2.198 | 2.257 | 1.847 | 2.541 | 1.85 | 2.21 | 1.794 | 2.421 | 1.706 | 1.853 |
| 105 | 2.212 | 2.277 | 1.867 | 2.558 | 1.863 | 2.226 | 1.794 | 2.437 | 1.719 | 1.92 |
| 110 | 2.226 | 2.292 | 1.886 | 2.576 | 1.876 | 2.243 | 1.796 | 2.455 | 1.735 | 1.906 |
Table 4.
Initialized fluid properties: viscosity of some vegetable oils (data by [28]).
Table 4.
Initialized fluid properties: viscosity of some vegetable oils (data by [28]).
| Temperature | Oil Viscosity (mPa·s) | |||||||||
|---|---|---|---|---|---|---|---|---|---|---|
| (C) | Almond | Corn | Grape Seed | Hazlenut | Olive | Peanut | Safflower | Soybean | Sunflower | Walnut |
| 35 | 43.98 | 37.92 | 41.46 | 45.55 | 46.29 | 45.59 | 35.27 | 38.63 | 41.55 | 33.72 |
| 50 | 26.89 | 23.26 | 25.27 | 27.4 | 27.18 | 27.45 | 22.32 | 23.58 | 25.02 | 21.2 |
| 65 | 17.62 | 15.61 | 16.87 | 17.83 | 18.07 | 17.93 | 14.87 | 15.73 | 16.9 | 14.59 |
| 80 | 12.42 | 10.98 | 11.98 | 12.49 | 12.57 | 12.66 | 11.17 | 11.53 | 11.99 | 10.51 |
| 95 | 9.15 | 8.56 | 9 | 9.23 | 9.45 | 9.4 | 8.44 | 8.68 | 8.79 | 8.21 |
| 110 | 7.51 | 6.83 | 10.37 | 7.56 | 7.43 | 7.47 | 6.73 | 7.17 | 7.38 | 6.71 |
| 120 | 6.54 | 6.21 | 9.18 | 6.69 | 6.49 | 6.47 | 6.22 | 6.12 | 6.57 | 5.76 |
| 140 | 5.01 | 4.95 | 7.5 | 5.25 | 5.29 | 5.14 | 4.77 | 4.58 | 4.99 | 4.8 |
| 160 | 4.02 | 3.96 | 6.1 | 4.12 | 4.13 | 3.75 | 4.11 | 3.86 | 4.01 | 3.99 |
| 180 | 3.62 | 3.33 | 4.78 | 3.48 | 3.44 | 3.26 | 3.44 | 3.31 | 3.52 | 3.46 |
Table 5.
Initialized fluid properties: thermal conductivity for peanut oil (data by [29]).
Table 5.
Initialized fluid properties: thermal conductivity for peanut oil (data by [29]).
| Temperature (C) | Thermal Conductivity (×10 cal/(s·cm·C)) |
|---|---|
| 25.19 | 2.2495 |
| 37.34 | 2.8595 |
| 46.25 | 4.332 |
| 57.89 | 4.4322 |
| 70.9 | 4.5143 |
| 86.94 | 4.9888 |
| 98.7 | 5.2728 |
| 112.28 | 5.4999 |
| 112.51 | 5.7676 |
| 129.62 | 8.2012 |
| 163.45 | 9.2963 |
| 169.77 | 9.3717 |
| 182.21 | 10.3671 |
| 185.51 | 10.6479 |
Table 6.
Initialized fitting functions coefficients.
| Coefficient | Value |
|---|---|
| 2.473 × 10 kJ/(kg·K) | |
| 1.949 kJ/(kg·K) | |
| 4.95 × 10 cal/(s·cm·C) | |
| 1.044 × 10 cal/(s·cm·C) | |
| 7665 mPa·s/(C) | |
| −1.431 | |
| −1.59 mPa·s |
Table 7.
Geometrical and operating parameters for the batch micro-reactor.
| Parameter | ID | Value | Description |
|---|---|---|---|
| Impeller speed | rpm_mixer | variable | Rotations per minute |
| Reactor height | h_react | 0.1 m | Used to compute h |
| Start time | t_0 | 0 s | Simulation start time |
| Time step | t_step | variable | Sampling time step |
| End time | t_end | variable | Simulation end time |
| Rector radius | r_react | 0.06 m | Inner radius of the micro-reactor |
| Reactor wall width | s_react | 0.002 m | Width of the micro-reactor wall |
| Heater x coordinate | x_heater | 0.03 m | x position of the heater |
| Heater y coordinate | y_heater | 0.03 m | y position of the heater |
| Immersion heater radius | r_heater | 0.008 m | Radius of the heater |
| Impeller blade radius | pA_blade | 0.02 m | Radius of the impeller blade |
| Heater temperature | T_heater | 60 C | T of the immersion heater outline |
© 2017 by the authors. Licensee MDPI, Basel, Switzerland. This article is an open access article distributed under the terms and conditions of the Creative Commons Attribution (CC BY) license (http://creativecommons.org/licenses/by/4.0/).
Share and Cite
MDPI and ACS Style
Carlini, M.; Castellucci, S.; Mennuni, A. Thermal and Fluid Dynamic Analysis within a Batch Micro-Reactor for Biodiesel Production from Waste Vegetable Oil. Sustainability 2017, 9, 2308. https://0-doi-org.brum.beds.ac.uk/10.3390/su9122308
AMA Style
Carlini M, Castellucci S, Mennuni A. Thermal and Fluid Dynamic Analysis within a Batch Micro-Reactor for Biodiesel Production from Waste Vegetable Oil. Sustainability. 2017; 9(12):2308. https://0-doi-org.brum.beds.ac.uk/10.3390/su9122308
Chicago/Turabian StyleCarlini, Maurizio, Sonia Castellucci, and Andrea Mennuni. 2017. "Thermal and Fluid Dynamic Analysis within a Batch Micro-Reactor for Biodiesel Production from Waste Vegetable Oil" Sustainability 9, no. 12: 2308. https://0-doi-org.brum.beds.ac.uk/10.3390/su9122308
Note that from the first issue of 2016, this journal uses article numbers instead of page numbers. See further details here.