
Analysis of the Performance of Vacuum Glazing in Office Buildings in Korea: Simulation and Experimental Studies

1
Korea Institute of Energy Research, 152 Gajeong-ro, Yuseong-gu, Daejeon 34101, Korea
2
Department of Architectural Engineering, Graduate School of Yeungnam University, 280 Daehak-ro, Gyeongsan 38541, Korea
*
Author to whom correspondence should be addressed.
Sustainability 2017, 9(6), 936; https://0-doi-org.brum.beds.ac.uk/10.3390/su9060936
Submission received: 15 March 2017
/
Revised: 29 May 2017
/
Accepted: 31 May 2017
/
Published: 2 June 2017
(This article belongs to the Special Issue Sustainability Assessments of Buildings)
Abstract
:Window performance in buildings is very important for energy saving. Many efforts have been made towards saving energy in buildings, and research has focused attention on enhancing the thermal performance of windows. Vacuum glazing has attracted much interest as a means of enhancing the thermal performance of windows by strengthening insulation performance. However, the performance of vacuum glazing differs based on various component combinations, therefore, further study on vacuum glazing is needed. In this paper, through simulations, the authors confirmed the heat transfer value (U-value) of the vacuum glazing composed of various combinations (glass type, number of layers, interval of pillar, etc.). A physical test of vacuum glazing was also performed using standard test methods of windows and the U-value of the vacuum glazing by various intervals of the pillar position was confirmed. The simulation revealed a U-value for vacuum glazing of 0.682–1.466 W/m2·K as per the interval of the pillar position, the performance of solar heat gain, and visible light transmission. The U-value of the double vacuum glazing was calculated as 0.607–1.154 W/m2·K and was similar regardless of the interval of pillar position, the performance of solar heat gain, and visible light transmission. Based on the results of the energy simulation, in the case of a used low U-value of vacuum glazing, the heating and cooling energy consumption in buildings decreased by 2.46%, than when low-e glass and argon gas filled layers were used in windows. Furthermore, in double vacuum glazing, the heating and cooling energy consumption in buildings decreased by 3.91%.
1. Introduction
The thermal performance of a building envelope has been greatly improved through research. Particularly with large sized windows in buildings, improvements in thermal insulation performance must be considered by the replacement of windows for energy saving. As windows have lower thermal insulation performance than the general material of the frame structure or exterior material, designers and builders should consider improving the thermal insulation performance of the frame and glazing. In addition, the installation of windows must avoid thermal bridges to improve the thermal performance of the windows. However, as the glazing structure is not simple, the window properties need to be considered. The glazing of windows is a transmission body, which affects the energy consumption of buildings. Therefore, the performance of windows should be reviewed by designers or builders in the design phase [1].
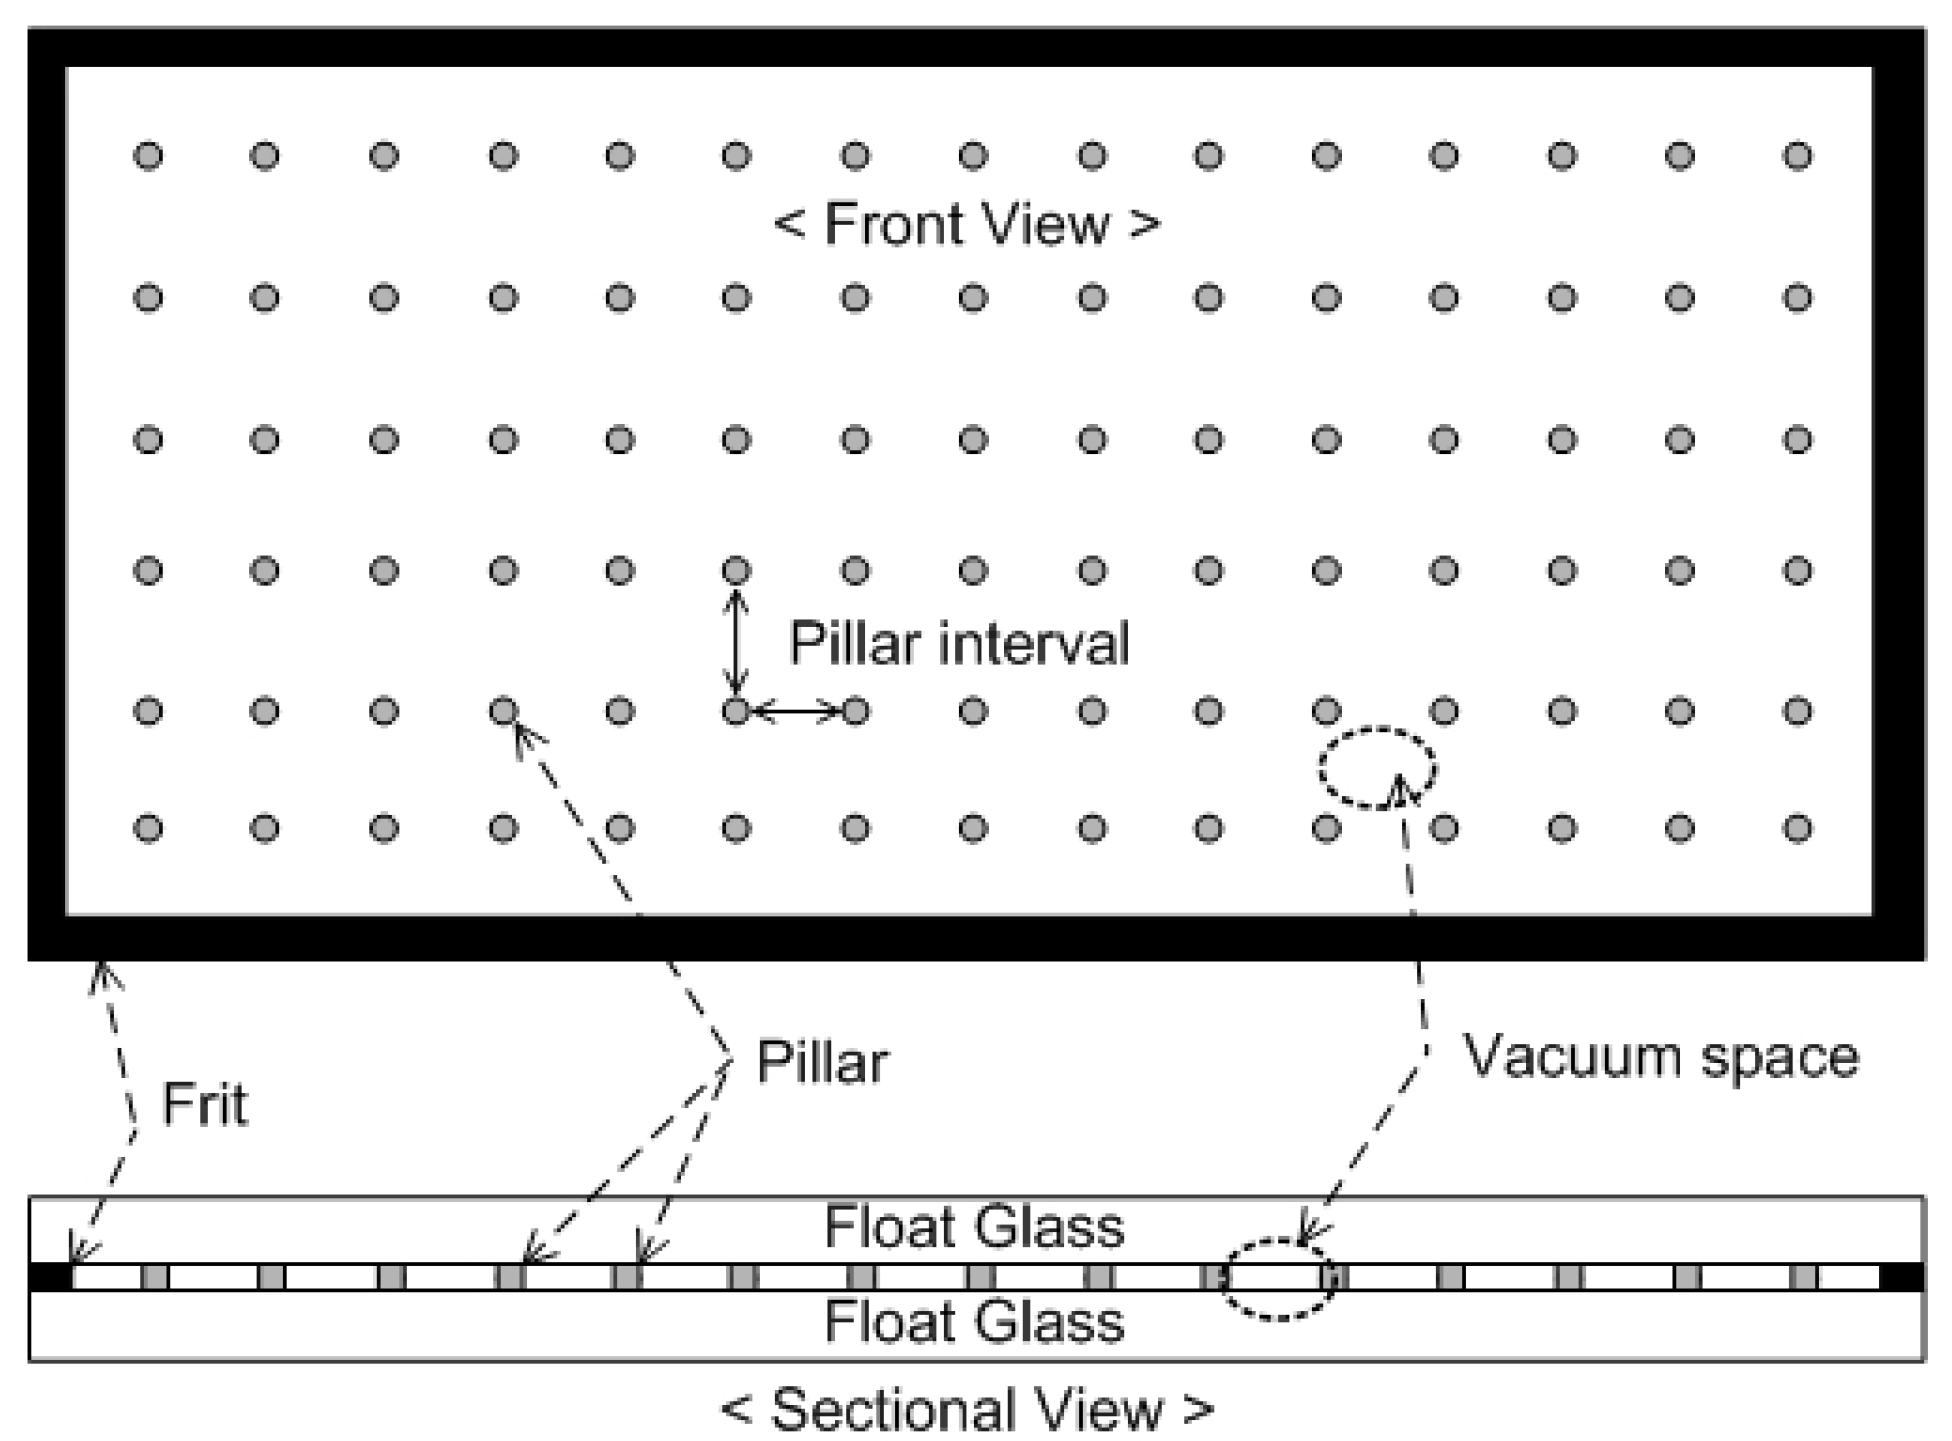
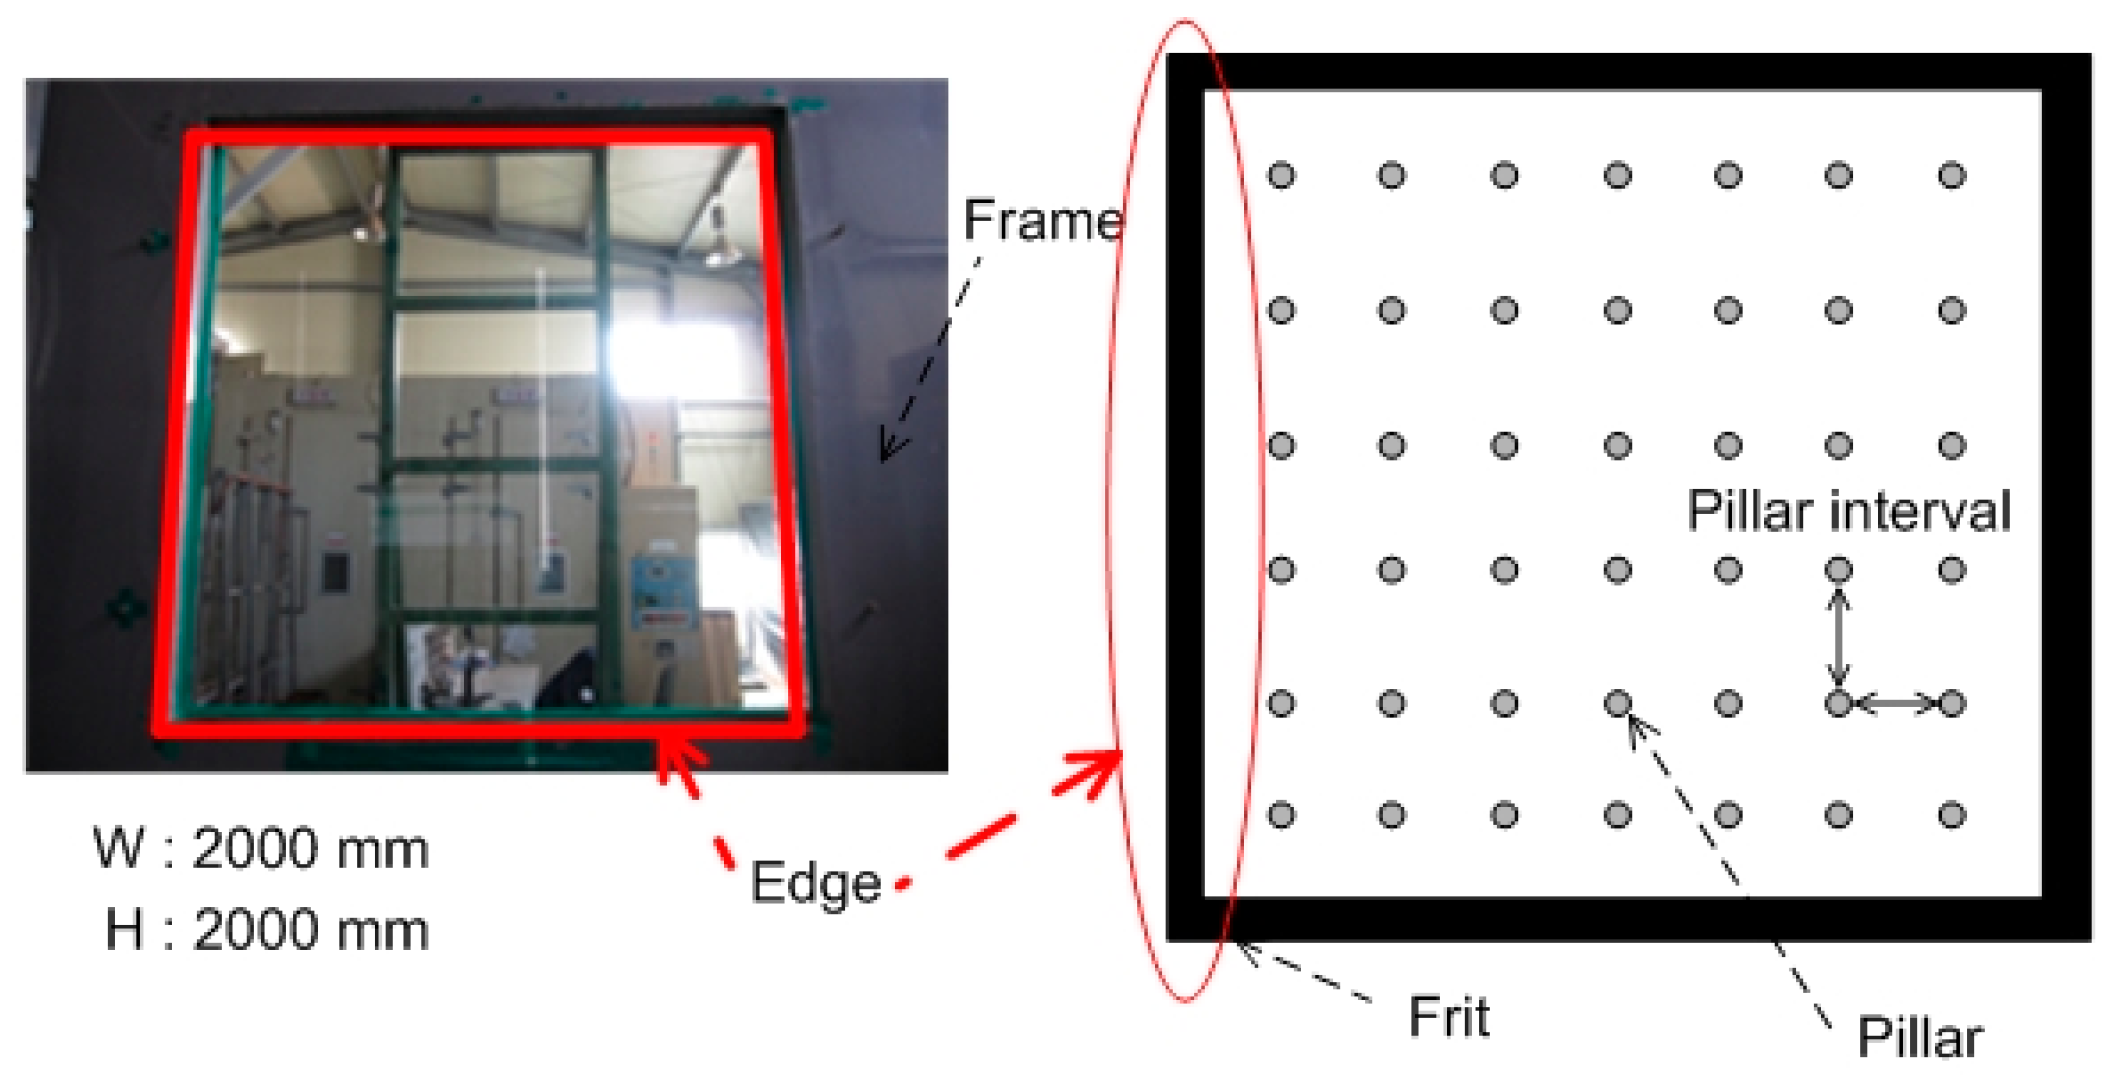
Vacuum glazing eliminates the heat transfer between the two float glass panes by the internal vacuum gap [2]. Vacuum glazing was used on the exterior window, which required a high thermal insulation performance. Glazing performance is dependent on glass type and the components of glazing. In particular, the performance of vacuum glazing can be changed by the pillar interval and the number of pillars at the vacuum gap to maintain the vacuum gap between the two float glass panes [3]. The pillar resists atmospheric pressure by supporting the float glass. However, the interval of pillar cannot be long as the weight will increase through a high degree of vacuum. Figure 1 shows a schematic diagram of vacuum glazing.
Fang et al. [4] performed an experimental evaluation of air-gap, low-e coating, and vacuum glazing and investigated the effect of the vacuum glazing gap difference and confirmed the U-value of vacuum glazing. Collins et al. [5] performed similar research to Fang where they conducted experiments of vacuum glazing construction by its manufacture in a laboratory. They found that the low heat transfer coefficients of vacuum glazing were related to edge insulation, edge constraints and low emissivity coatings of glass. Menz et al. [6] also conducted experimental work where they investigated the variation of the pillars in vacuum glazing and determined that the U-value of vacuum glazing decreased with increasing pillar interval. Therefore, the authors confirmed that the influence of the pillars in vacuum glazing is important for its thermal performance. Cue et al. [7] performed a theoretical study of the vacuum glazing performance by performing CFD on the vacuum glazing developed in commercial products. Their results showed that the material of the pillars (like an aerogel) had positive effects on low heat transfer through different temperatures. Erdem et al. [8] reviewed the recent developments and future prospects of vacuum glazing. Through these studies, many have confirmed the evaluation of performance through experimental, theoretical, numerical, and simulations. Similar to these studies, state-of-the-art vacuum glazing technology has been researched.
In Korea, previous study has confirmed the variation of the heat transfer value (U-value) based on glass thickness, coating and type of gas [9]. Baek [10] confirmed the difference based on the type of glass and gas through simulation analysis where the pillars for maintaining the vacuum space affected the U-value of the vacuum glazing. Thus, the interval of the pillar needs to be chosen carefully for the tensile stress of glass, which means that the spacing of the pillars must be adequate [11].
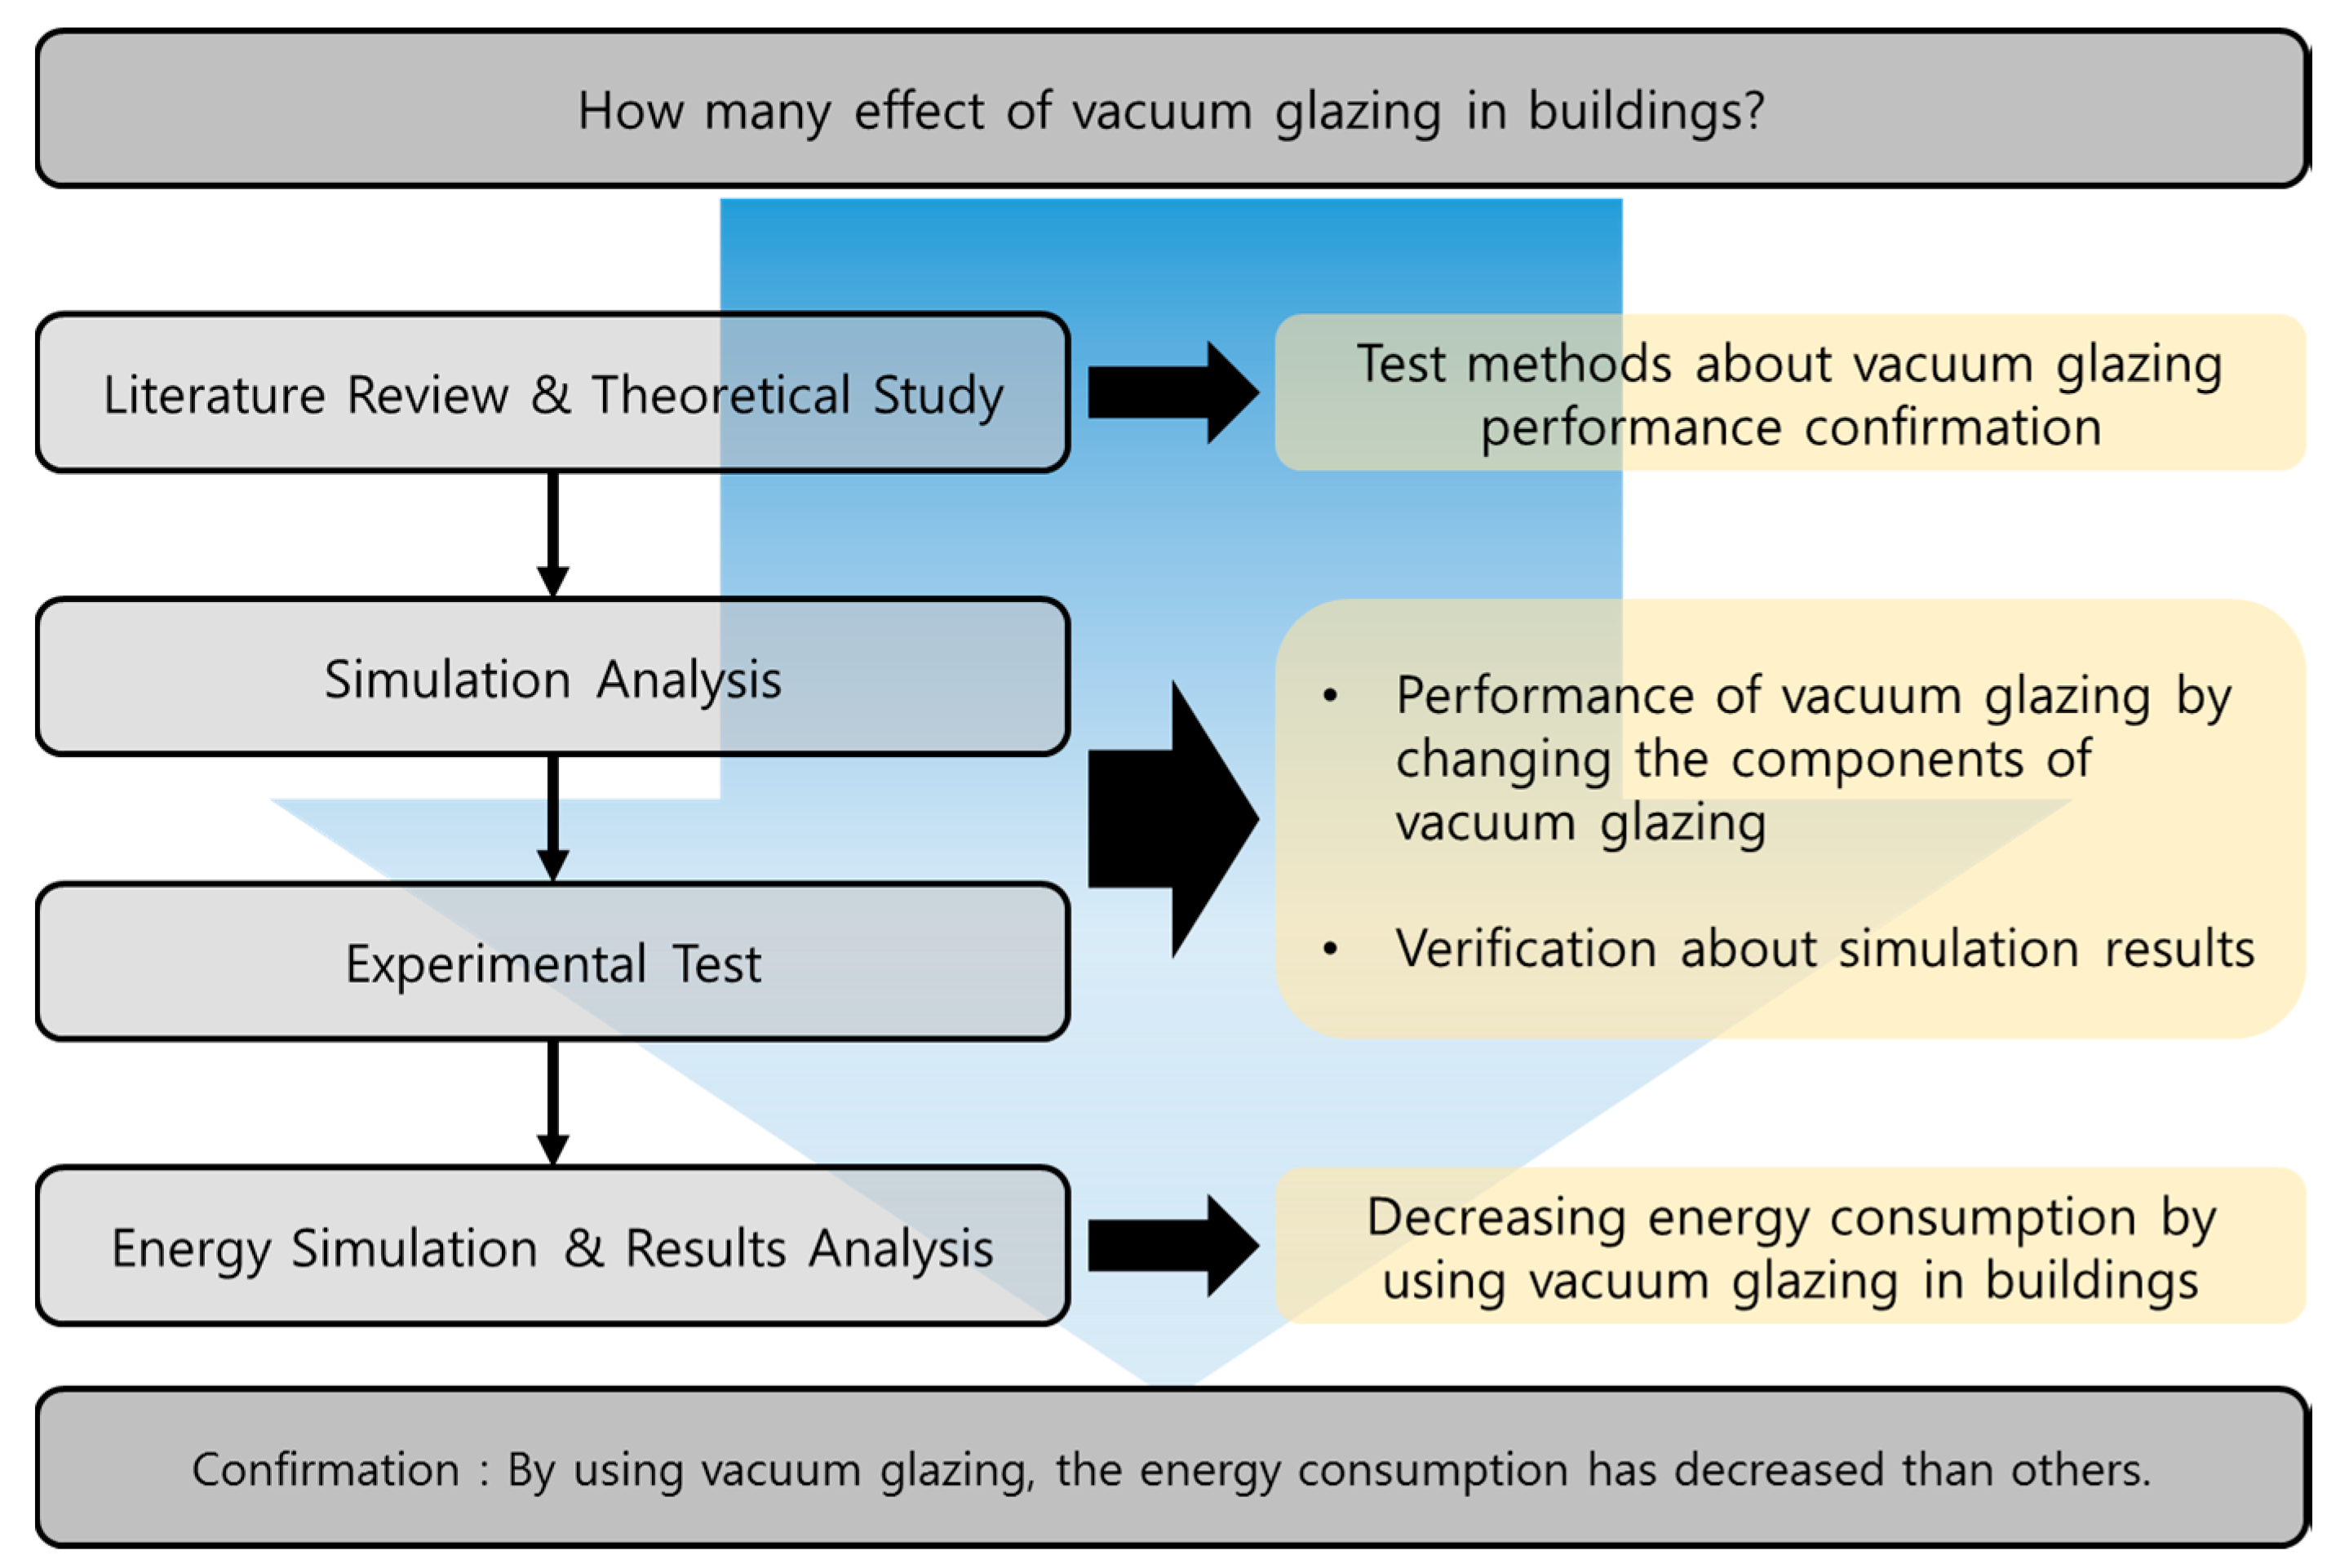
In this study, our research had two phases of simulations and experiment studies to analyze the performance of vacuum glazing where the authors confirmed the effects of various vacuum glazing performance on building energy consumption through energy simulation. Through the simulation, the authors confirmed the heat transfer value (U-value) of vacuum glazing through various component combinations (glass type, number of layer, interval of pillars, etc.). In addition, a physical test was performed for a comparison of the simulation results. These results were also applied to an energy simulation. Finally, the authors examined the effects of changing the performance of vacuum glazing in building energy consumption. Figure 2 shows the method of this research and flow chart.
2. Performance Variation of the Vacuum Glazing by Components Difference
Vacuum glazing has a high thermal insulation performance via a vacuum gap between two float glass panes. For a consistent vacuum gap, pillars are arranged as a support between two float glass panes. The heat flow is blocked by increasing the degree of vacuum. In addition, thermal performance is dependent on the variation of the glass type and the arrangement of the pillars. To confirm performance variation through changes to the vacuum glazing components, the thermal performance and SHGC were examined by changing the glass type and the pillar interval via a simulation tool.
2.1. Simulation Analysis
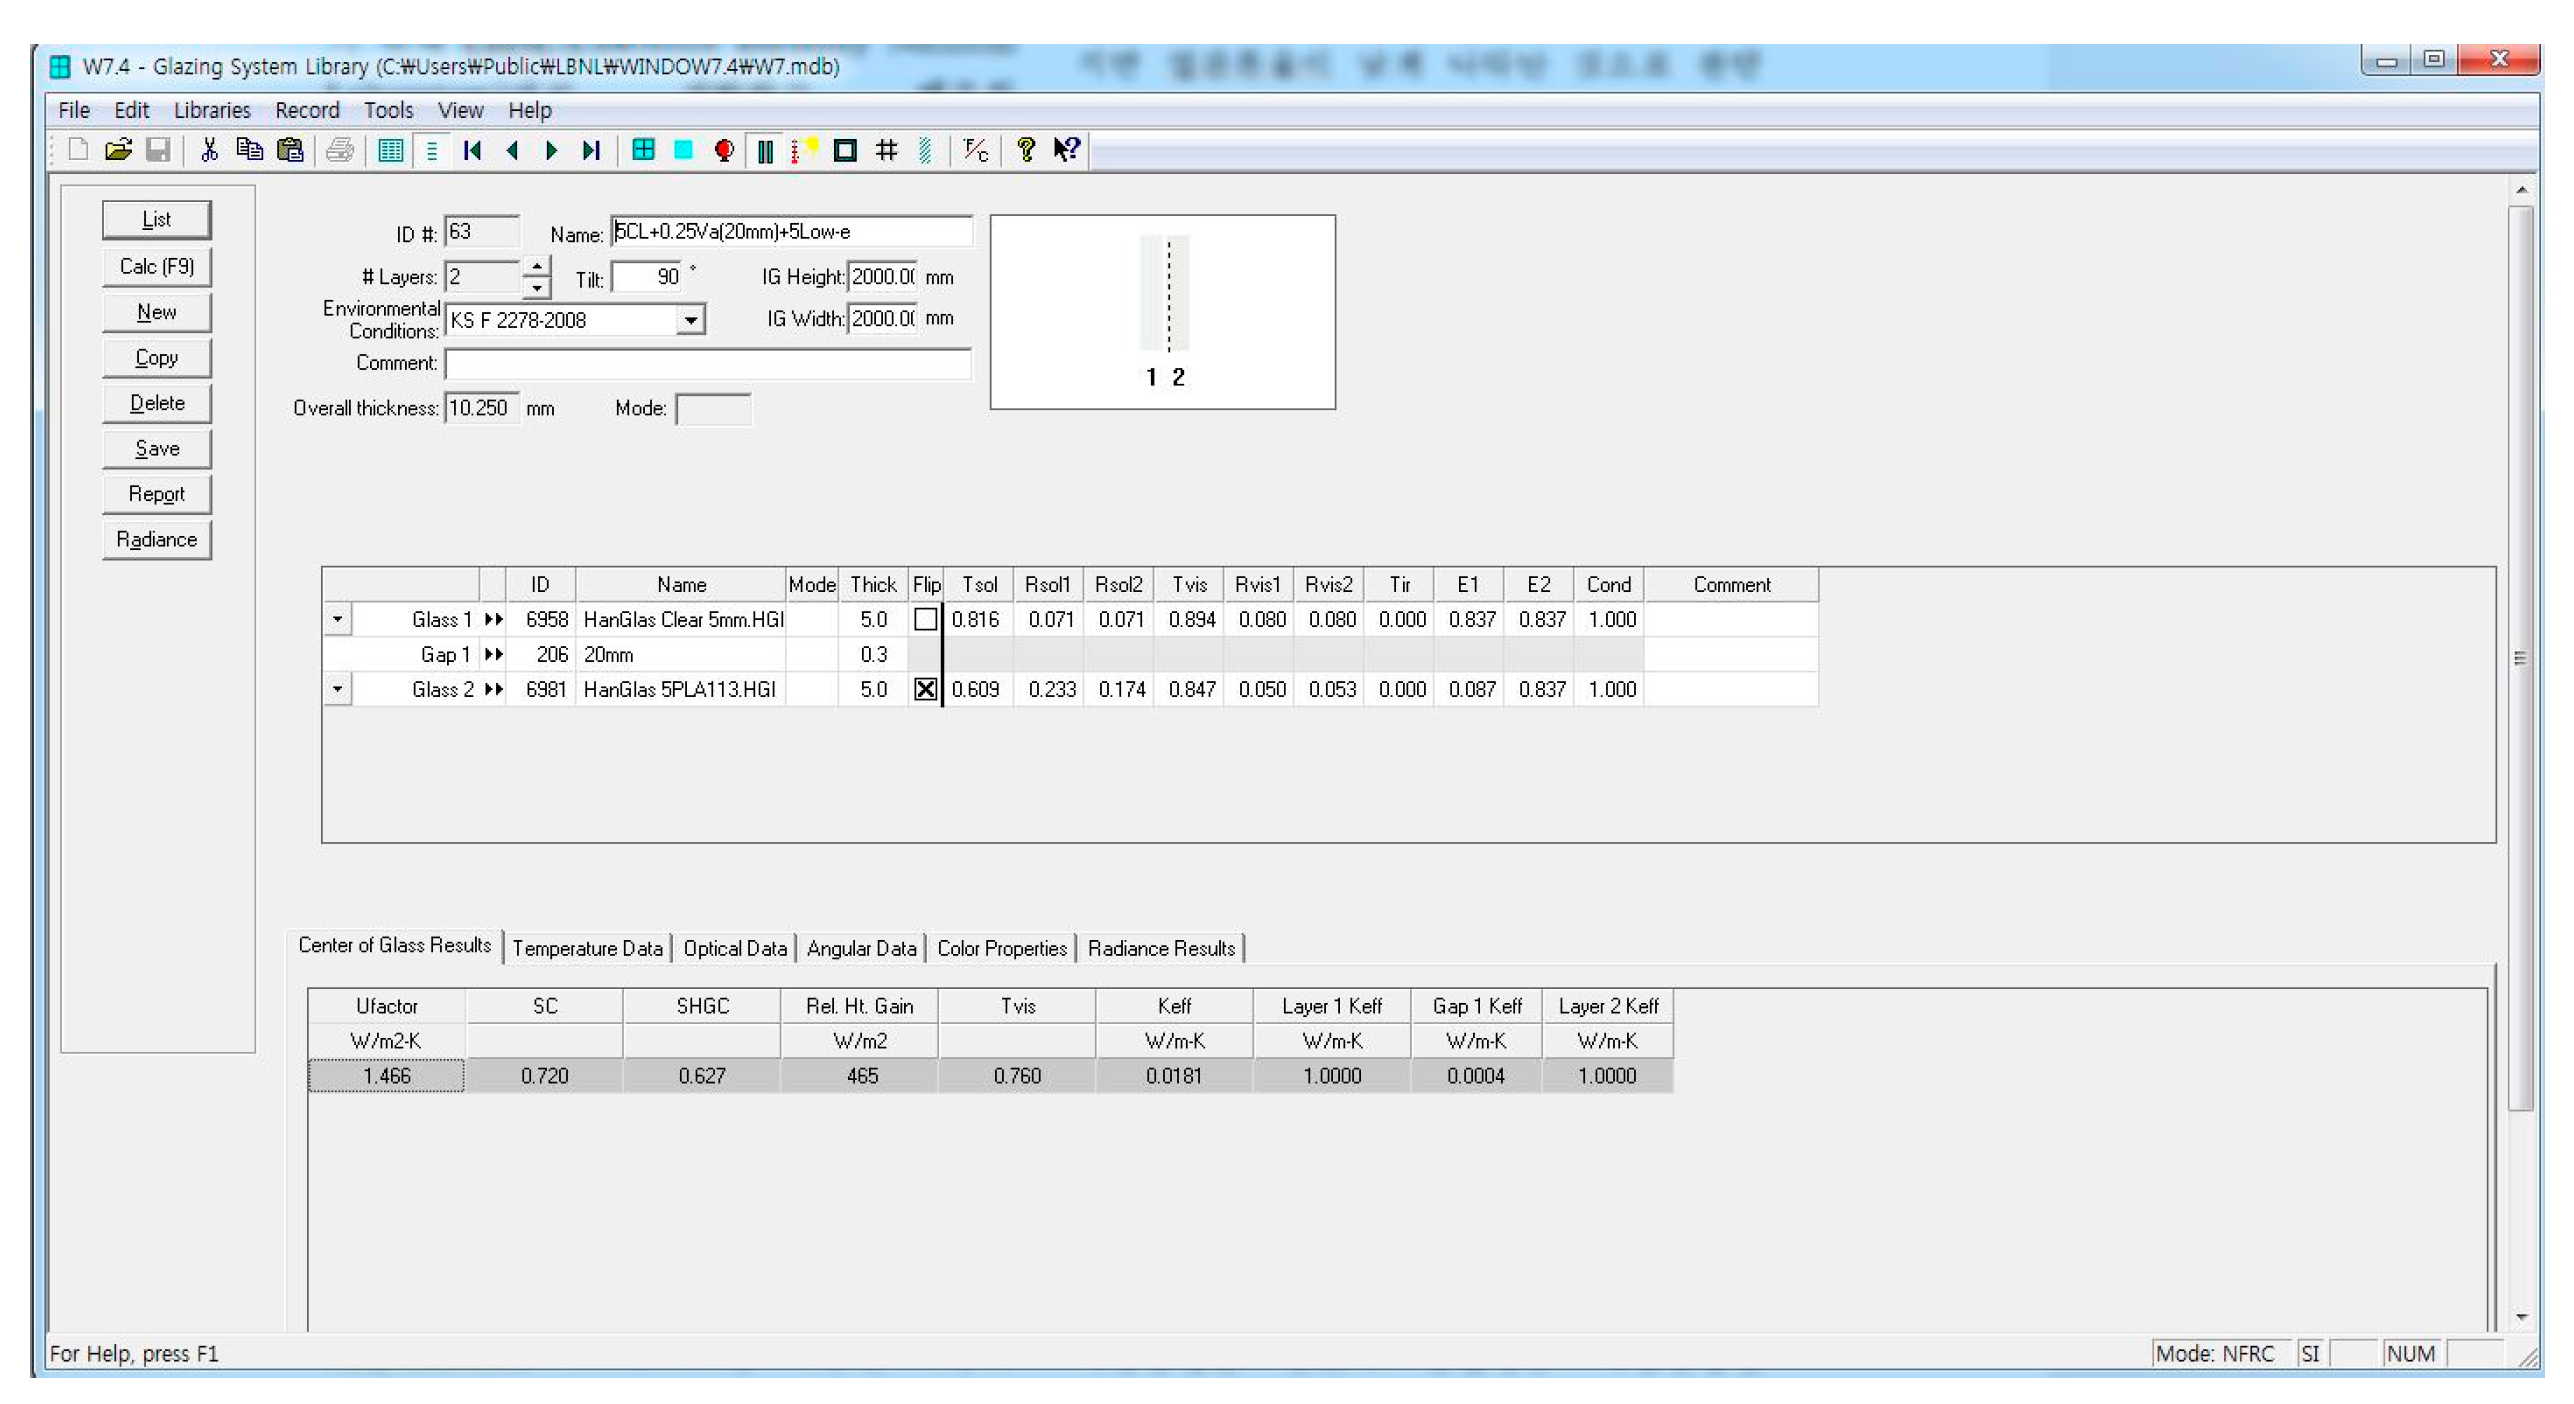
In this chapter, authors used a WINDOW simulation tool that was developed and released by LBNL (Lawrence Berkeley National Laboratory) and that simulates the performance of a window (like a U-value, SHGC, etc.). In addition, this program contains the International Glass Data Base (IGDB), which supplies information on the glass from the glass manufacturer. Recently, WINDOW was updated to include vacuum glazing calculations and vacuum glazing performance calculation results were reported [12]. Figure 3 is a screenshot of the simulation tool.
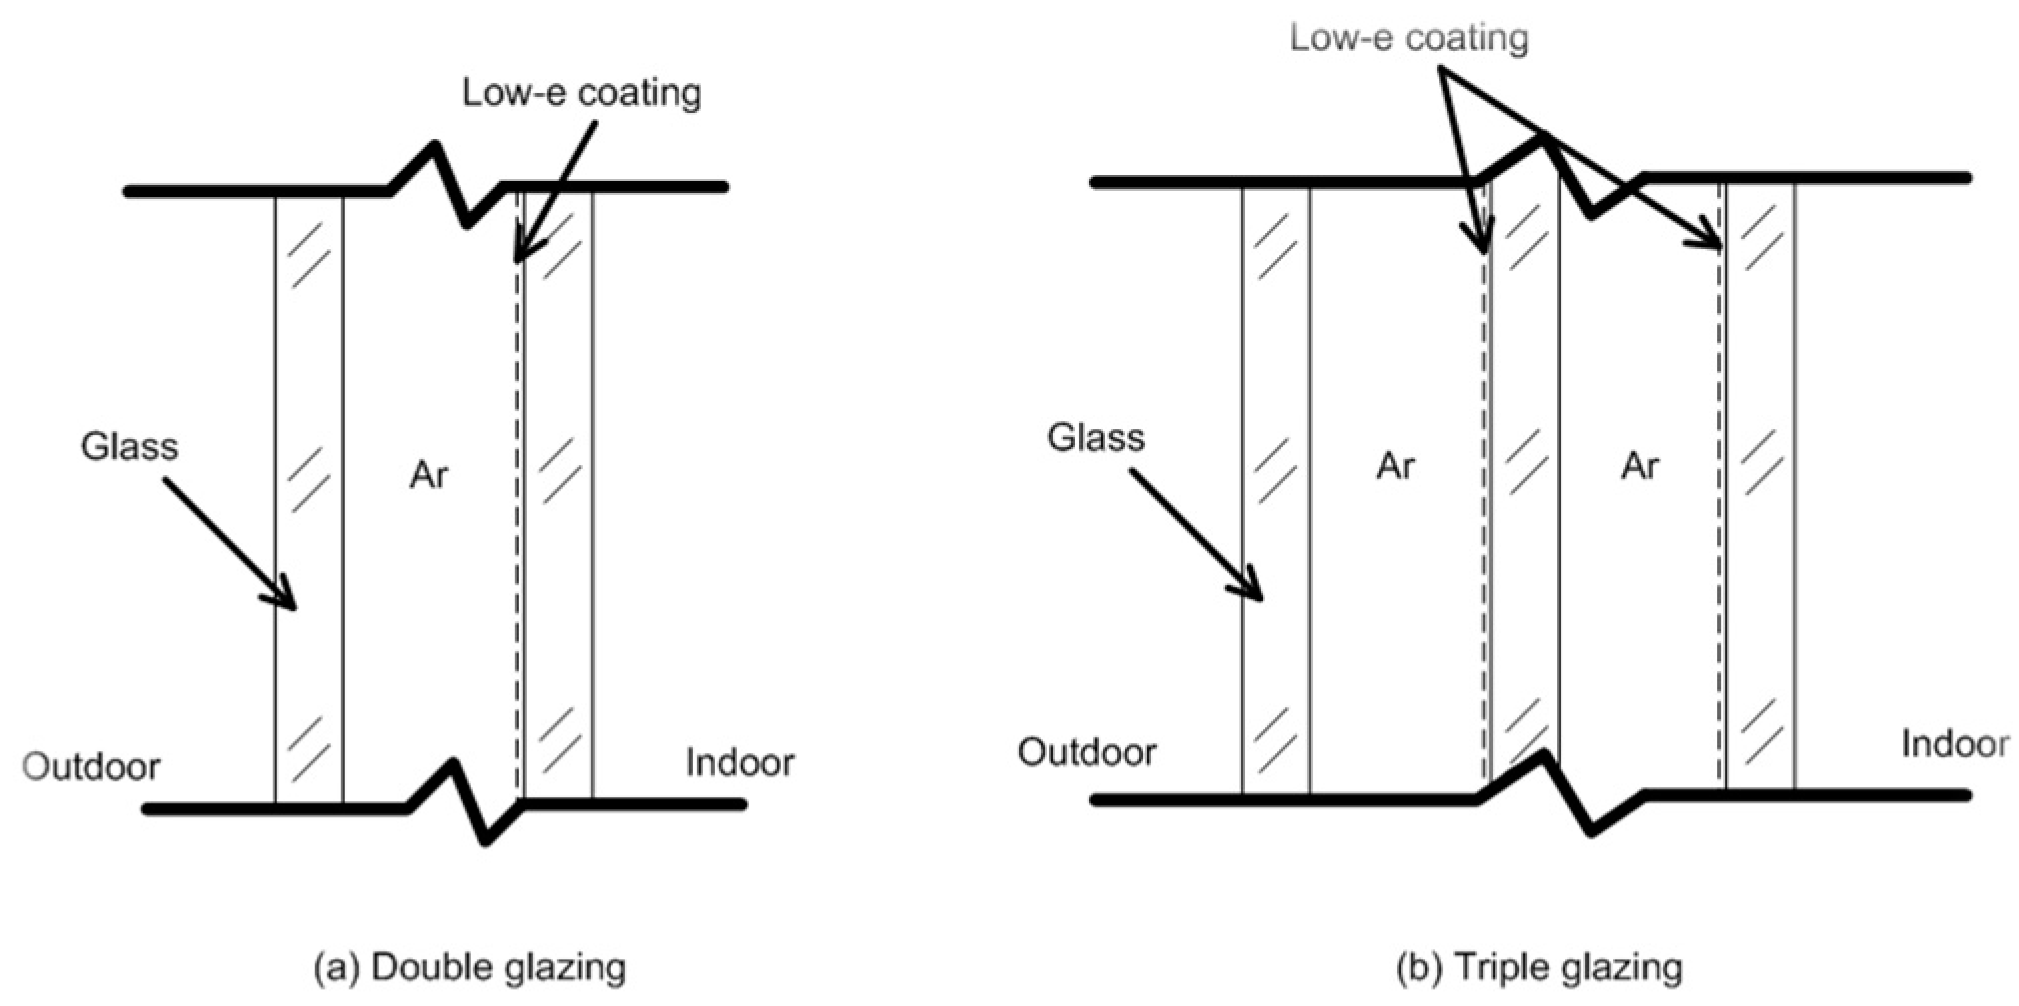
To compare the performance of double glazing and vacuum glazing, the authors modeled double glazing using low emissivity glass and filled the gap between the two float glass panes with argon gas. Triple glazing was also modeled. Vacuum glazing constituted of double glazing (following vacuum glazing) and triple glazing (following double vacuum glazing), which contained functional glass (or low-e glass), an air gap to resist breaking and clear glass. The glass in all cases was obtained from HanGlas. The interval of the pillars between the two float glass panes was set as 20 mm, 25 mm, 30 mm, 40 mm, and 50 mm. The size of the specimen was 2000 mm (W) × 2000 mm (H).
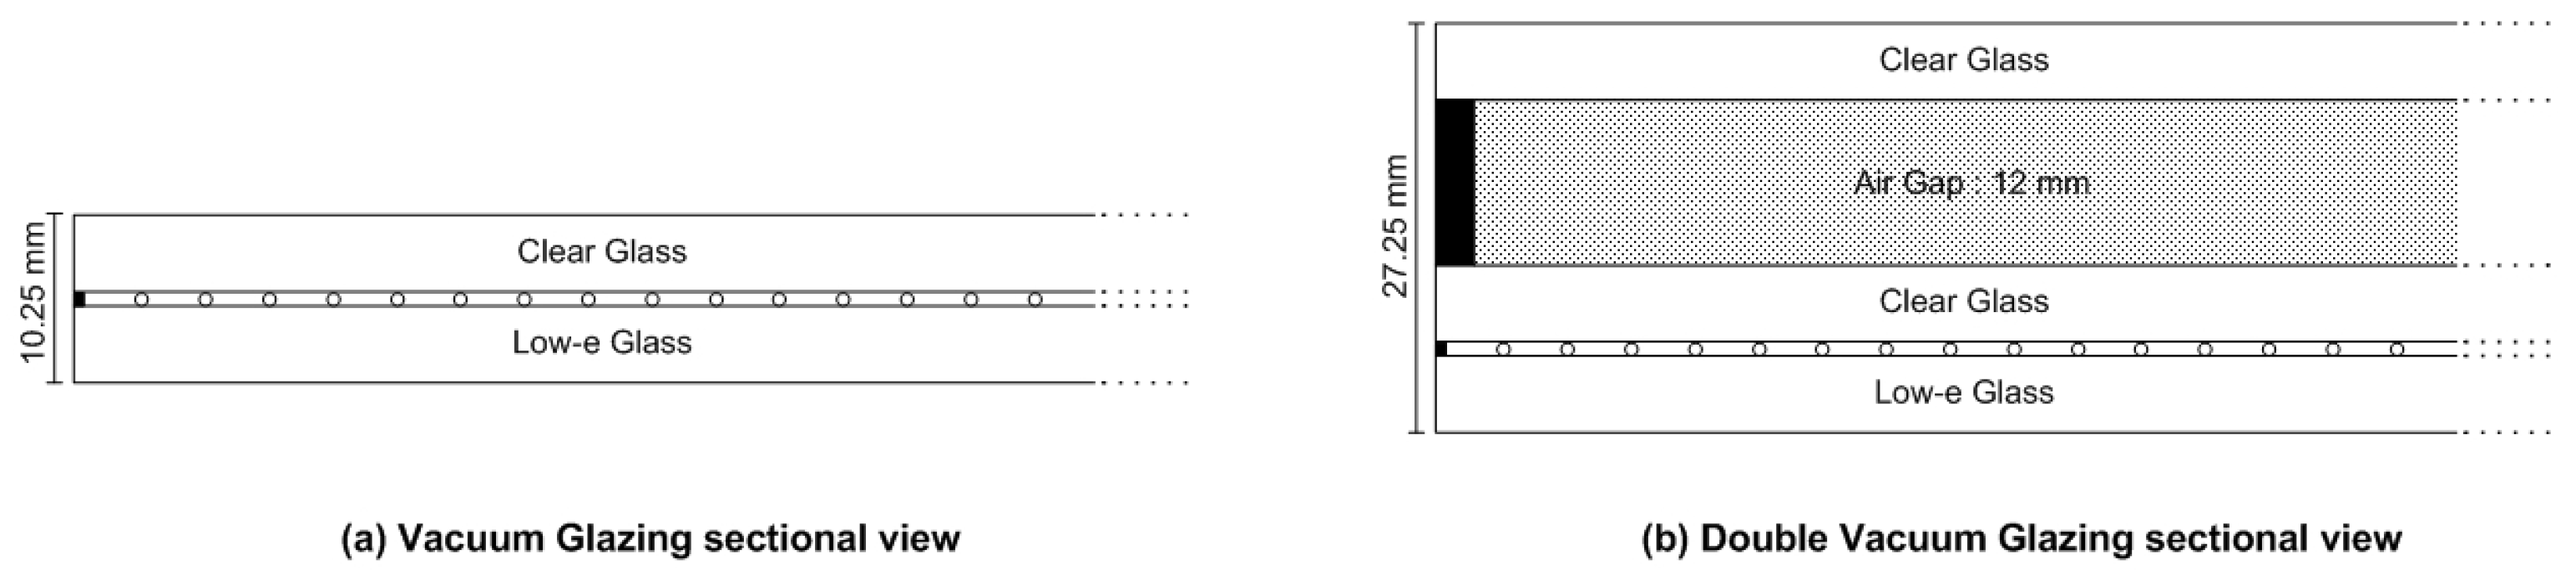
The environmental conditions were set to 20.0 °C for the indoor air temperature, 9.091 W/m2·K for the indoor surface convection heat transfer coefficient, 0.0 °C for the outdoor air temperature, and 20.0 W/m2·K for the outdoor surface convection heat transfer coefficient based on KS F 2278 [13]. Figure 4 shows a double glazing and triple glazing scheme, while Figure 5 shows a vacuum glazing sectional view. Table 1 presents the simulation information of WINDOW 7.4, and Table 2 displays the glazing simulation case.
2.2. Change in Performance through Different Components of Vacuum Glazing
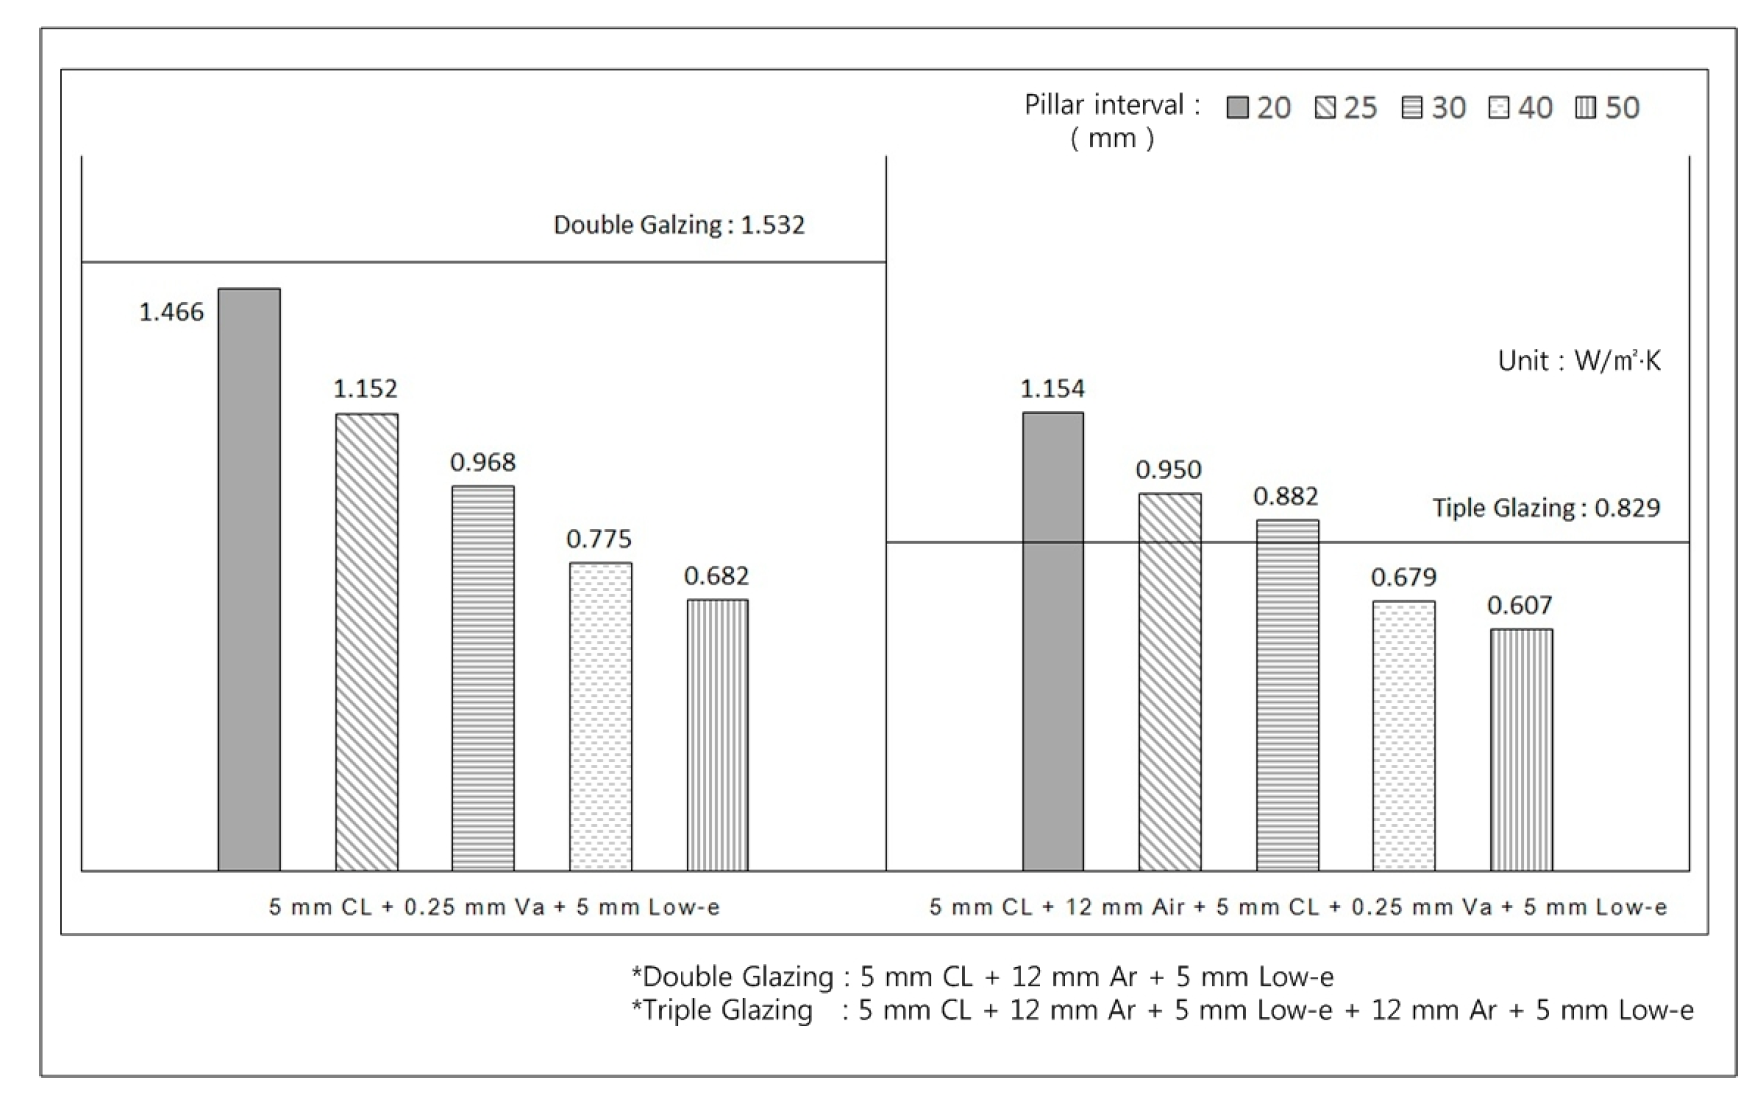
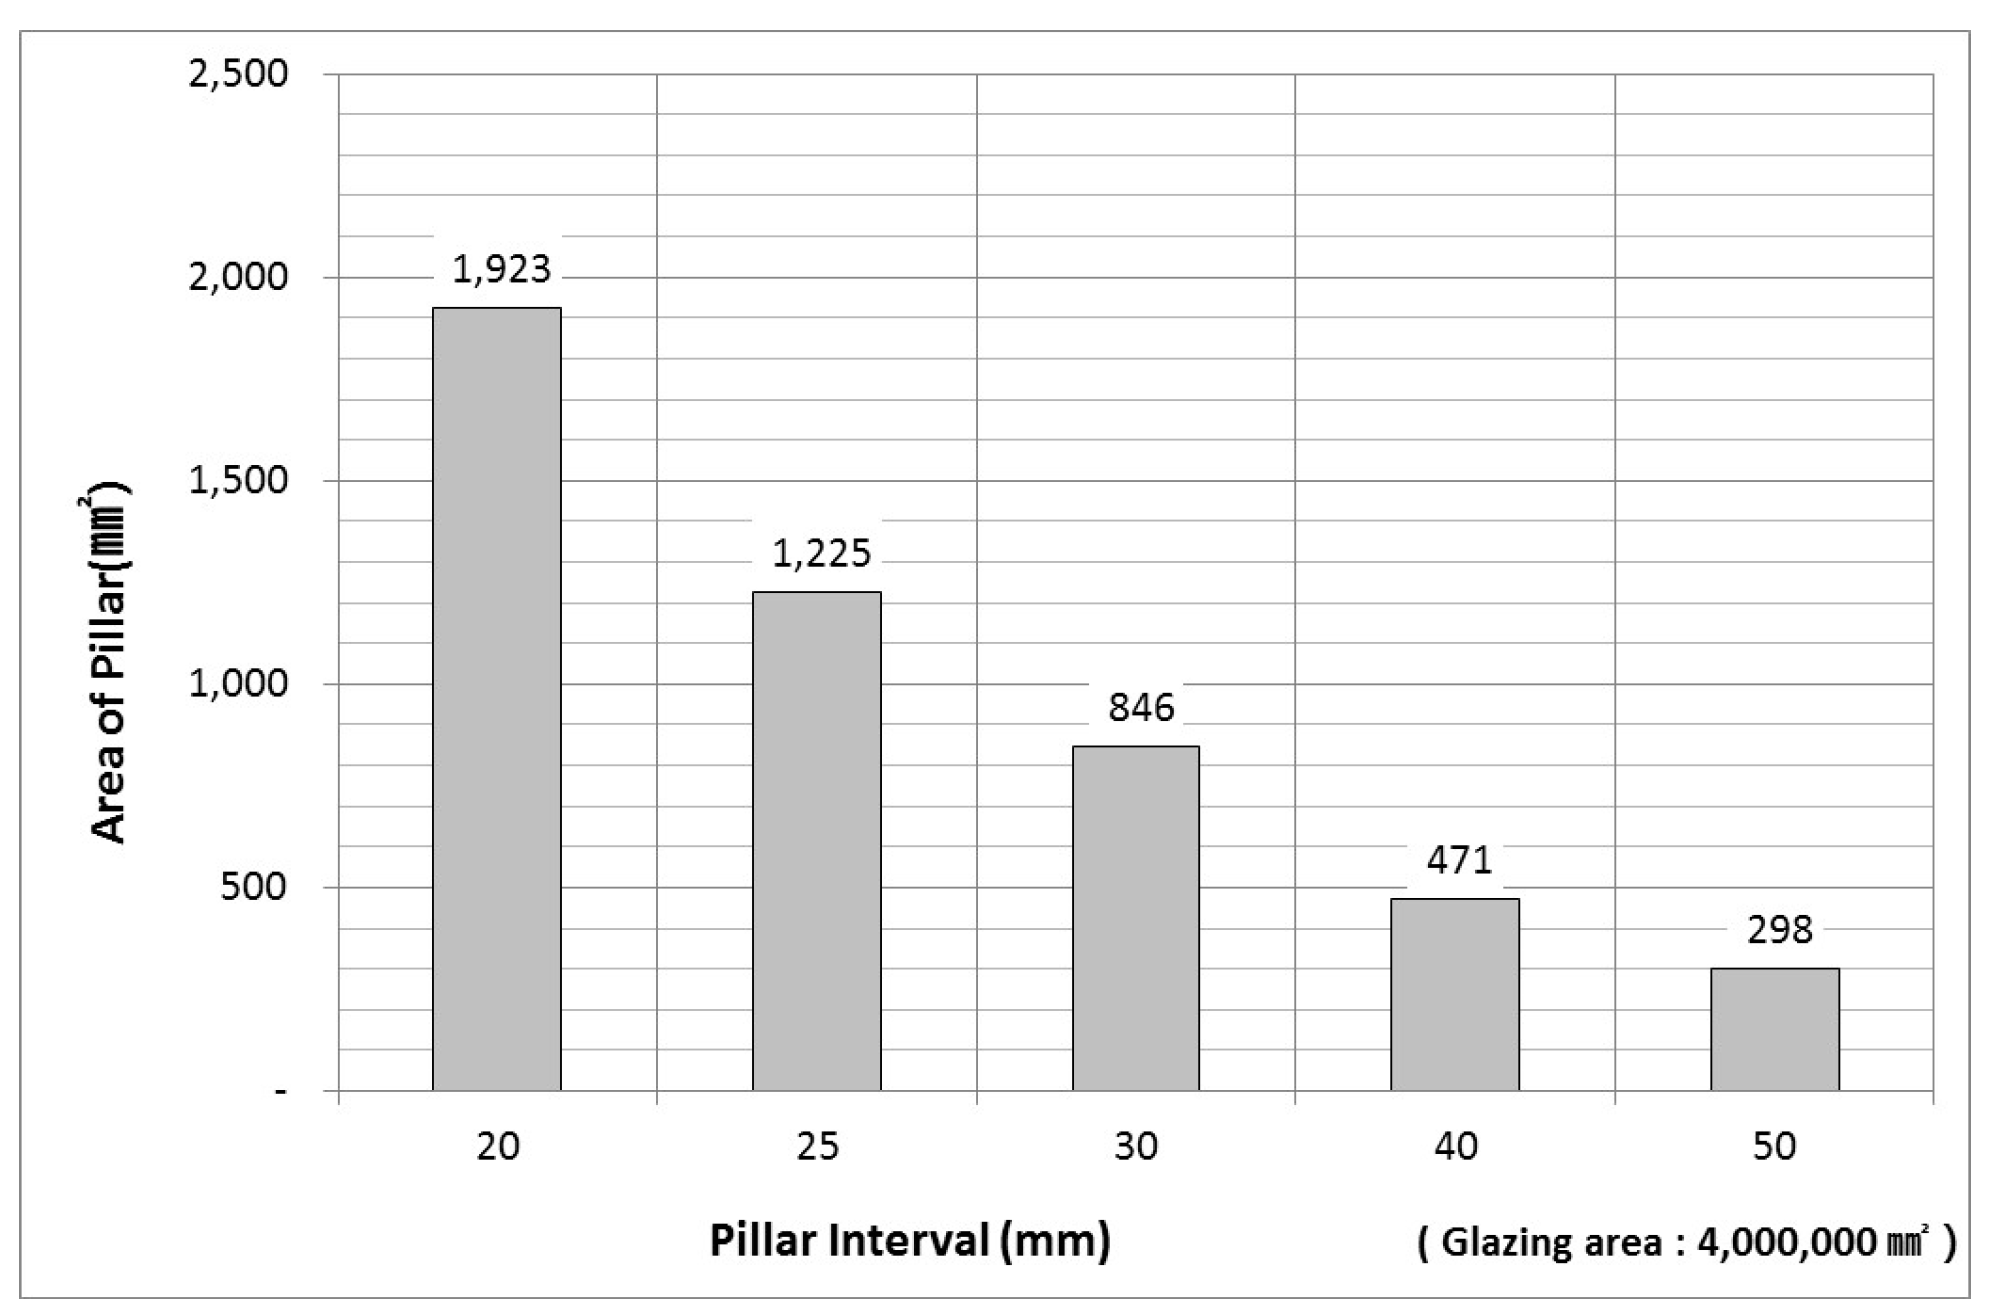
The U-value of double glazing and triple glazing from the simulation results was 1.532 W/m2·K and 0.829 W/m2·K, respectively. In addition, the SHGC was 0.626 and 0.520, respectively. The U-value of the vacuum glazing was 0.682 W/m2·K–1.466 W/m2·K depending on the pillar interval. The U-value of the double vacuum glazing was 0.607 W/m2·K–1.154 W/m2·depending on the pillar interval. Overall, the U-value decreased with increasing intervals of the pillar, which means that the pillar affects heat flow through vacuum glazing. Therefore, as the pillar was made of stainless steel, the heat flow was brisker at the pillar contact with the glass. Thus, a long pillar interval had a smaller surface at the glass as the area of the pillar touching the glass was smaller than the entire size of the specimen, so the area of the pillar decreased by 84% by changing the interval of the pillars from 20 mm to 50 mm.
Figure 6 presents the results of the simulation and Figure 7 shows the pillar area of the vacuum glazing. As the performance comparison had a low-e coating glazing (double glazing and triple glazing) and vacuum glazing, from Figure 6, the U-value of the vacuum glazing was lower by 4–55% than double glazing. Fang et al. [14] have already confirmed that the use of single high performance low-emittance coating in a vacuum glazing provides excellent performance. However, in the case of double vacuum glazing under a 40 mm pillar interval, the U-value did not decrease more than triple glazing. Thus, the U-value of the double vacuum glazing of 40 mm and 50 mm pillar interval was lower than the U-value of triple glazing by 18% and 27%, respectively. With these results, it was expected that pillar interval was important to decreasing the U-value of vacuum glazing; in the case of double vacuum glazing, a pillar interval of more than 40 mm was required to replace triple glazing.
3. Experimental Test of Vacuum Glazing
From previous simulation results, the authors confirmed that the pillar interval affects the U-value of vacuum glazing. Wilson et al. [15] demonstrated that the thermal resistances associated with the heat flow through individual pillars, and through the pillar array, are calculated using a simple analytic method and by more complex finite element models. However, they did not confirm the thermal performance of whole glazing. To confirm the simulation analysis, an experimental physical test was performed to measure the U-value of vacuum glazing with various pillar intervals.
3.1. Thermal Performance Test through KS F 2278
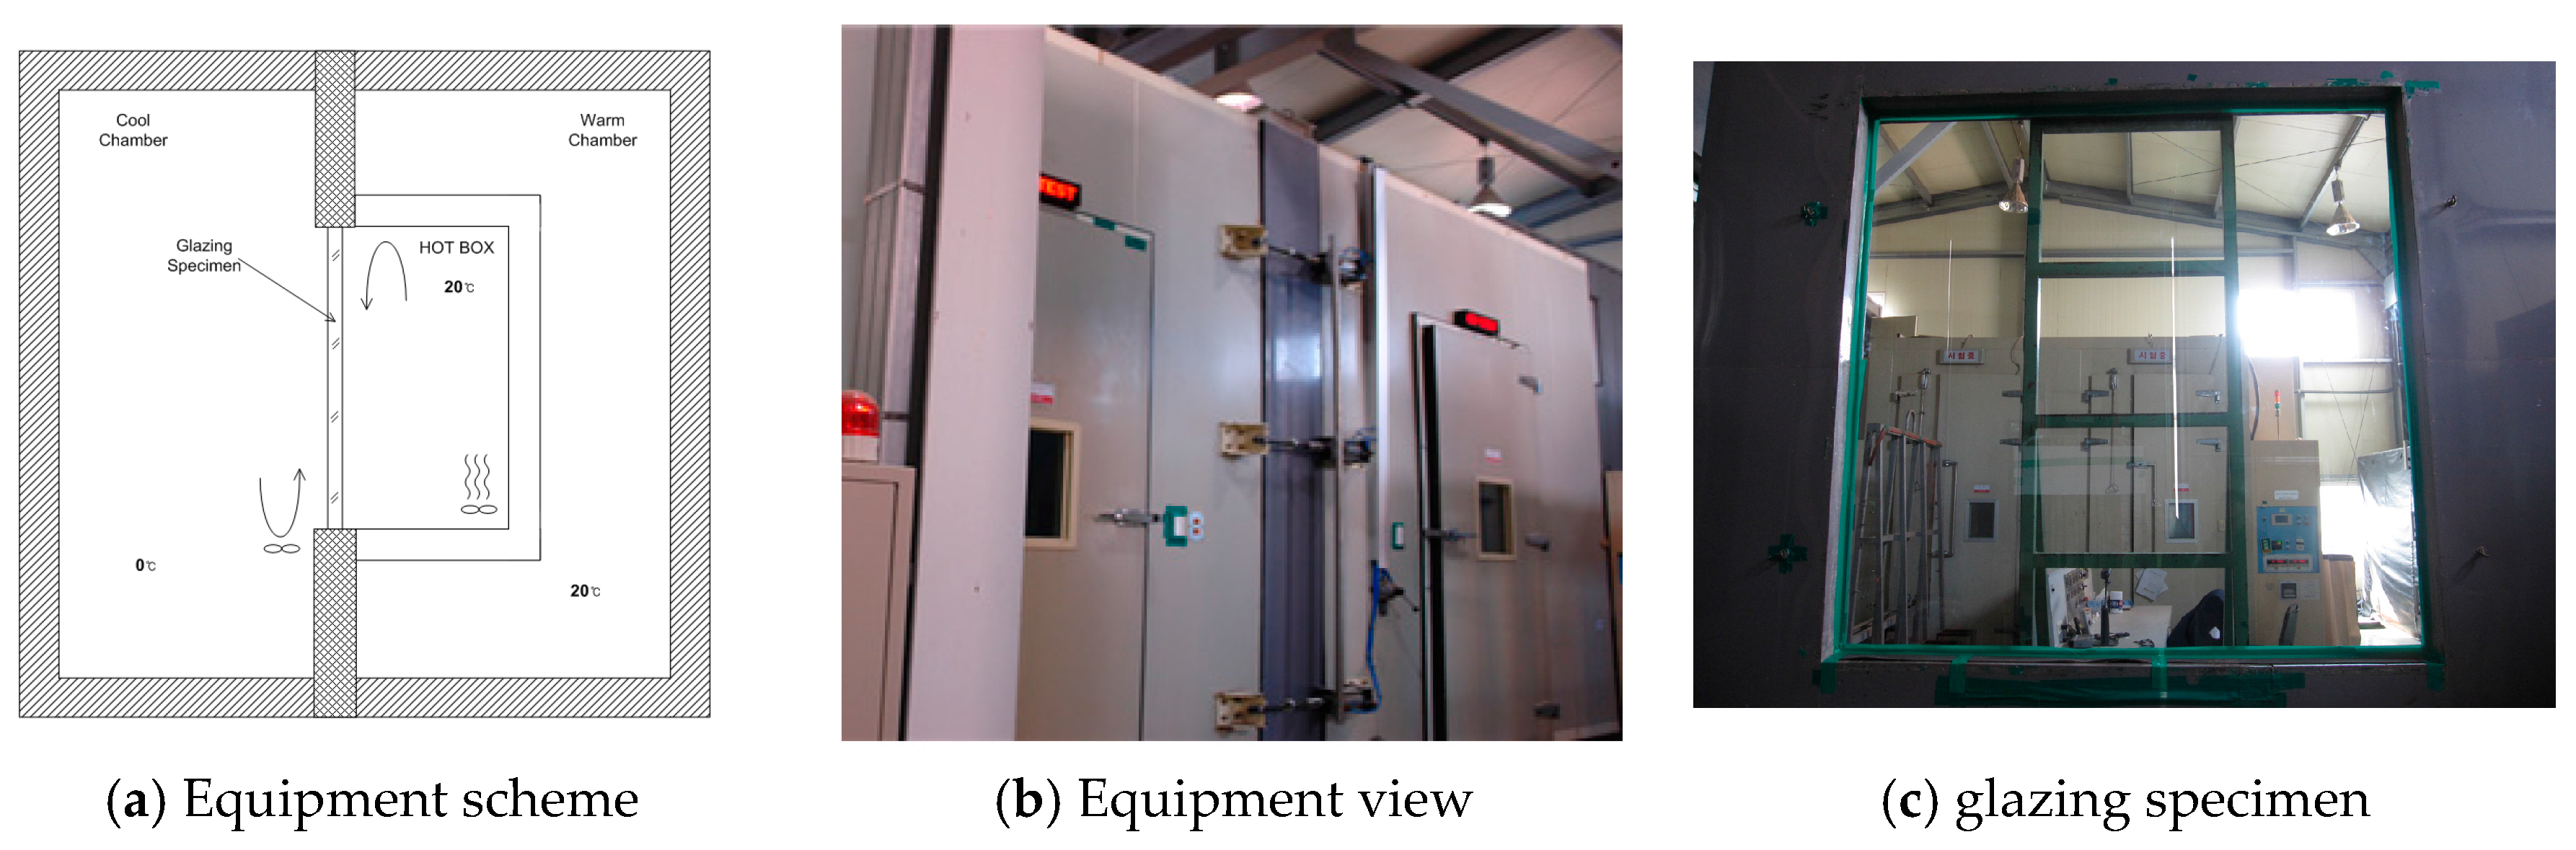
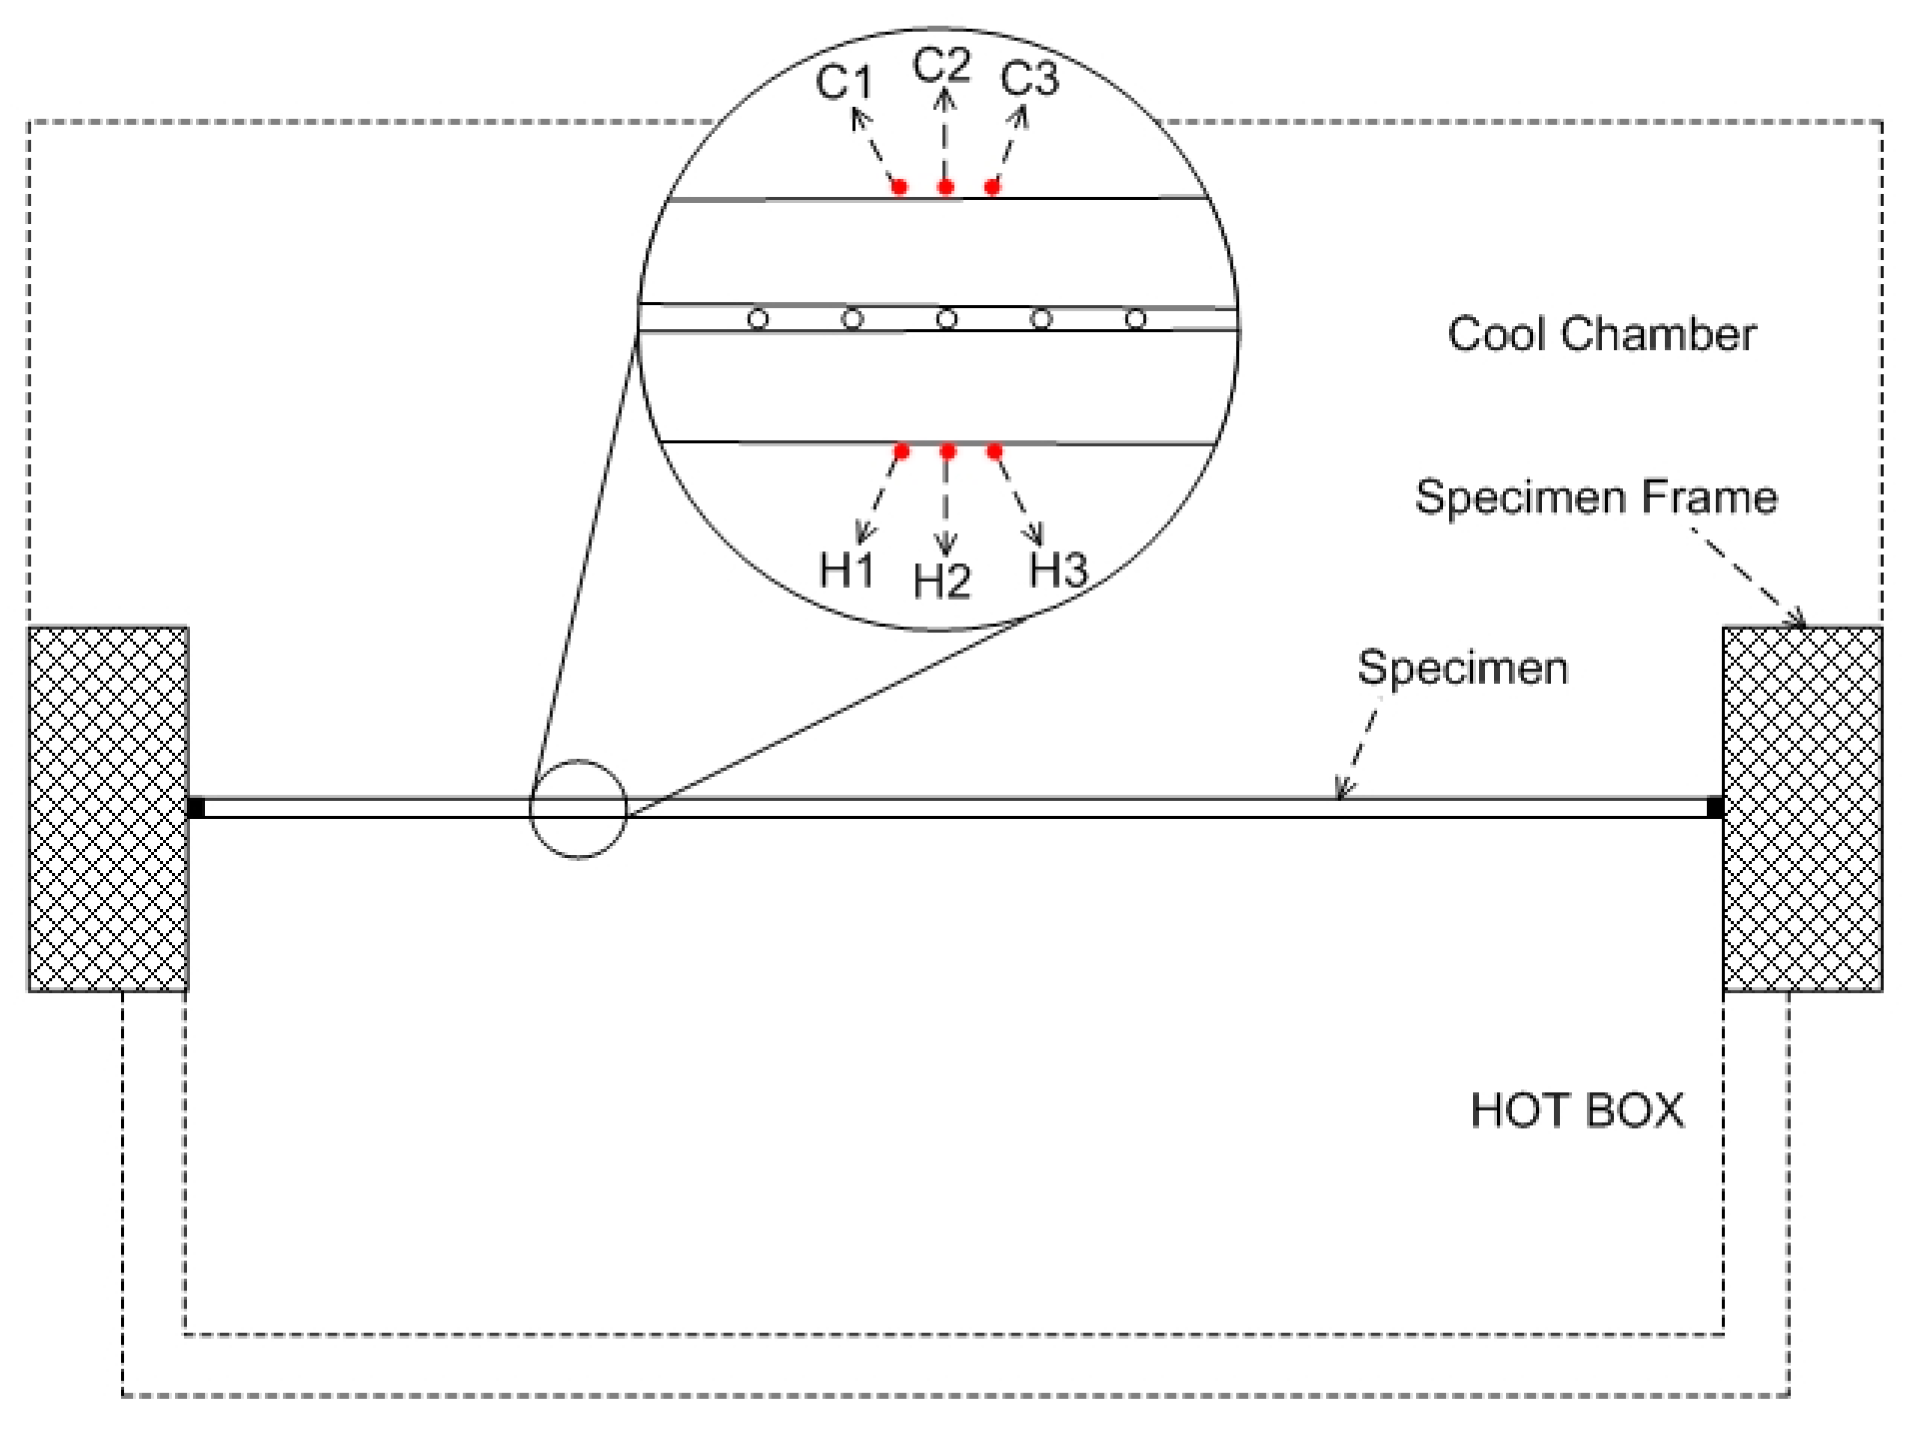
In this section, the test specimen was made using the referenced Korean Standard KS F 2278: Standard test method for thermal resistance for windows and doors as it can measure the U-value of a window set or window. The environmental conditions of the laboratory test were similar to those described in KS F 2278. The laboratory contained a cool chamber, warm chamber and hot box where the air temperature of the cool chamber was maintained at (0 ± 1) °C; and the air temperature of the warm chamber and hot box was maintained at (20 ± 1) °C. A steady state was confirmed regarding the inside air temperature and the heater input (W). The data were logged three time at 30 min each during the measuring period. The size of the specimen was 2000 mm (W) × 2000 mm (H). Figure 8 shows the measuring equipment scheme, view and glazing specimen installation.
3.2. Analysis on the U-Value of Vacuum Glazing
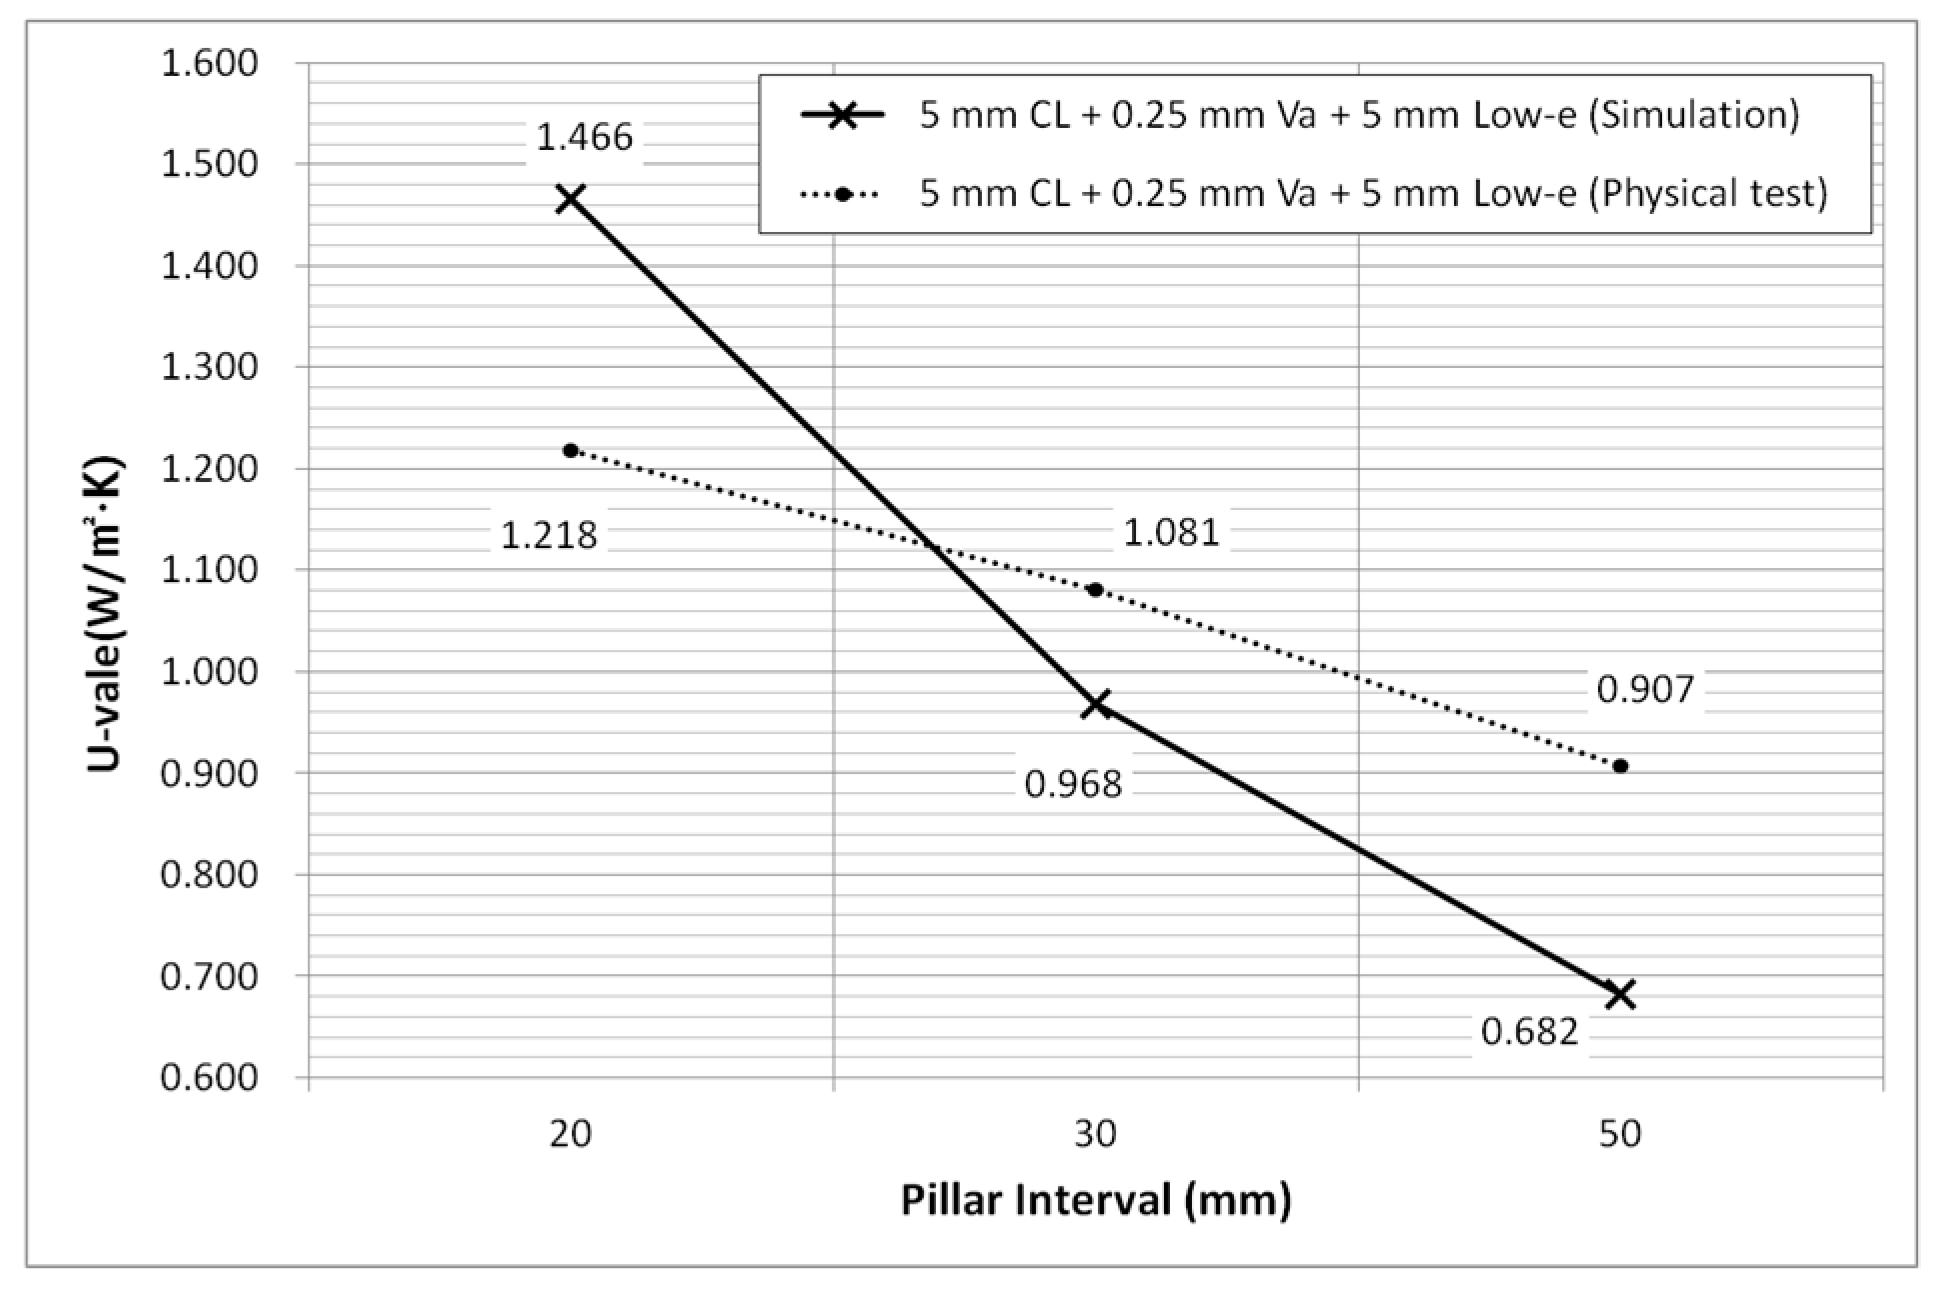
The pillar intervals were 20 mm, 30 mm, and 50mm to measure the U-value of vacuum glazing. The U-value with a pillar interval of 20 mm, 30 mm, and 50mm was 1.218 W/m2·K, 1.082 W/m2·K, and 0.903 W/m2·K, respectively. Like the simulation results, the author confirmed that the U-value decreased with increasing pillar interval and the U-value of both results showed some difference in values under the same conditions. Figure 9 shows the U-value comparison of vacuum glazing to the test results.
The authors considered that this result was affected by the convection heat transfer coefficient through simulations and physical tests. The method of KS F 2278 permits an error of the air temperature and convection heat transfer coefficient. Realistically, during the measuring period, the difference in each air temperature and convection heat transfer coefficient were confirmed. However, the U-value of vacuum glazing differed based on the pillar interval. In the physical test, the specimen had a large area (2000 mm (W) × 2000 mm (H)), so the edge effect of glazing was shown in the corner of specimen frame. Table 3 displays the conditions for the simulations and physical tests.
3.3. Variation of Surface Temperature by Changing the Vacuum Glazing Components
As stated in previous studies, the difference in U-value differed based on the pillar interval. In this section, the authors investigated the surface temperature on the glass for heat flow checking. The position was either the reached pillar and glass or did not reach the pillar and glass. The measurement method used was an advanced test method of U-value measuring. In addition, the surface temperature on the glass surface was analyzed in the steady state periods. Figure 10 shows the plan view of the measuring equipment for the position of sensor and specimen.
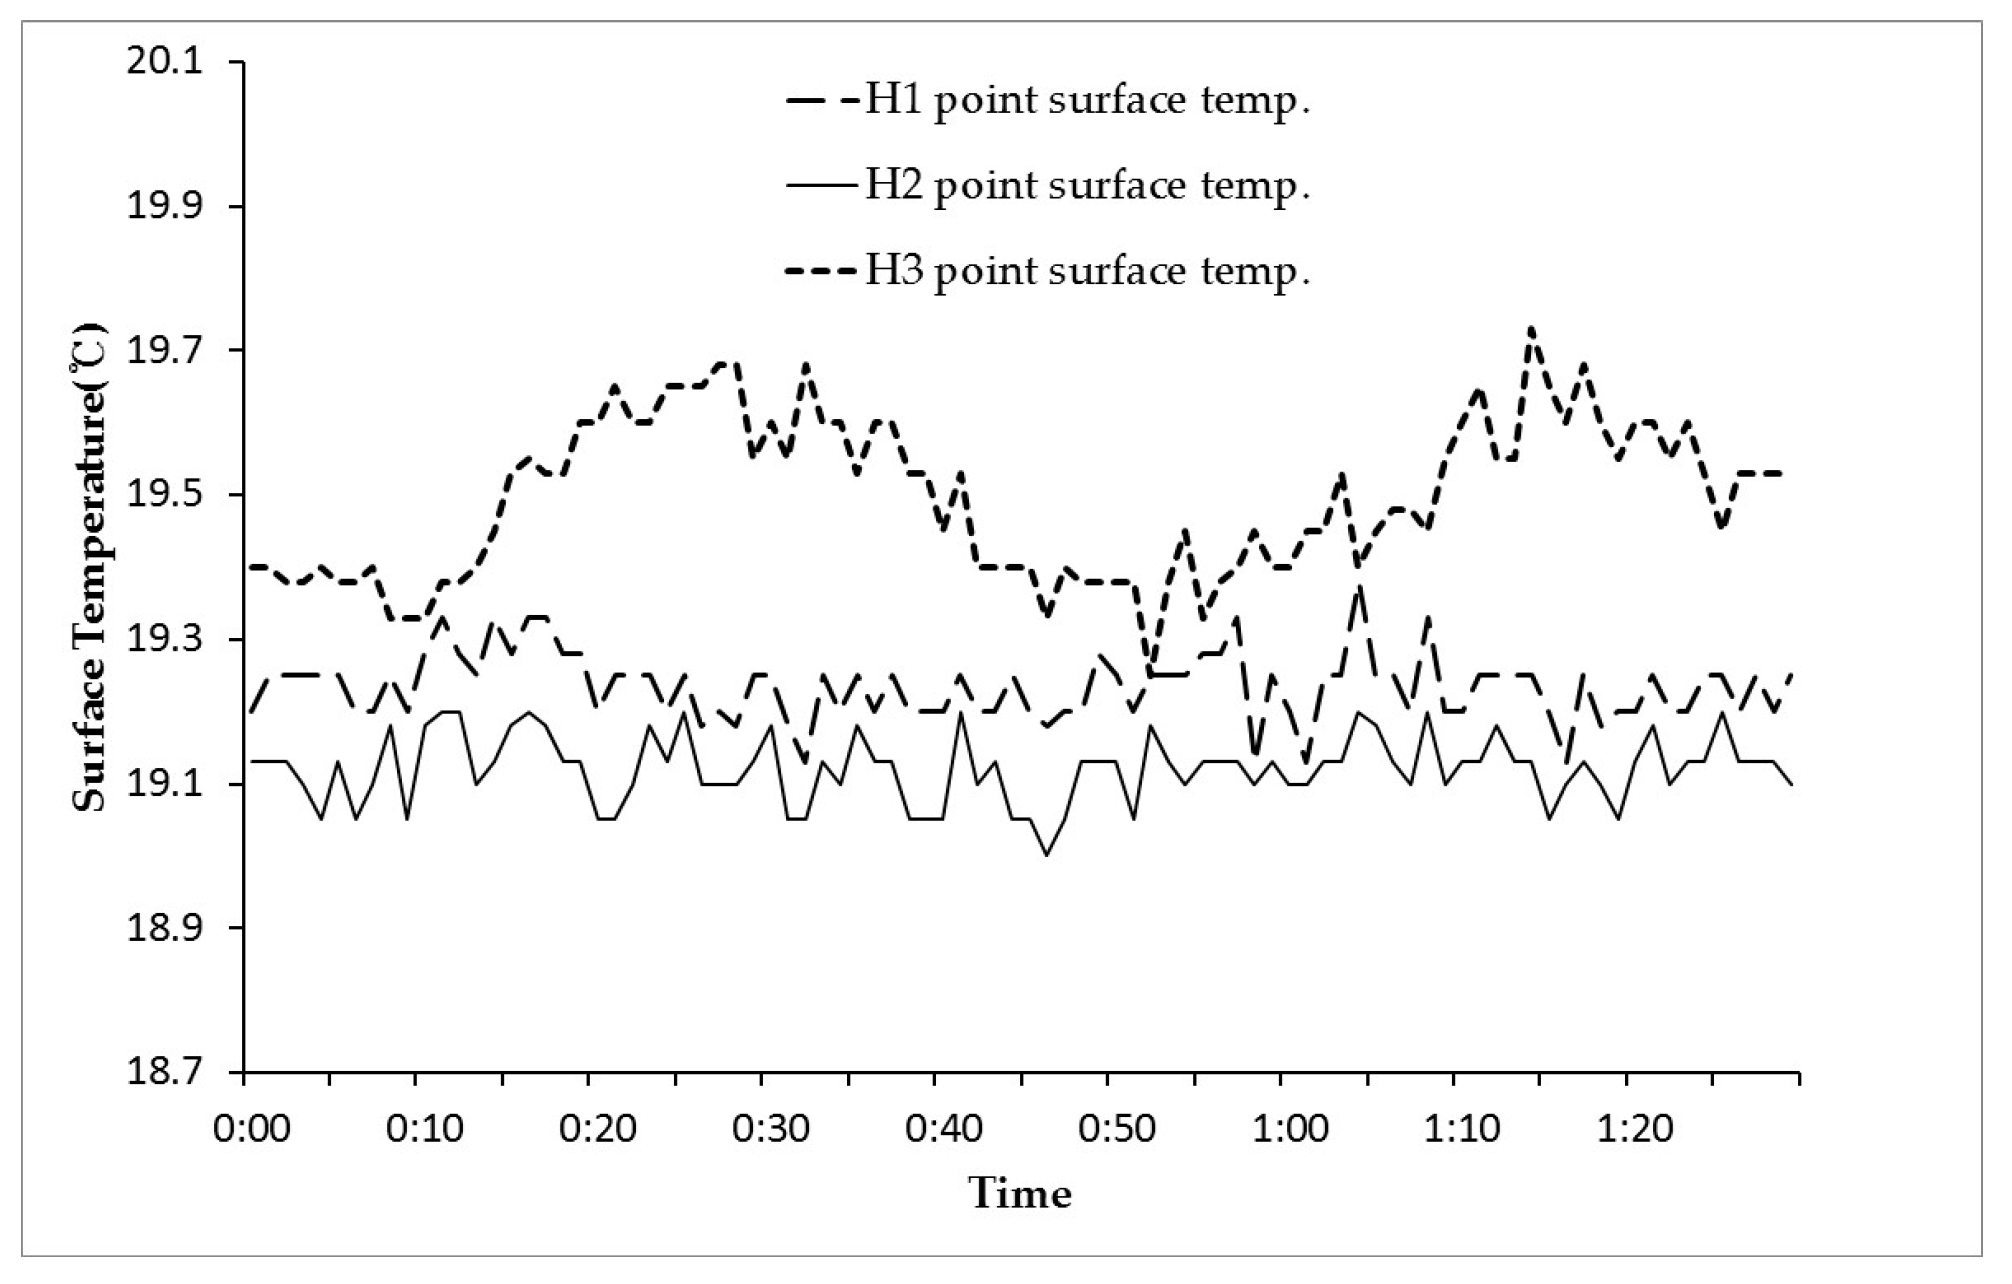
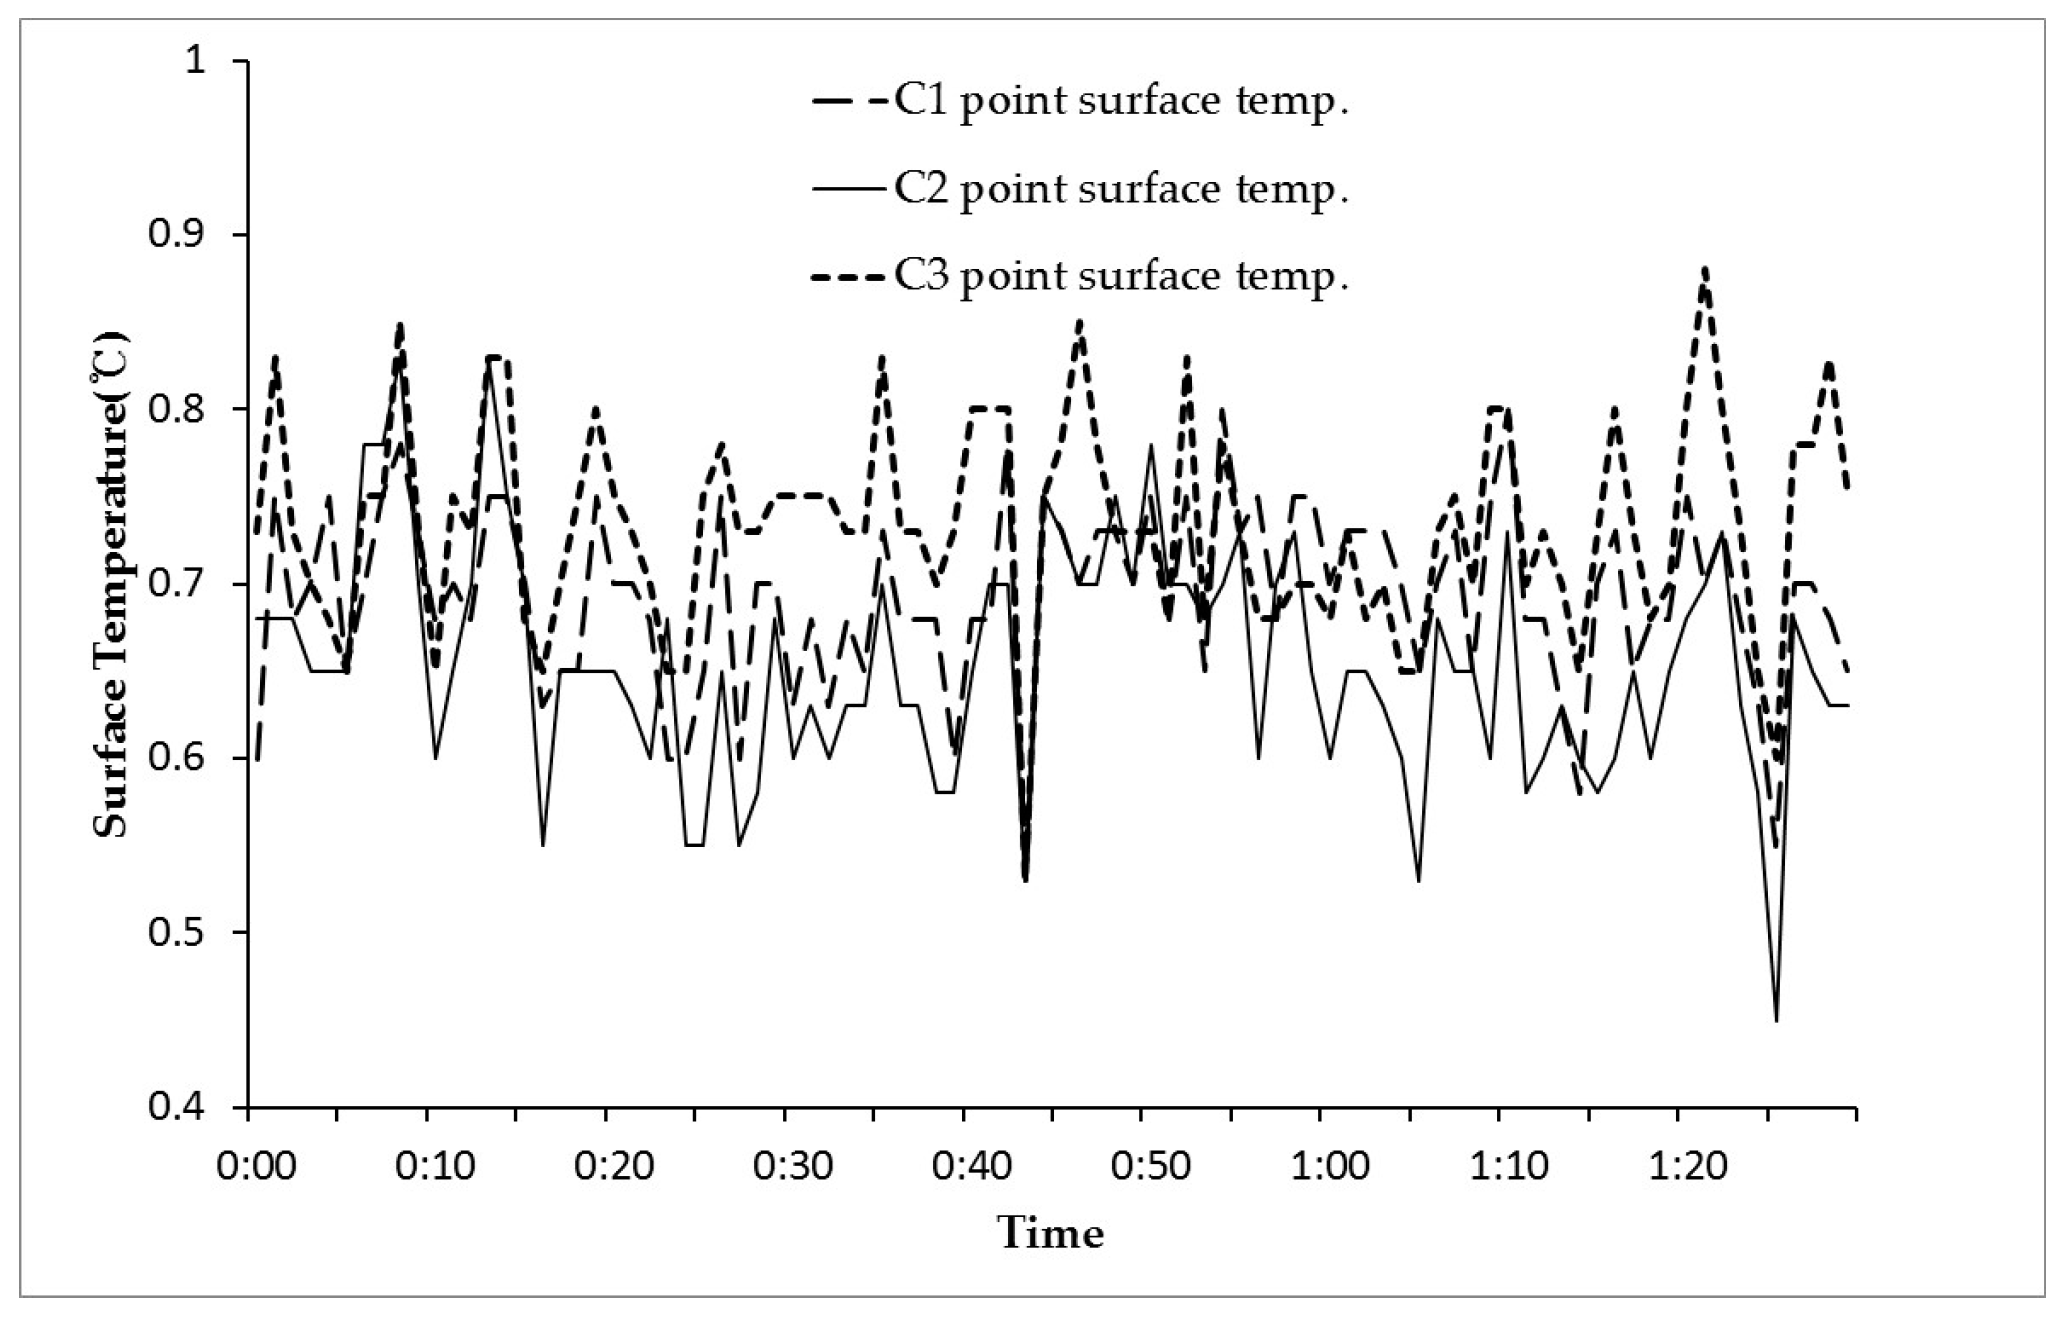
From the results of the surface temperature on the vacuum glazing surface at the cool chamber, the surface temperature of C2 of the reached pillar was 0.45–0.83 °C and the mean temperature was 0.65 °C. C1 and C3 of the did not reach pillar were 0.53–0.80 °C and 0.53–0.88 °C, respectively. During the measuring period, the mean surface temperature was 0.69 °C and 0.73 °C, respectively. The surface temperature of the vacuum glazing surface in the hot box of H2 was 19.00–19.20 °C and mean temperature was 19.12 °C. H1 and H3 of the did not reach pillar were 19.13–19.38 °C and 19.25–19.73 °C, respectively. During the measuring period, the mean surface temperature was 19.23 °C and 19.50 °C, respectively. Figure 11 and Figure 12 show the surface temperature of each side.
Based on these results, in the case of the surface temperature on the cool chamber, the surface temperature on reached vacuum glazing (C2) had a lower temperature than the vacuum surface (C1, C3) because the surface temperature was higher than the air temperature, which influenced the heat flow activity. In addition, in the case of the surface temperature on the hot box, the surface temperature on the vacuum glazing (H2) was lower than the vacuum surface (H1, H3) because the air temperature was higher than the surface temperature, which also influenced the heat flow activity.
4. Energy Consumption Variation by the Difference in Vacuum Glazing Performance
Many studies have confirmed the effects of the energy consumption of buildings by variation in window elements. Kim et al. [16] proposed window element variation as an indicator for saving energy in buildings. Neilsen et al. [17] shows a diagram illustrating the different performances of windows with U-values and G-values. Persson [18] confirmed effects on energy consumption with respect to the WWR, orientation, and glazing type. Karlsson [19] proposed a simple model to confirm energy consumption by variation in window elements. The energy of windows was calculated in terms of building energy consumption by solar radiation gain and heat loss. The difference in vacuum glazing performance can affect energy consumption in buildings. Therefore, this section reports on the results of an energy simulation using a simulation tool to confirm the energy consumption variation. In addition, the authors investigated the variation of energy consumption in buildings by changing the vacuum glazing performance.
4.1. Building Modeling and Simulation Set-Up
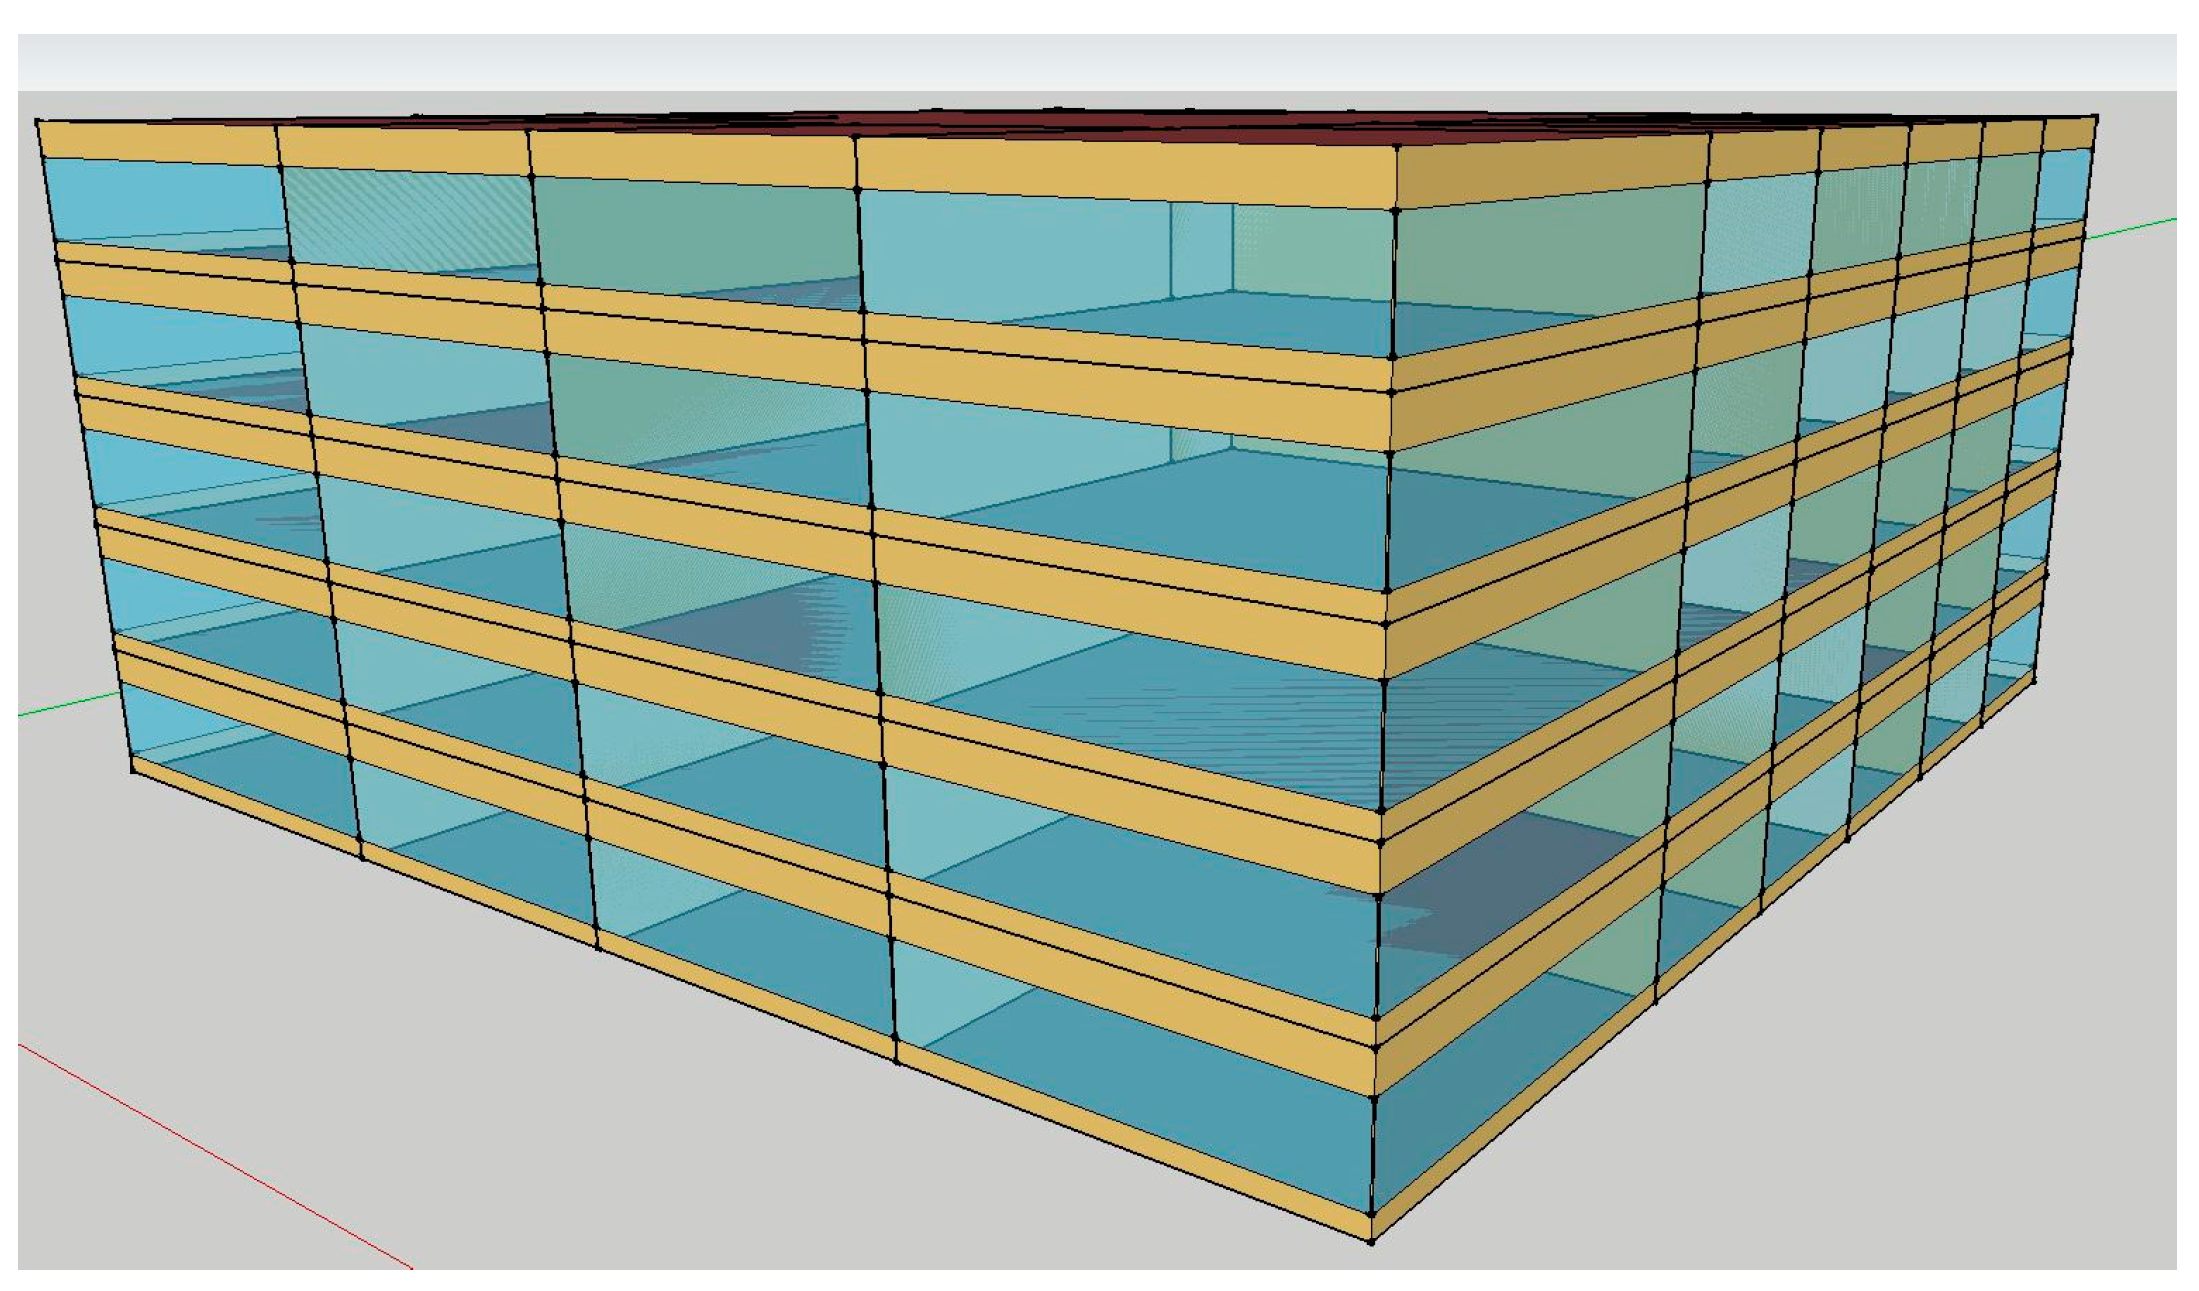
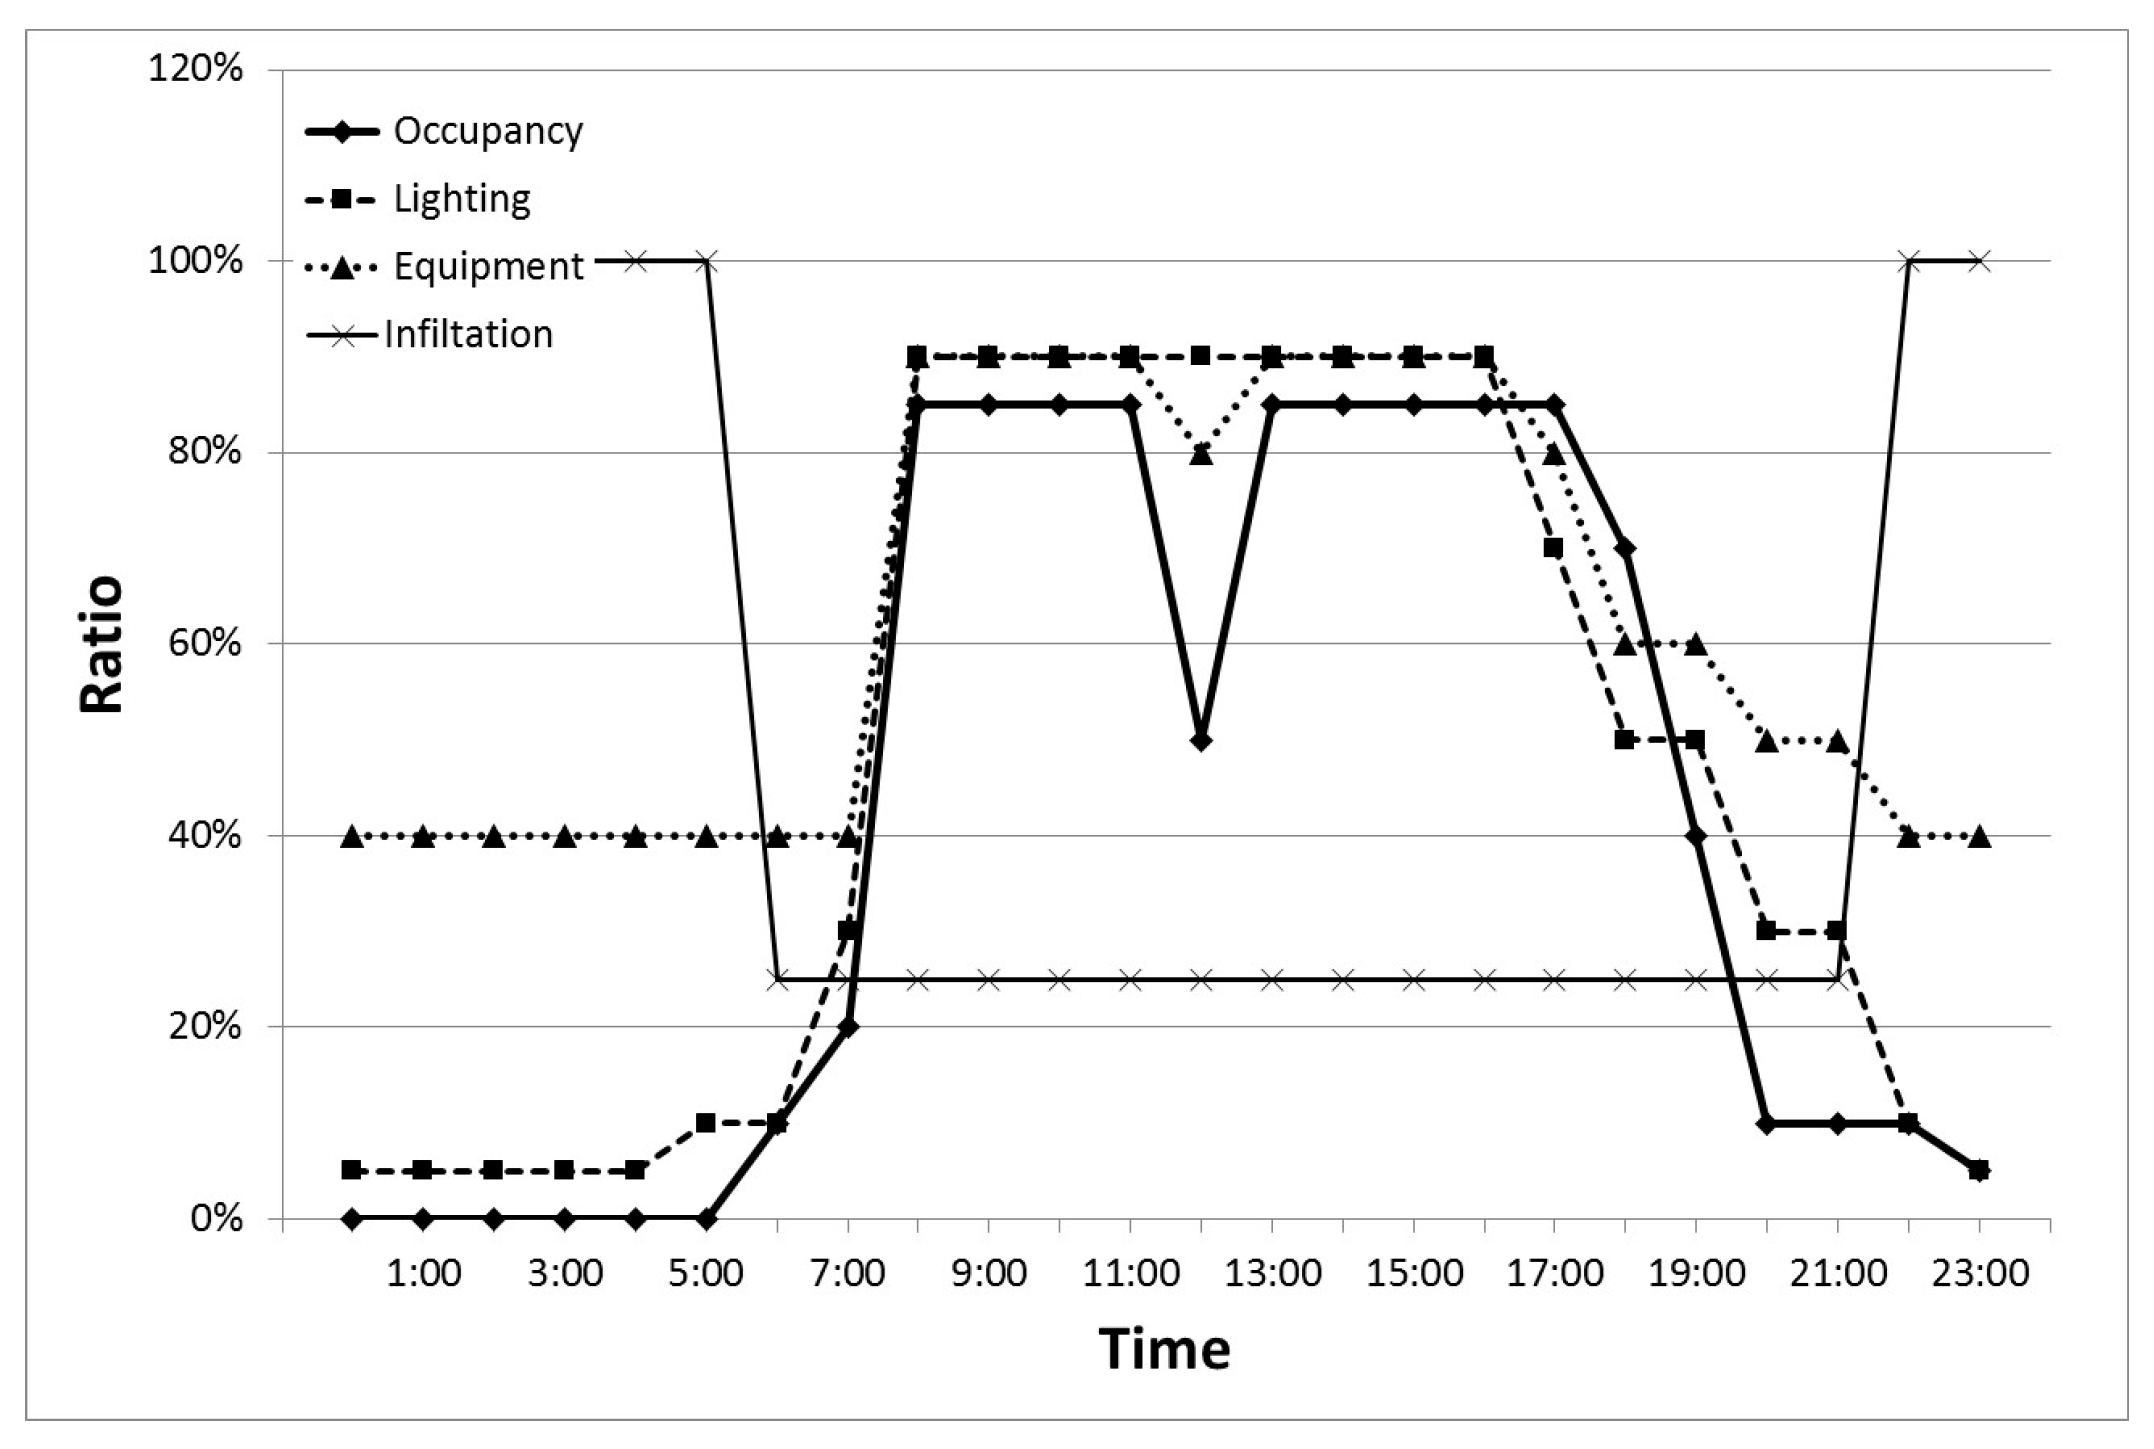
From a previous study in Reference [1], the authors used Energy-Plus simulation and modeled the target building to confirm the difference in energy consumption. This building had five stories and was located in Inchon, Korea. Location weather was provided by weather-data from the International Weather for Energy Calculation (IWEC) in ASHRAE research. This building did not use any outer shading to block solar radiation. Furthermore, as the glazing and frame must be combined, the frame U-value is also important so the frame was made of aluminum. It can be seen in Figure 13 that the building is used as an office and the WWR is approximately 60%. In addition, the internal heat gain and infiltration was input for each space in the office. Figure 14 shows the schedule of the simulations. Table 4 lists the simulation information.
To examine the changing performance by the different components of vacuum glazing, the author used the WINDOW tool and selected cases. The simulation was performed for U-value, SHGC and visible light transmission. U-value and SHGC was changed by the glass type, gas gap, and interval of pillar; however, the Tvis did not change despite the variation in pillar interval in the case of the same glazing components as the pillar area was smaller than the specimen area. Thus, the shading effect of the pillars in vacuum glazing did not affect the total visible transmittance. Table 5 shows the glazing cases for energy simulation.
4.2. Analysis of Energy Consumption
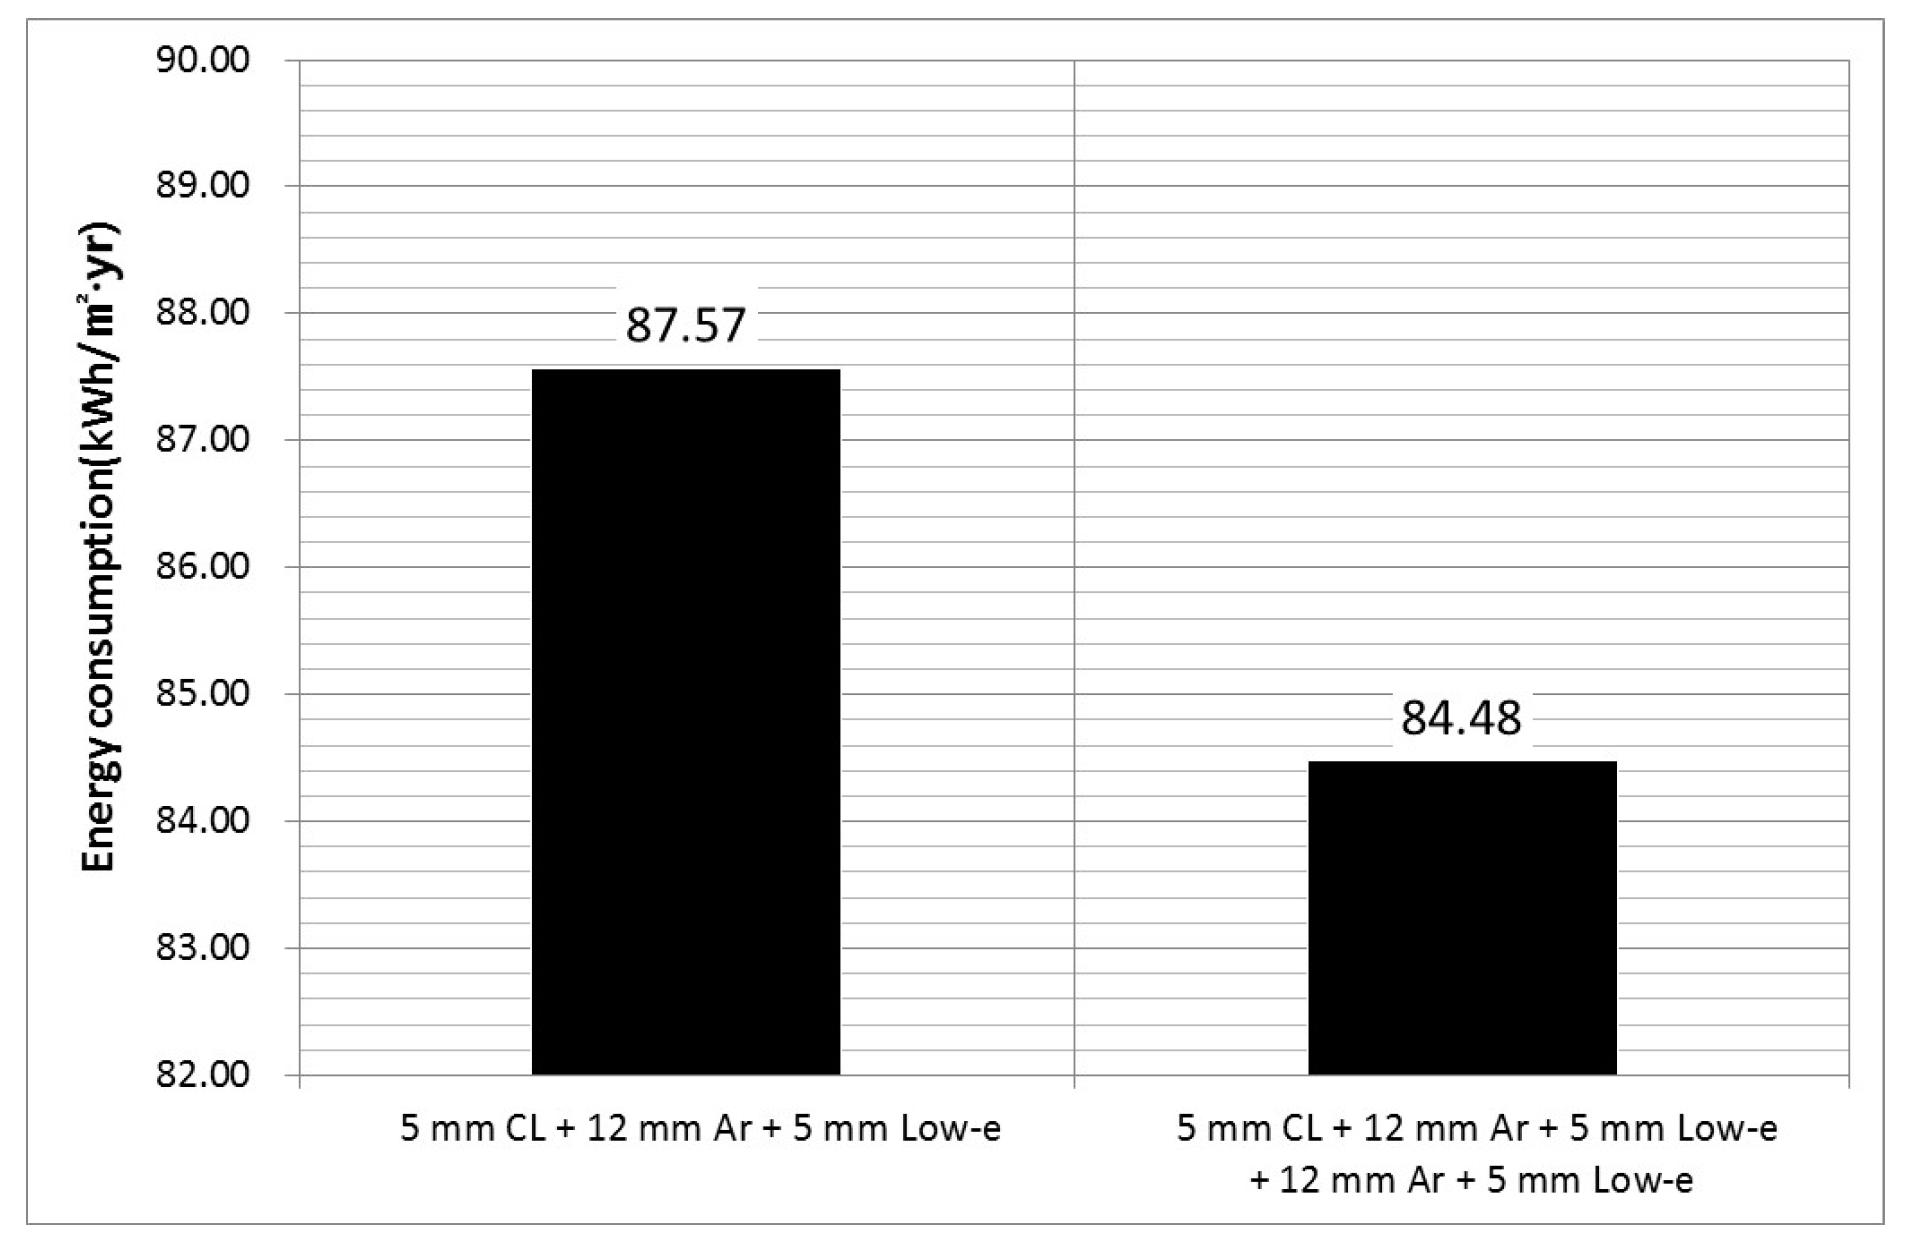
To compare the energy consumption by glazing variation, energy analysis was performed through simulations on the application of double glazing (including low-e glass and argon gas gap) and triple glass. The energy consumed quantity was the end use of heating and cooling energy consumption in a year. To confirm the influence of glazing variation, authors considered the total increase and decrease about heating and cooling energy consumption as per Reference [1]]. Thus, this study summarized the heating and cooling energy consumption in one year, but did not include lighting energy use in the simulation. The target building consumed an annual 87.57 kWh/m2·yr and 84.48 kWh/m2·yr in the case of double glazing and triple glazing, respectively. Figure 15 displays the energy simulation results through the installation of double and triple glazing.
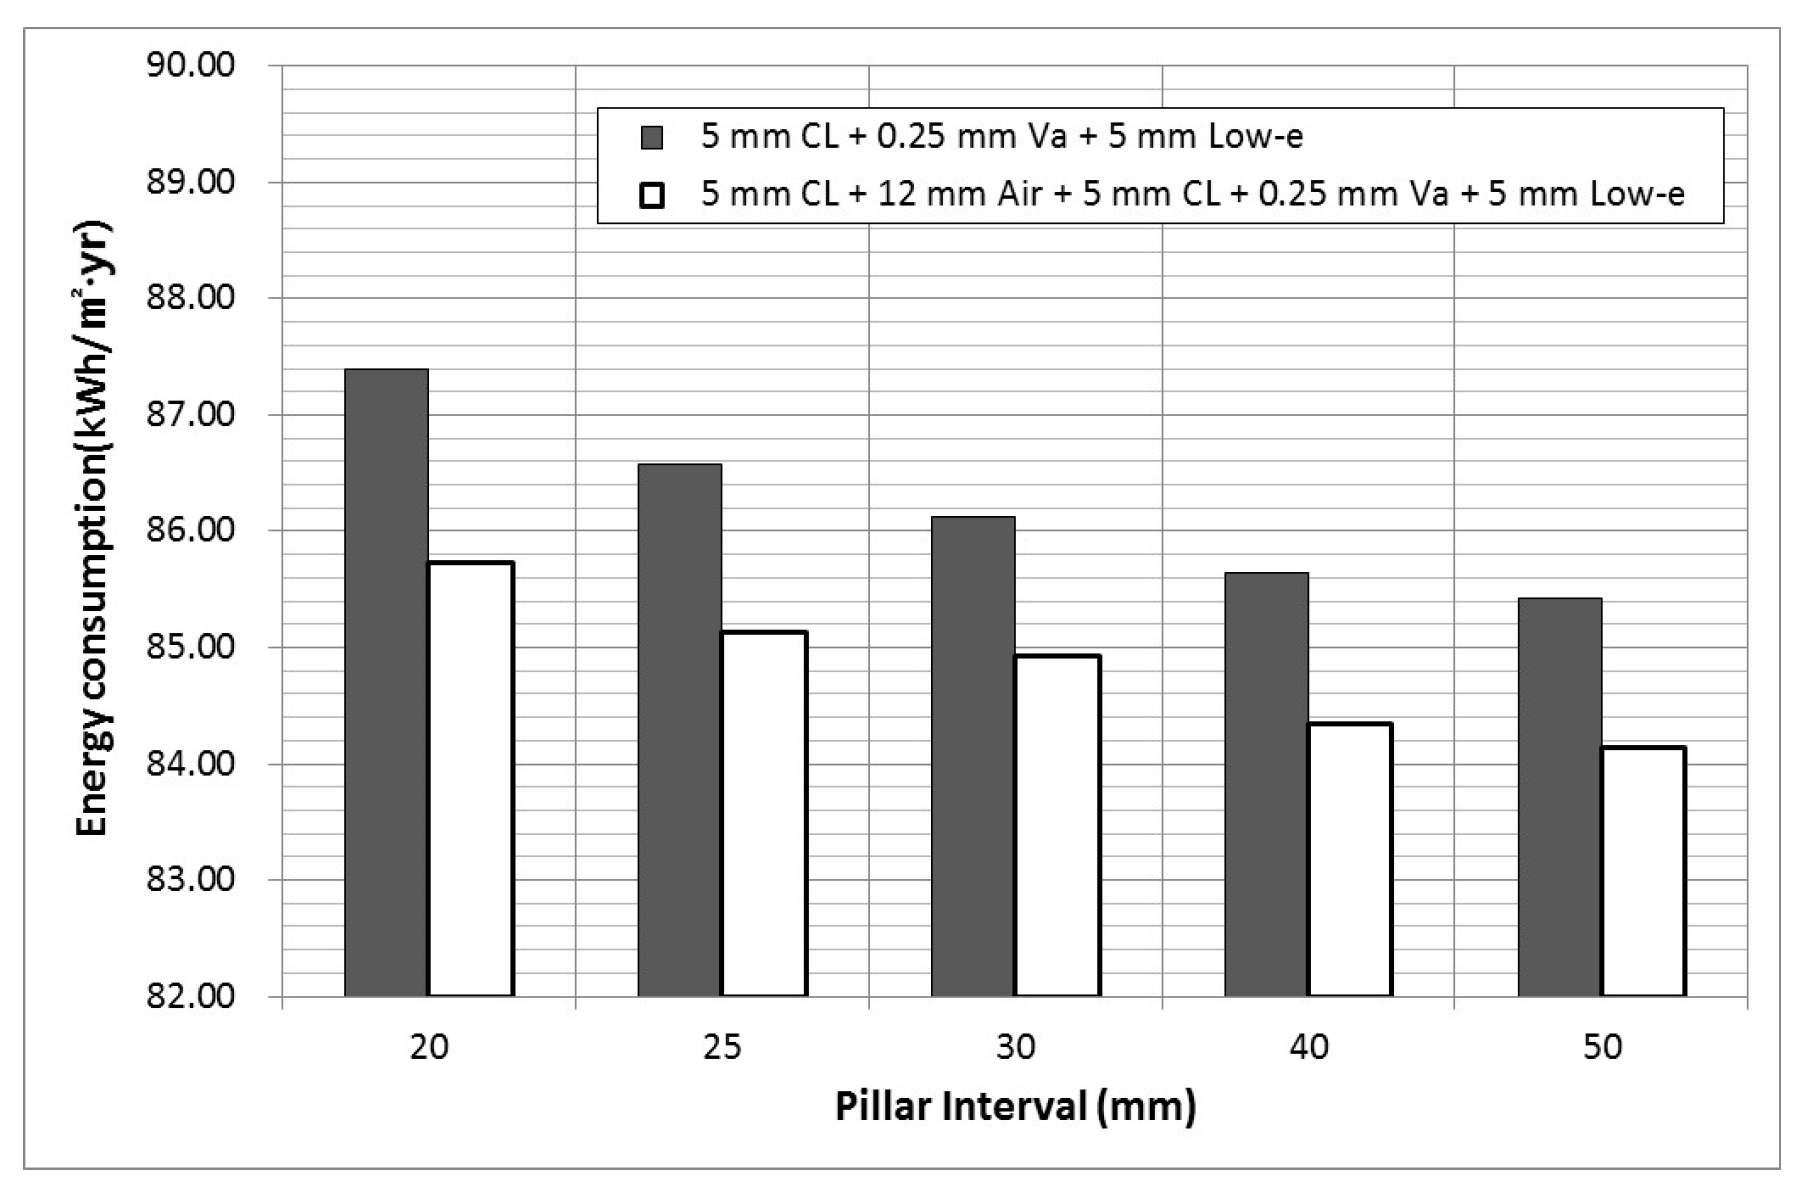
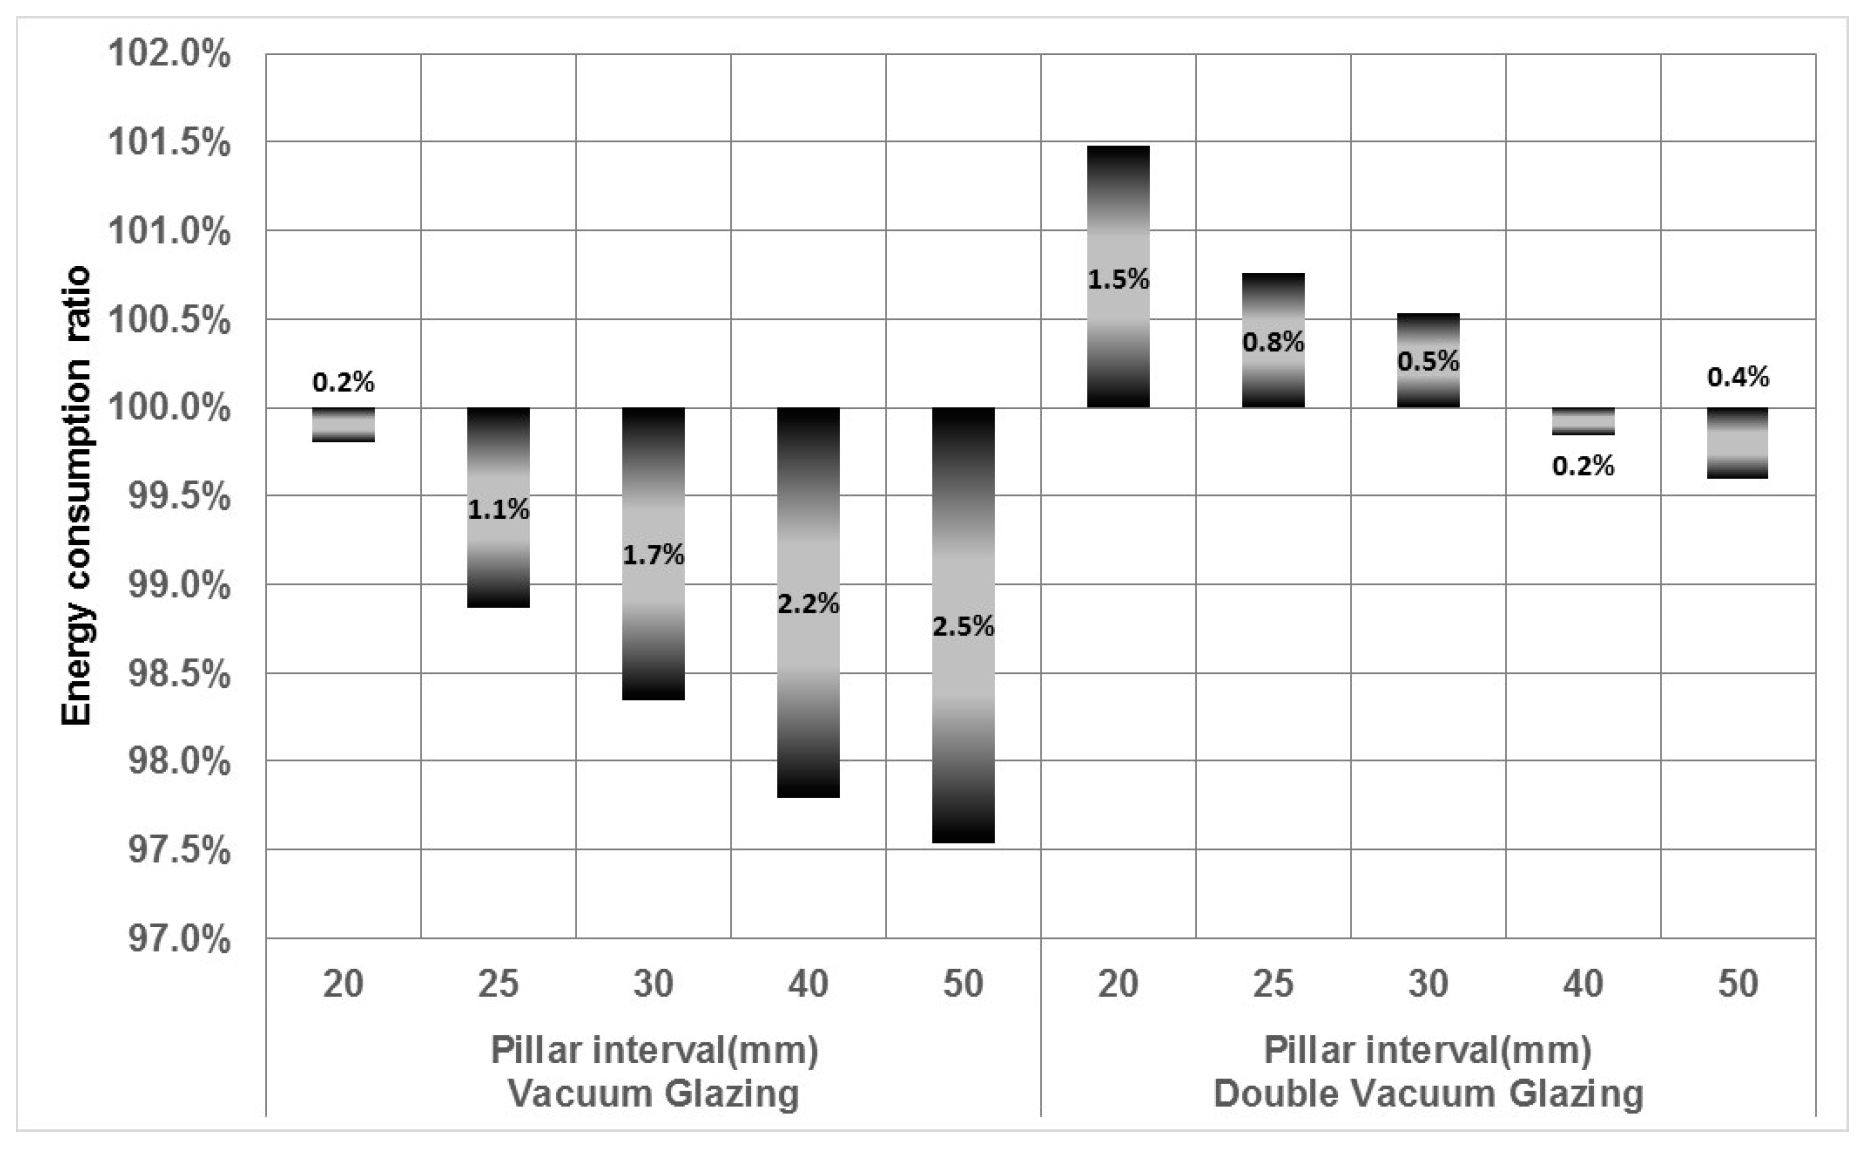
In the case of vacuum glazing (single), the energy consumption was 87.40–85.42 kWh/m2·yr by changing the pillar interval. This meant a maximum of 2.46% lower energy consumption than with double glazing. In the case of double vacuum glazing, a maximum of 3.91% of energy was saved in comparison to double glazing. However, energy consumption was higher than with triple glazing. If a 40 mm pillar interval is not used with double vacuum glazing, the energy consumption will not decrease. Based on these results, the energy saving ratio was not in proportion to the vacuum glazing thermal performance increasing ratio. A comparison of glazing scenarios 4 and 8 showed similar U-values, but not in the SHGC (about 0.1), as a high SHGC affects the energy consumption from solar radiation. This can be demonstrated by the case where a 53% decreasing U-value had a 2% energy saving, and the case where a 47% decreasing U-value had a 1.8% energy saving, and an 11% decreasing SHGC had a 1% energy saving. Thus, the selection of vacuum glazing must be considered in the complex consideration of energy consumption. Figure 16 and Figure 17 show the results of the energy simulation per case of glazing installation.
5. Results and Discussion
5.1. Difference in U-Value between Simulation and Physical Test
This study confirmed the variation in U-value by changing the pillar intervals in the simulation and by performing a physical test by specimen for the U-value experiment. With these results, the authors determined the difference between the simulation and physical test results by the pillar attached area in the vacuum glazing, which appears to be due to the environment difference between the simulation and practical test. In the simulation, WINDOW simulated the variation of glass composition, type, and pillar interval from the purpose of user; however, the edge of the vacuum glazing had an insulation condition so it was not considered in the simulation.
From Figure 18, a length of specimen edge led to errors between the simulation and experimental test results. Furthermore, the frit for glass bonding at the glazing edge had a raised area where the glass touched each other. Therefore, the heat flow may be smoothed better than the insulation condition between the specimen edge and frame and the results show a different U-value. In addition, the experimental test results showed that the U-value of vacuum glazing decreased with an increased interval of pillar (where the pillar area decreased in vacuum glazing). This area of pillar was smaller than the total vacuum glazing area, but was effective enough to change the U-value.
Further studies are required to confirm the U-value of vacuum glazing, therefore the simulation tool should contain the edge effect of glazing, as well as consider the heat loss through the frit.
5.2. Application and Limit of Vacuum Glazing in the Building Case Study
In this study, authors confirmed energy consumption through WWR 60%. By replacing vacuum glazing instead of double and triple glazing, this study determined the decrease in energy consumption. This means that energy consumption could be decreased by replacing the existing window frame thickness for enhanced performance; however, in the case of triple glazing, it did not decrease energy consumption in the pillar intervals of 20 mm, 25 mm, and 30 mm. Thus, if a designer or owner replaced the existing window to a vacuum glazed window, they would need confirmation of the energy saving effect of the replaced window. This study determined the variation in performance through the pillar intervals as well as the analysis of the structure needed for durability and the safe containment of the vacuum.
6. Conclusions
This paper reported the simulation and physical test results to confirm the effects of vacuum glazing with different components. These results are expected to be useful for window selection by designers or builders in the design process. Therefore, the performance difference affected the energy consumption. In this study, the quantitative results were confirmed by simulation and a physical test. The results of this research are as follows:
- (1)
- The thermal performance of vacuum glazing was better than double glazing. In addition, the U-value of vacuum glazing produced a maximum 55% decrease when compared to double glazing. Double vacuum glazing showed a maximum 27% decrease in U-value than triple glazing, and the low-e glass and argon gas gap added to double glazing.
- (2)
- A physical test was performed to confirm the variation of thermal performance. The pillar intervals were set as 20 mm, 30 mm and 50 mm. The U-value of a 30 mm and 50 mm pillar interval was decreased by 11% and 25%, respectively, in comparison to the U-value of a 20 mm pillar interval. Therefore, the position of the pillar has a significant effect on heat flow.
- (3)
- From the simulation results, the vacuum glazed case saved a maximum of 2.46% in energy consumption than a case with double glazing. In addition, in the case with double vacuum glazing, the energy saved was a maximum of 3.91% compared to the use of double glazing. On the other hand, energy consumption was higher than with the triple glazed case. If a 40 mm pillar interval is not used with double vacuum glazing, energy consumption will not be reduced. Overall, the energy saving ratio was not in proportion to the thermal performance of vacuum glazing.
In this study, the methods of research were similar to those in previous studies, but the authors confirmed the variation of the vacuum glazing performance by changing the pillar interval and by substituting different vacuum glazing components to determine the trends in performance variation by the pillar interval. Through a comparison of the simulation and physical test results, the authors confirmed that the comparison of each set of results (simulation and physical) did not match. Furthermore, in the physical test, the glazing edge effect had significant influence on the outcome, and the authors analyzed the energy consumption change by various vacuum glazing components in the office building with a WWR of 60%. These results confirm the impact of vacuum glazing performance on energy consumption in buildings.
Acknowledgments
This work was supported by the R&D program of MSIP/COMPA. [2016K000248, General requirement performance evaluation of commercialized highly insulated vacuum window system].
Author Contributions
All authors contributed to this work. Soo Cho proposed the concept of this article and wrote the major part of this article. Seok-Hyun Kim performed the result analysis of simulation, physical test and responsible for this article.
Conflicts of Interest
The authors declare no conflict of interest.
References
- Kim, S.H.; Shin, K.J.; Choi, B.E.; Jo, J.H.; Cho, S.; Cho, Y.H. A Study on the Variation of Heating and Cooling Load According to the Use of Horizontal Shading and Venetian Blinds in Office Buildings in Korea. Energies 2015, 8, 1487–1504. [Google Scholar] [CrossRef]
- Ng, N.; Collins, R.E.; So, L. Characterization of the thermal insulating properties of vacuum glazing. Mater. Sci. Eng. B 2007, 138, 128–134. [Google Scholar] [CrossRef]
- Cho, S.; Kim, S.H.; Eom, J.Y. The Evaluation of Thermal Performance of Vacuum Glazing by Composition and the Pillar Arrangement through Test Method of Thermal Resistance. J. Korean Sol. Energy Soc. 2015, 35, 61–68. [Google Scholar] [CrossRef]
- Fang, Y.; Hyde, T.J.; Arya, F.; Hewitt, N. A Novel Building Component Hybrid Vacuum Glazing—A Modeling and Experimental Validation. ASHRAE Trans. 2013, 119, 430–441. [Google Scholar]
- Collins, R.E.; Simko, T.M. Current Status of the Science and Technology of Vacuum Glazing. Sol. Energy 1998, 62, 189–213. [Google Scholar] [CrossRef]
- Manz, H.; Brunner, S.; Wullschleger, L. Triple vacuum glazing: Heat transfer and basic mechanical design constraints. Sol. Energy 2006, 80, 1632–1642. [Google Scholar] [CrossRef]
- Cuce, E.; Riffat, S.B. Aerogel-Assisted Support Pillars for Thermal Performance Enhancement of Vacuum Glazing: A CFD Research for a Commercial Product. Arab. J. Sci. Eng. 2015, 40, 2233–2238. [Google Scholar] [CrossRef]
- Cuce, E.; Cuce, P.M. Vacuum glazing for highly insulating windows: Recent developments and future prospects. Renew. Sustain. Energy Rev. 2015, 54, 1345–1357. [Google Scholar] [CrossRef]
- Kang, E.Y.; Oh, M.W.; Kim, B.Y. A Study on the Heat Transfer Phenomenon through the Glazing System (Korean). In Proceedings of the Korean Solar Energy Society 2009 Autumn Annual Conference, Seoul, Korea, 19 November 2009; Volume 29, pp. 32–37. [Google Scholar]
- Baek, S.H.; Park, J.C. Analysis on Thermal Performance of Vacuum Glazing to Reduce Heating Load (Korean). In Proceedings of the SAREK 2015 Summer Annual Conference, Daegwanryeong-myeon, Korea, 24 Jun 2015; pp. 359–362. [Google Scholar]
- Kim, J.K.; Jeon, E.S. The Strength Simulation and Test of Glass According to Array Separation of Pillars to Maintain Vacuum Gap. In Proceedings of the SAREK 2013 Winter Annual Conference, Seoul, Korea, 22 November 2013; pp. 133–135. [Google Scholar]
- Lawrence Berkeley National Laboratory, WINDOW. Available online: http://www.lbl.gov/ (accessed on 29 May 2017).
- Korea Agency for Technology and Standards. KS F 2278: Standard Test Method for Thermal Resistance for Windows and Doors. 2014. Available online: http://www.kats.go.kr/ (accessed on 29 May 2017).
- Fang, Y.; Eames, P.C.; Norton, B.; Hyde, T.J.; Zhao, J.; Wang, J.; Huang, Y. Low emittance coatings and the thermal performance of vacuum glazing. Sol. Energy 2007, 81, 8–12. [Google Scholar] [CrossRef]
- Wilson, C.F.; Simko, T.M.; Collins, R.E. Heat Conduction through the Support Pillars in Vacuum Glazing. Sol. Energy 1988, 63, 393–406. [Google Scholar] [CrossRef]
- Kim, S.H.; Kim, S.S.; Kim, K.W.; Cho, Y.H. A study on the proposes of energy analysis indicator by the window elements of office buildings in Korea. Energy Build. 2014, 73, 153–165. [Google Scholar] [CrossRef]
- Nielsen, T.R.; Duer, K.; Svendsen, L.S. Energy performance of glazings and windows. Sol. Energy 2000, 69, 137–143. [Google Scholar] [CrossRef]
- Persson, M.L.; Roos, A.; Wall, M. Influence of window size on the energy balance of low energy houses. Energy Build. 2006, 38, 181–188. [Google Scholar] [CrossRef]
- Karlsson, J.; Karlsson, B.; Roos, A. A simple model for assessing the energy performance of windows. Energy Build. 2001, 33, 641–651. [Google Scholar] [CrossRef]
Figure 1.
Scheme of vacuum glazing.

Figure 2.
Method of research and flow chart.

Figure 3.
Print-screen of the simulation tool WINDOW 7.4.

Figure 4.
Double glazing and triple glazing schema.

Figure 5.
Vacuum glazing sectional view.

Figure 6.
U-value of various glazing by simulation.

Figure 7.
Contact area variation of pillar on vacuum glazing.

Figure 8.
Measuring equipment scheme, view and glazing specimen installation. After installing the specimen between the hot box and cool chamber, a data logger measured the watts of the heater and fan. The U-value was calculated using the method of window set in KS F 2278.
Figure 8.
Measuring equipment scheme, view and glazing specimen installation. After installing the specimen between the hot box and cool chamber, a data logger measured the watts of the heater and fan. The U-value was calculated using the method of window set in KS F 2278.

Figure 9.
U-value comparison of vacuum glazing by a physical test and simulation.

Figure 10.
Plan view of the measuring equipment for the surface temperature of vacuum glazing.

Figure 11.
Surface temperature of vacuum glazing on cool chamber side.

Figure 12.
Surface temperature of vacuum glazing on hot box side.

Figure 13.
Building modeling.

Figure 14.
Simulation schedule.

Figure 15.
Building energy consumption by double and triple glazing.

Figure 16.
Comparison of building energy consumption by various vacuum glazing.

Figure 17.
Building energy consumption ratio by a comparison to double and triple glazing.

Figure 18.
Vacuum glazing edge of the specimen installation.


Table 1.
Simulation information.
| Category | Contents | |
|---|---|---|
| Specimen Size | 2000 mm (W) × 2000 mm (H) | |
| Environmental Conditions | Indoor | Air temperature: 20.0 °C Convection Coefficient: 9.091 W/m2·K |
| Outdoor | Air temperature: 0.0 °C Convection Coefficient: 20.0 W/m2·K | |
| Clear Glass (CL) | IGDB No: 6958 | |
| Name: HanGlas Clear 5 mm | ||
| Low-e coating Glass (Low-e) | IGDB No: 6981 | |
| Name: HanGlas 5PLA113 | ||
| Pillar (Circular) | Size: 0.25 mm (H) × 0.5 mm (D) | |
| Material: Stainless Steel | ||
Table 2.
Simulation Case of Glazing.
| No. | Glazing Component | Thickness (mm) | Interval of Pillar (mm) |
|---|---|---|---|
| 1 | 5 mm CL 1 + 12 mm Ar 2 + 5 mm Low-e 3 | 22 | - |
| 2 | 5 mm CL + 12 mm Ar + 5 mm Low-e + 12 mm Ar + 5 mm Low-e | 39 | - |
| 3 | 5 mm CL + 0.25 mm Va 4 + 5 mm Low-e | 10.25 | 20 |
| 4 | 25 | ||
| 5 | 30 | ||
| 6 | 40 | ||
| 7 | 50 | ||
| 8 | 5 mm CL + 12 mm Air + 5 mm CL + 0.25 mm Va + 5 mm Low-e | 27.25 | 20 |
| 9 | 25 | ||
| 10 | 30 | ||
| 11 | 40 | ||
| 12 | 50 |
1 Clear glass; 2 Argon gas gap; 3 Low-e glass, 4 Vacuum gap.
Table 3.
Comparison condition between the simulations and physical tests.
| Category | Simulation | Physical Test * | ||
|---|---|---|---|---|
| Pillar interval: 20 mm | Outdoor (or Cool chamber) | Air Temperature (°C) | 0.0 | −0.08 |
| Convection heat transfer coefficient (W/m2·K) | 20.0 | 20.83 | ||
| Indoor (or Hot Box) | Air Temperature (°C) | 20.0 | 20.35 | |
| Convection heat transfer coefficient (W/(m2·K)) | 9.091 | 8.475 | ||
| Pillar interval: 30 mm | Outdoor (or Cool chamber) | Air Temperature (°C) | 0.0 | −0.15 |
| Convection heat transfer coefficient (W/(m2·K)) | 20.0 | 20.83 | ||
| Indoor (or Hot Box) | Air Temperature (°C) | 20.0 | 20.34 | |
| Convection heat transfer coefficient (W/(m2·K)) | 9.091 | 8.475 | ||
| Pillar interval: 50 mm | Outdoor (or Cool chamber) | Air Temperature (°C) | 0.0 | −0.11 |
| Convection heat transfer coefficient (W/(m2·K)) | 20.0 | 20.83 | ||
| Indoor (or Hot Box) | Air Temperature (°C) | 20.0 | 20.31 | |
| Convection heat transfer coefficient (W/(m2·K)) | 9.091 | 8.475 | ||
* This value is the mean value by third time measurement during the measuring period.
Table 4.
Building and simulation information.
| Category | Contents |
|---|---|
| Location | Inchon, Korea |
| Use | Office |
| Building size | First basement, 5 stories |
| Building area | 5248.8 m2 32.4 m × 32.4 m × 2.8 m, each floor |
| Temperature set-point | Cooling: 28 °C Heating: 20 °C |
| Load | Lighting: 10 W/m2 |
| Equipment: 6.88 W/m2 | |
| People: 0.05 people/m2 | |
| HVAC | Ideal load air system (in Template of Energy Plus & Open-studio) |
Table 5.
Glazing cases for the energy simulation.
| No. | Glazing Component | Interval of Pillar (mm) | U-Value | SHGC | Tvis |
|---|---|---|---|---|---|
| 1 | 5 mm CL + 12 mm Ar + 5 mm Low-e | - | 1.532 | 0.626 | 0.760 |
| 2 | 5 mm CL + 12 mm Ar + 5 mm Low-e + 12 mm Ar + 5 mm Low-e | - | 0.829 | 0.520 | 0.647 |
| 3 | 5 mm CL + 0.25 mm Va + 5 mm Low-e | 20 | 1.466 | 0.627 | 0.760 |
| 4 | 25 | 1.152 | 0.629 | 0.760 | |
| 5 | 30 | 0.968 | 0.631 | 0.760 | |
| 6 | 40 | 0.775 | 0.632 | 0.760 | |
| 7 | 50 | 0.682 | 0.633 | 0.760 | |
| 8 | 5 mm CL + 12 mm Air + 5 mm CL + 0.25 mm Va + 5 mm Low-e | 20 | 1.154 | 0.556 | 0.686 |
| 9 | 25 | 0.950 | 0.553 | 0.686 | |
| 10 | 30 | 0.882 | 0.552 | 0.686 | |
| 11 | 40 | 0.679 | 0.550 | 0.686 | |
| 12 | 50 | 0.607 | 0.549 | 0.686 |
© 2017 by the authors. Licensee MDPI, Basel, Switzerland. This article is an open access article distributed under the terms and conditions of the Creative Commons Attribution (CC BY) license (http://creativecommons.org/licenses/by/4.0/).
Share and Cite
MDPI and ACS Style
Cho, S.; Kim, S.-H. Analysis of the Performance of Vacuum Glazing in Office Buildings in Korea: Simulation and Experimental Studies. Sustainability 2017, 9, 936. https://0-doi-org.brum.beds.ac.uk/10.3390/su9060936
AMA Style
Cho S, Kim S-H. Analysis of the Performance of Vacuum Glazing in Office Buildings in Korea: Simulation and Experimental Studies. Sustainability. 2017; 9(6):936. https://0-doi-org.brum.beds.ac.uk/10.3390/su9060936
Chicago/Turabian StyleCho, Soo, and Seok-Hyun Kim. 2017. "Analysis of the Performance of Vacuum Glazing in Office Buildings in Korea: Simulation and Experimental Studies" Sustainability 9, no. 6: 936. https://0-doi-org.brum.beds.ac.uk/10.3390/su9060936
Note that from the first issue of 2016, this journal uses article numbers instead of page numbers. See further details here.