The Effect of Urbanization and Farmland Transfer on the Spatial Patterns of Non-Grain Farmland in China


1
Institution of Land Resource Management, Hohai University, 8 W Focheng Road, Nanjing 211000, China
2
Key Laboratory of the Coastal Zone Exploitation and Protection, Ministry of Land and Resource, Nanjing 210024, China
3
School of Geographic and Oceanographic Sciences, Nanjing University, 163 Xianlin Road, Nanjing 210023, China
4
Department of Geography and Geographic Information Science, University of Illinois at Urbana-Champaign, Champaign, IL 61820, USA
5
Department Human Geography and Spatial Planning, Utrecht University, 3508 TC Utrecht, The Netherlands
6
China Land Surveying and Planning Institute, Beijing 100029, China
*
Author to whom correspondence should be addressed.
Sustainability 2017, 9(8), 1438; https://0-doi-org.brum.beds.ac.uk/10.3390/su9081438
Submission received: 31 May 2017
/
Revised: 29 July 2017
/
Accepted: 4 August 2017
/
Published: 15 August 2017
(This article belongs to the Special Issue Sustainable Land Use in China)
Abstract
:Rapid urbanization has accelerated farmland transfer in China, which in turn has increased the cultivation intensity of non-grain farmland (NGF). The aim of this paper was to analyze the spatial patterns of non-grain farmland (NGF) at municipal-level cities in China from 2000 to 2014, and explore the influence of urbanization and farmland transfer on the spatial patterns of non-grain farmland (NGF). The study found that both NGF area and share have a consistent variation trend which increased first, then decreased, and increased again. There were great differences between NGF area and share, which had various spatial patterns. Global Moran’s I of NGF area and share had strong positive spatial autocorrelations in 2000, 2005, 2010, and 2014, and revealed remarkable clustered spatial patterns. Local spatial autocorrelation analysis found that the spatial agglomeration pattern of the NGF area and the share changed significantly from 2000 to 2014. The spatial patterns of NGF were significantly influenced by regional differences in urbanization and farmland transfer. These results provide critical insights for formulating differential farmland transfer policies and policies for sustainable development of agriculture and rural economy in China.
1. Introduction
China is experiencing rapid urbanization. Its urbanization rate increased rapidly from 17.9% in 1978 to 54.8% in 2014 and is estimated to reach 60% in 2020 at the annual rate of 1% [1]. Rapid urbanization and industrialization of the country drew migrants from rural areas to cities, leading to a trend of population decline in rural areas [2]. The total number of rural-urban migrants working in Chinese cities reached 163 million in 2012, representing 25.44% of the total rural population [3]. This not only relieved the problem of “large population and few land resources” in agricultural production, but also triggered demands for farmland redistribution [4]. After practical explorations of rural land use, farmland transfer has gradually become the main way of farmland redistribution in China [5,6]. It means that rural households with contractual rights of land give certain land management rights to other rural households or economic organizations through sub-contracting, leasing, and investment through shares. Land redistribution policy has to some extent been successful in reducing the poverty and land inequity [7]. In 2014, the area of transferred farmland in China reached 2687 × 104 ha, 30.4% of the total cultivated land area. This percentage was two times higher than the 14.7% of transferred farmland out of the total cultivated land area in 2010 [8]. Compared with other countries in the world, farmland transfer rate (i.e., the share of transferred farmland area in the total cultivated land area) in China is still at a relatively low level. By the end of the 20th century, farmland transfer rates in Uruguay, the Philippines, and Bangladesh reached 41%, 51%, and 42% respectively [9], and the farmland transfer rate in the USA in 1992 and Uganda in 1999 reached 43% and 36% respectively [10].
Farmland transfer is not only closely related to urbanization, rural land rental market, and agricultural modernization [5,6,11], but is also related to the growth of farmers’ income and social stability [12,13]. It has attracted considerable attention from policy makers in China. The first policy document released by the Central Committee of the Communist Party of China (CCCPC) each year has been related to farmland transfer since 2004. The Opinions for Guiding Ordered Transfer of Rural Land Management Rights and Developing Moderate Scale Management of Agriculture (No. (2014) 61) released by the General Office, CCCPC in 2014 had detailed regulations on farmland transfer. Farmland transfer is conducive to developing large-scale land management, achieving agricultural mechanization, and increasing agricultural productivity [6,14,15]. It is an important means for promoting agricultural modernization in China.
Since farmland transfer releases an abundant surplus rural labor force, and planting grain crops (e.g., rice, wheat, corn, sorghum, potato, and soybean) has relatively low earnings, more and more farmland in China is now used for non-grain production, such as oil crops, cotton, bast fiber plants, sugar crops, medicines, vegetables, cucurbites and feed crops. Based on a questionnaire survey on farmland transfer of 1121 rural households in 10 provinces in China, Jiang discovered that the proportions of grain crop area and commercial crop area after farmland transfer were 44.9% and 45.2%, showing obvious “non-grain” phenomenon when compared to existing farmland plantation structure [16]. Based on a survey of 177 rural households in Zhejiang Province, the proportions of grain crop area and non-grain crop area of the original farmland were 86.6% and 13.4%, but the corresponding proportions after farmland transfer were changed to 24.8% and 75.2%, indicating that the share of non-grain farmland (NGF) is 5.6 times higher than that of the original farmland [17].
Significant increase in the area of non-grain farmland (NGF) was also observed in other provinces and cities. The NGF rate of 21 family farms in Wugang City, Henan Province was 61.8% [18] and the NGF rate of 279 family farms in Ningbo City, Zhejiang Province was 90.0% [19]. Due to the large total food consumption in China, a 10% reduction in grain self-sufficiency rate will take 2% of the world’s grain market to compensate [20]. Although China has no food shortage at present, China’s food safety is related to economic security and social stability. Since China has put food safety at the high strategic level of state administration and national security, non-grain farmland (NGF) caused by farmland transfer which leads to heightened food security concern began to attract considerable attention. The Several Opinions on Establishing and Perfecting the Responsibility System of Provincial Governor for Food Security released by the State Council in 2014 stipulates explicitly that “non-grain use of farmland shall be avoided and non-agricultural use of farmland shall be prohibited strictly during the transfer of cultivated land”.
There are great geographic disparities in the urbanization and socioeconomic development in China. Examining the spatial patterns of non-grain farmland (NGF) and the influence of urbanization and farmland transfer on them not only helps to reveal the driving mechanisms of NGF but also enables the government to comprehend the spatiotemporal variations and development trends of non-grain farmland (NGF). The aim of this paper is to analyze the spatial patterns of NGF at municipal-level cities in China from 2000 to 2014, and explore the influence of urbanization and farmland transfer on the spatial patterns of non-grain farmland (NGF). The study found that both NGF area and share presented a consistent variation trend which increased first, then decreased and increased again during this period. Intercity NGF area and share differed greatly. Both NGF area and share had significant positive spatial autocorrelation, showing a remarkable clustered spatial pattern. The study observed that urbanization and land transfer had significant influences on NGF in China. These results provide critical insights for formulating differential farmland transfer policies and policies for sustainable development of agriculture and rural economy in China.
2. Literature Review
Since the end of the 1990s, the amount of transferred farmland in China has increased quite rapidly in the suburbs of metropolitan and coastal areas, and in some grain growing regions. The share of rural households with rented farmland increased from 9.4% in 2000 [21] to 13.5% in 2004 [5] and to 27% in 2008 [12]. The growth of transferred farmland was conducive to urbanization and agricultural development. First, it optimized the allocation of farmland and provided a more efficient way to transfer land from low-productivity farming households to high productivity ones [21,22]. Second, abundant rural surplus labor was released, which improved non-farm employment and enhanced farmers’ income [4,6,23,24]. Third, land rental markets facilitated large-scale land management and lowered production costs [5,14,16,25]. To achieve these benefits, policies in China in recent years have consistently encouraged farmland transfer. Previous studies have further discussed the reasons of farmland transfer. The influencing factors of farmland transfer and willingness of rural households to transfer farmland have been examined from different perspectives, such as resource endowment [26], family characteristics [27], part-time farming [23,24], property features [12,28,29,30], and agricultural production efficiency [15].
Only a few studies to date have examined issues concerning non-grain farmland (NGF) in China. Past research has mainly focused on three aspects. First, analysis of the current situations of NGF. Questionnaire-based investigations of rural households, family farms and agricultural cooperatives in Yanji, Jilin Province [31], Ningbo, Zhejiang Province [19], Shenyang, Liaoning Province [32], Wugang, Henan Province [18], some other provinces and cities in China [8,16,17], Japan [33], and western Oregon and western Washington in the USA [34] have been conducted. These studies estimated and compared the NGF share before and after farmland transfer. In sub-Saharan Africa, only 7% of agricultural investment pertained to basic food crops, while this investment was heavily geared towards commercial crops such as oilseeds (60%), timber and pulpwood trees (15%), and sugar crops (13%) [35]. Several studies focused on land use change involving commercial crops such as rubber, tea, and commercial fruits in tropical and subtropical regions using remotely sensed data [36,37,38].
Second, past studies examined the causes of changing to non-grain farmland (NGF) from socioeconomic perspectives, especially from the perspective of cost and benefit. The relatively low earnings of grain crops are the main cause of non-grain farmland [18]. The average revenues of cotton, flue-cured tobacco, watermelon, cucumber, pepper, and lotus root were 4.4 times that of rice. The annual revenues of flowers, fruits, and nursery-grown plants were 6–12 × 104 yuan/ha, 6–7.5 × 10⁴ yuan/ha and 1.5–3 × 10⁴ yuan/ha, which were far higher than the annual revenue of 1500 yuan/ha of grain crops [17]. Other studies found that the choice of commercial crop farming is affected by household and individual characteristics, local and macro-economic factors, and land use policy [39,40]. For example, Kline found that land use law and urban growth boundaries had a significant inhibitory effect on the growth of non-agricultural land in western Oregon and western Washington in the USA [34]. Nevertheless, Zhang and Du found that labor input per unit area of grain crops was significantly lower than that of non-grain crops [40]. With the expansion of the land management area, labor consumption would surely soar given the relatively low labor productivity of non-grain crops. Therefore, land transfer will not necessarily lead to an increase in non-grain farmland (NGF) if adequate labor input is not available. Note that it is easier to change small land management areas to NGF than to change large land management areas, where planting grain crops is often preferred. Besides, the higher the land rent, the more farmland is changed to NGF to gain more revenues and compensate the costs [41,42].
Third, a growing number of studies focus on the spatial pattern of non-grain farmland (NGF) and find evidence for the spatial clustering of NGF [43,44,45]. Agglomeration economies may explain spatial clustering of NGF. Spatial dependence in technology adoption is usually attributed to agglomeration economies associated with cost reductions that result from greater availability of knowledge and high-quality extension, when neighboring farmers are also adopters [46]. Schmidtner et al. found evidence of economies of agglomeration in organic farming [47]. Boncinelli et al. found that proximity reduces transaction and information costs [45]. Studies in China also showed that agglomeration of population, industries and technology affected on spatial pattern of farmland [48,49]. These evidences, however, are mostly based on county level data [47], rural household level data [46], and plot level data [50]. While research on the spatial patterns of non-grain farmland (NGF) on the national level in China is scarce, it is useful for improving the design of national agricultural policies and land use policies.
Previous research has pointed out that NGF is becoming a major challenge to sustainable urbanization and food security in China. It posed an important research problem and made conclusions based on empirical investigations. However, these studies are mainly case studies based on micro-scale questionnaire surveys of rural households from a socioeconomic perspective. They did not involve any systematic analysis of the geographic disparities and spatial patterns of NGF. This study seeks to fill this significant knowledge gap by examining the farmland transfer in China from 2000 to 2014.
3. Methodology
3.1. Research Framework
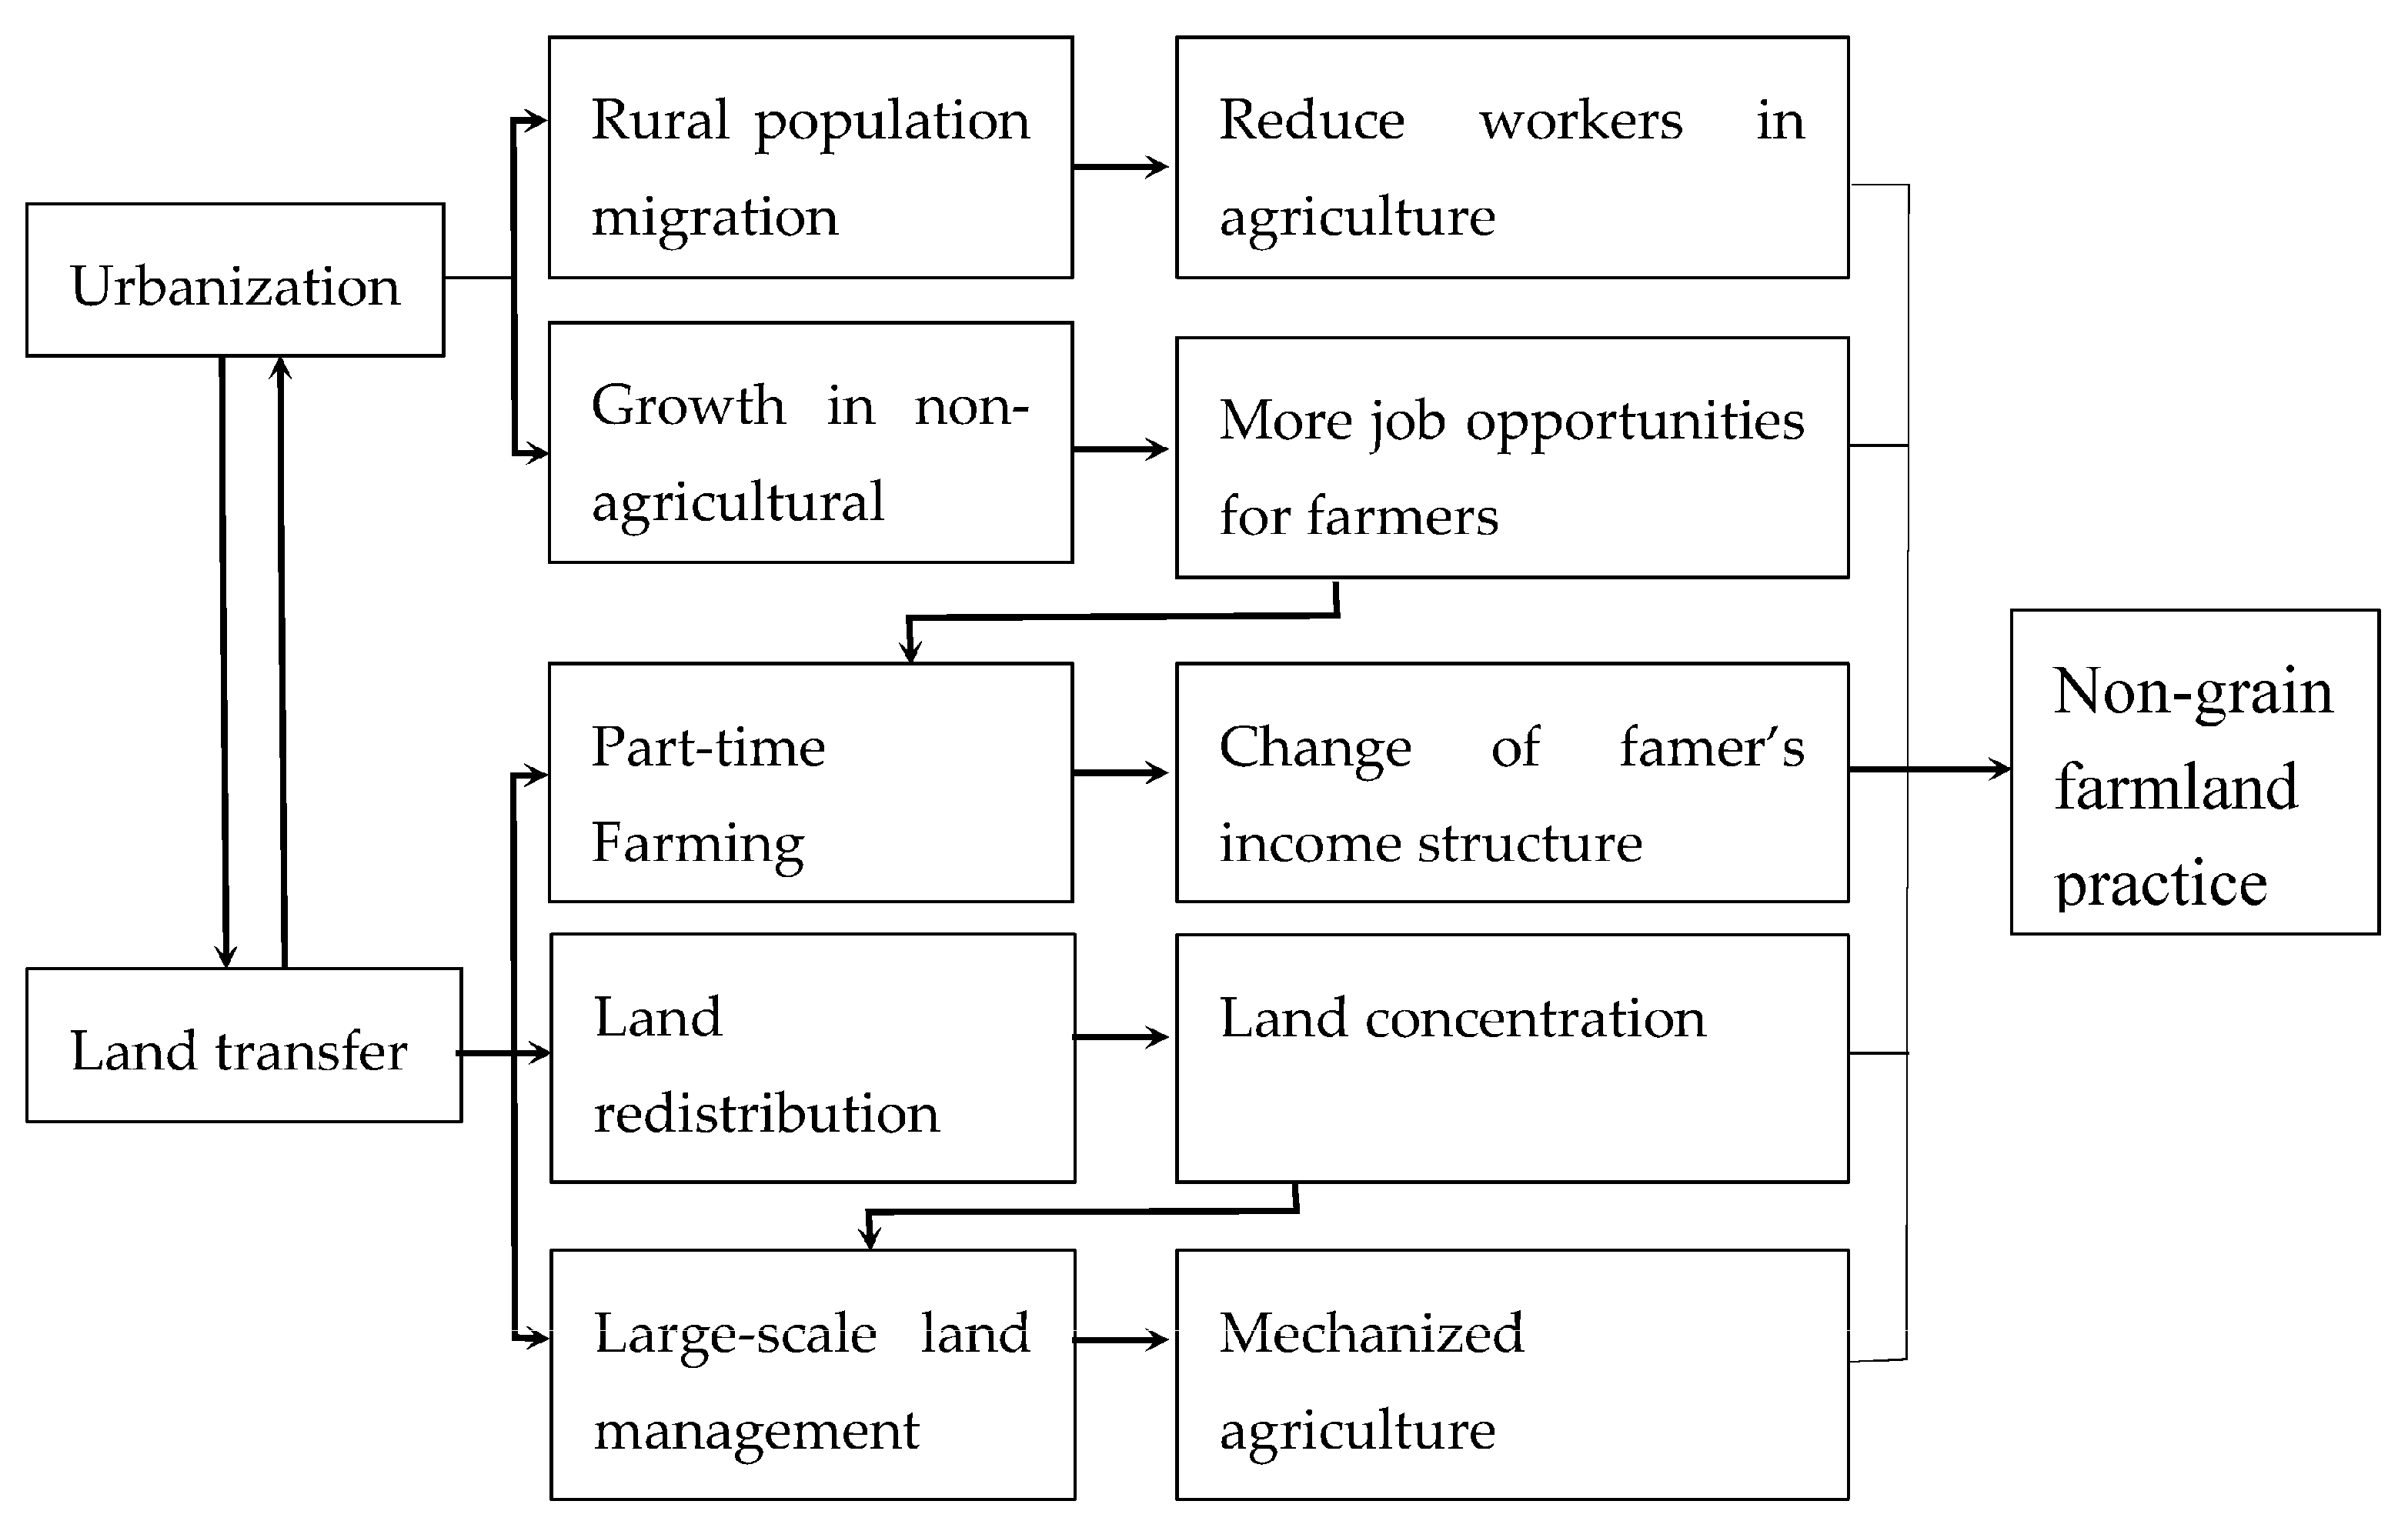
This research is based on the theoretical framework presented in Figure 1, which conceives that NGF practice is intimately linked to the urbanization and farmland transfer in China. It also reflects the interrelation between rural land use and development of the rural economy. Urbanization influences non-grain farmland (NGF) through two processes. On the one hand, rural population migrates to cities, which reduces agricultural labor force. Rural households may thus need to adjust their grain production behaviors according to the amount of labor force and farmland area. On the other hand, industrial growth creates more job opportunities for farmers, who will adjust their grain production behaviors by comparing their income before and after engaging in non-agricultural employment. Therefore, the influence of urbanization on NGF can be measured by urbanization rate (UR) and the shares of secondary and tertiary industries output value in total regional GDP (SOVSTI) (Table 1).
Specifically, farmland transfer influences NGF through the following processes. First, farmland transfer changes the distribution of the original farmland among rural households where few people will own more farmlands. Second, farmland transfer promotes large-scale land management, increases agricultural machinery utilization, and changes the agricultural planting pattern. Third, farmland transfer releases abundant rural surplus labor, increases part-time farming, and changes the income structure of farmers. These changes may influence the grain production behaviors of peasants. Therefore, the influence of farmland transfer on the spatial patterns of NGF was measured by per capita income of rural household (PCIRH, in Yuan), cultivated land per household (CLPH, in ha/household), the number of agricultural employees in agriculture, animal husbandry, and fishery (AE), the share of agricultural employees in agriculture, animal husbandry, and fishery in total rural employees (SAE) and the total power consumption of agricultural machinery (TPAM, in 104 kw) (Table 1).
3.2. Spatial Autocorrelation Analysis
Spatial autocorrelation is the phenomenon that the values of a spatial variable (e.g., share of non-grain farmland) of nearby locations may be similar, leading to biased estimates (usually overestimation) of the spatial relationship being examined. It is often described by global and local indicators such as Moran’s I, Geary’ C and Getis’s G [51,52,53]. To measure how NGF is spatially autocorrelated among the cities in China, this paper calculated Moran’s I values and assessed the null hypothesis of no spatial autocorrelation. The value of Moran’s I ranges between +1 to −1. Positive spatial autocorrelation indicates that similar values are showing in adjacent and nearby locations, and the Moran’s I is closer to 1. While when the Moran’s I tends to −1, it shows negative spatial autocorrelation which represents a pattern of high values locating among low ones. If the spatial distribution of the values is completely random, this means no spatial autocorrelation is observed and Moran’s I would approximate to zero. A row-standardized spatial weight matrix “W” is used to describe the neighbor relationships in spatial autocorrelation analysis [54]. Wij represents the spatial weights assigned to pairs of units i and j. Cities that share common borders are defined as neighbors. Equation (1) refers to global Moran’s I and Equation (2) is local Moran’s I as follows [55]:
where n is the number of spatial units; Xi and Xj are the values of variable x in spatial unit i and j; is the average over all spatial units of the variable, and Wij is the spatial weight matrix representing the relationship strength between two spatial units.
Standardization is performed on the NGF data before calculation. Standard deviation (z-score) and probability (p-value) returned by Moran’s Iglobal are used to measure if the null hypothesis is rejected. The criteria of p-value, z-score, and the corresponding confidence level can be found in books such as Anselin [51]. The Z test is used to test the statistical significance of the observed Moran’s I (Equation (3)):
where Z(I) represents the significance of Moran’ I, E(I) is the mathematical expectation of Moran’ I, and VAR(I) refers to the variance.
The global Moran’s I cannot show the location of the clusters and the type of spatial autocorrelation [51]. Therefore, the local indicator of spatial autocorrelation (LISA) was used and mapped to illuminate local spatial association and the significance of local spatial patterns. In particular, the map of the spatial patterns of LISA includes five categories [40]. “High-High” and “Low-Low” mean positive spatial autocorrelation; “High-Low” and “Low-High” refers to negative spatial autocorrelation. “Not Significant” means no statistically significant spatial autocorrelation [56].
3.3. Spatial Regression Models
Spatial regression models are useful for analyzing and characterizing spatial phenomena. This paper applies spatial lag model (SLM) and spatial error model (SEM) to analyze spatial effects such as spatial dependence entailed in the data. These two models have advantages of sharing the same explanatory variables and information about a nearby region. SLM examines the spatial correlation of the dependent variable, which can be represented by Equation (4).
where y is the dependent variable; X is the measurement matrix of the explanatory variables of n × k; ρ is the spatial regression coefficients reflecting the inherent spatial dependence of the data and the influences of y on the observation of surrounding or neighboring spaces; W refers to the spatial weight matrix of n × n order, which generally uses Rooks Contiguity Matrix ; Wy indicates spatially lagged variables; β is a parameter vector relevant to the explanatory variables X; and ε is the random error term.
SEM takes into account the error process through the covariance of difference and can be represented by Equation (5).
where the dependent variable y is the vector of n × 1; X is the independent variable matrix of n × k; parameter β reflects the influences of independent variables X on the dependent variable y; ε is the random error term; W is the spatial weight matrix; λ is a parameter of spatial error and measures the spatial dependence function of the observed values, namely the direction and degree of the influences of observed value y in neighboring areas on the observed value y of local areas; μ is a random error vector of normal distribution. The spatial dependence function of SEM exists in errors of disturbance and measures the influence of the error of the dependent variable in neighboring areas on the observed value of a local area.
3.4. Data Sources
In this study, cities at the municipal level are used as the spatial units for examining non-grain farmland (NGF). The study period is from 2000 to 2014. Administrative divisions at the municipal level remained unchanged from 2004 to 2010 in China, and were readjusted slightly in other years. To ensure comparability of the results between different years, administrative units in years outside the 2004–2010 period are combined or decomposed to match the administrative units of the 345 municipal-level cities in 2010, which includes four directly controlled municipalities, 15 vice-provincial cities, 268 prefecture cities, and 58 counties administrated directly by province. Note that data for Hong Kong, Macao, Taiwan and most of the cities in Hainan Provinces were not available. Cities in these regions or provinces are thus not included in this study.
Two indexes are used to measure NGF: area and share. NGF area (in ha) is the difference between the sown area of crops and the sown area of grain crops, which is used to measure the quantity of NGF in a region (Table 1). NGF share is the proportion of NGF area in the total sown area of crops, which measures the share of NGF in a region (Table 1). The sown area of crops is the sum of cultivated and non-cultivated lands which harvest agricultural products, including actual planting area or areas with transplanted crops. Crops include grain crops, oil crops, cotton, fiber plants, sugar crops, medicine crops, vegetables, cucurbites, and feed crops. The sown area of grain crops refers to the area planted with rice, wheat, corn, sorghum, potatoes, and soybeans.
All data used in this research were obtained from statistical yearbooks (2001, 2006, 2011, and 2015) of 30 provinces, municipalities and autonomous regions, as well as the China Statistical Yearbook (2001–2015) and the China Rural Statistical Yearbook (2001–2015).
4. Results
4.1. Evolution and Spatial Distribution of Non-Grain Farmland
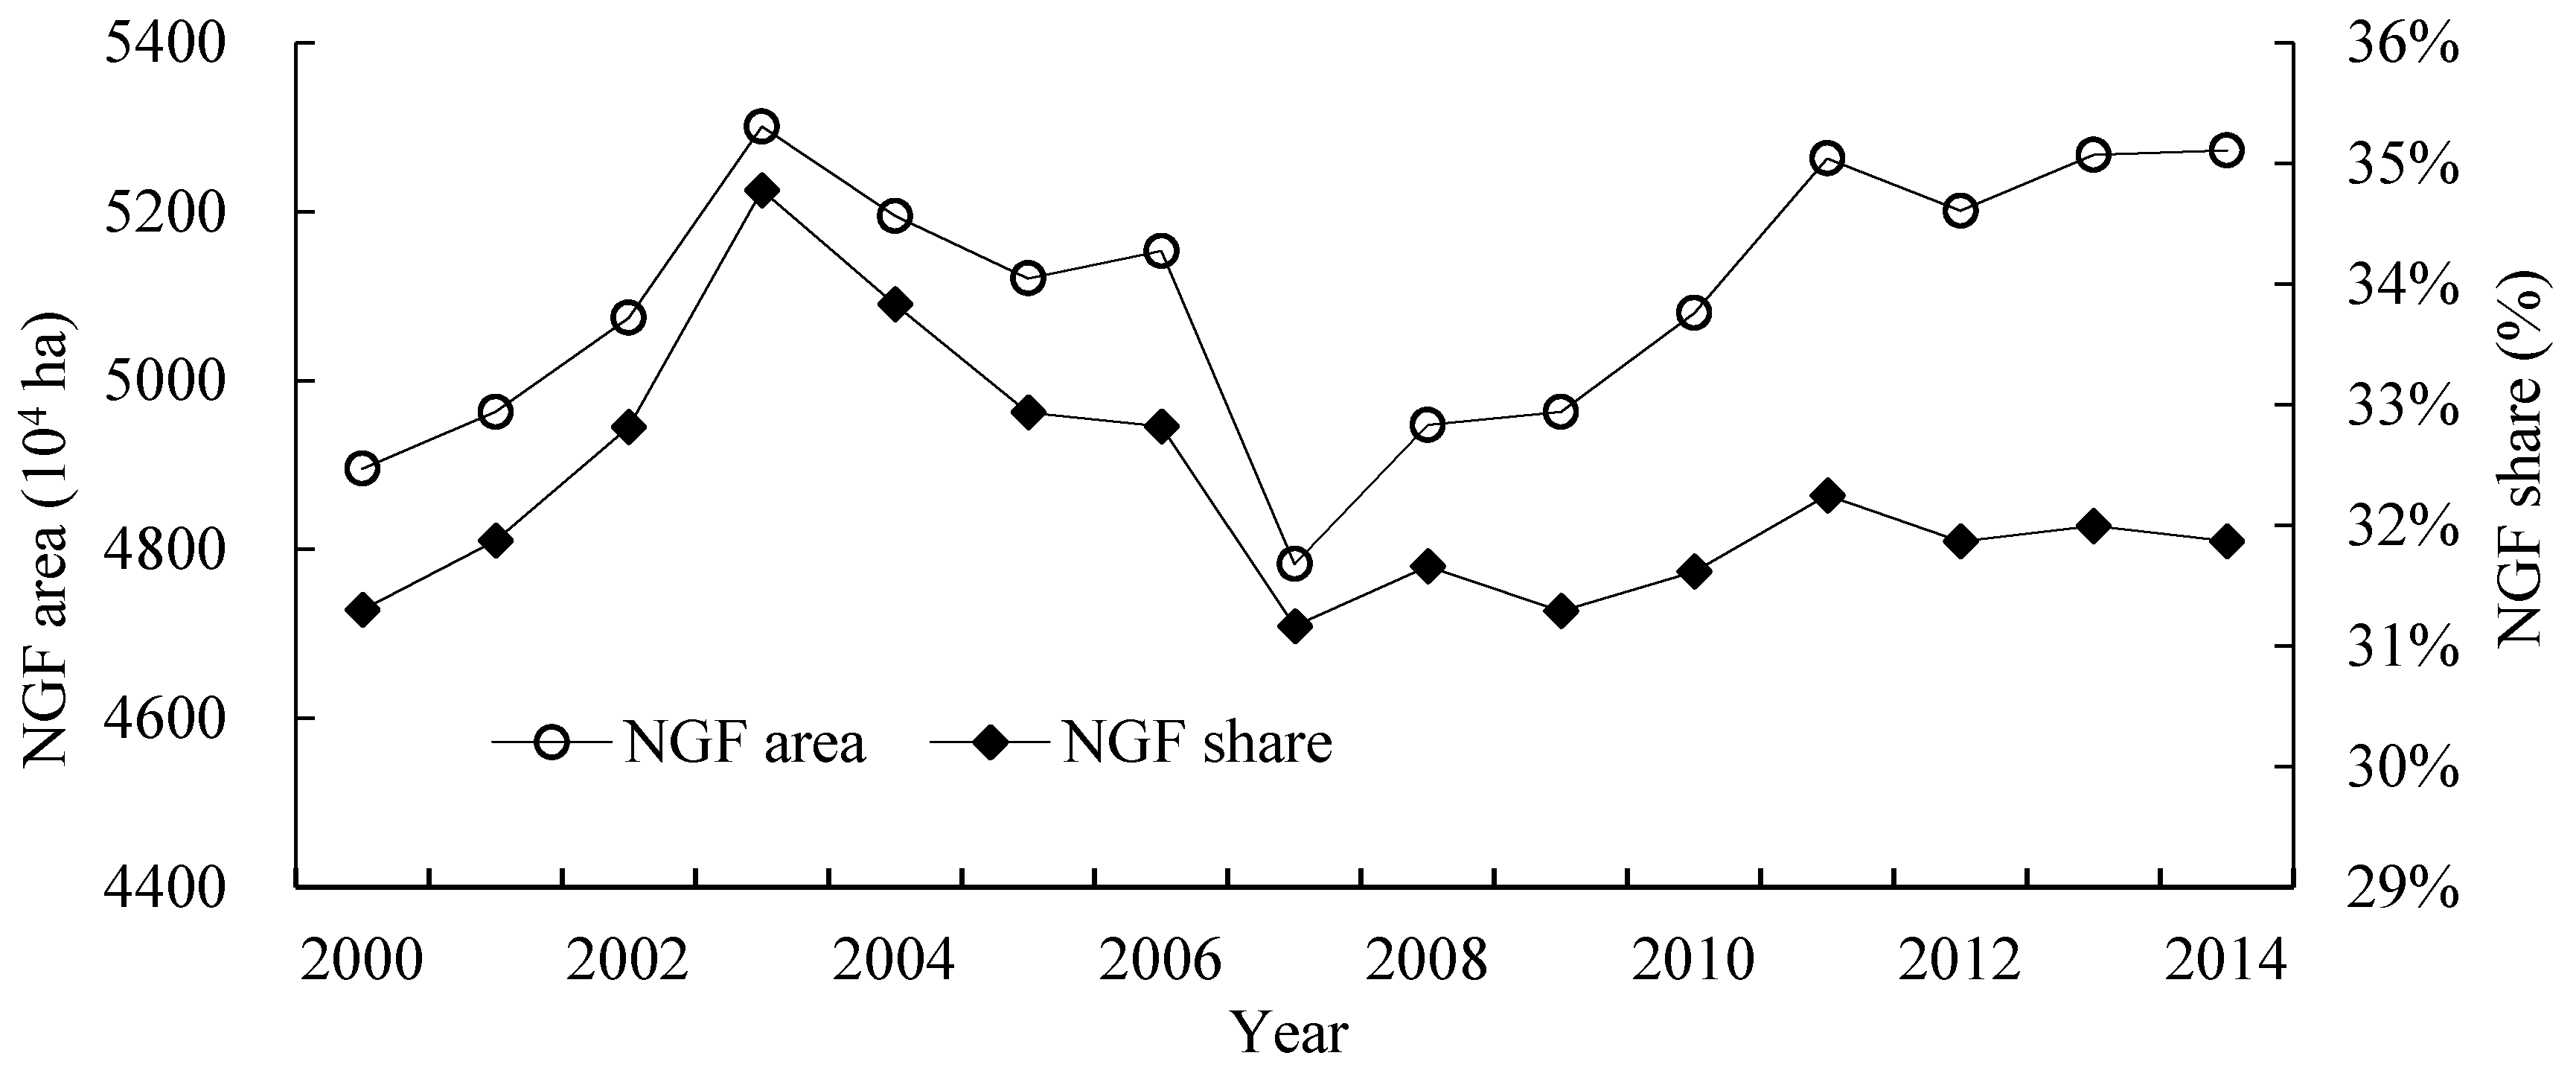
Non-grain farmland (NGF) area and share had a consistent trend from 2000 to 2014. It increased first, then decreased and increased again, and showed different characteristics at different stages (Figure 2). NGF area increased quickly from 4896 × 104 ha in 2000 to 5300 × 104 ha in 2003, while NGF share increased from 31.3% to 34.8%. Agricultural tax was abolished in China in 2005, which reduced the grain production cost significantly and increased farmers’ incomes. NGF area and share began to drop remarkably after 2004, and decreased to 4783 × 104 ha and 31.2% in 2007. Subsequently, NGF area increased significantly and reached 5272 × 104 ha in 2014, while NGF share increased slightly and rose to 31.9% in 2014.
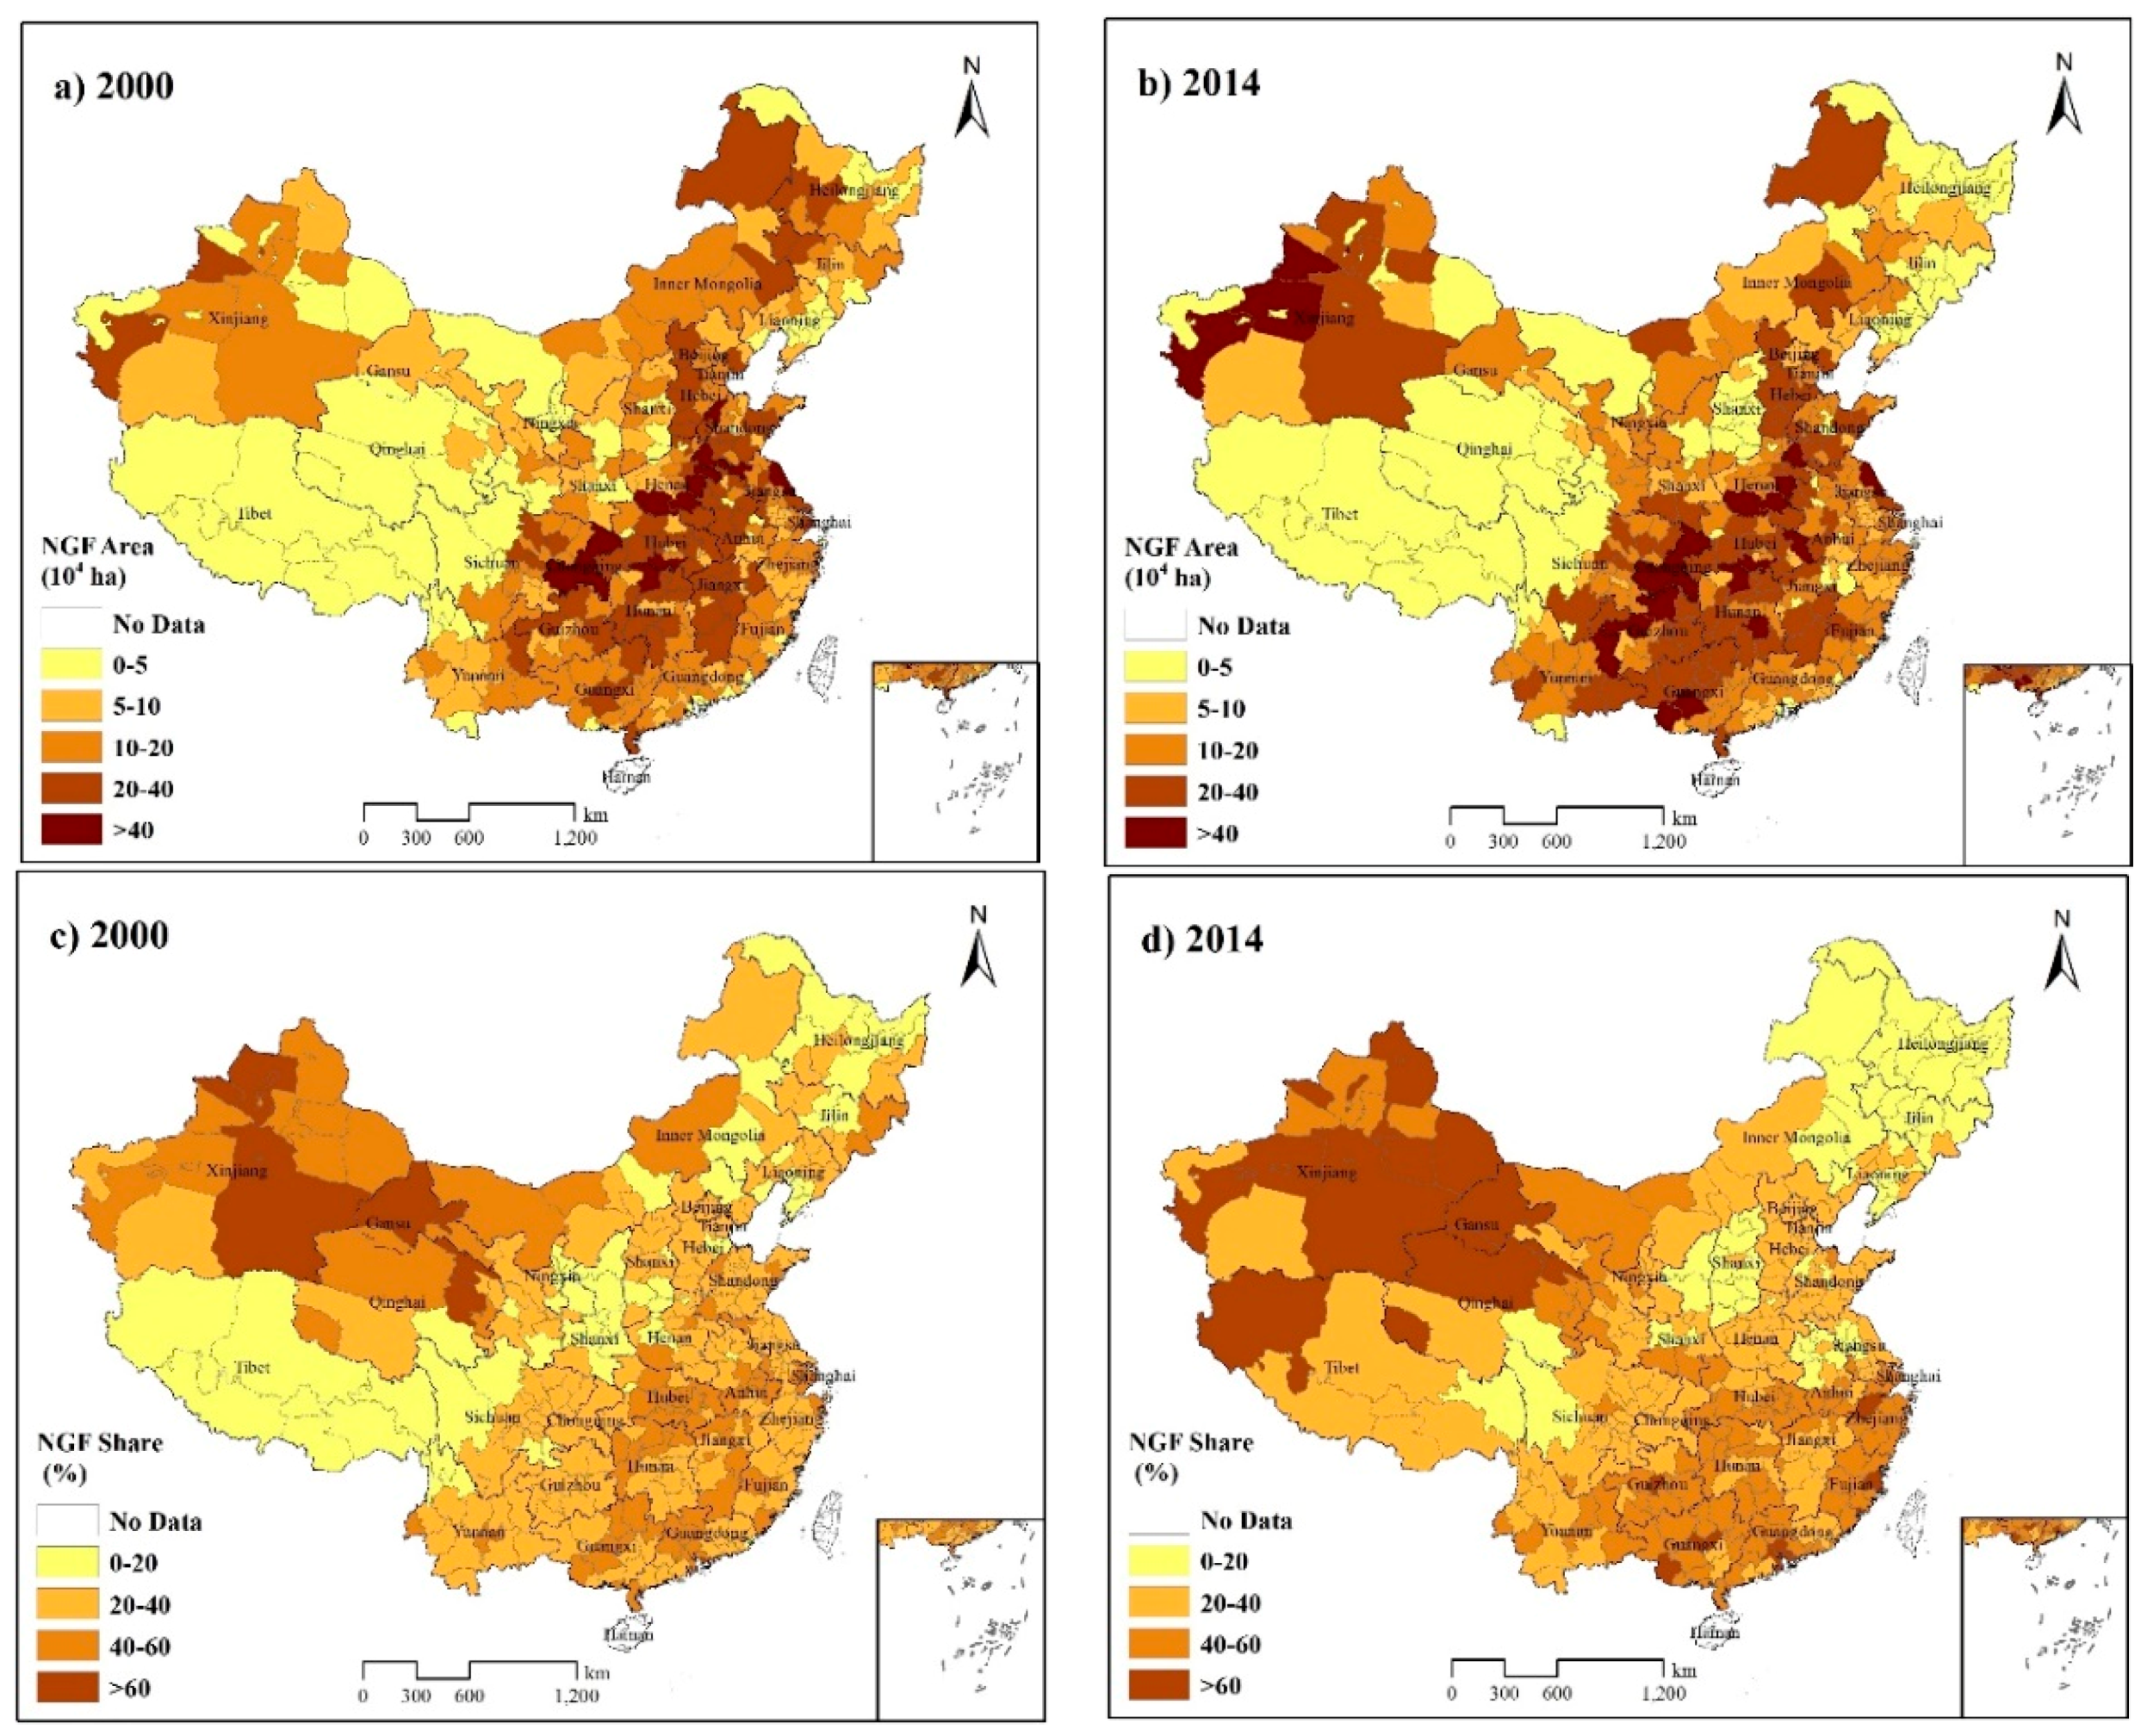
The area of NGF differed greatly between the cities. In 2000, the NGF area of 11 cities exceeded 40 × 104 ha (Figure 3a). Chongqing had the largest NGF area of 82 × 104 ha. In 2014, the NGF area of 18 cities exceeded 40 × 104 ha (Figure 3b) and Chongqing still had the largest NGF area, increasing to 130 × 104 ha. The number of cities with NGF area of 20–40 × 104 ha changed slightly, which only increased from 68 in 2000 to 70 in 2014. However, the spatial pattern of the NGF area changed greatly. In 2000, cities with a large NGF area were mainly concentrated in central China, such as Hubei, Hunan, Jiangxi, Anhui, and Henan Provinces, but shifted to southwestern China like Guangxi and Guizhou Provinces in 2014. The number of cities with an NGF area of 10–20 × 104 ha witnessed a notable increase from 96 in 2000 to 110 in 2014. The number of cities with an NGF area of 5–10 × 104 ha decreased sharply from 85 in 2000 to 59 in 2014. The number of cities with an NGF area smaller than 5 × 10⁴ ha changed slightly, which increased from 85 in 2000 to 88 in 2014 (Figure 3), but presented great spatial changes. These cities were mainly distributed in Tibet, Qinghai, west Sichuan, west Inner Mongolia, and Ningxia Provinces in 2000, but they were distributed widely in Shanxi, Jilin and Heilongjiang Provinces in 2014. The spatiotemporal changes of NGF area indicated two features. First, the NGF area of the vast majority of cities increased generally during these 15 years. Second, the spatial distribution of the NGF area polarized at the high and low ends, manifested by an increasing number of cities with a small and large NGF area.
The share of NGF also differed greatly between the cities, but it had a different spatial pattern when compared to that of NGF area. In 2000, the NGF share of 11 cities was more than 60%, and these cities were mainly distributed in Xinjiang, Qinghai, and Gansu Provinces (Figure 3c). Shenzhen had the highest NGF share of 94.8%. In 2014, the number of cities with more than 60% of NGF share increased to 32, and these cities were mainly distributed in Xinjiang, Tibet, and Qinghai Provinces. Some cities in Guangdong, Fujian, and Zhejiang Provinces also had higher than 60% of NGF share (Figure 3d). Shenzhen still had the highest NGF share of 99.8%. The number of cities with an NGF share of 40–60% increased notably from 83 in 2000 to 99 in 2014. It expanded from the junction of Xinjiang, Qinghai, and Inner Mongolia as well as around the junction of Hunan and Jiangxi Provinces in 2000 to Zhejiang, Fujian, Hunan, Hubei, Guangxi, Guangdong, Guizhou, and eastern Yunnan in 2014. The number of cities with an NGF share of 20–40% dropped notably from 188 in 2000 to 151 in 2014. The number of cities with an NGF share less than 20% remained the same 63 in 2000 and 2014, but the spatial pattern changed greatly. The NGF share in most cities in Ningxia and Tibet Provinces increased greatly, whereas the NGF share in northeastern China, Shanxi, and Anhui Provinces decreased dramatically. The spatiotemporal changes of NGF share had two features. First, the number of cities with an NGF share more than 40% increased significantly. Second, the spatial agglomeration of NGF share intensified.
4.2. Spatial Pattern of Non-Grain Farmland
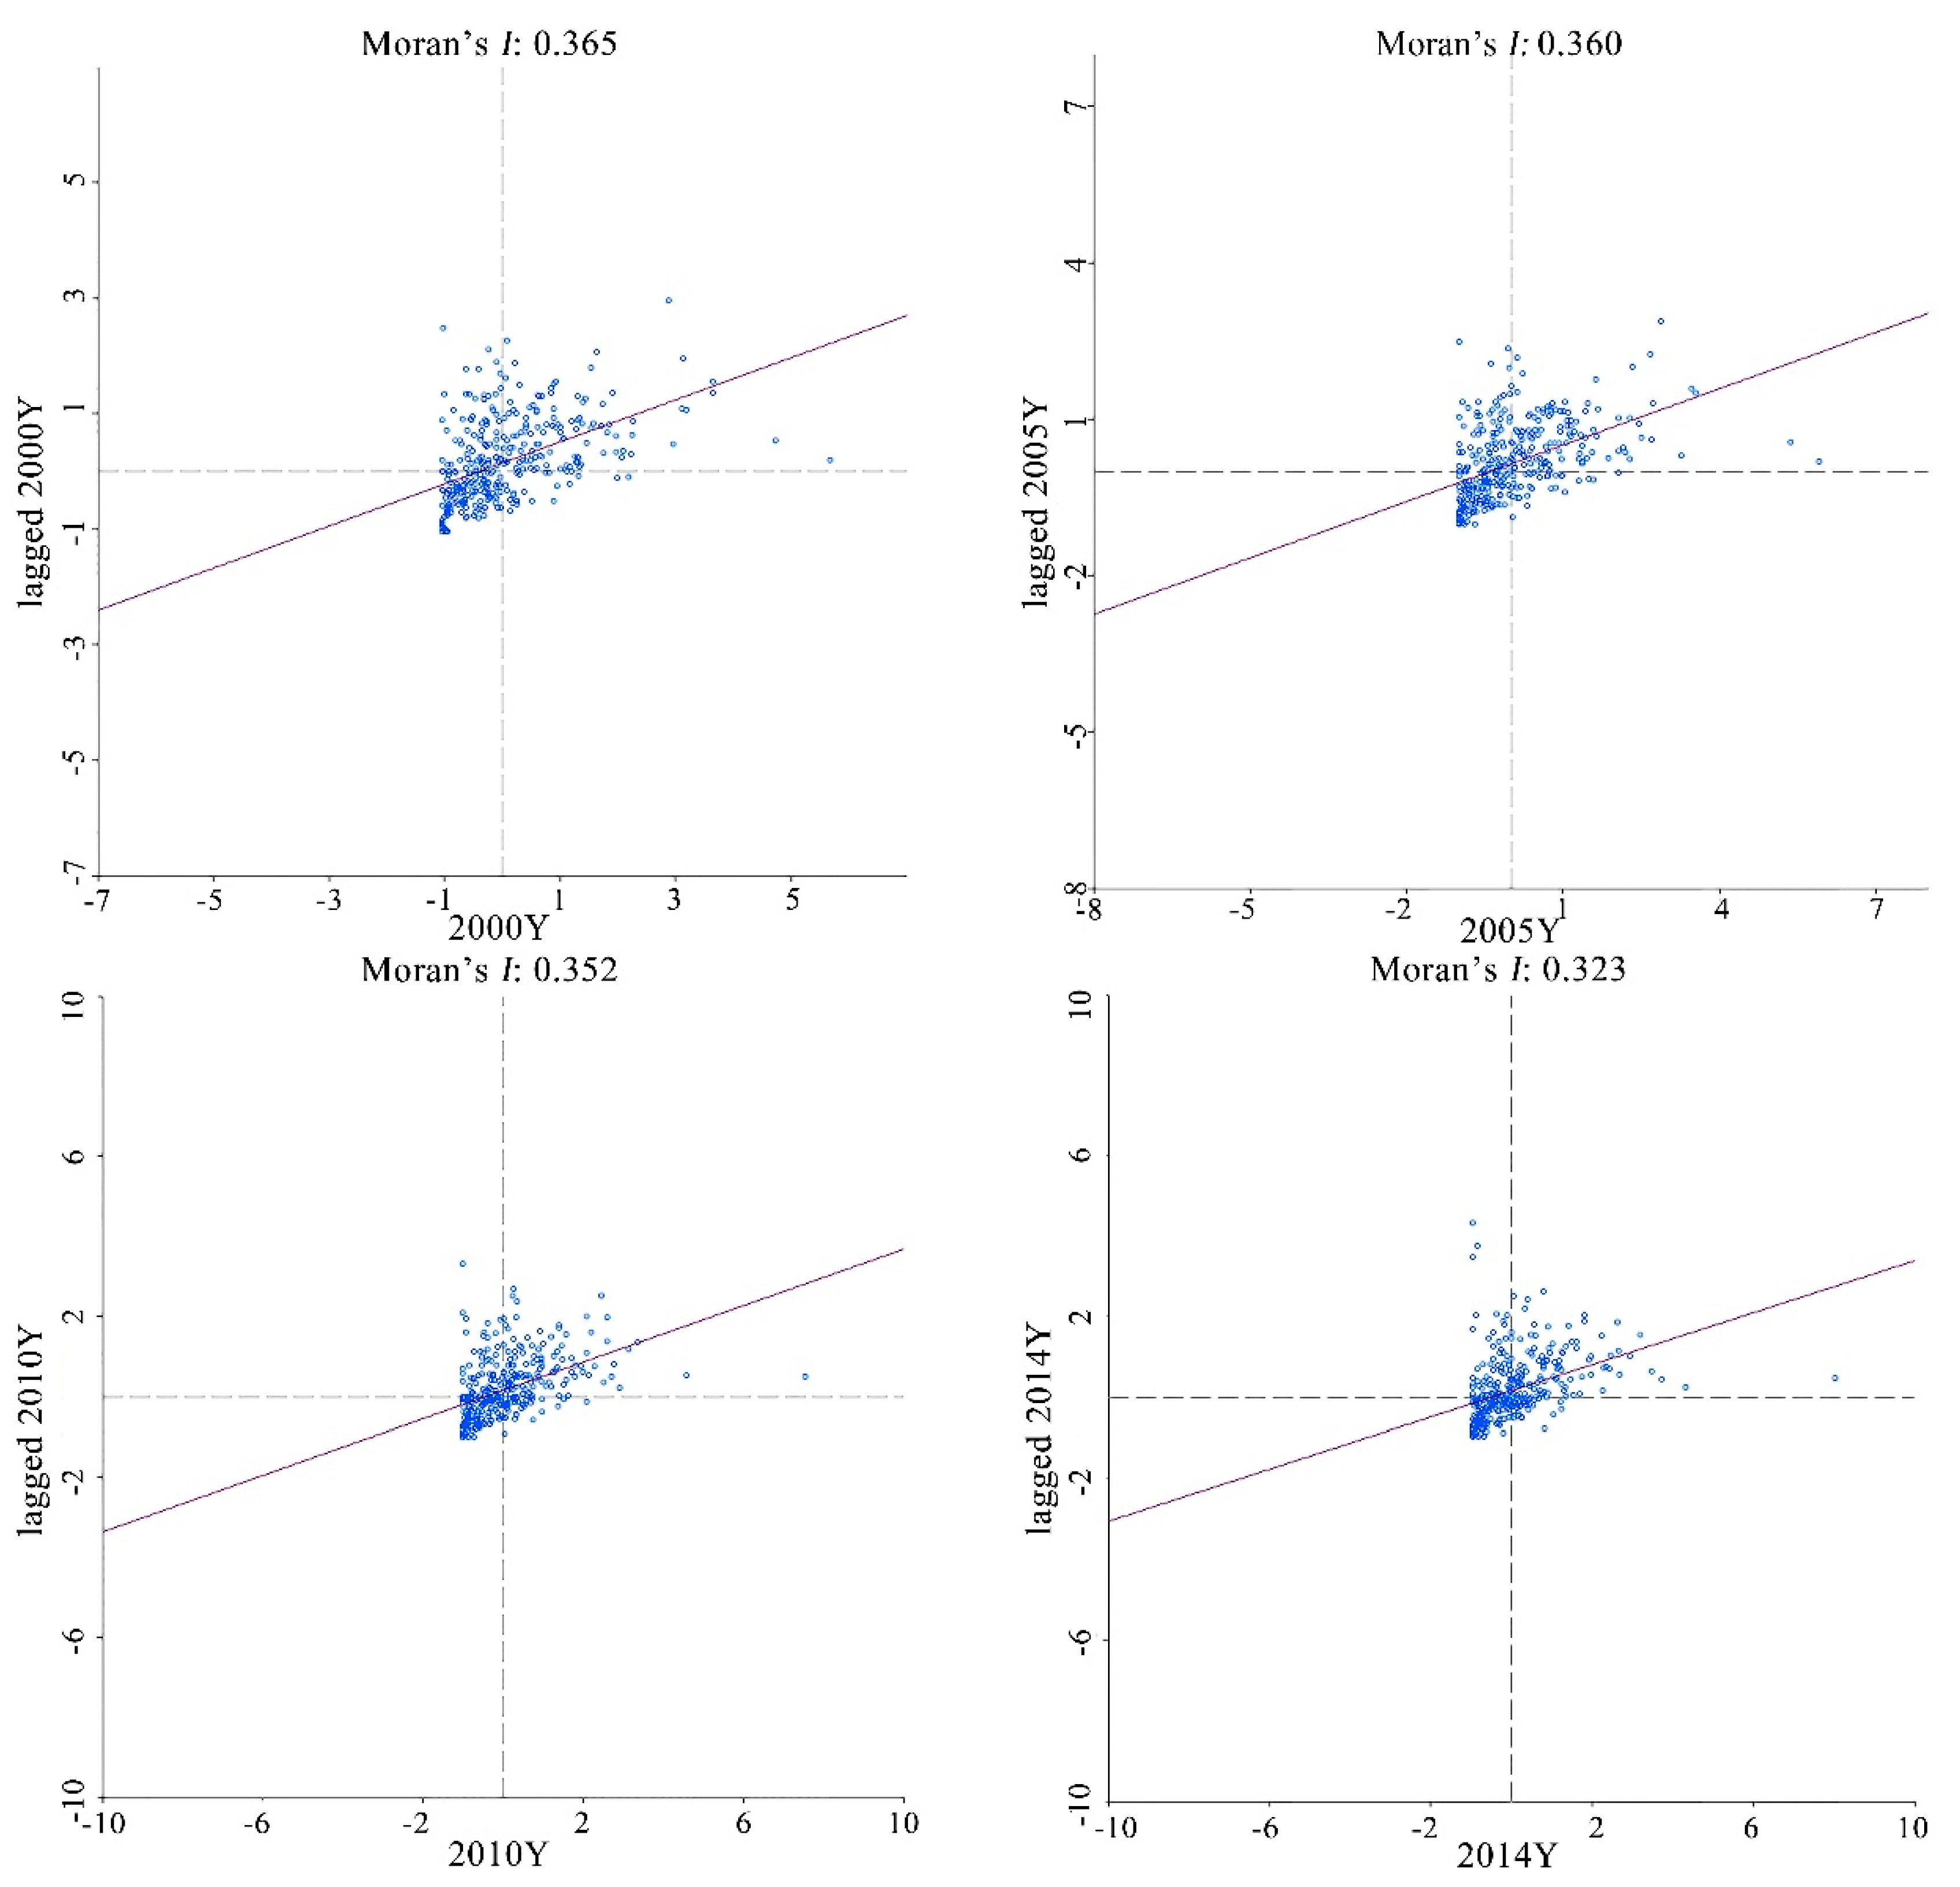
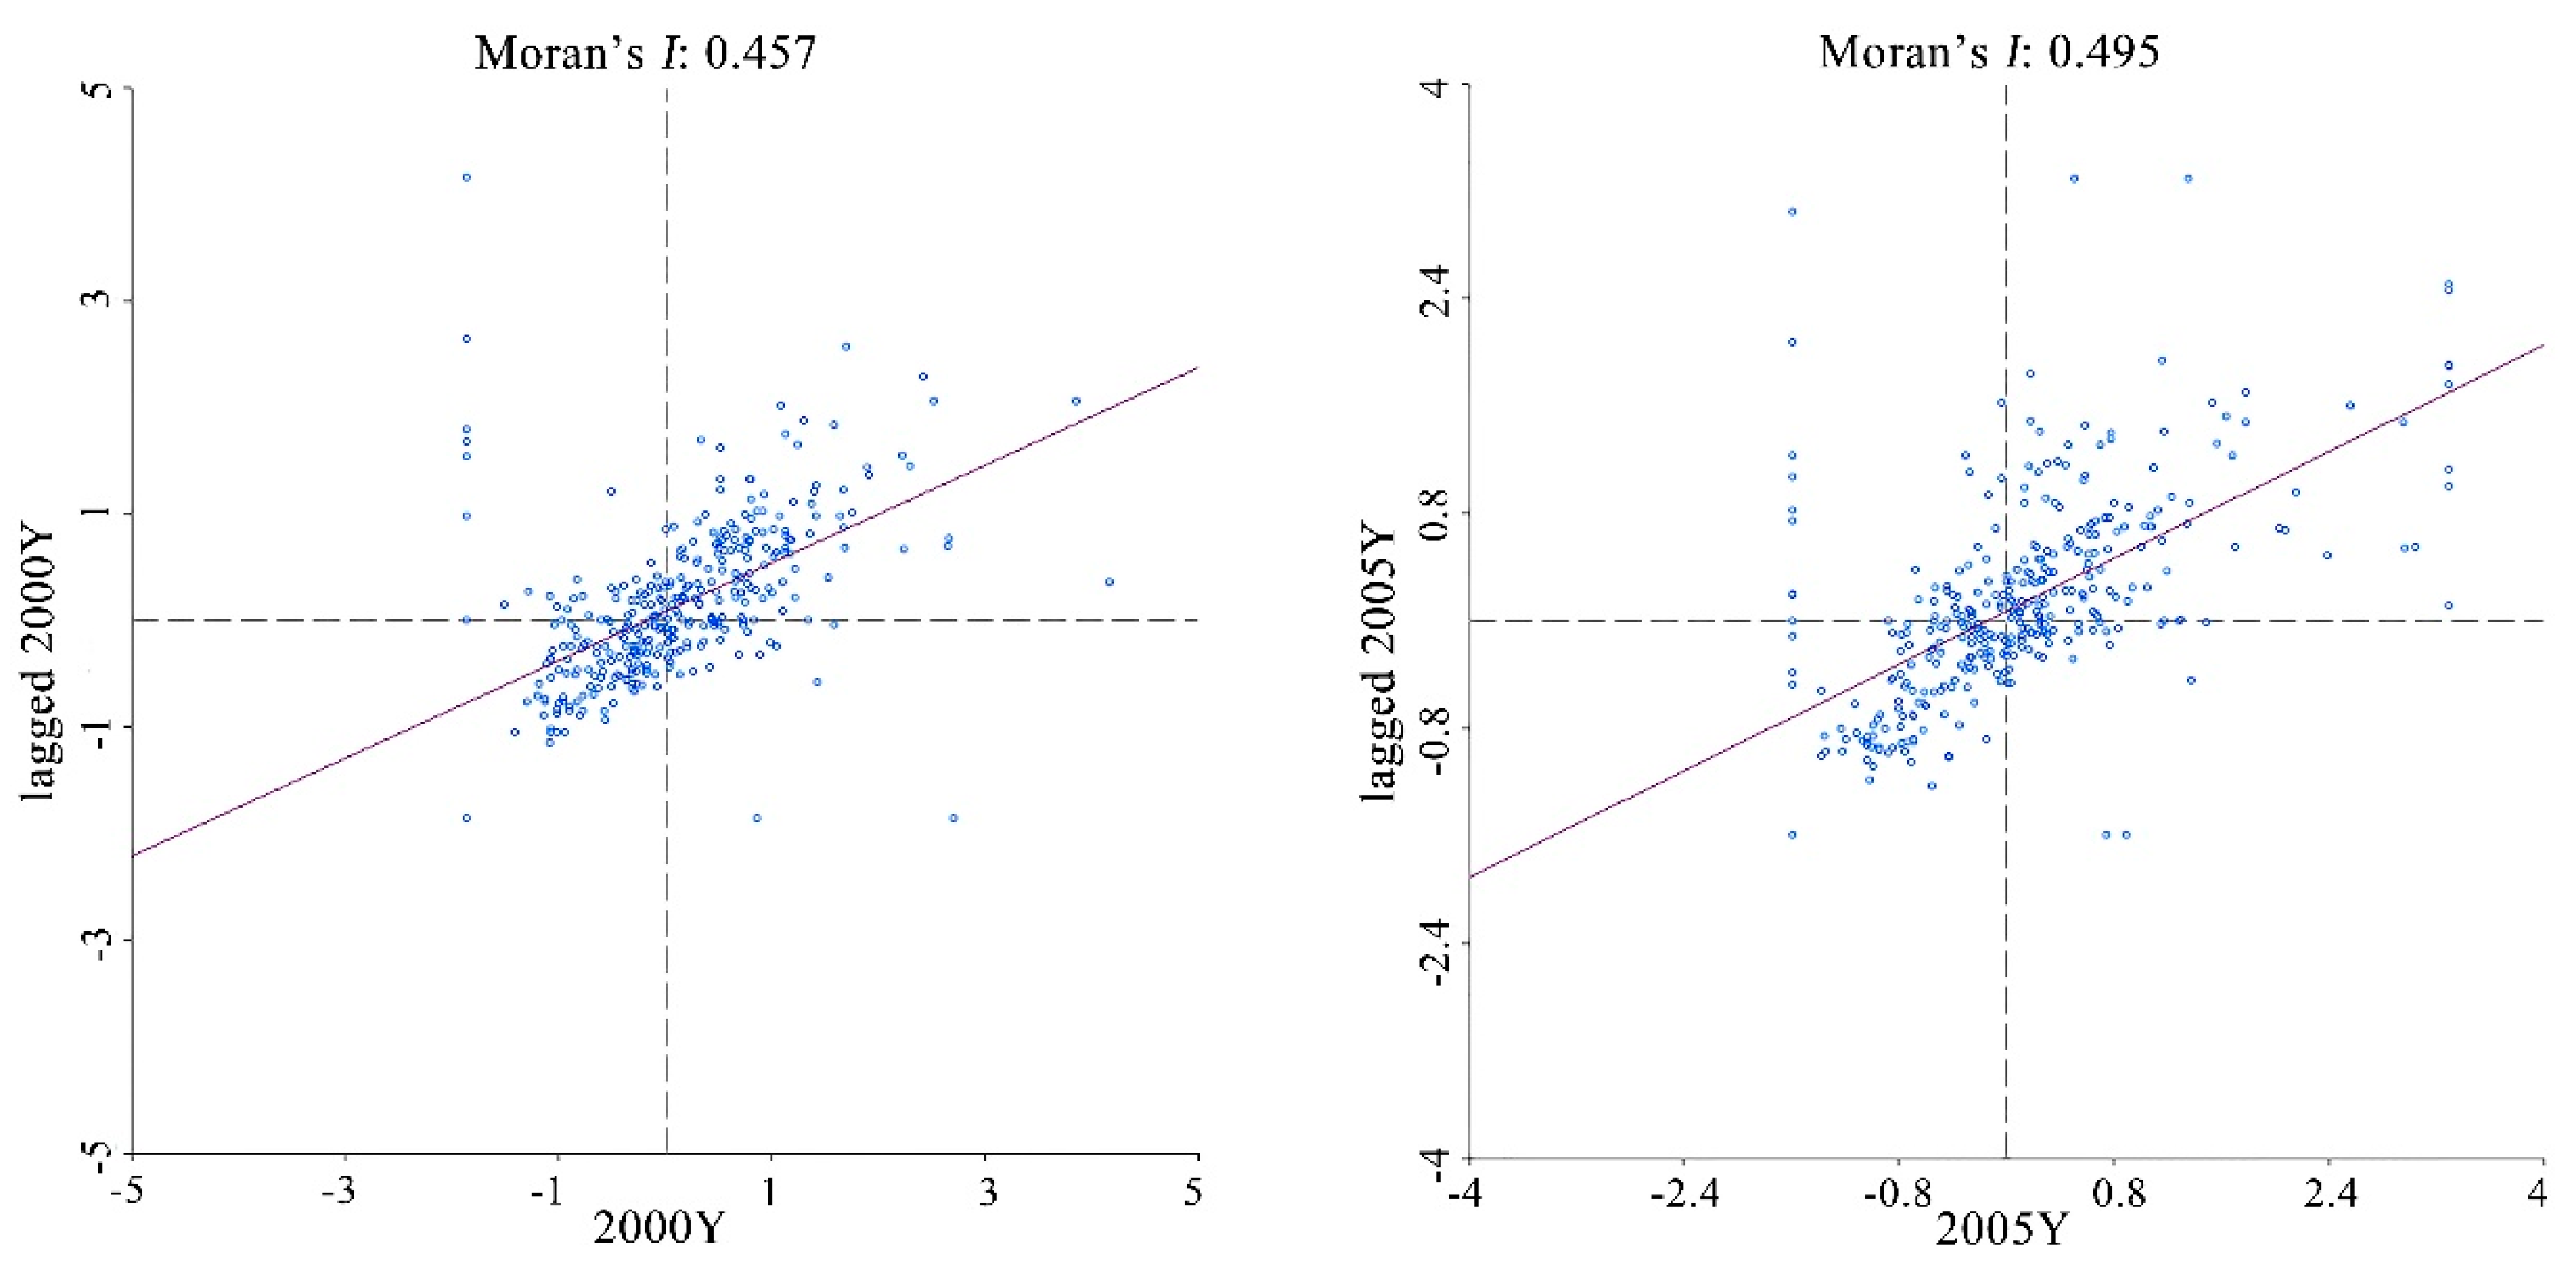
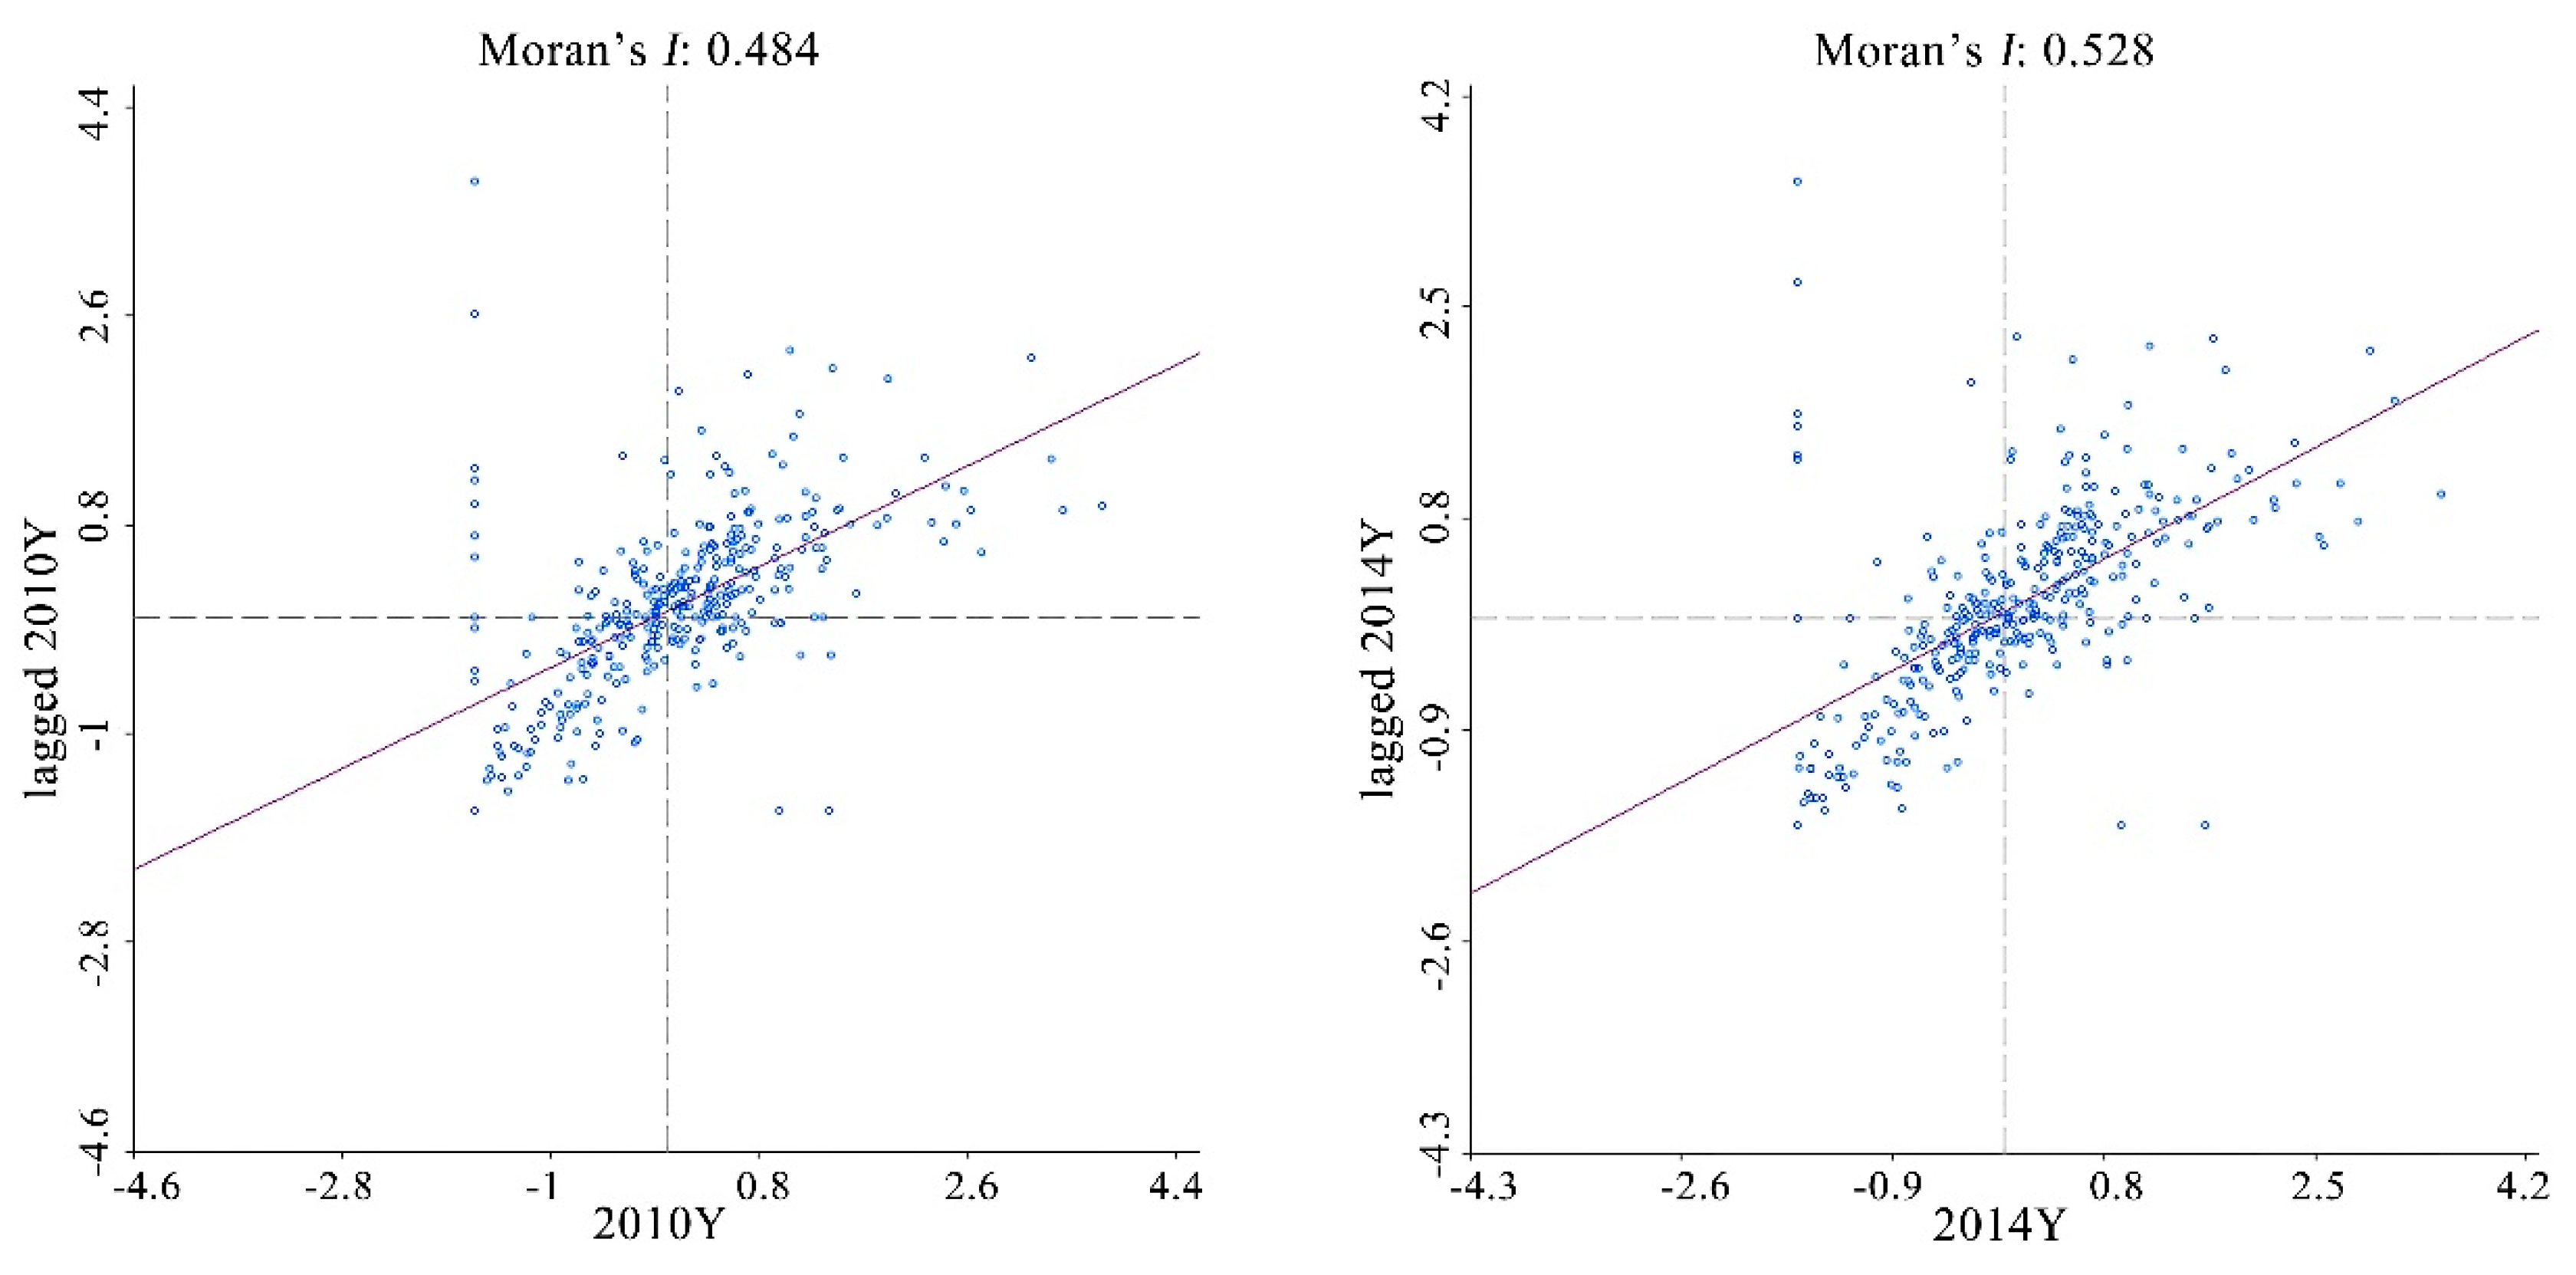
Global spatial autocorrelation analysis was performed by means of Moran’s I statistic and its visualization in the form of a Moran scatter plot in this study. The Moran scatter plots of NGF area in 2000, 2005, 2010, and 2014 are shown in Figure 4, which reflect changes in the spatial pattern of NGF area. The global Moran’s I of NGF area was 0.365 (p = 0.001) for 2000, which decreased to 0.360 (p = 0.001) for 2005 and 0.352 (p = 0.001) for 2010, and decreased to 0.323 (p = 0.001) for 2014. All the global Moran’s I of NGF area in these four years are significant at the 0.01 level. They indicate significantly positive spatial autocorrelation and have a remarkable clustered pattern. The Moran scatter plots of NGF share in 2000, 2005, 2010, and 2014 are shown in Figure 5. The global Moran’s I of NGF share presented an overall upward trend from 0.457 (p = 0.001) for 2000 to 0.495 (p = 0.001) for 2005, but it decreased to 0.484 (p = 0.001) for 2010 and then increased to 0.528 (p = 0.001) for 2014. All of the global Moran’s I of NGF share in these four years are significant at the 0.01 level. They also had significantly positive spatial autocorrelation and have a remarkable clustered pattern.
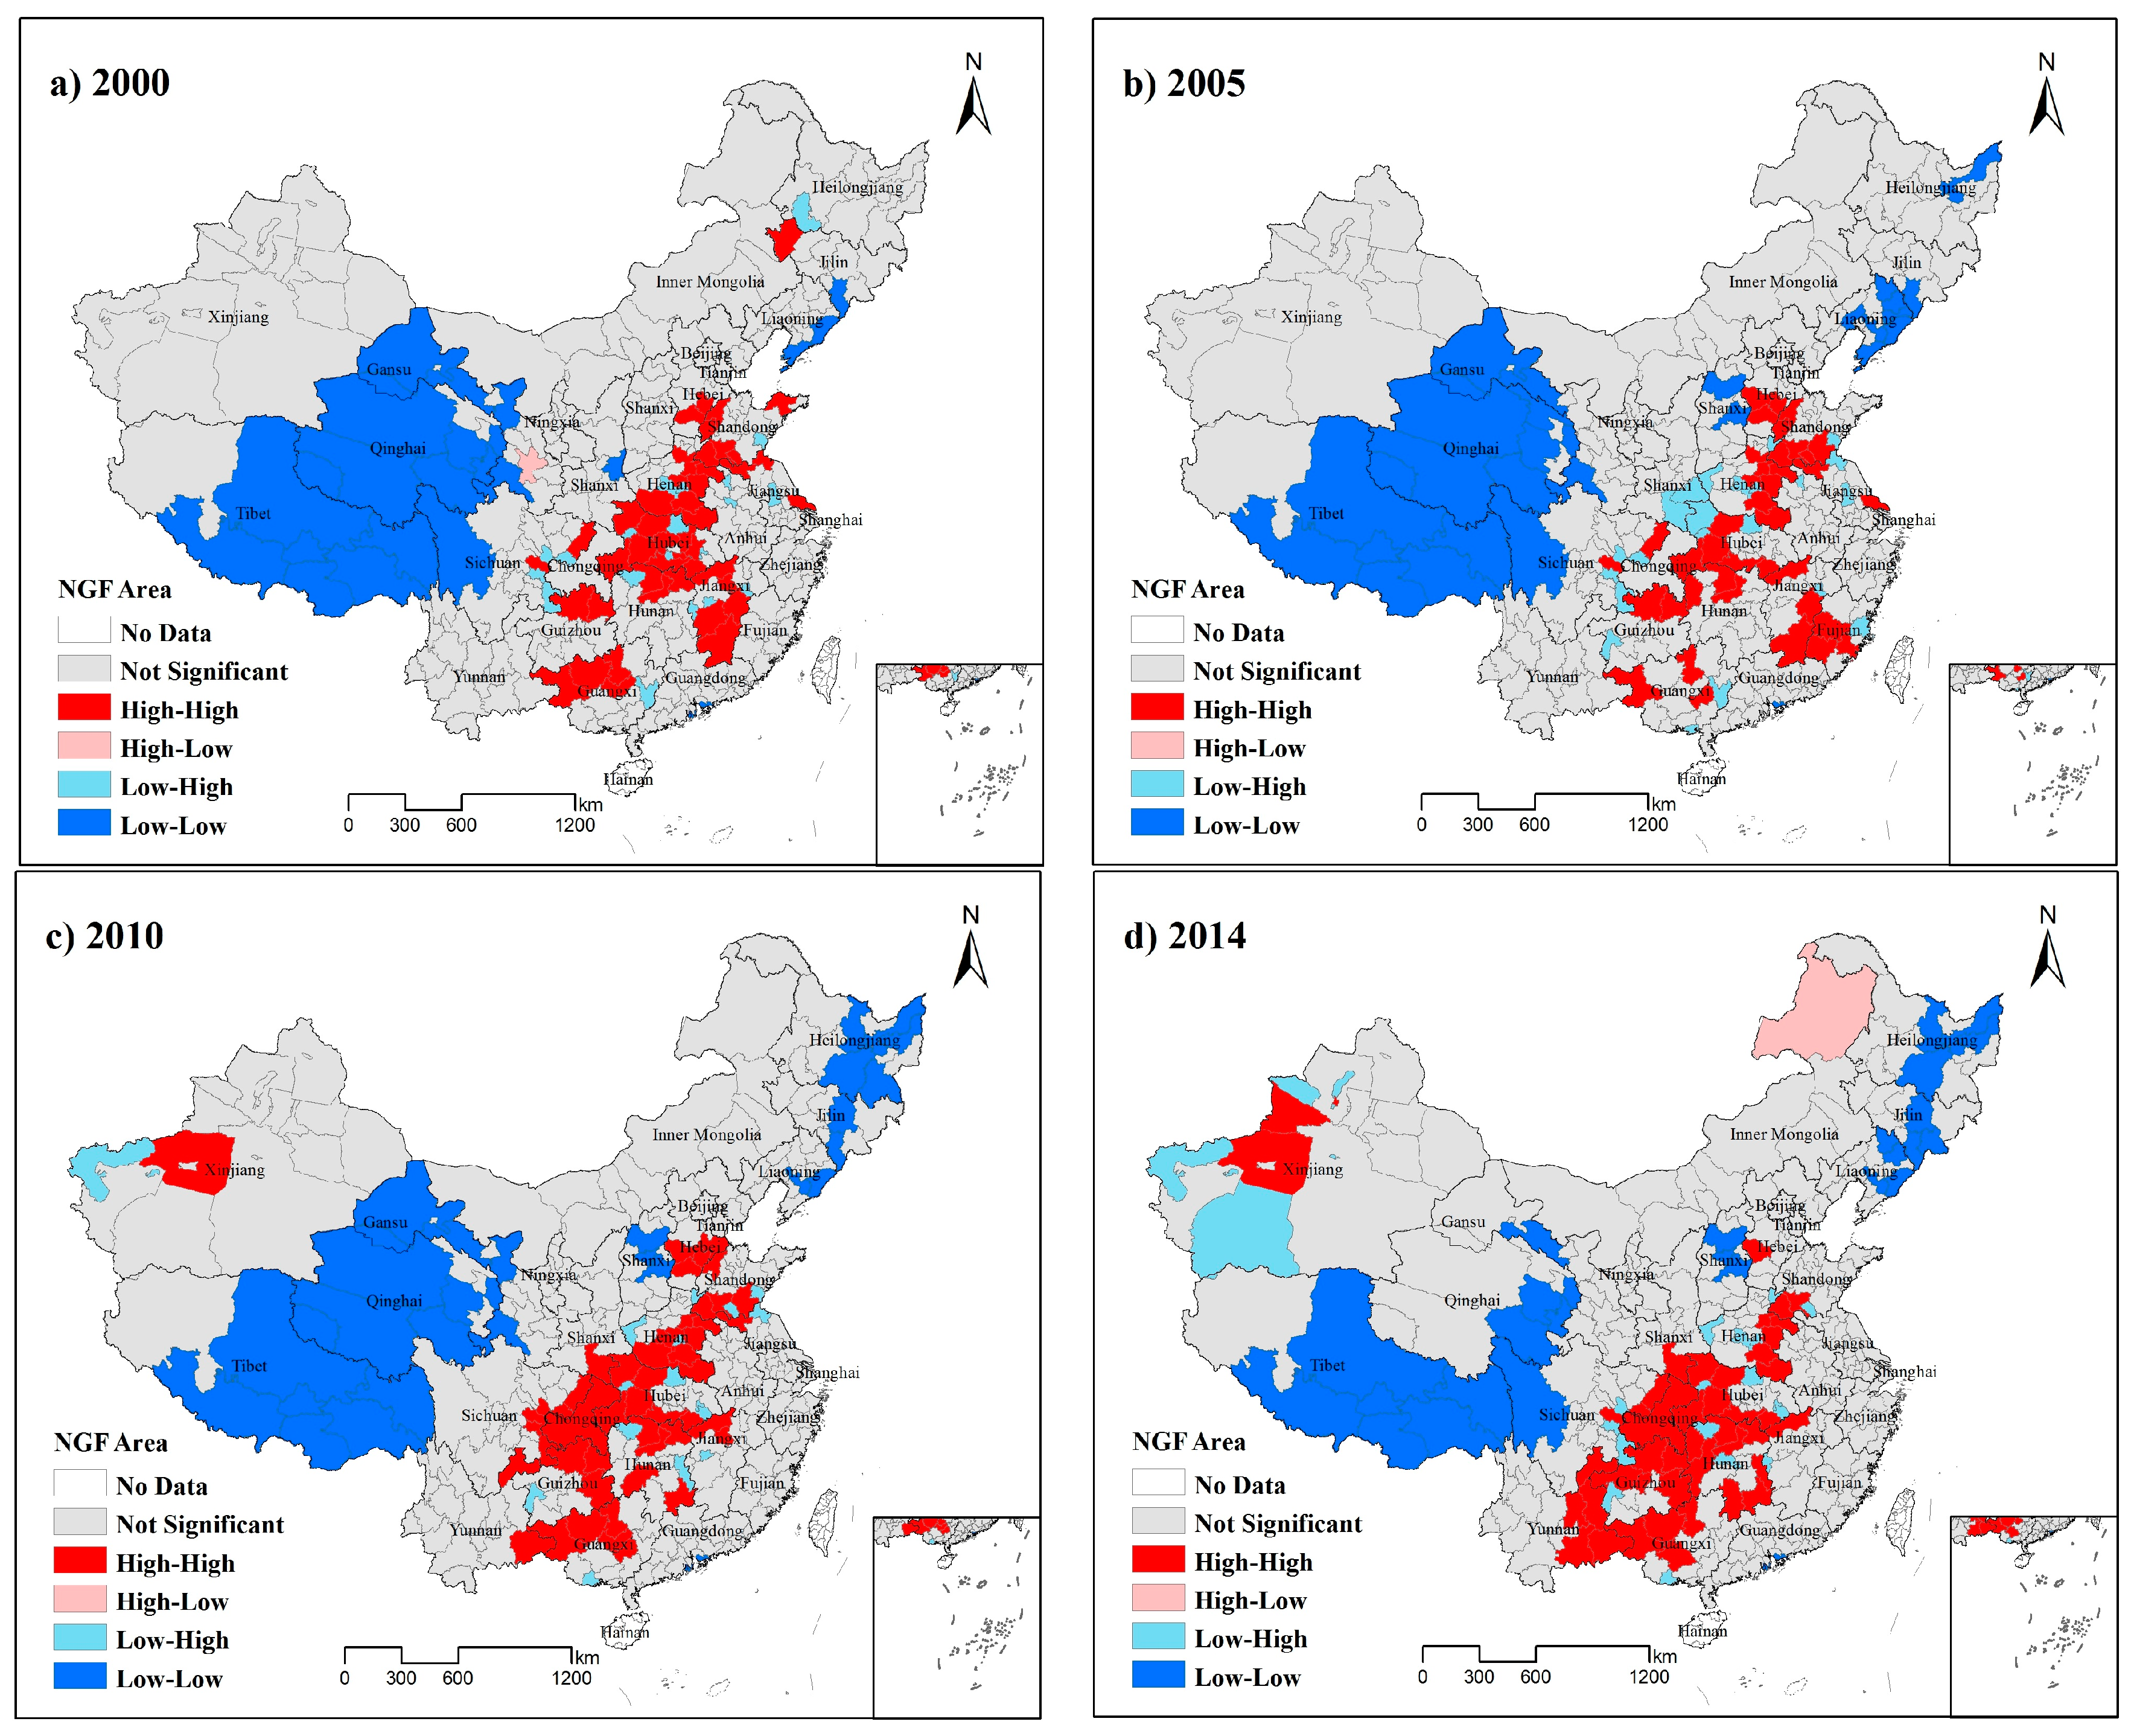
Figure 6 shows the spatial patterns of municipal-level NGF area in 2000, 2005, 2010, and 2014 respectively in China. It reveals great changes between these four years, especially the High-High and Low-Low areas. In 2000, the High-High area, which was the aggregated area of cities with high NGF area, had 39 cities that were located at the junction of Henan and Shandong, Hubei, Jiangxi, northern Hunan, northern Guangxi, and northern Guizhou Provinces (Figure 6a). The High-High area was larger in 2005 and 2010 and expanded toward the southwest gradually (Figure 6b,c). In 2014, the High-High area covered 46 cities, mainly in Chongqing, Hubei, the junction of Hunan and Guizhou, junction of Guangxi and Yunnan, eastern Henan, and western Xinjiang (Figure 6d). Thirty four cities were located in the Low-Low area in 2000, which was the aggregated area of cities with low NGF area. Most of these cities were located in Tibet, Qinghai, Gansu, and western Sichuan Provinces and a few cities in Liaoning Province (Figure 6a). Compared with the Low-Low area in 2000, the Low-Low area in 2005 and 2010 expanded slightly toward the northeast (Figure 6b,c). In 2014, although the number of cities in the Low-Low area changed slightly, the spatial pattern changed a lot (Figure 6d). The Low-Low area decreased sharply in western China and was located in southern Tibet and the junction of Sichuan and Qinghai Provinces. Due to its dispersed distribution, the Low-High area, where cities with low NGF area were adjacent to cities with high values, presented no distinctive spatial pattern. On the whole, the NGF area had remarkable spatial agglomeration and the High-High area moved from central China to southwestern China.
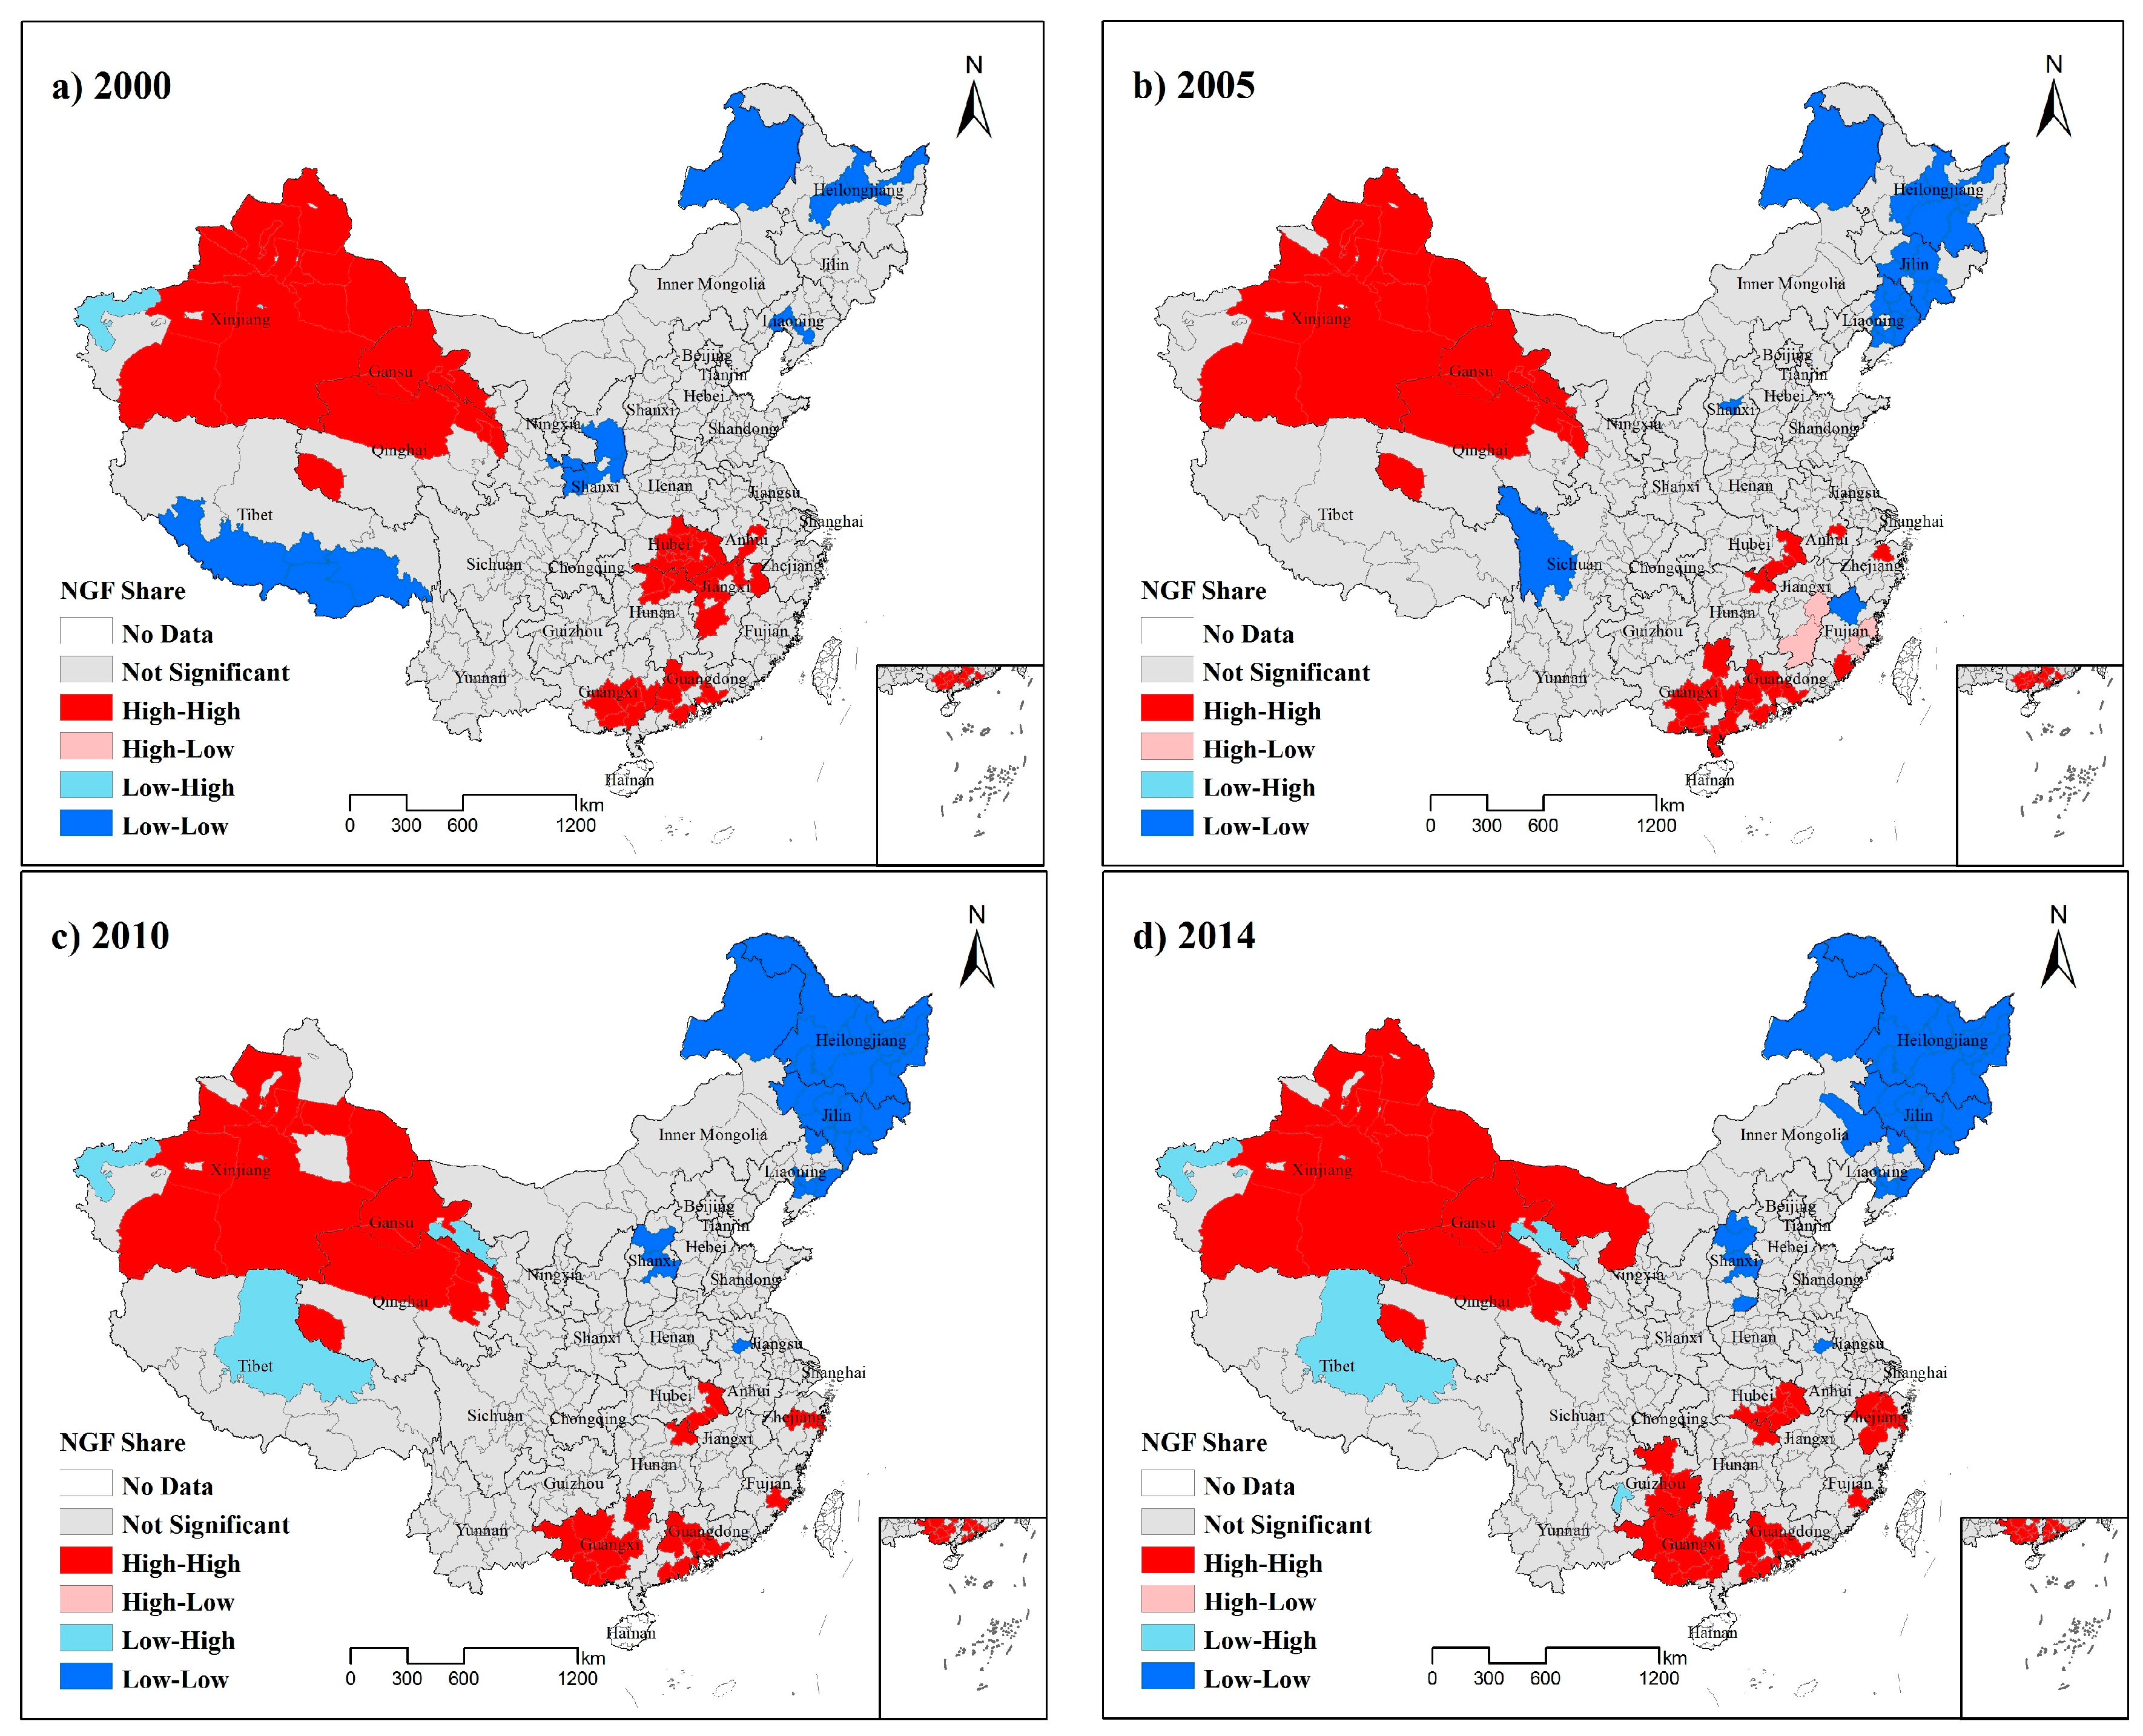
Figure 7 shows the spatial patterns of municipal-level NGF share in 2000, 2005, 2010, and 2014 respectively in China. Similar to the spatial patterns of NGF area, the spatial patterns of the NGF share changed tremendously over these 15 years. The High-High and Low-Low areas presented the largest changes in spatial pattern. In 2000, the High-High area covered 39 cities, which were located in Xinjiang, junction of Qinghai, and Gansu, junction of Hubei, Hunan, and Jiangxi as well as junction of Guangxi and Guangdong (Figure 7a). In 2005 and 2010, the High-High area decreased considerably at the junction of Hubei, Hunan, and Jiangxi, whereas the High-High area increased to some extent at the junction of Guangxi and Guangdong, and changed slightly in Xinjiang and at the junction of Qinghai and Gansu (Figure 7b,c). In 2014, the High-High area covered 51 cities. Zhejiang showed new agglomeration regions (Figure 7d). The High-High area increased significantly in the Pearl River Delta, Guangxi, and Guizhou, whereas it declined greatly in central China, with spatial agglomeration in only a few cities in eastern Hubei Province. The Low-Low area also witnessed great changes. In 2000, the Low-Low area covered 25 cities, which were located mainly in southern Tibet, central Shanxi Province, and some cities in Heilongjiang Province (Figure 7a). In 2000 and 2005, the Low-Low area expanded continuously in northeastern China, but decreased gradually and finally disappeared in southern Tibet and central Shanxi Provinces (Figure 7b,c). The Low-Low area covered 44 cities in 2014, located mainly in northeastern China (Heilongjiang, Jilin, and the eastern region of Inner Mongolia) and western Shanxi Province (Figure 7d). The High-Low and Low-High areas were scattered, but they did not have a distinctive spatial pattern. Overall, the trend of spatial agglomeration in the NGF share intensified during this period.
These results reveal the spatial disparities of NGF area and share in China. They indicate that the spatial pattern of NGF changed remarkably from 2000 to 2014, especially in that the High-High areas moved from central China (which is one of the main grain production areas) to southwestern China. Regional differences in economic growth and urbanization led to the migration of the agricultural population and increased non-agricultural job opportunities and peasant income, and finally were reflected in the spatial patterns of NGF. These spatial patterns may request regional differentiation of land use policies, food policies, and agricultural policies.
4.3. Influencing Factors of NGF Spatial Patterns Change
The above analysis of global and local spatial autocorrelation shows that spatial clustering exists with respect to municipal-level non-grain farmland (NGF). Therefore, it is necessary to undertake further analysis using a spatial econometric model that takes into account spatial dependence. Anselin put forward a decision rule for selecting spatial models to properly take spatial dependence into account [51]: use ordinary least square (OLS) to estimate the model first, and then judge the existence of spatial dependence and select the proper model for estimation according to the results of spatial dependence diagnostics. Based on this rule, if the diagnostic results of both Lagrange Multiplier Lag (LM-LAG) and Lagrange Multiplier Error (LM-ERR) are insignificant, then OLS is sufficiently explanatory. When one of them is significant, then spatial autocorrelation still exists and the results obtained with OLS would be biased. In this situation, a proper spatial econometric model needs to be selected for the analysis. More specifically, when LM-LAG is significant while LM-ERR is insignificant, spatial lag models should be adopted. On the contrary, when LM-ERR is significant while LM-LAG is insignificant, spatial error models should be used. When both LM-LAG and LM-ERR are significant, the diagnostic results of Robust LM-LAG and Robust LM-ERR should be compared. When the former one is significant, spatial lag models should be used. On the contrary, if the latter is significant, spatial error models should be used.
Table 2 shows the results of the OLS estimations on NGF area and share in 2000 and 2014. According to the rule put forward by Anselin [51], the LM-LAG and LM-ERR estimations of NGF area and share in 2000 and 2014 were significant, indicating that NGF was not distributed randomly in space and the spatial dependence in NGF should be corrected. However, the Robust LM-LAG estimations of NGF area and share in 2000 and 2014 were not significant, while the Robust LM-ERR estimations were significant, which indicates that a spatial error model was more suitable for NGF area and share in 2000 and 2014.
Table 3 shows the results of the spatial error models (SEM) for NGF area and share in 2000 and 2014. The R2 of the spatial error models of NGF area in 2000 and 2014 were 0.765 and 0.575, higher than that of 0.690 and 0.476 of the OLS models. The R2 of the spatial error models of NGF share in 2000 and 2014 were 0.719 and 0.666, higher than that of 0.434 and 0.323 of the OLS models. This indicates that SEM estimations of NGF area and share were better than OLS estimations. It is unlikely for NGF to be regionally independent, but OLS estimations ignored spatial autocorrelation. It is thus necessary to introduce spatial dependence to correct the linear regression models. The spatial error coefficients (λ) of NGF area in the SEMs for 2000 and 2014 were 0.493 and 0.416, passing the 1% significance test. The spatial error coefficients (λ) of NGF share in the SEMs for 2000 and 2014 were 0.707 and 0.679, passing the 1% significance test. This indicates that NGF has obvious spatial diffusion effect among different regions.
Urbanization rate (UR) had a significant effect on NGF area in 2000, but did not have a significant effect on NGF area in 2014. NGF shares in 2000 and 2014 were affected significantly by urbanization rate (UR). Specifically, every 1% growth of UR increased NGF area in 2000 by 64,998.33 ha and increased NGF share in 2000 and 2014 by 13.9% and 13.8% respectively. Urbanization is a process whereby rural population migrates to cities. From 2000 to 2014, the urbanization rate (UR) in China increased from 36.2% to 54.8%. The migrant worker population in 2014 reached 274 million [57]. These migrant workers earned higher incomes in urban areas than in agricultural production [58]. To reduce the rural-urban income gap, especially the income difference with migrant worker households, rural households engaged in agricultural production preferred to planting commercial crops to generate higher incomes.
The share of the secondary and tertiary industries output value in regional GDP (SOVSTI) also had a significant effect on NGF area. It did not affect NGF share in 2000, but had a significant effect on NGF share in 2014. Specifically, every 1% increase in SOVSTI brought about a 133,058.300 ha reduction in NGF area in 2000, a 63,515.800 ha increase in NGF area and 23.2% growth in NGF share in 2014. The SOVSTI increased from 85.3% in 2000 to 90.8% in 2014. After 2004, the policy of “industry nurtures agriculture and urban supports rural” was proposed, which increased support to agriculture, including removal of agricultural tax as well as increasing agricultural infrastructure investment and subsidies to agriculture. Particularly, local governments increased support to ecological and tourism-oriented agriculture as well as facilitated agricultural development through various means, such as taxation, finance, and land utilization. These kinds of agriculture mainly focus on planting vegetables, fruits, flowers and other commercial crops. As a result, NGF area and share increased.
The per capita income of rural household (PCIRH) had a significant effect on NGF area in 2000, but did not have a significant effect on NGF area in 2014. If PCIRH increases by 1 Yuan, NGF area increased by 14.629 ha in 2000. While PCIRH had significant effects on NGF share in 2000 and 2014, these effects on NGF share were quite minor and thus were not substantively important (i.e., a considerable increase in per capita income of rural household would not bring forth a substantial increase in NGF share). Peasant incomes mainly include agricultural business income, wage income, property income, and transfer income. In 2000, the proportions of agriculture business income, wage income, property income, and transfer income in the total net income of peasants were 63.3%, 31.2%, 3.5%, and 2.0% respectively. This indicates that agriculture income was still the main source of peasant income. At that time, farmland transfer behaviors only existed in few economically developed regions and property income did not witness considerable growth. In addition, government had been levying agricultural taxes before 2005—without direct grain subsidy, agricultural material subsidies, selective seed subsidies, and farm machinery purchase subsidy in any way—thus failing to achieve growth in transfer income. Therefore, planting commercial crops was the main means of increasing peasant income when there was sluggish growth in wage income, property income and transfer income.
Cultivated land per household (CLPH) did not have a significant effect on NGF area, but had a significant effect on NGF share. If CLPH increased by 1 ha, NGF share would have increased by 1.0% and 0.8% in 2000 and 2014 respectively. In 2000, there were few migrant workers and agriculture business income was the main source of peasant income, accompanied by low grain price and high agricultural taxes. Farmers preferred planting commercial crops in order to obtain higher incomes when CLPH increased, thus increasing NGF share. In 2014, farmland transfer became popular due to massive rural-urban migration of workers. Particularly, wage income had replaced agriculture business income and become the main source of household income in economically developed regions. Therefore, the farmers’ will to plant commercial crops was not strong when CLPH increased, resulting in a lower NGF share than in 2000. Spatially, Xinjiang, Gansu, Qinghai, Guangxi Provinces, and northeast China had higher CLPH and higher NGF share than other regions, which partially agrees with the spatial pattern of the High-High area in Figure 6. Northeastern China had high CLPH but low NGF share, indicating that its NGF share may be influenced by other natural conditions, such as climate, terrain, water resource and soil [59,60].
The number of agricultural employees (AE) had a significant effect on NGF area, but did not have a significant effect on NGF share. The share of agricultural employees (SAE) had a significant effect on NGF area in both 2000 and 2014 and had a significant effect on NGF share in 2000 but not in 2014. Specifically, if the number of agricultural employees (AE) increased by 10,000, NGF area would have increased by 0.101 ha in both 2000 and 2014. If the share of agricultural employees (SAE) increased by 1%, NGF area and share would have increased by 85,157.950 ha and 22.2% respectively in 2000, while NGF area would have decreased by 89,183.600 ha in 2014. In 2000, the problems of agriculture in China were low grain price, high agricultural taxes, and low comparative returns of planting grains. Besides, industrialization and urbanization provided few job opportunities for peasants. When the number of agricultural employees (AE) increased, planting commercial crops was a reliable way to increase income, leading to increased NGF area and share. Compared to 2000, great social and economic changes took place in 2014. First, planting grain crops could bring more income than before, which was attributed to the sharp increase in grain price, the removal of agricultural tax, and the provision of agricultural subsidies. Second, migrant workers were widespread, directly reducing available farm labor [22] as the elderly and children were left in rural areas [61]. The elderly often could not undertake labor intensive planting of commercial crops. Third, plenty of farmland transfer made farmland become concentrated in the hands of a few rural households or agricultural enterprises, and large-scale land management prefers to plant grain crops [40]. Therefore, NGF area decreased with an increase in the share of agricultural employees (SAE).
The total power consumption of agricultural machinery (TPGM) had a significant effect on NGF area, but did not have a significant effect on NGF share, indicating that the higher total power consumption of agricultural machinery (TPGM), the larger the NGF area. Specifically, for every 1 × 10⁴ kw increase in TPGM, NGF area would have increased by 149.283 ha and 89.140 ha in 2000 and 2014 respectively. China has been increasing efforts to consolidate rural land since 2000. The conditions of agricultural production have improved greatly through land leveling, rural road construction, and farmland water conservancy projects. Meanwhile, rural land consolidation reduced farmland fragmentation, which was conducive to the increasing use of agricultural machinery in cultivation. The extensive use of agricultural machinery notably shortens peasants’ time spent on agricultural production, resulting in farmers’ abundant surplus time. Therefore, some farmers chose to find jobs in cities and others chose to plant commercial crops with higher labor consumption and higher economic benefits, thus increasing NGF area to some extent. Moreover, agricultural machinery is widely used in the Northeastern Plain, the North China Plain, the middle-lower Yangtze Plain, and the Central Shaanxi Plain. However, Hubei, Hunan, Anhui, Jiangxi, Guangxi, and Guizhou Provinces are dominated by hills and mountains. These areas adopted land consolidation to facilitate farmland transfer and large-scale agricultural operation, bringing rapid growth in agricultural machinery utilization. Therefore, NGF area in hilly and mountainous regions was larger than that in plain areas, which agrees with the clustered spatial pattern of the High-High areas in Figure 6.
5. Discussion and Conclusions
As China’s urbanization and farmland transfer continue to grow, the growth in non-grain farmland is also continuing and even accelerating. Policies in China in recent years have consistently encouraged farmland transfer. The document entitled Opinions on Improving the Separation of Land Ownership, Land Contract Right and Land Operating Right released by the General Office, CCCPC in October 2016 established the institutional foundation for farmland transfer and large-scale agricultural management. Large-scale land management in rural China was one means of preventing further widening of the income disparity between those who remained in the agricultural sector and those who moved to the non-farm sector. The relatively low earnings of grain crops were the main contributor to the income gap between grain and of non-grain farmers. In fact, what Chinese farmers care the most about is their income. One of the most important reasons for their non-grain behavior is to boost income. Chinese farmers’ income is largely composed of the following four portions: (1) wage income which is affected by the development of secondary and tertiary industry; (2) agricultural business income which is affected by the prices of labor, agricultural commodity, and means of agricultural production; (3) property income which is affected greatly by land rent; and (4) transfer income which is constituted by agricultural subsidies such as direct food subsidies, direct agricultural material subsidies, selective seed subsidies, and farm machinery purchase subsidies. Nevertheless, there are major regional differences in income which will have an impact on the spatial patterns of NGF. Further examination of the driving forces underpinning the NGF is needed. Agricultural population will gather further in cities and farmland transfer will be a general phenomenon in the coming years in China. It is anticipated that the NGF trend will continue. To prevent non-grain behavior becoming more prevalent, especially in major grain producing areas, specific land use policies and agricultural policies should be formulated and implemented. For example, land utilization control should be reinforced, and land operating rights should be eligible for mortgages in order to support large-scale agricultural management.
This study analyzed the spatiotemporal variations and spatial patterns of non-grain farmland (NGF) area and share in China using spatial regression models that take into account the effects of spatial autocorrelation. It explored the effects of urbanization and farmland transfer on NGF from 2000 to 2014. Results of the study indicated that both NGF area and share have a consistent variation trend during this period: increased first, then decreased, and increased again. There were great spatiotemporal disparities in NGF area and share in municipal-level cities. The NGF area of the vast majority of cities increased generally during these 15 years. The spatial distribution of the NGF area polarized at the high and low ends, manifested by increasing number of cities with small and large NGF area. The number of cities with an NGF share higher than 40% increased sharply and the spatial agglomeration of NGF share intensified during the period.
Both NGF area and share showed positive spatial autocorrelation and had a remarkable clustered spatial pattern. The spatial patterns of NGF area and share witnessed great changes from 2000 to 2014, especially the High-High and Low-Low areas. NGF area had remarkable spatial agglomeration and the High-High area moved from central China to southwestern China. The Low-Low area of NGF area decreased sharply in western China and expanded toward the northeast. The Low-High area of NGF area was close to the High-High area, without distinctive spatial pattern. The spatial agglomeration in NGF share intensified from 2000 to 2014. The High-High area increased significantly in the Pearl River Delta, Guangxi, and Guizhou, whereas it declined greatly in central China, with spatial agglomeration in a few cities in eastern Hubei Province. The Low-Low area witnessed continuous expansion in northeastern China and gradually decreased in southern Tibet and central Shanxi Provinces, and finally agglomerated mainly in northeastern China and western Shanxi Province.
The spatial patterns of non-grain farmland (NGF) were significantly influenced by regional differences in urbanization and farmland transfer. The effects of urbanization and farmland transfer on non-grain farmland (NGF) changed significantly from 2000 to 2014. Urbanization rate (UR) had a significant effect on NGF area in 2000 and NGF share in 2000 and 2014, but did not have a significant effect on NGF area in 2014. The share of the secondary and tertiary industries output value to regional GDP (SOVSTI) had a significant effect on NGF area, and had a significant effect on NGF share in 2014 rather than in 2000. Per capita income of rural household (PCIRH) had a significant effect on NGF area in 2000, but did not have a significant effect on NGF area in 2014. Cultivated land per household (CLPH) did not have a significant effect on NGF area, but had a significant effect on NGF share. The number of agricultural employees (AE) had a significant effect on NGF area, but did not have a significant effect on NGF share. The share of agricultural employees (SAE) had a significant effect on NGF area both in 2000 and 2014 and on NGF share in 2000, but did not have a significant effect on NGF share in 2014. Total power consumption of agricultural machinery (TPGM) had a significant effect on NGF area, but did not have a significant effect on NGF share.
Acknowledgments
Xiaofeng Zhao was supported by the National Natural Science Foundation of China (No. 41571162, No. 41401629) and the Fundamental Research Funds for the Central Universities of China (No. 2014B19114). Mei-Po Kwan was supported by a grant from the National Natural Science Foundation of China (Grant No. 41529101) and Grant 1-ZE24 (Project of Strategic Importance) from the Hong Kong Polytechnic University.
Author Contributions
X.Z. and X.H. conceived and designed the study; Y.Z. (Yuqian Zheng) analyzed the data; X.Z. and M.K. wrote the paper; Y.Z. (Yuntai Zhao) played an important role in interpreting the results. All authors read and approved the manuscript.
Conflicts of Interest
The authors declare no conflict of interest.
References
- Bai, X.M.; Shi, P.J.; Liu, Y.S. Realizing China’s urban dream. Nature 2014, 509, 158–160. [Google Scholar] [CrossRef] [PubMed]
- Long, H.L.; Li, Y.R.; Liu, Y.S.; Woods, M.; Zou, J. Accelerated restructuring in rural China fueled by “increasing vs. decreasing balance” land-use policy for dealing with hollowed villages. Land Use Policy 2012, 29, 11–22. [Google Scholar] [CrossRef]
- National Migrant Workers Monitoring and Investigating Report in 2012. Available online: http://www.stats.gov.cn/tjsj/zxfb/201305/t20130527_12978.html (accessed on 5 December 2016).
- Chen, F.; Zhai, W.J. Land transfer incentive and welfare effect research from perspective of farmers’ behavior. J. Econ. Res. 2015, 10, 163–177. (In Chinese) [Google Scholar]
- Jin, S.; Deininger, K. Land rental markets in the process of rural structural transformation: Productivity and equity impacts from China. J. Comp. Econ. 2009, 37, 629–646. [Google Scholar] [CrossRef]
- Feng, S.; Heerink, N.; Ruerd, R.; Qu, F. Land rental market, off-farm employment and agricultural production in Southeast China: A plot-level case study. Chin. Econ. Rev. 2010, 21, 598–606. [Google Scholar] [CrossRef]
- Manjunatha, A.V.; Anik, A.R.; Speelman, S.; Nuppenau, E.A. Impact of land fragmentation, farm size, land ownership and crop diversity on profit and efficiency of irrigated farms in India. Land Use Policy 2013, 31, 397–405. [Google Scholar] [CrossRef]
- Zhang, O.X. Research on countermeasures of preventing circulation land “Non-grain” under the perspective of rural households’ differentiation. Acad. J. Zhongzhou 2016, 4, 49–54. (In Chinese) [Google Scholar]
- Otsuka, K. Efficiency and equity effects of land markets. In Handbook of Agricultural Economics; Elsevier: Amsterdam, The Netherlands, 2007; Volume 3, pp. 2671–2703. [Google Scholar]
- Deininger, K. Land markets in developing and transition economics: Impact of liberalization and implications for future reform. Am. J. Agric. Econ. 2003, 85, 1217–1222. [Google Scholar] [CrossRef]
- Ito, J.; Bao, Z.S.; Ni, J. Land rental development via institutional innovation in rural Jiangsu. China Food Policy 2016, 59, 1–11. [Google Scholar] [CrossRef]
- Wang, H.; Riedinger, J.; Jin, S.Q. Land documents, tenure security and land rental development: Panel evidence from China. China Econ. Rev. 2015, 36, 220–235. [Google Scholar] [CrossRef]
- Li, T.P.; Nie, W.J.; Li, Q. Income distribution between land transferee and transferor from changing agricultural product price perspective. China Popul. Resour. Environ. 2015, 8, 26–33. (In Chinese) [Google Scholar]
- Zhang, Y.J.; Wang, X.B.; Glauben, T.; Brummer, B. The impact of land reallocation on technical efficiency: Evidence from China. Agric. Econ. 2011, 42, 495–507. [Google Scholar] [CrossRef]
- Chen, H.L.; Shi, Q.H.; Gu, H.Y. Is farmland transfer efficient? A case study from Shanxi Province. Chin. Rural Econ. 2014, 7, 61–71. (In Chinese) [Google Scholar]
- Jiang, C.Y. Farmers’ behavioral comparison of cultivated land transfer and their policy choice. Macroecon. Manag. 2015, 10, 39–41. (In Chinese) [Google Scholar]
- Yang, R.Z.; Chen, Y.J.; Yi, X.Y.; Fang, L. The causes and countermeasures on the excessive “non-food” tendency in the process of land transfer. Chin. J. Agric. Resour. Reg. Plan. 2012, 33, 14–17. (In Chinese) [Google Scholar]
- Zhang, Q.; Qu, X.T.; Wei, C. A study of “non-grain production” of family farms in the background of grain security. Southeast Acad. Res. 2014, 3, 94–100. (In Chinese) [Google Scholar]
- Ling, Y.J.; Zhu, X.L.; Hu, R.T.; Lin, J.J.; Xiang, Y.F. Report of family farm development in Ningbo, Zhejiang. Zhejiang Mod. Agric. 2012, 2, 34–36. (In Chinese) [Google Scholar]
- Liu, Z.W. Questions of food safety in China. Probl. Agric. Econ. 2004, 12, 8–13. (In Chinese) [Google Scholar]
- Deininger, K.; Jin, S. The potential of land rental markets in the process of economic development: Evidence from China. J. Dev. Econ. 2005, 78, 241–270. [Google Scholar] [CrossRef]
- Xie, Y.; Jiang, Q.B. Land arrangements for rural-urban migrant workers in China: findings from Jiangsu Province. Land Use Policy 2016, 50, 262–267. [Google Scholar] [CrossRef]
- Qian, Z.H. Whether or not off-farm employment will lead to farmland transfer? A theoretical analysis of the labor division within the family and its explanation to household part-time employment. Chin. Rural Econ. 2008, 10, 13–21. (In Chinese) [Google Scholar]
- Liao, H.L. Part-time employment of farmers’ Households and its impact on the agricultural land contractual right transfer. Manag. World 2012, 5, 62–70, 87. (In Chinese) [Google Scholar]
- Kimura, S.; Otsuka, K.; Sonobe, T.; Rozelle, S. Efficiency of land allocation through tenancy markets: Evidence from China. Econ. Dev. Cult. Chang. 2011, 59, 485–510. [Google Scholar] [CrossRef] [Green Version]
- Carter, M.R.; Zimmerman, F.J. The dynamic costs and persistence of asset inequality in an agrarian economy. J. Dev. Econ. 2000, 63, 265–302. [Google Scholar] [CrossRef]
- Kong, F.B.; Liao, W.M. Forestry economic growth effects of the marketization process of forestry in China. Chinese. Rural Econ. 2011, 8, 87–96. (In Chinese) [Google Scholar]
- Ye, J.P.; Feng, L.; Jiang, Y.; Roy, P.; Zhu, K.L. Investigation on land use right in China’s rural areas in 2008: Results from 17 provinces and some suggestion. Manag. World 2010, 1, 64–73. (In Chinese) [Google Scholar]
- Ma, X.L.; Heerink, N.; Feng, S.Y.; Shi, X.P. Farmland tenure in China: Comparing legal, actual and perceived security. Land Use Policy 2015, 42, 293–306. [Google Scholar] [CrossRef]
- Ma, X.L.; Qiu, T.W.; Qian, Z.H. Farmland property right security and rural household participation in farmland transfer market: An empirical analysis based on survey data of Jiangsu, Hubei, Guangxi and Heilongjiang Province. Chin. Rural Econ. 2015, 2, 22–37. (In Chinese) [Google Scholar]
- Zhu, Z.G. Non-grain in land transfer and grain security. Grain Issues Res. 2010, 4, 10–12. (In Chinese) [Google Scholar]
- Liu, H.B.; Wang, Q.B.; Dong, X.R.; Bian, Z.X.; Yu, G.F.; Sun, Y. A comparative study of farmers’ crop choice behavior and its impact factors in the typical region of metropolitan suburb: a case study in Sujiatun District in Shenyang, Liaoning Province, China. J. Nat. Resour. 2013, 28, 372–380. (In Chinese) [Google Scholar]
- Saizen, I.; Mizuno, K.; Kobayashi, S. Effects of land-use master plans in the metropolitan fringe of Japan. Landsc. Urban Plan. 2006, 78, 411–421. [Google Scholar] [CrossRef]
- Kline, J.D.; Alig, R.J. Spatial model of land use change for western Oregon and western Washington. Usda For. Serv. Pac. Northwest Res. Stn. Res. Pap. 2001, 15, 378–384. [Google Scholar]
- Schoneveld, G.C. The geographic and sectoral patterns of large-scale farmland investments in sub-Saharan Africa. Food Policy 2014, 48, 34–50. [Google Scholar] [CrossRef]
- Ziegler, A.D.; Fox, J.M.; Xu, J. The rubber juggernaut. Science 2009, 324, 1024–1025. [Google Scholar] [CrossRef] [PubMed]
- Dong, J.; Xiao, X.; Chen, B.; Torbick, N.; Jin, C.; Zhang, G.; Biradar, C. Mapping deciduous rubber plantations through integration of PALSAR and multi-temporal Landsat imagery. Remote Sens. Environ. 2013, 134, 392–402. [Google Scholar] [CrossRef]
- Su, S.L.; Zhou, X.C.; Wan, C.; Li, Y.k.; Kong, W.H. Land use changes to cash crop plantations: Crop types, multilevel determinants and policy implications. Land Use Policy 2016, 50, 379–389. [Google Scholar] [CrossRef]
- Gatto, M.; Wollni, M.; Qaim, M. Oil palm boom and land-use dynamics in Indonesia: The role of policies and socioeconomic factors. Land Use Policy 2015, 46, 292–303. [Google Scholar] [CrossRef]
- Zhang, Z.Y.; Du, Z.X. Will land transfer lead to “non-grain”? An empirical analysis from 1740 rural household monitoring data in China. Econ. Inf. 2015, 9, 63–69. (In Chinese) [Google Scholar]
- Yi, X.Y.; Chen, Y.J. Influencing factors between farmland “non-grain” planting behavior and area of farmland transfer: Rural household questionnaire survey from Zhejiang and Hebei Provinces. China Rural Surv. 2010, 6, 2–10, 21. (In Chinese) [Google Scholar]
- Huang, W.; Yu, Z.X. Current situations and recommendations for non-grain tendency of farmland in Anhui Province. Asian Agric. Res. 2016, 8, 50–57. [Google Scholar]
- Bjorkhaug, H.; Blekesaune, A. Development of organic farming in Norway: A statistical analysis of neighborhood effects. Geoforum 2013, 45, 201–210. [Google Scholar] [CrossRef]
- Wollni, M.; Andersson, C. spatial patterns of organic agriculture adoption: Evidence from Honduras. Ecol. Econ. 2014, 97, 120–128. [Google Scholar] [CrossRef]
- Boncinelli, F.; Bartolini, F.; Brunori, G.; Casini, L. Spatial analysis of the participation in agri-environment measures for organic farming. Renew. Agric. Food. Syst. 2015, 31, 375–386. [Google Scholar] [CrossRef]
- Lewis, D.J.; Barham, B.L.; Robinson, B. Are there spatial spillovers in adoption of clean technology? The case of Organic Dairy Farming. Land Econ. 2011, 87, 250–267. [Google Scholar] [CrossRef]
- Schmidtner, E.; Lippert, C.; Engler, B.; Häring, A.M.; Aurbacher, J.; Dabbert, S. Spatial distribution of organic farming in Germany: Does neighborhood matter? Eur. Rev. Agric. Econ. 2012, 39, 661–683. [Google Scholar] [CrossRef]
- Peng, L.; Chen, T.T.; Liu, S.Q. Spatiotemporal dynamics and drivers of farmland changes in Panxi Mountainous Region, China. Sustainability 2016, 8, 1209. [Google Scholar] [CrossRef]
- Yu, Z.L.; Liu, L.; Zhang, H.; Liang, J.S. Exploring the factors driving seasonal farmland abandonment: A case study at the regional level in Hunan Province, central China. Sustainability 2017, 9, 187. [Google Scholar] [CrossRef]
- Parker, D.C.; Munroe, D.K. The geography of market failure: Edge-effect externalities and location and production patterns of organic farming. Ecol. Econ. 2007, 60, 821–833. [Google Scholar] [CrossRef]
- Anselin, L. Local indicators of spatial association: LISA. Geogr. Anal. 1995, 27, 93–115. [Google Scholar] [CrossRef]
- Anselin, L. From spaceStat to cyberGIS: Twenty years of spatial data analysis software. Int. Reg. Sci. Rev. 2012, 35, 131–157. [Google Scholar] [CrossRef]
- Getis, A.; Ord, K. The analysis of spatial association by use of distance statistics. Geogr. Anal. 1992, 24, 189–206. [Google Scholar] [CrossRef]
- Smirnov, O.; Anselin, L. Fast maximum likelihood estimation of very large spatial autoregressive models: A characteristic polymial approach. Comput. Stat. Data Anal. 2001, 35, 301–309. [Google Scholar] [CrossRef]
- Anselin, L.; Bera, A.; Florax, R.J.; Yoon, M. Simple diagnostic tests for spatial dependence. Reg. Sci. Urban Econ. 1996, 26, 77–104. [Google Scholar] [CrossRef]
- Exploring Spatial Data with GeoDaTM: A Workbook. Available online: http://www.csiss.org/ (accessed on 15 November 2016).
- National Migrant Workers Monitoring and Investigating Report in 2014. Available online: http://www.stats.gov.cn/tjsj/zxfb/201504/t20150429_797821.html (accessed on 5 December 2016).
- Du, Y.; Park, A.; Wang, S. Migration and rural poverty in China. J. Comp. Econ. 2005, 33, 688–709. [Google Scholar] [CrossRef]
- Xie, H.L.; He, Y.F.; Xie, X. Exploring the factors influencing ecological land change for China’s Beijing-Tianjin-Hebei Region using big data. J. Clean. Prod. 2017, 142, 677–687. [Google Scholar] [CrossRef]
- Yao, G.R.; Xie, H.L. Rural spatial restructuring in ecologically fragile mountainous areas of southern China: A case study of Changgang Town, Jiangxi Province. J. Rural. Stud. 2016, 47, 435–448. [Google Scholar] [CrossRef]
- Yang, X.J. China’s Rapid Urbanization. Science 2013, 342, 310. [Google Scholar] [CrossRef] [PubMed]
Figure 1.
A theoretical framework of non-grain farmland (NGF) practice.

Figure 2.
NGF area and share from 2000 to2014.

Figure 3.
Area and share of non-grain farmland (NGF). (a) NGF area in 2000; (b) NGF area in 2014; (c) NGF share in 2000; (d) NGF share in 2014.
Figure 3.
Area and share of non-grain farmland (NGF). (a) NGF area in 2000; (b) NGF area in 2014; (c) NGF share in 2000; (d) NGF share in 2014.

Figure 4.
Moran scatter plots of NGF area in 2000, 2005, 2010, and 2014.

Figure 5.
Moran scatter plot of NGF share in 2000, 2005, 2010, and 2014.


Figure 6.
Local indicator of spatial autocorrelation (LISA) cluster map of NGF area. (a) LISA cluster map of NGF area in 2000; (b) LISA cluster map of NGF area in 2005; (c) LIAS cluster map of NGF area in 2010; (d) LISA cluster map of NGF area in 2014.
Figure 6.
Local indicator of spatial autocorrelation (LISA) cluster map of NGF area. (a) LISA cluster map of NGF area in 2000; (b) LISA cluster map of NGF area in 2005; (c) LIAS cluster map of NGF area in 2010; (d) LISA cluster map of NGF area in 2014.

Figure 7.
LISA cluster map of NGF share. (a) LISA cluster map of NGF share in 2000; (b) LISA cluster map of NGF share in 2005; (c) LISA cluster map of NGF share in 2010; (d) LISA cluster map of NGF share in 2014.
Figure 7.
LISA cluster map of NGF share. (a) LISA cluster map of NGF share in 2000; (b) LISA cluster map of NGF share in 2005; (c) LISA cluster map of NGF share in 2010; (d) LISA cluster map of NGF share in 2014.


Table 1.
Description of the variables used in the models.
| Code | Variable | Variable Declaration |
|---|---|---|
| ANGF | Area of non-grain farmland (ha) | Difference between sown area of crops and sown area of grain crops |
| SNGF | Share of non-grain farmland (%) | Share of non-grain farmland area in sown area of crops |
| UR | Urbanization rate (%) | Proportion of permanent urban population in total population |
| SOVSTI | Share of the secondary and tertiary industries output value to regional GDP (%) | Proportion of sum outputs of the secondary and tertiary industries in regional GDP |
| PCIRH | Per capita income of rural household (Yuan) | The income part in gross annual income of rural households deducting expenditures for production and non-production operations, taxes and contracting amount for collective tasks, which can be used in production and non-production constructive investment, living consumption, and savings directly. It includes operational revenues, wages income, property incomes, and transfer incomes. |
| CLPH | Cultivated land per household (ha/household) | Agricultural area divides number of rural households |
| AE | Agricultural employees (people) | Number of agricultural employees in agriculture, animal husbandry, and fishery |
| SAE | Share of agriculture employees (%) | Share of agricultural employees in agriculture, animal husbandry, and fishery in rural employees |
| TPAM | Total power consumption of agricultural machinery (104 kw) | Sum of all mechanical power used in agriculture, forestry, animal husbandry, and fishery production, including farming machinery, irrigation and drainage machinery, harvest machinery, plant protection machinery, forestry machinery, fishery machinery, agricultural product processing machinery, agricultural transportation machinery, and other machineries. |
Table 2.
Ordinary least square (OLS) estimation of NGF in 2000 and 2014.
| Variable | 2000 | 2014 | ||
|---|---|---|---|---|
| NGF Area | NGF Share | NGF Area | NGF Share | |
| CONSTANT | 12,266.950 | 0.028 | 40,565.900 ** | 0.053 ** |
| UR | 89,894.540 *** | 0.119 ** | 45,999.370 | 0.148 ** |
| SOVSTI | −136,051.300 *** | −0.066 | 103,842.700 *** | 0.193 *** |
| PCIRH | 14.686 *** | 0.000 *** | −4.749 ** | 0.000 ** |
| CLPH | −756.933 | 0.010 ** | 2560.115 | 0.006 ** |
| AE | 0.106 *** | 0.000 *** | 0.101 *** | 0.000 * |
| SAE | 70,004.230 *** | 0.180 *** | −105,637.000 *** | −0.015 |
| TPAM | 118.852 *** | −0.0001 ** | 51.278 * | −0.001 *** |
| R2 | 0.690 | 0.434 | 0.476 | 0.323 |
| AIC | 9370.910 | −518.526 | 9691.900 | −294.795 |
| SC | 9402.280 | −487.153 | 9723.270 | −263.423 |
| LM-LAG | 38.675 *** | 117.101 *** | 39.511 *** | 194.350 *** |
| Robust LM-LAG | 0.085 | 0.824 | 3.543 | 0.530 |
| LM-ERR | 102.441 *** | 236.405 *** | 93.310 *** | 268.478 *** |
| Robust LM-ERR | 63.851 *** | 120.127 *** | 57.343 *** | 74.659 *** |
Note: UR is urbanization rate. SOVSTI is the share of the secondary and tertiary industries output value to regional GDP. PCIRH is per capita income of rural household (in Yuan). CLPH is cultivated land per household (in ha/household). AE is the number of agricultural employees in agriculture, animal husbandry, and fishery in rural employees (in people). SAE is share of agricultural employees in agriculture, animal husbandry, and fishery. TPAM is the total power of agricultural machinery (in 104 kw). ***, **, * indicate passing the 1%, 5%, and 10% significance tests respectively.
Table 3.
Result of spatial regression of NGF.
| Variable | NGF Area | NGF Share | |||
|---|---|---|---|---|---|
| SEM-2000 | SEM-2014 | SEM-2000 | SEM-2014 | ||
| CONSTANT | 7018.081 | 15,362.030 | −0.038 * | −0.021 | |
| UR | 64,998.330 ** | 15,786.180 | 0.139 *** | 0.138 *** | |
| SOVSTI | −133,058.300 *** | 63,515.800 * | −0.028 | 0.232 *** | |
| PCIRH | 14.629 *** | 0.256 | 0.000 *** | 0.000 *** | |
| CLPH | −4275.040 | −1230.832 | 0.010 *** | 0.008 *** | |
| AE | 0.101 *** | 0.101 *** | 0.000 | 0.000 | |
| SAE | 85,157.950 *** | −89,183.600 *** | 0.222 *** | 0.028 | |
| TPAM | 149.283 *** | 89.140 *** | 0.000 | 0.000 | |
| ρ/λ | 0.493 *** | 0.416 *** | 0.707 *** | 0.679 *** | |
| R2 | 0.765 | 0.575 | 0.719 | 0.666 | |
| AIC | 9292.710 | 9630.900 | −721.418 | −505.393 | |
| SC | 9324.080 | 9662.270 | −690.046 | −474.021 | |
| S.E | 58,893.700 | 93,636.000 | 0.083 | 0.112 | |
Note: UR, SOVSTI, PCIRH, CLPH, AE, SAE, and TPAM are as those in Table 2. ***, **, * indicate passing the 1%, 5%, and 10% significance tests respectively.
© 2017 by the authors. Licensee MDPI, Basel, Switzerland. This article is an open access article distributed under the terms and conditions of the Creative Commons Attribution (CC BY) license (http://creativecommons.org/licenses/by/4.0/).
Share and Cite
MDPI and ACS Style
Zhao, X.; Zheng, Y.; Huang, X.; Kwan, M.-P.; Zhao, Y. The Effect of Urbanization and Farmland Transfer on the Spatial Patterns of Non-Grain Farmland in China. Sustainability 2017, 9, 1438. https://0-doi-org.brum.beds.ac.uk/10.3390/su9081438
AMA Style
Zhao X, Zheng Y, Huang X, Kwan M-P, Zhao Y. The Effect of Urbanization and Farmland Transfer on the Spatial Patterns of Non-Grain Farmland in China. Sustainability. 2017; 9(8):1438. https://0-doi-org.brum.beds.ac.uk/10.3390/su9081438
Chicago/Turabian StyleZhao, Xiaofeng, Yuqian Zheng, Xianjin Huang, Mei-Po Kwan, and Yuntai Zhao. 2017. "The Effect of Urbanization and Farmland Transfer on the Spatial Patterns of Non-Grain Farmland in China" Sustainability 9, no. 8: 1438. https://0-doi-org.brum.beds.ac.uk/10.3390/su9081438
Note that from the first issue of 2016, this journal uses article numbers instead of page numbers. See further details here.