A Novel Adsorbent Albite Modified with Cetylpyridinium Chloride for Efficient Removal of Zearalenone


Abstract
:
1. Introduction
2. Results and Discussion
2.1. Characterizations
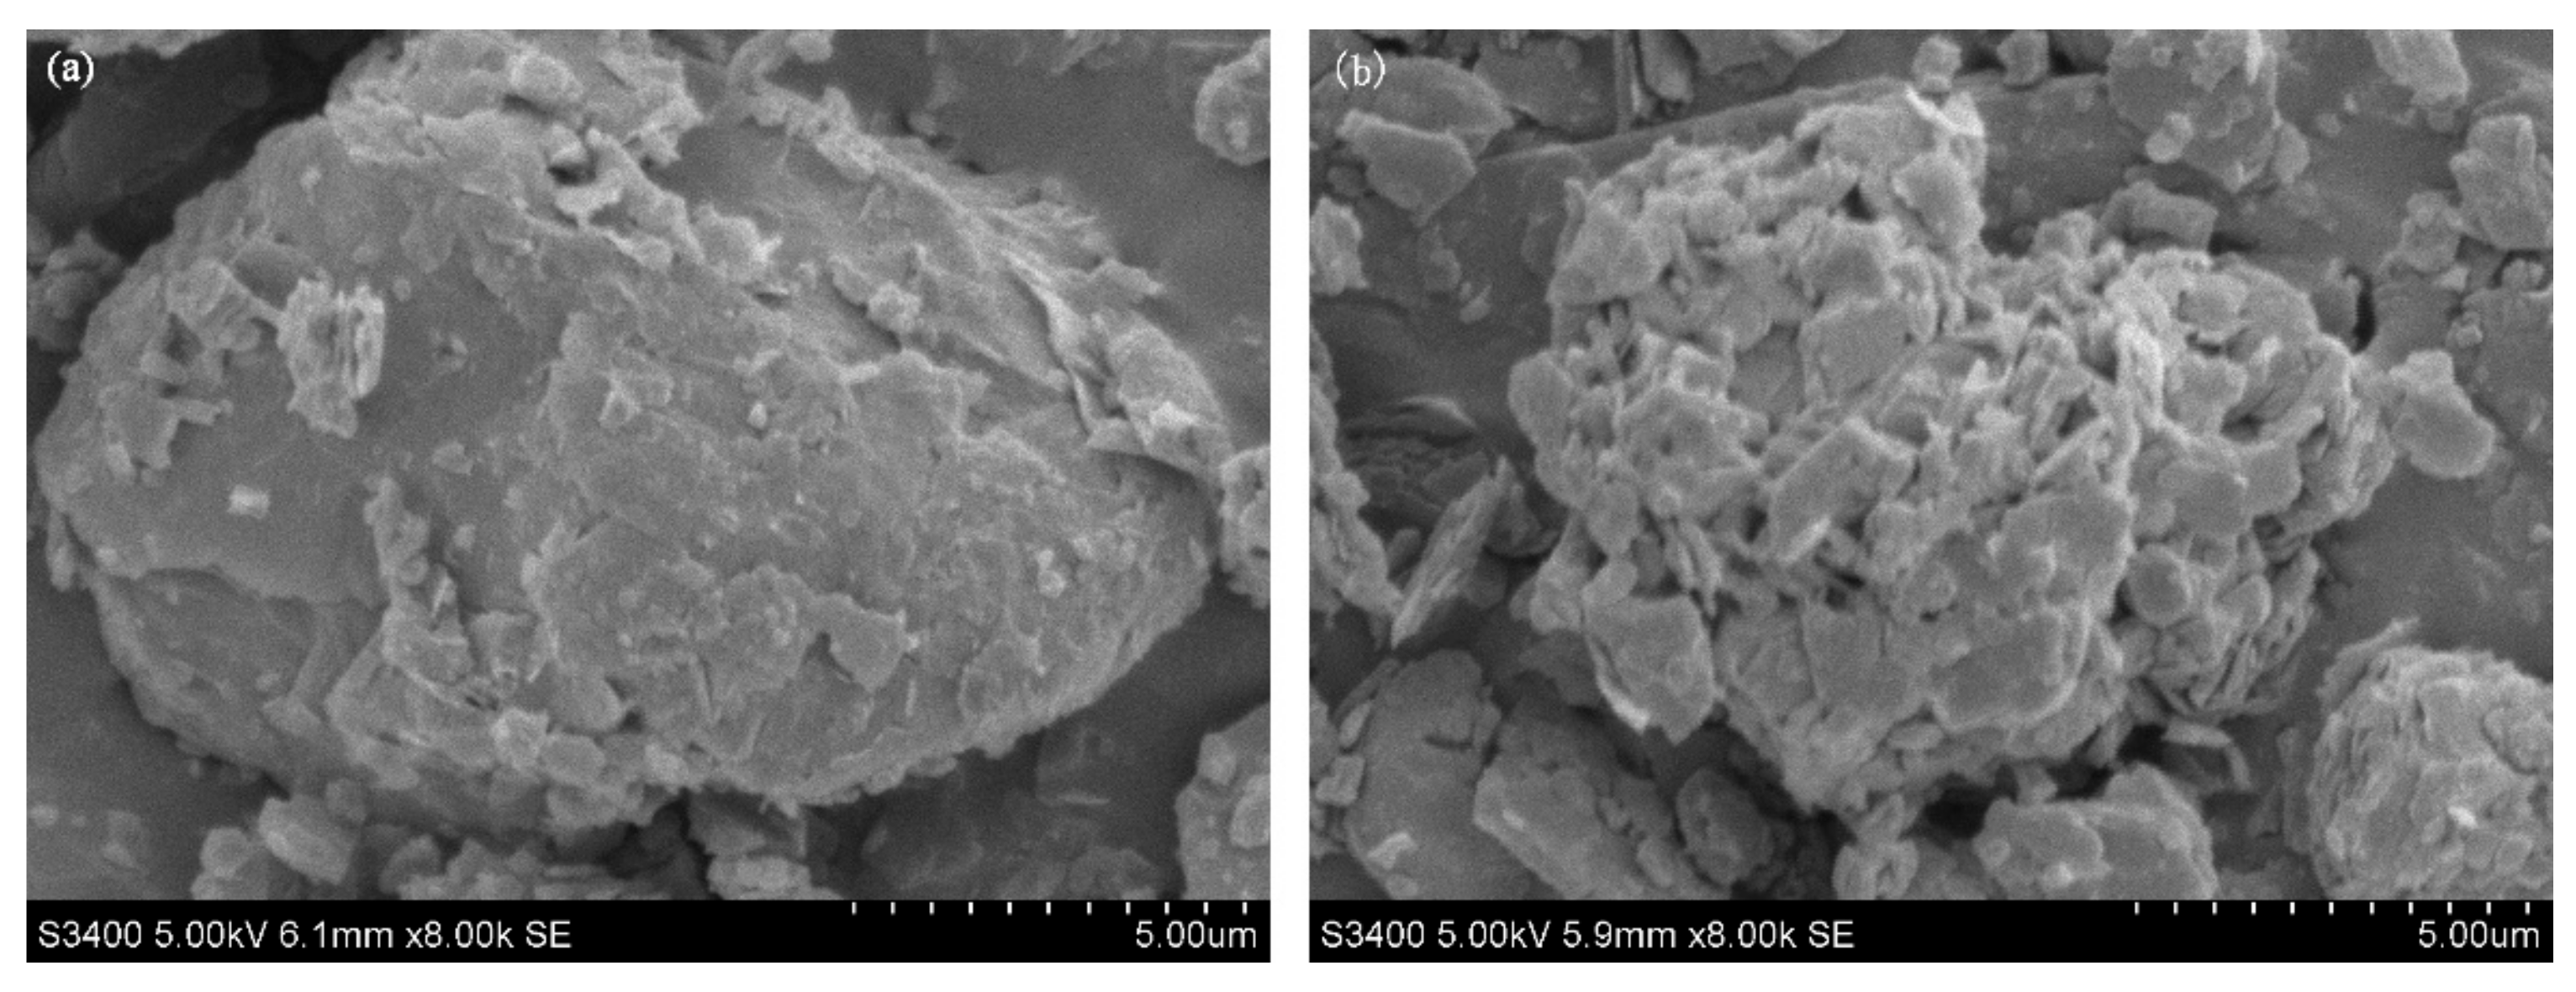
2.1.1. SEM Analysis
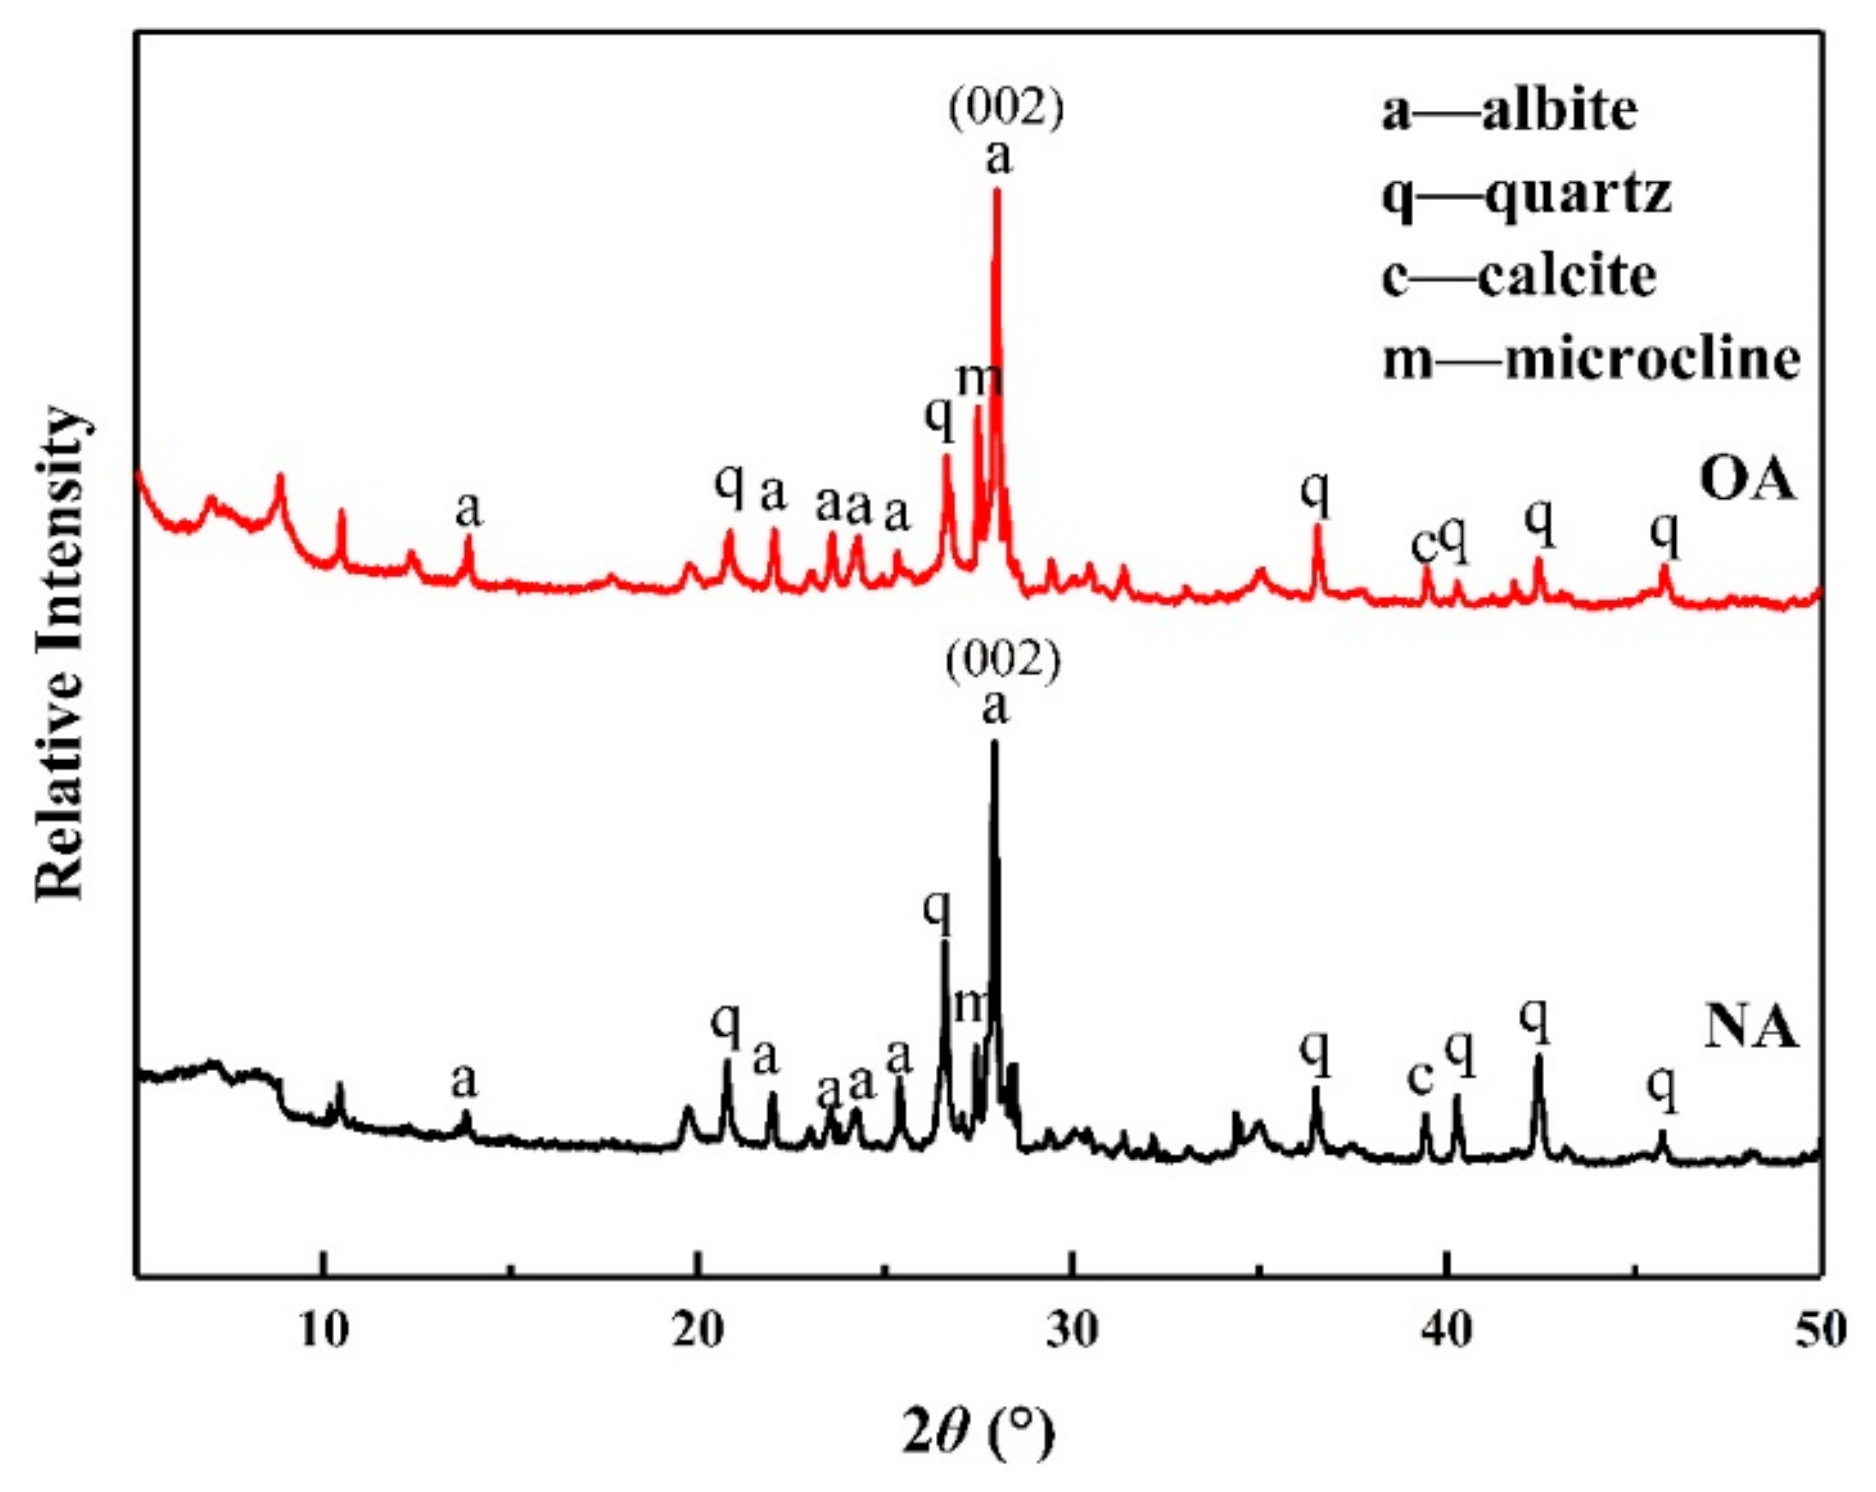
2.1.2. XRD Analysis
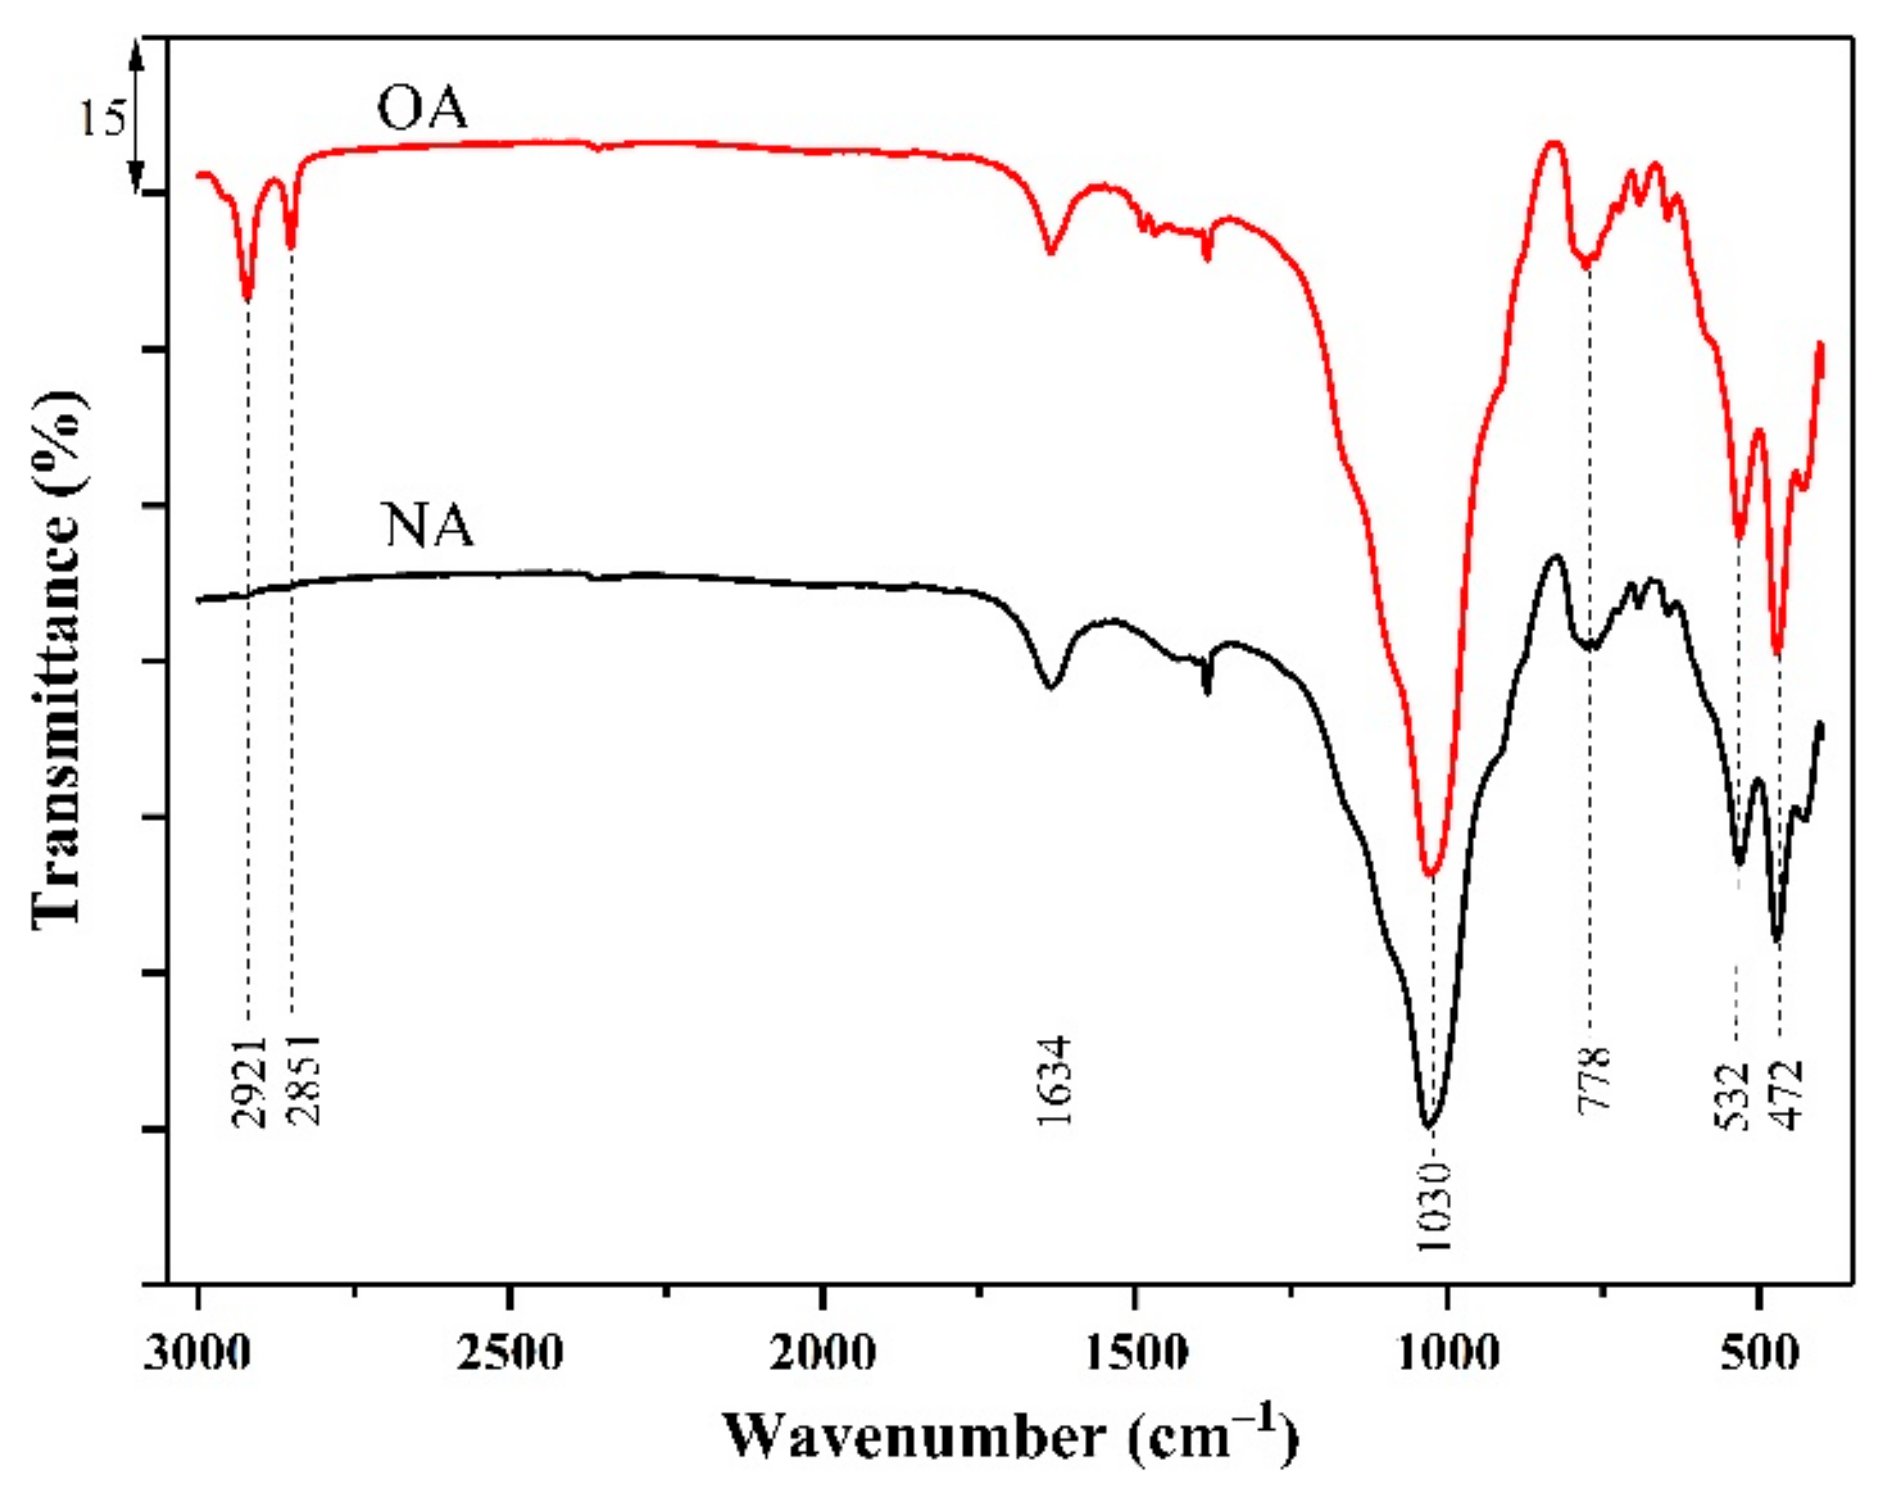
2.1.3. FTIR Analysis
2.1.4. The Contents of Organic Carbon (C), Hydrogen (H), and Nitrogen (N)
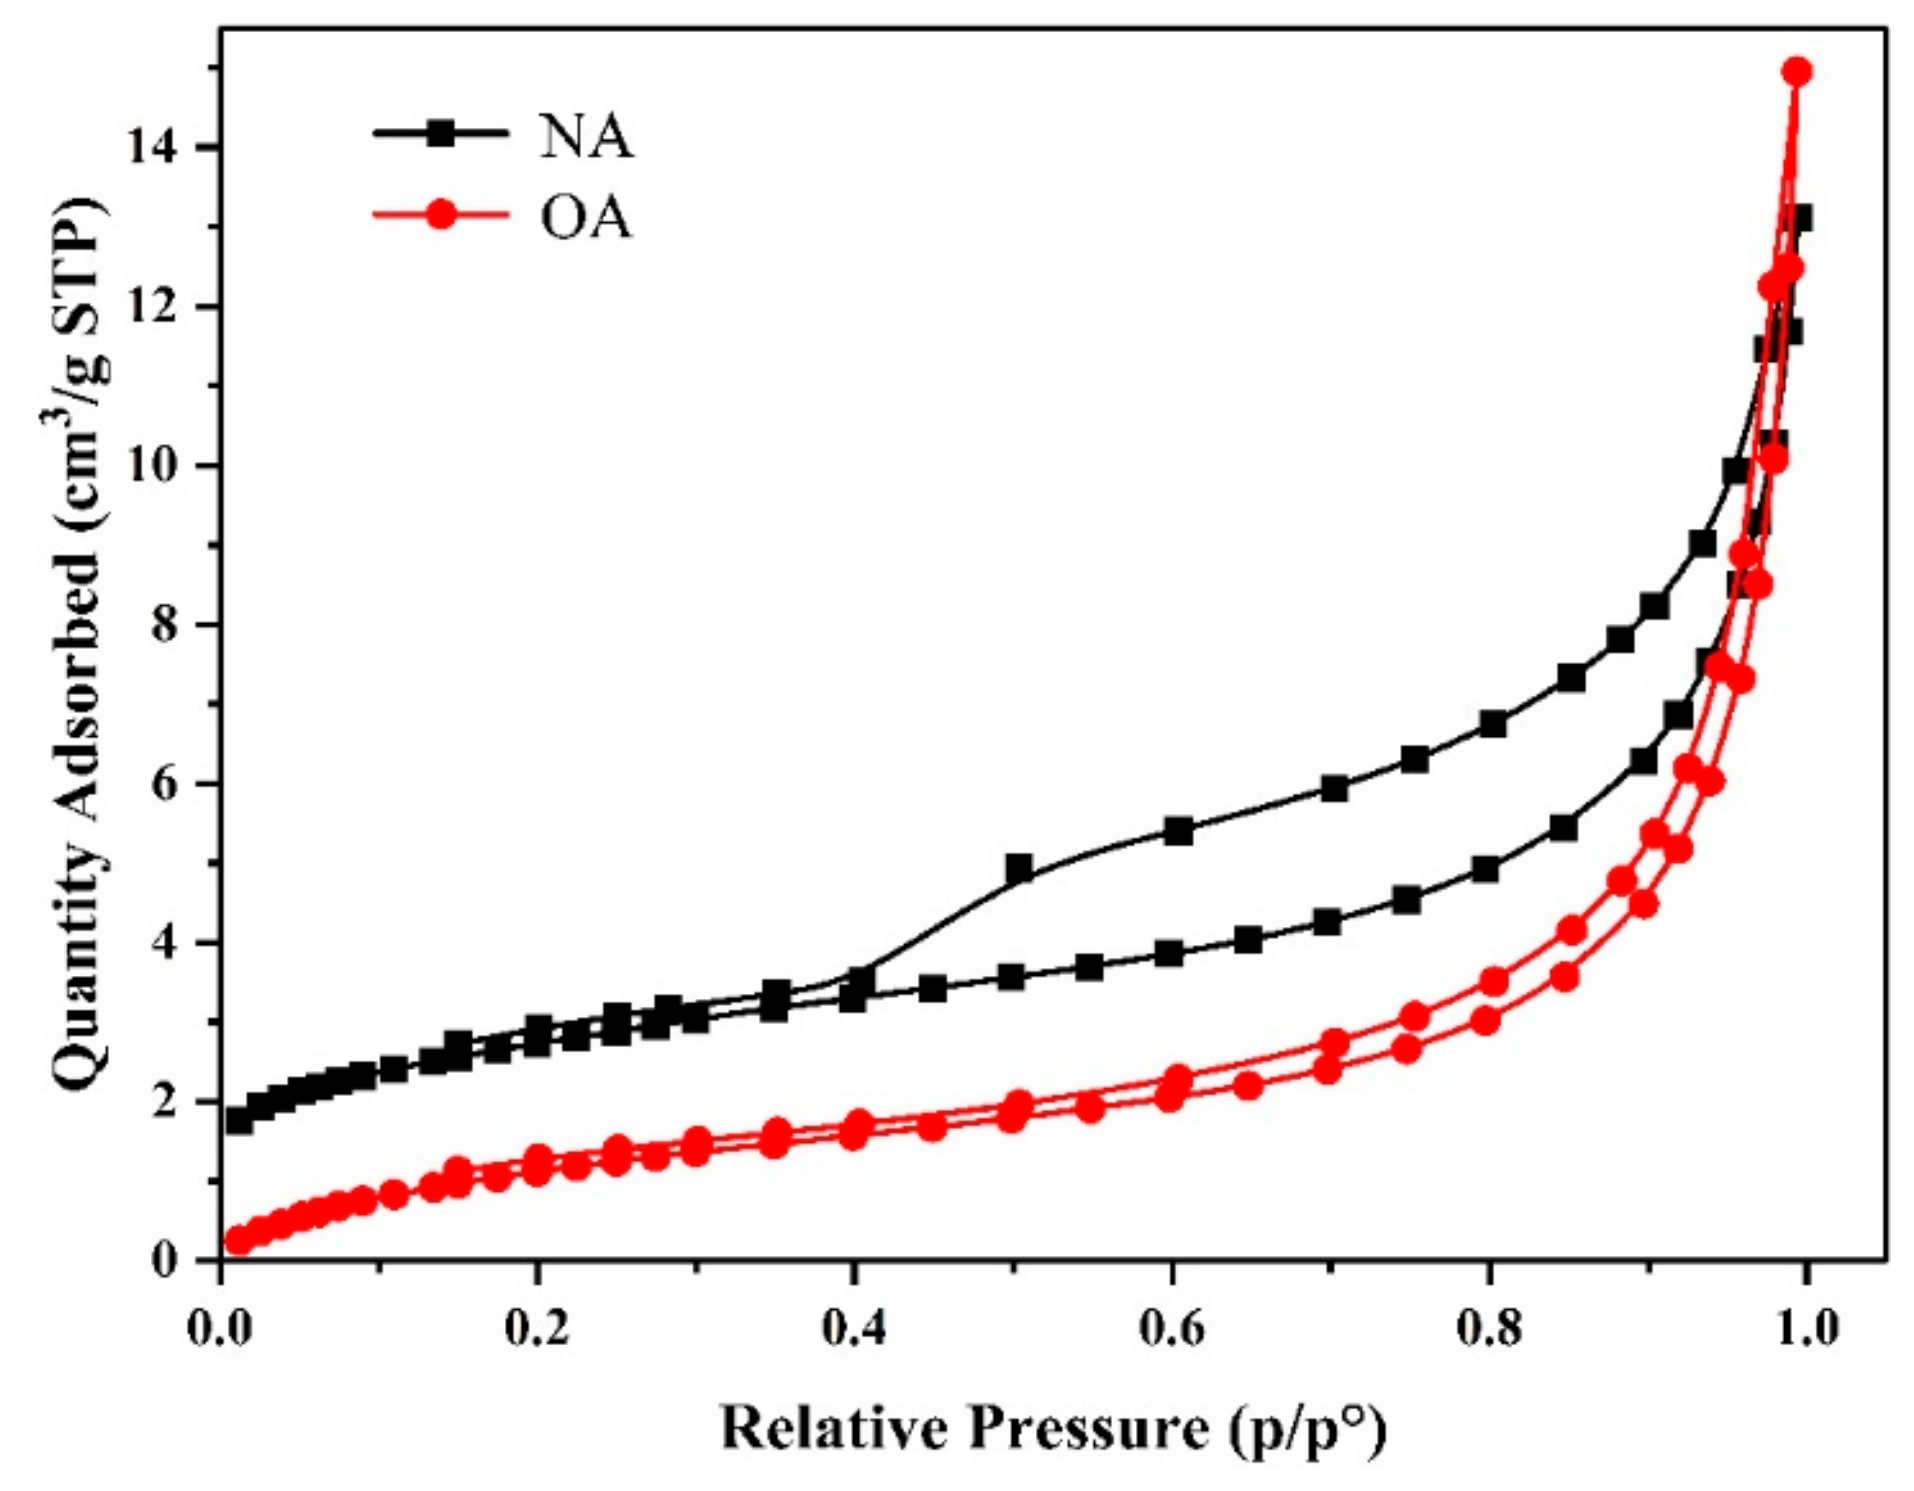
2.1.5. Surface Area and Pore Size Distribution
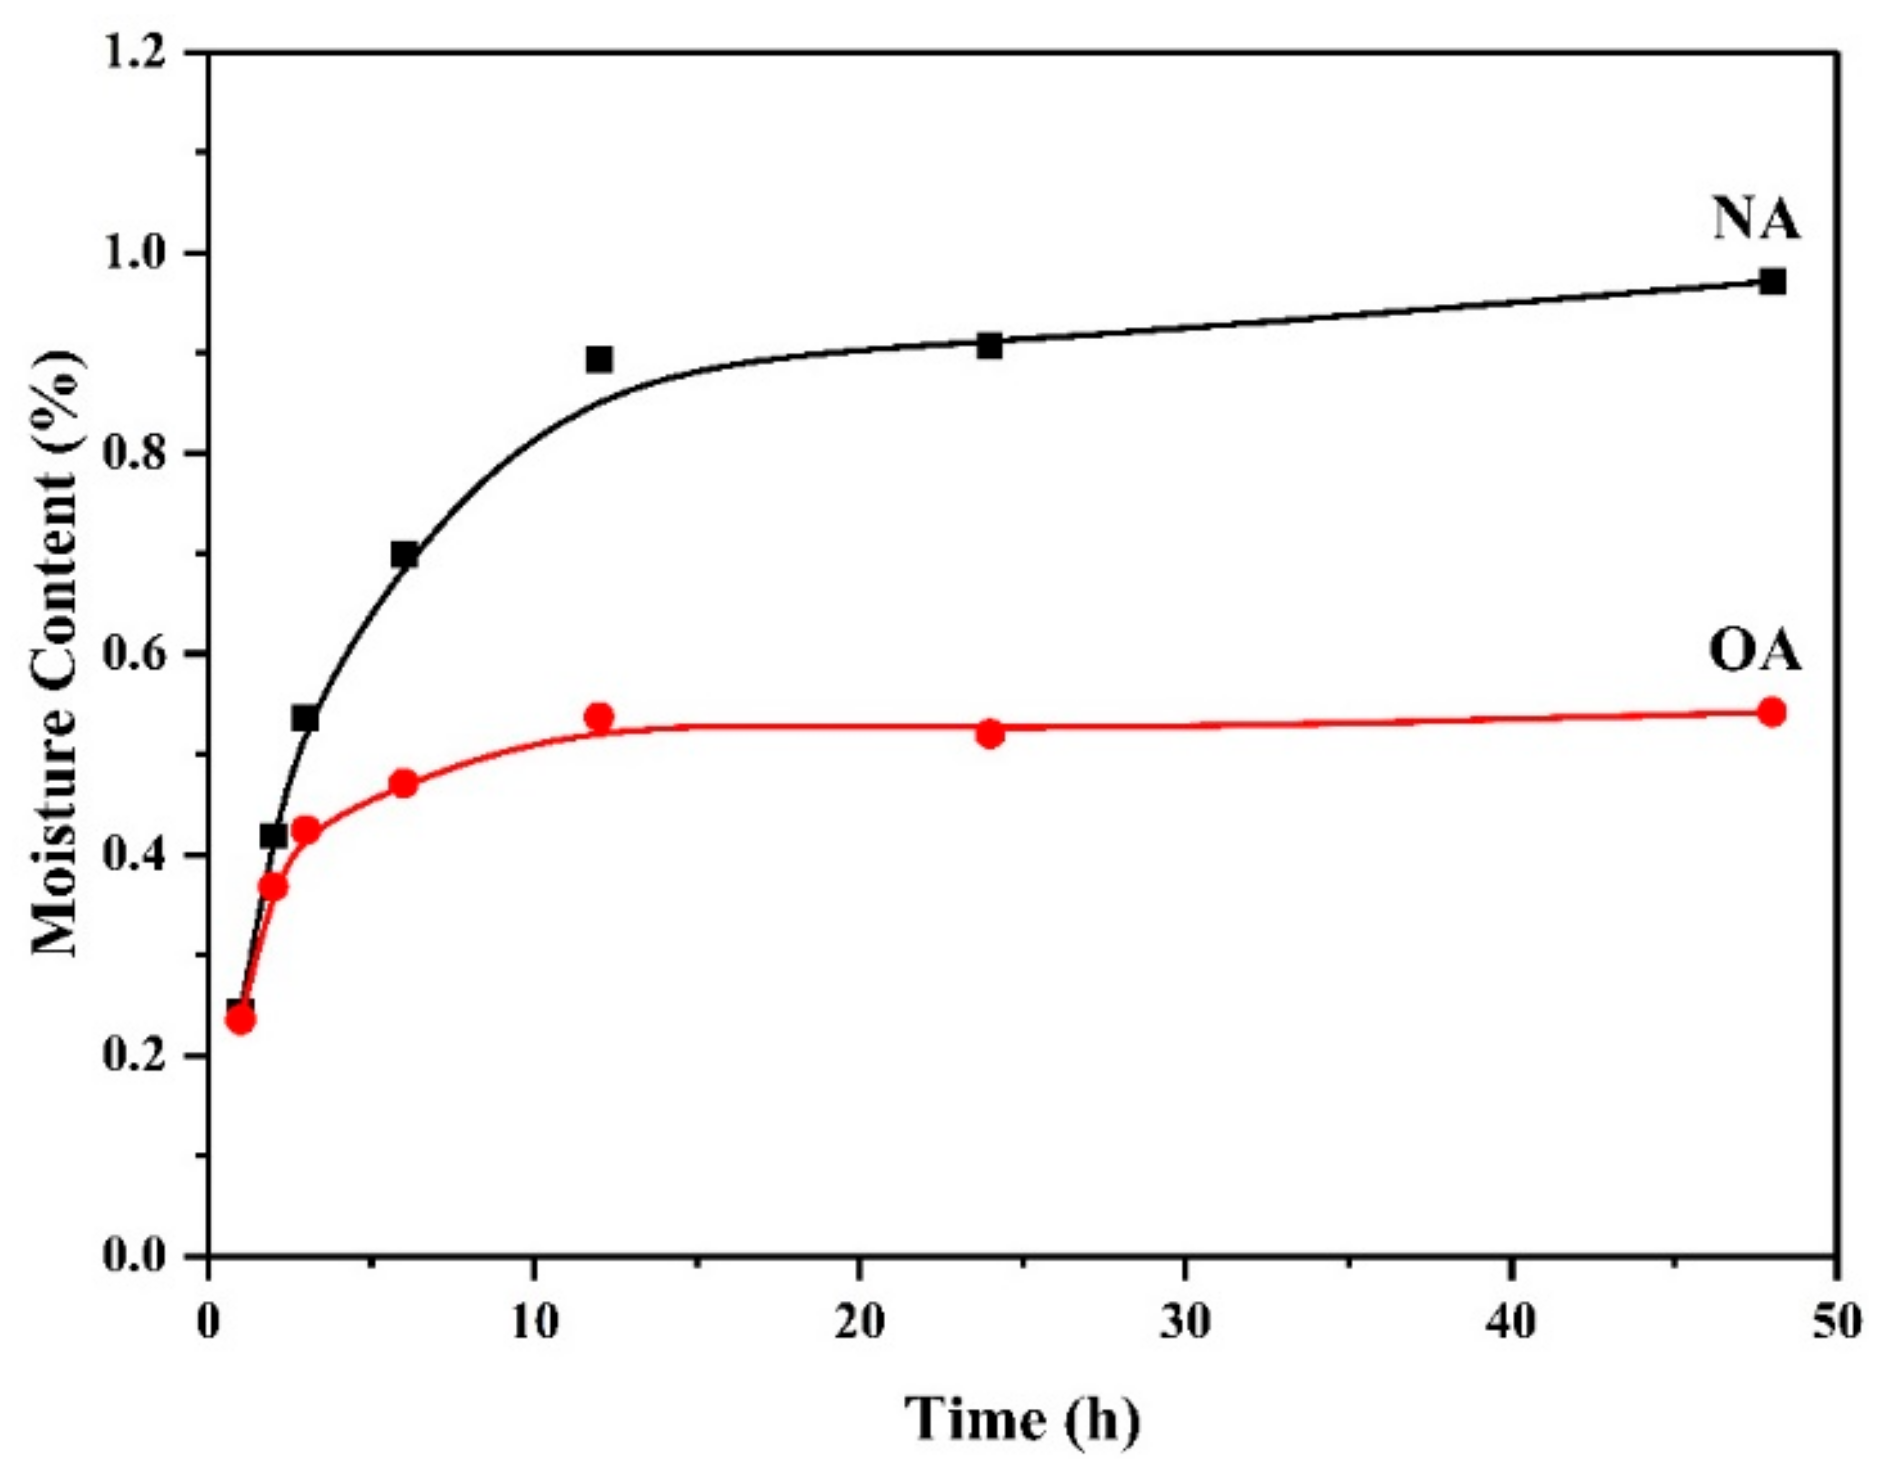
2.1.6. Surface Hydrophobicity
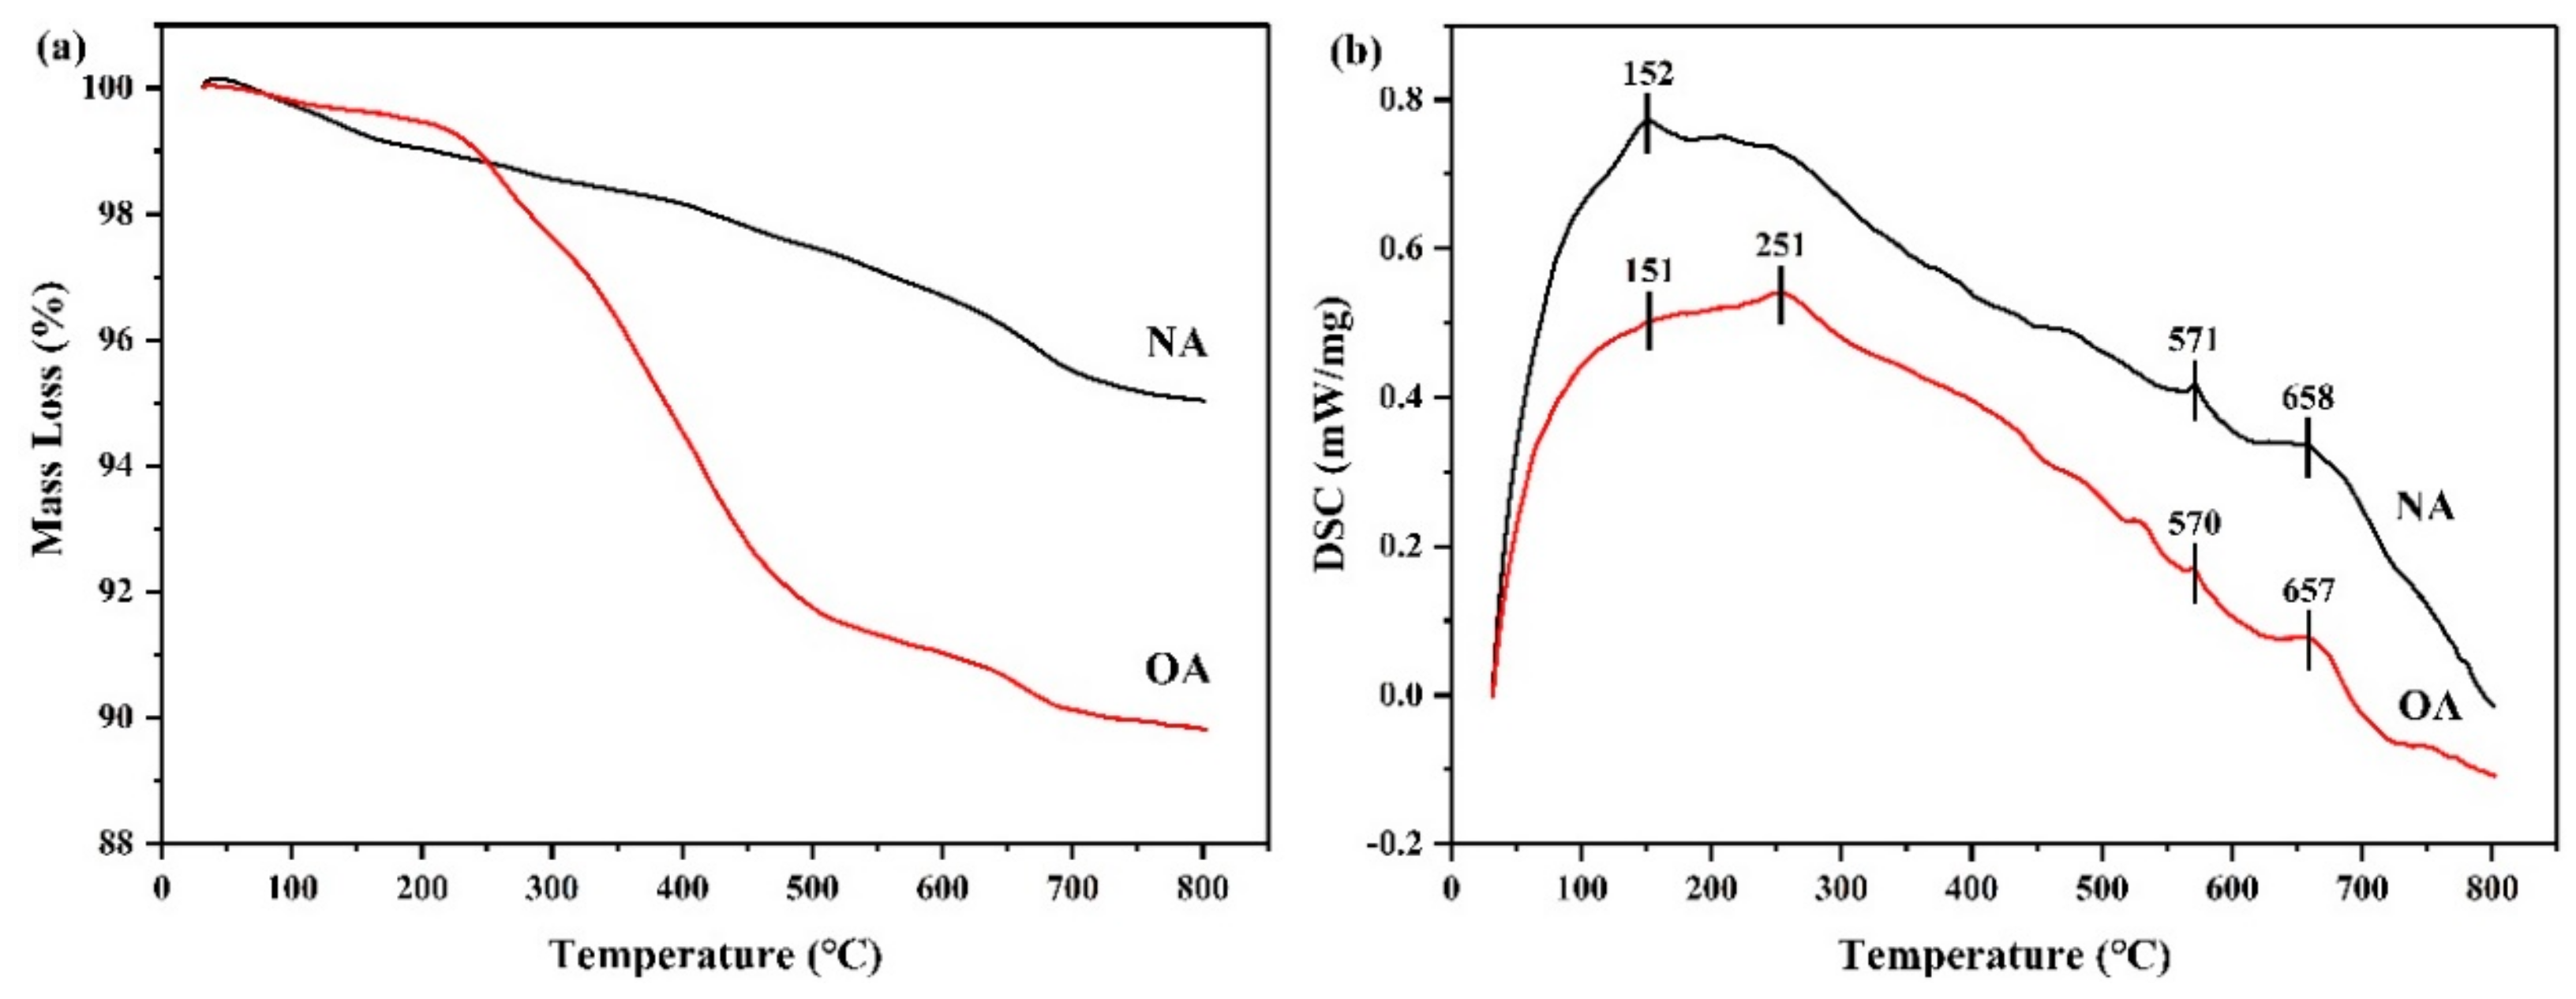
2.1.7. Thermal Analysis
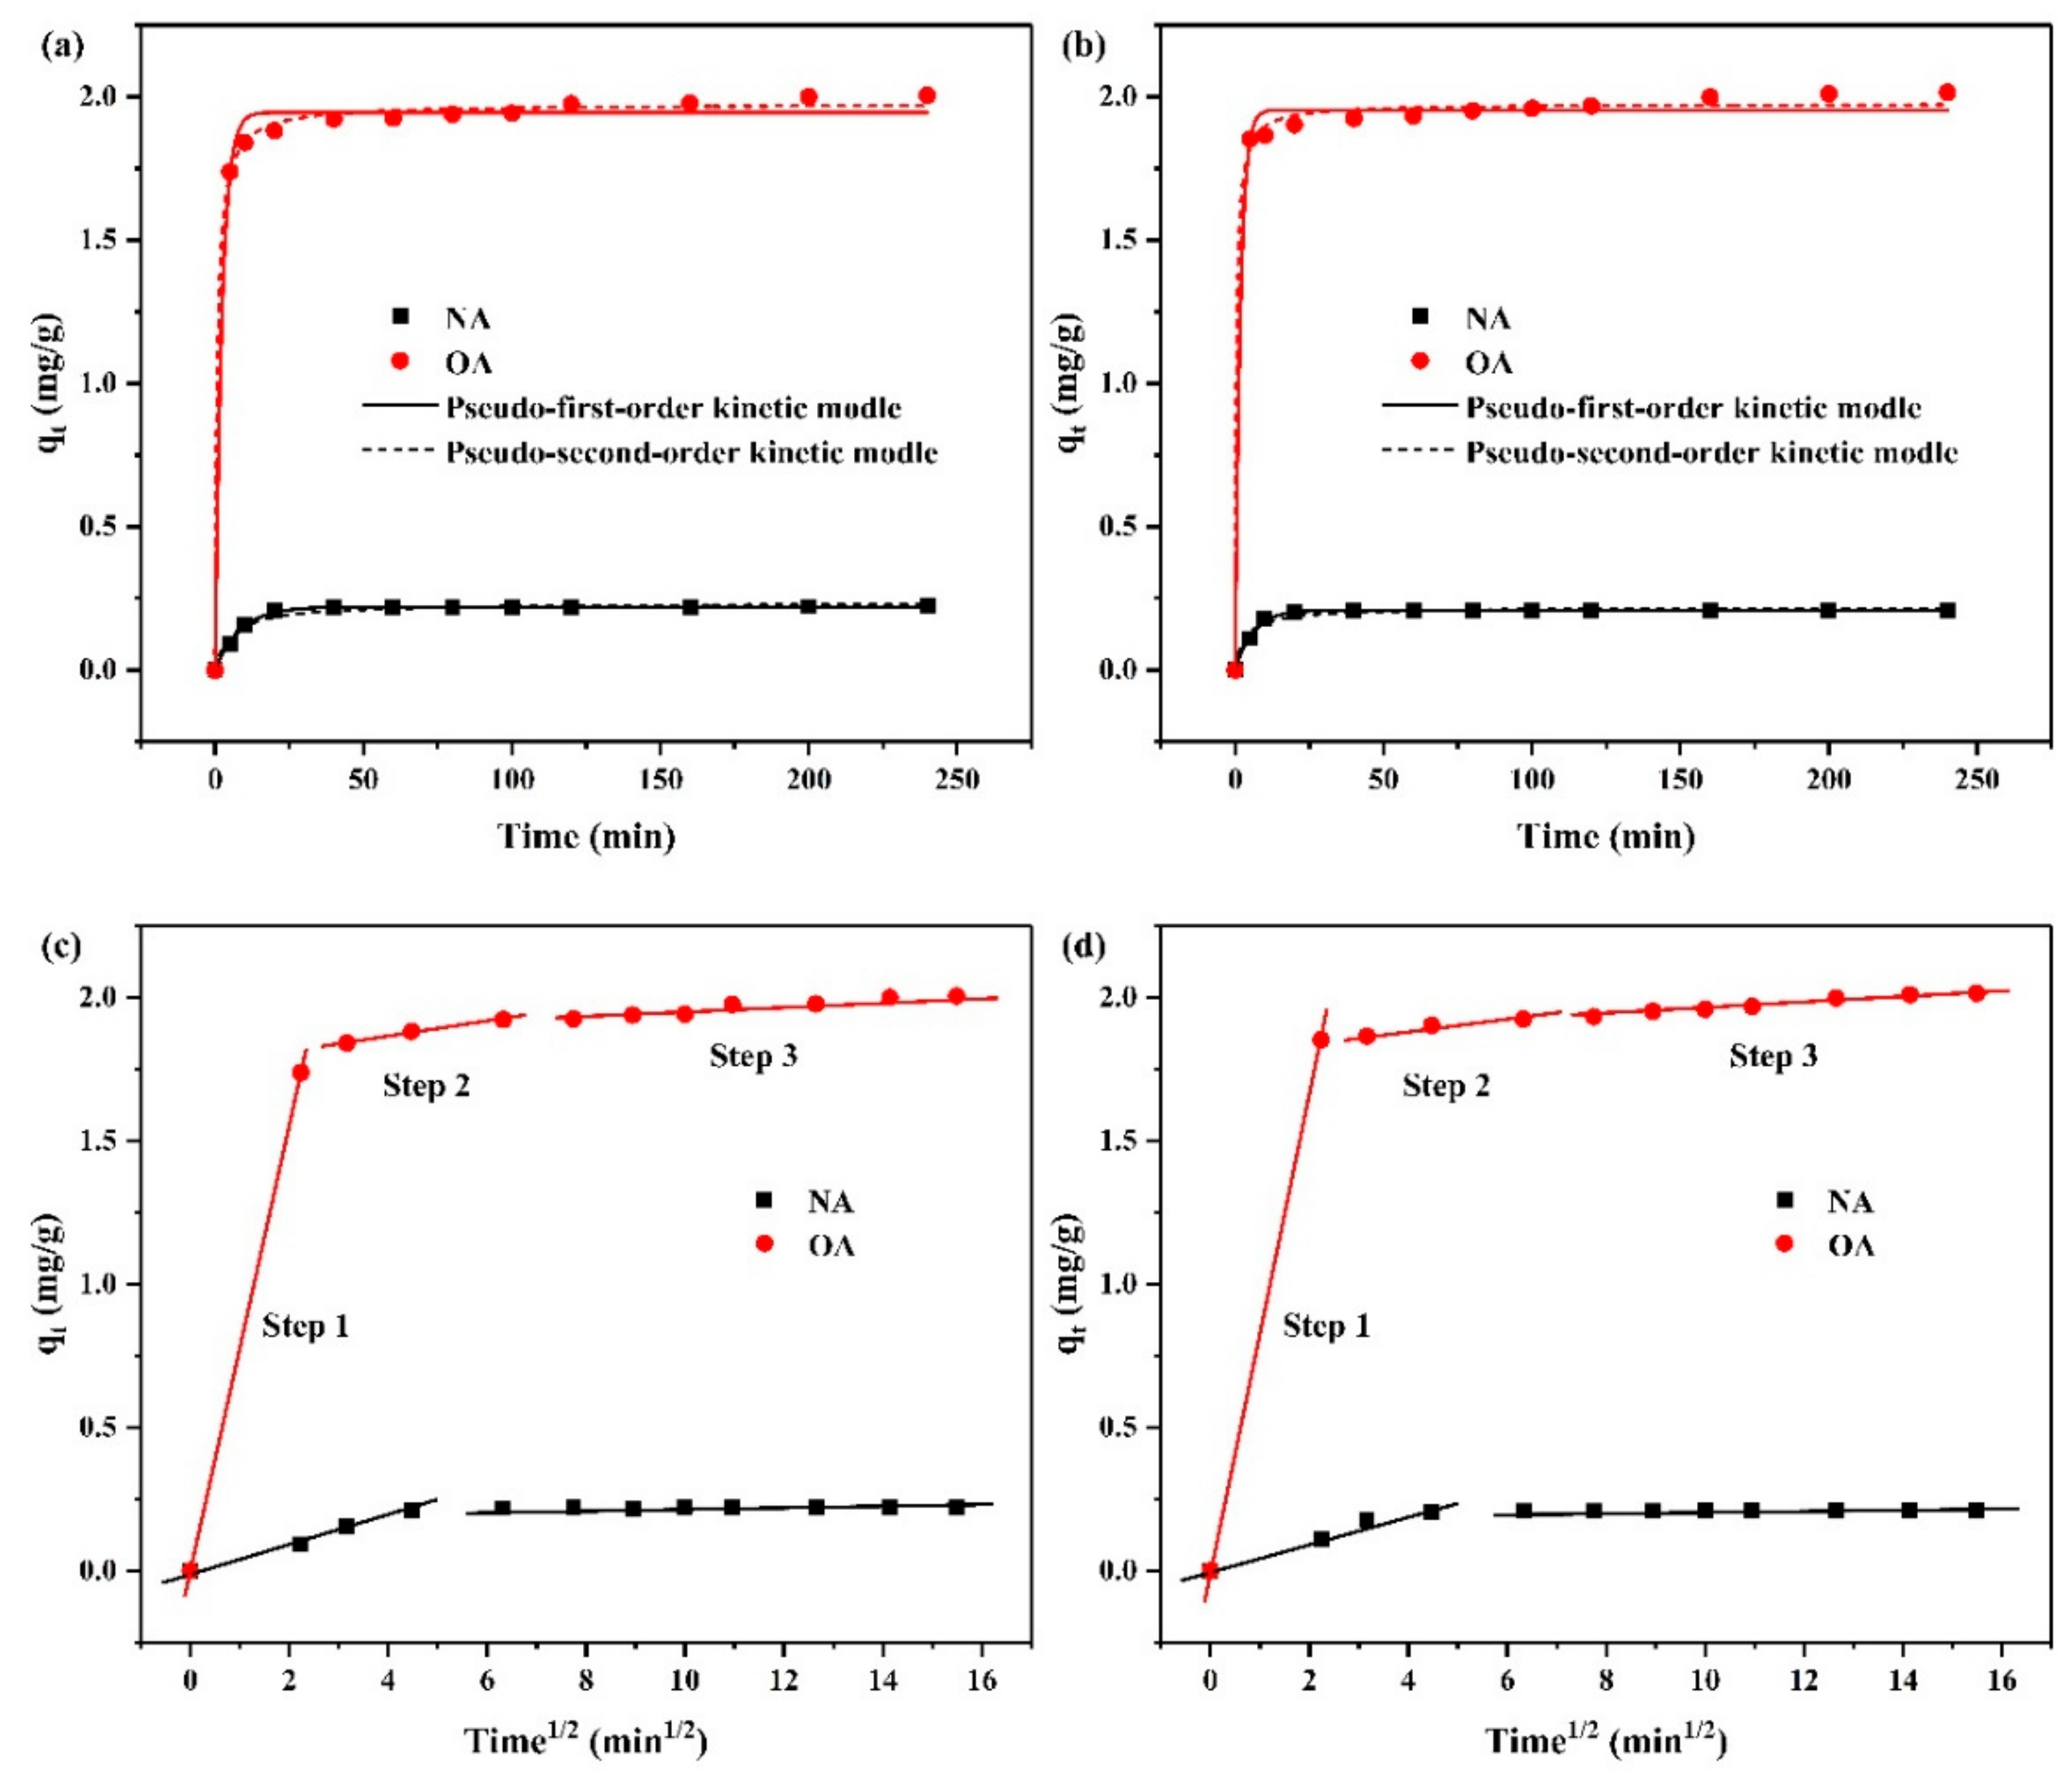
2.2. Adsorption Behaviors for ZEN
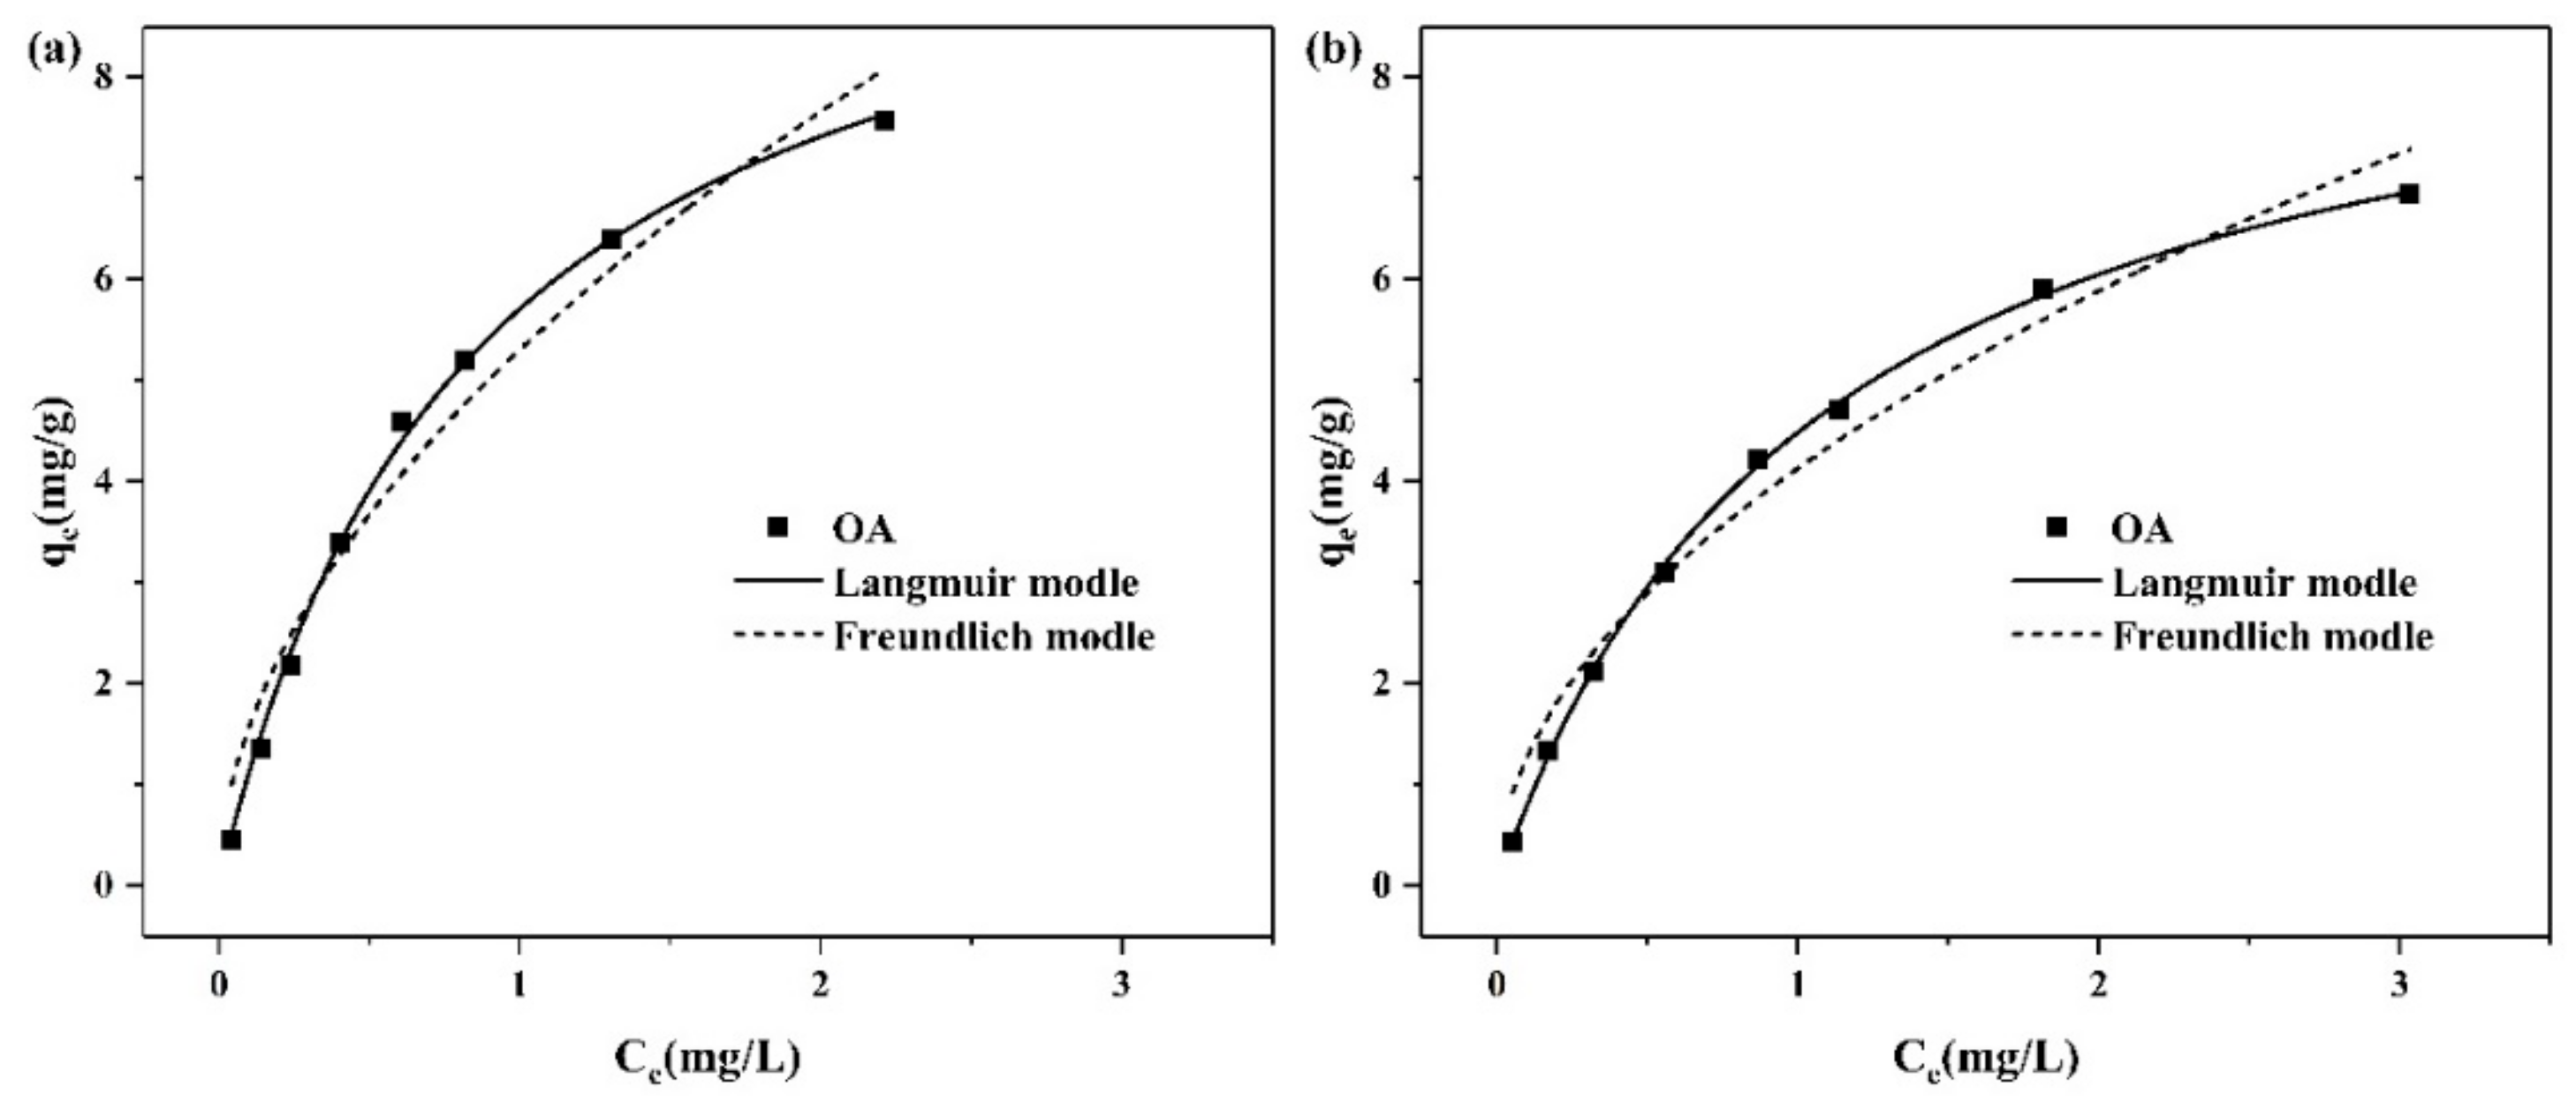
2.3. Adsorption Isotherm
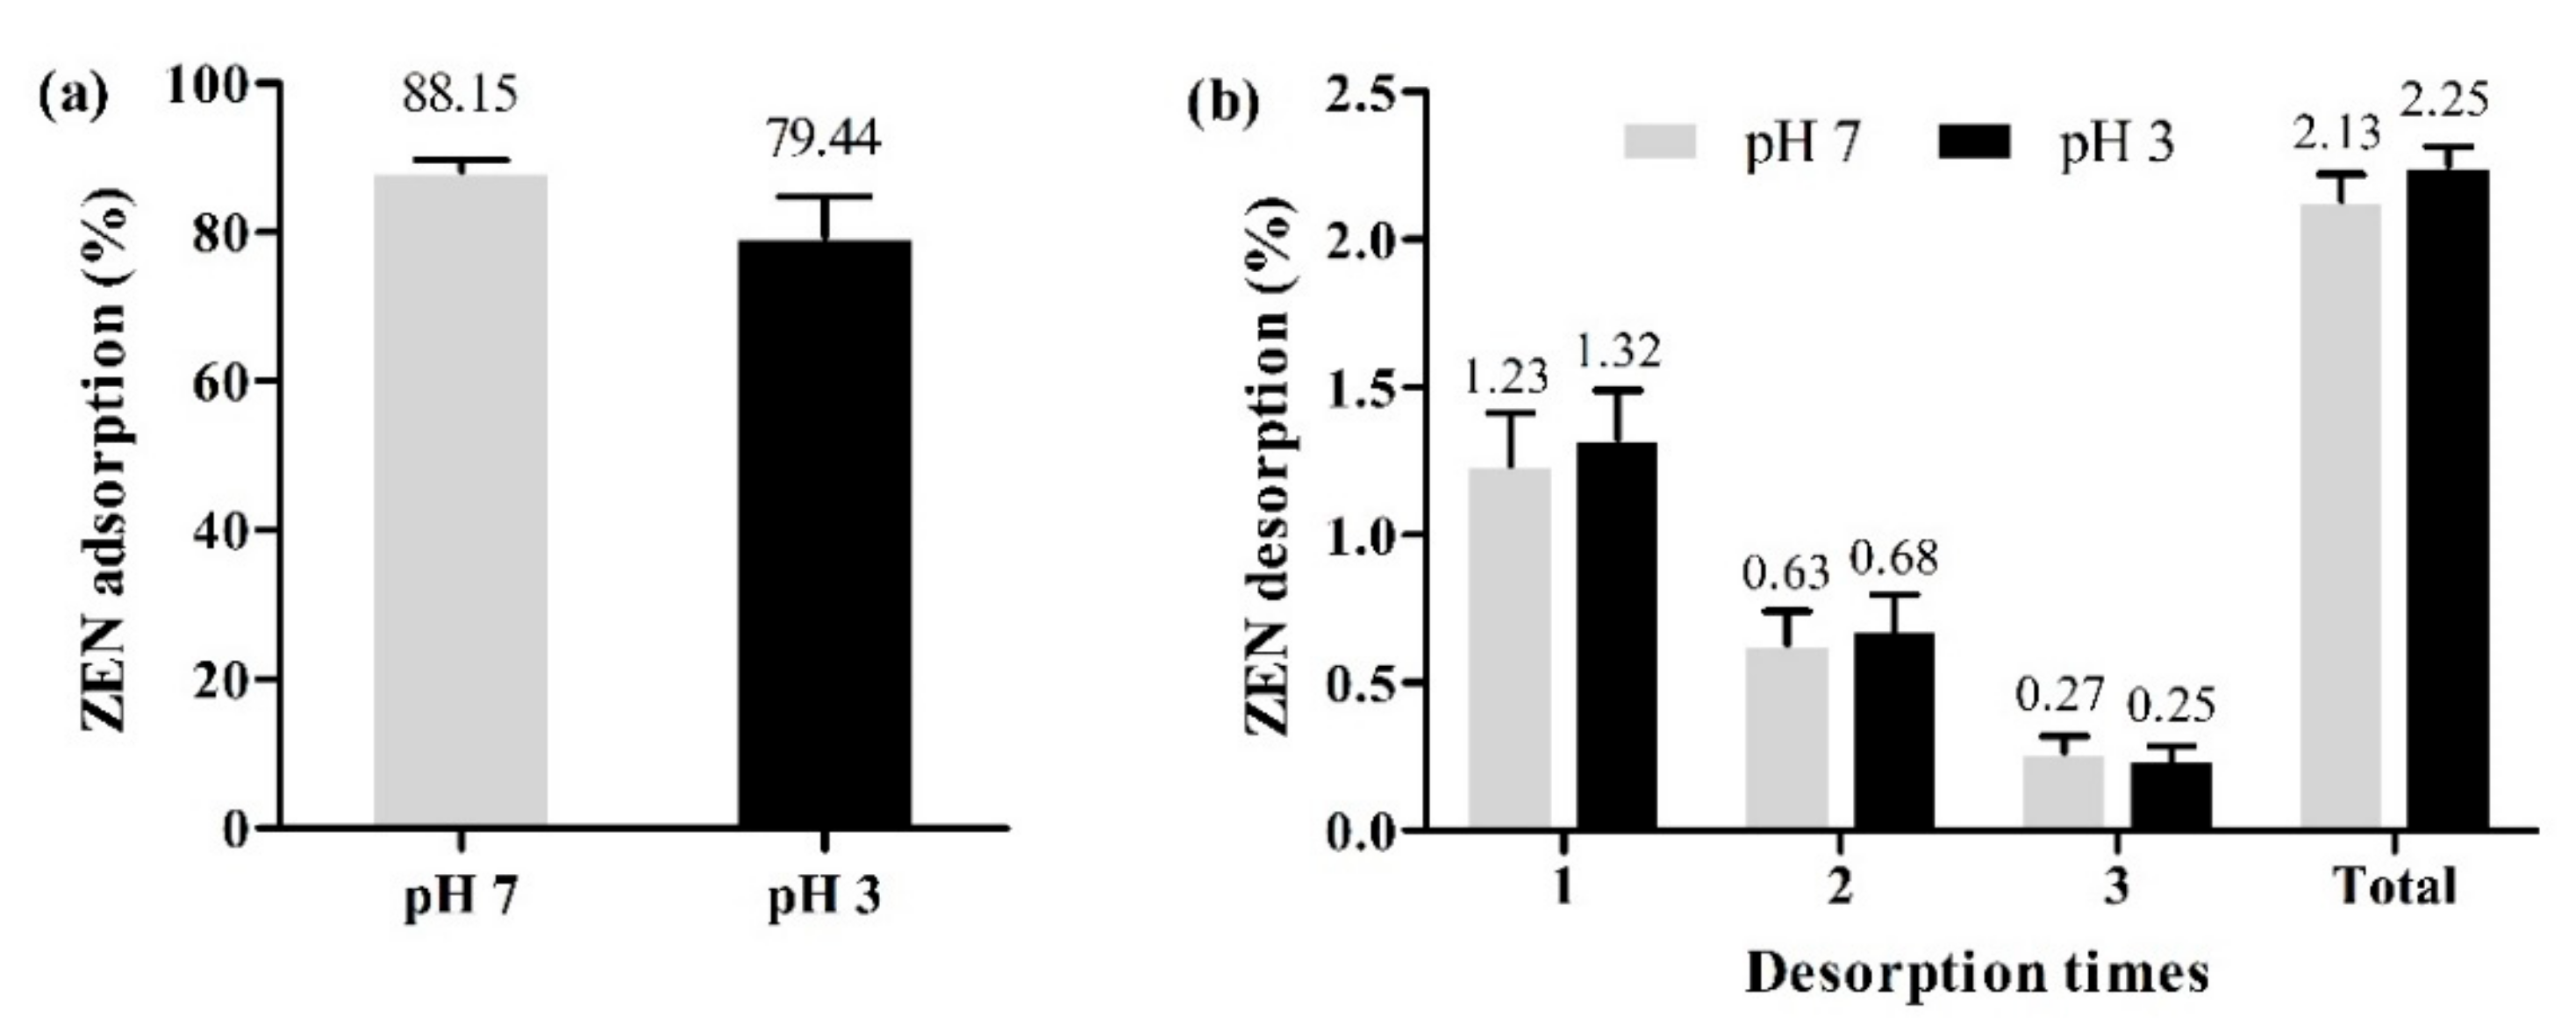
2.4. Desorption
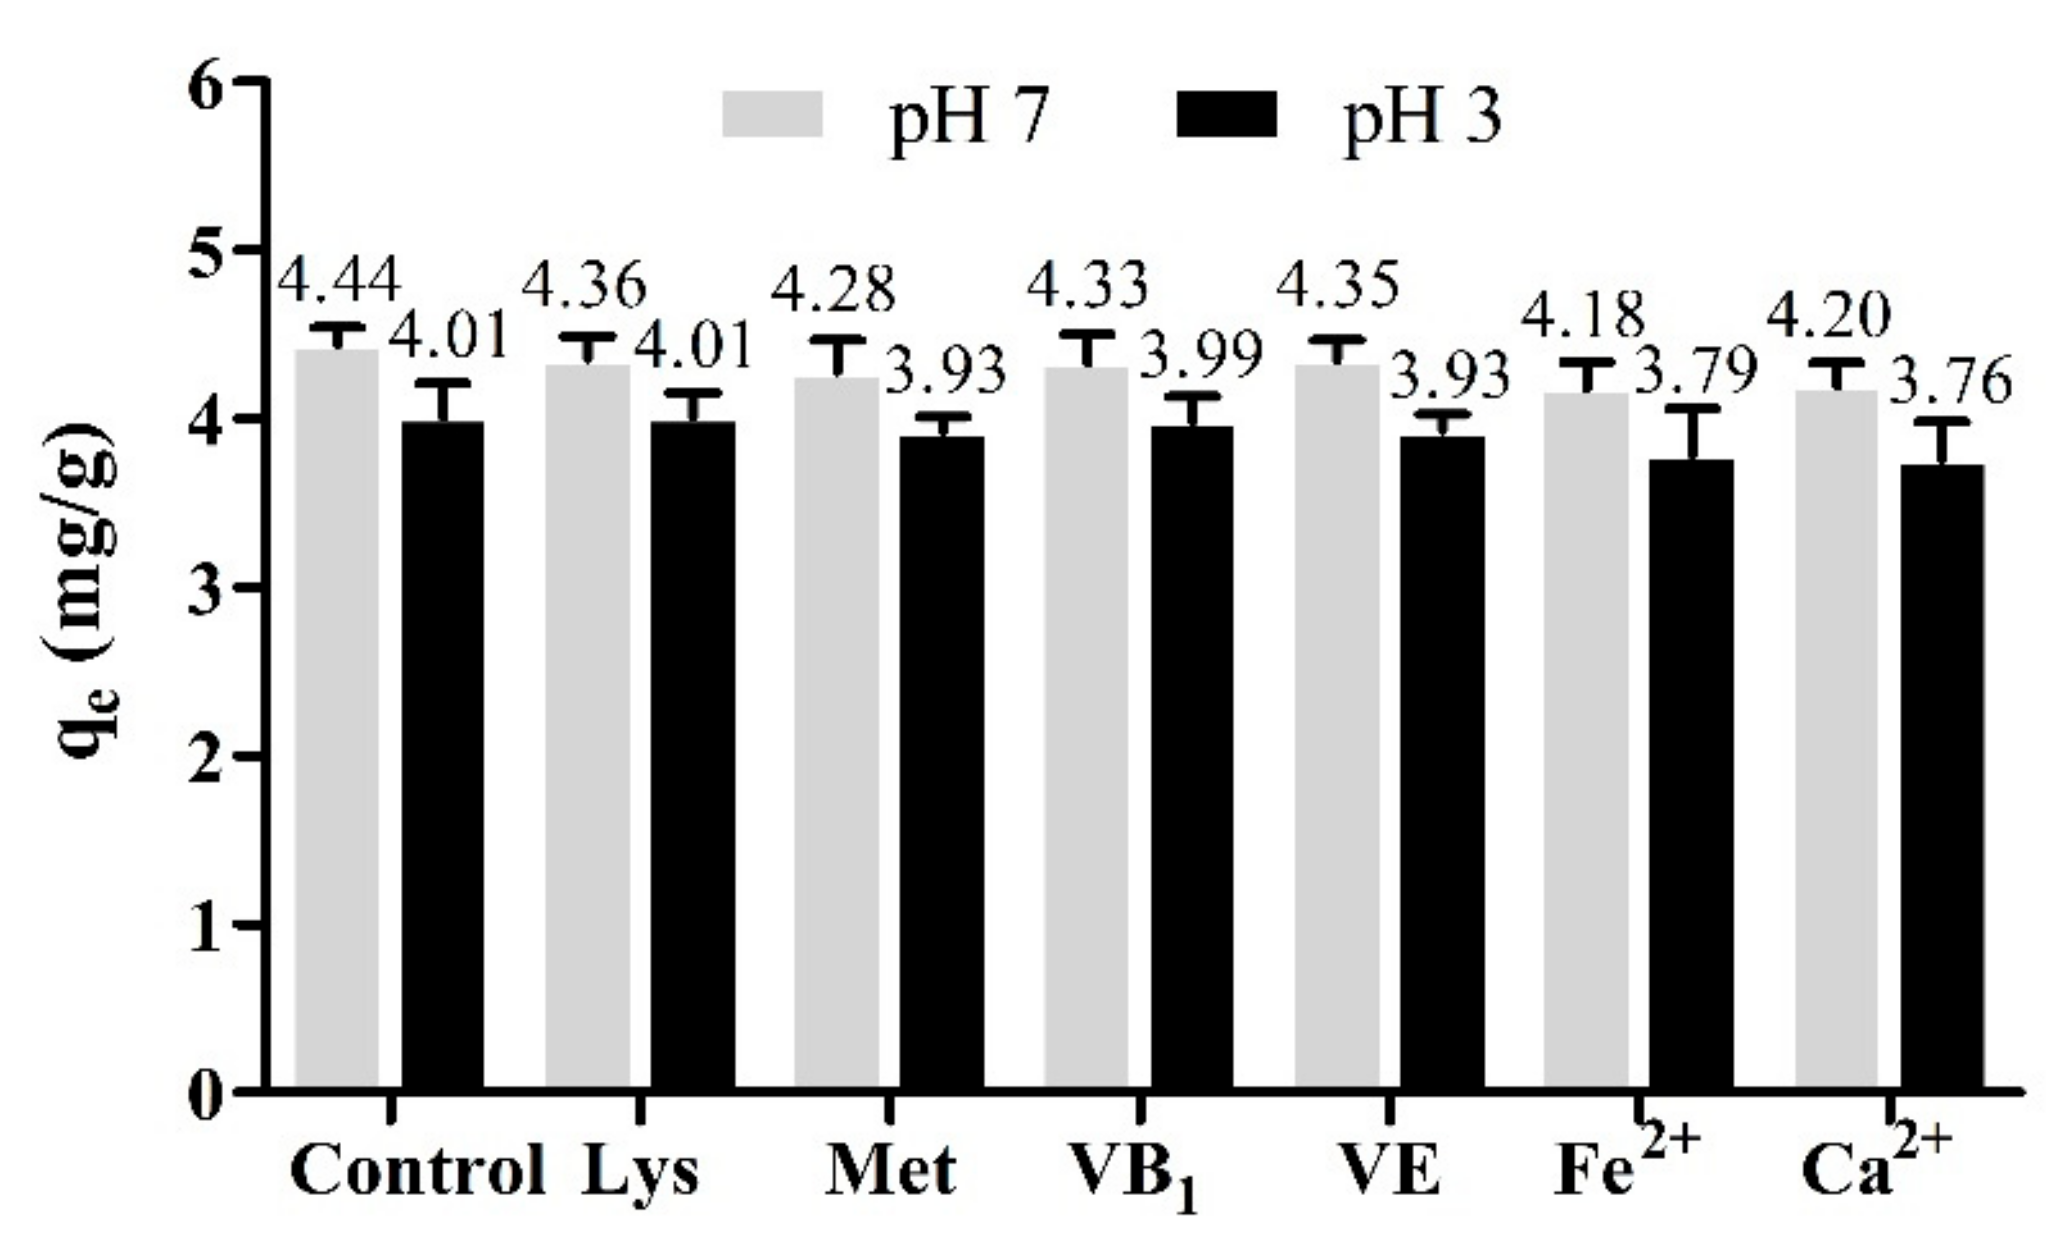
2.5. Effect of Co-Existing Amino Acids, Vitamins and Minerals
3. Conclusions
4. Materials and Methods
4.1. Materials
4.2. Preparation of Organoalbite
4.3. Characterization
4.4. Batch Adsorption Experiments
Author Contributions
Funding
Conflicts of Interest
References
- Alshannaq, A.; Yu, J.-H. Occurrence, toxicity, and analysis of major mycotoxins in food. Int. J. Environ. Res. Public Health 2017, 14, 632. [Google Scholar] [CrossRef]
- Sangsila, A.; Faucet-Marquis, V.; Pfohl-Leszkowicz, A.; Itsaranuwat, P. Detoxification of zearalenone by Lactobacillus pentosus strains. Food Control 2016, 62, 187–192. [Google Scholar] [CrossRef]
- Gao, X.; Sun, L.; Zhang, N.; Li, C.; Zhang, J.; Xiao, Z.; Qi, D. Gestational Zearalenone Exposure Causes Reproductive and Developmental Toxicity in Pregnant Rats and Female Offspring. Toxins 2017, 9, 21. [Google Scholar] [CrossRef]
- Zhang, Y.; Gao, R.; Liu, M.; Shi, B.; Shan, A.; Cheng, B. Use of modified halloysite nanotubes in the feed reduces the toxic effects of zearalenone on sow reproduction and piglet development. Theriogenology 2015, 83, 932–941. [Google Scholar] [CrossRef]
- Cheraghi, S.; Razi, M.; Malekinejad, H. Involvement of cyclin D1 and E2f1 in zearalenone-induced DNA damage in testis of rats. Toxicon 2015, 106, 108–116. [Google Scholar] [CrossRef]
- Alla, E.S.A.M.A. Zearalenone: Incidence, toxigenic fungi and chemical decontamination in Egyptian cereals. Die Nahr. 1997, 41, 362–365. [Google Scholar] [CrossRef]
- Méndez-Albores, A.; Arámbula-Villa, G.; Loarca-Piña, M.G.F.; Castaño-Tostado, E.; Moreno-Martínez, E. Safety and efficacy evaluation of aqueous citric acid to degrade B-aflatoxins in maize. Food Chem. Toxicol. 2005, 43, 233–238. [Google Scholar] [CrossRef]
- Castells, M.; Marín, S.; Sanchis, V.; Ramos, A.J. Fate of mycotoxins in cereals during extrusion cooking: A review. Food Addit. Contam. 2005, 22, 150–157. [Google Scholar] [CrossRef] [PubMed]
- Wang, G.; Yu, M.; Dong, F.; Shi, J.; Xu, J. Esterase activity inspired selection and characterization of zearalenone degrading bacteria Bacillus pumilus ES-21. Food Control 2017, 77, 57–64. [Google Scholar] [CrossRef]
- Tan, H.; Zhang, Z.; Hu, Y.; Wu, L.; Liao, F.; He, J.; Luo, B.; He, Y.; Zuo, Z.; Ren, Z. Isolation and characterization of Pseudomonas otitidis TH-N1 capable of degrading Zearalenone. Food Control 2015, 47, 285–290. [Google Scholar] [CrossRef]
- Samuel, M.S.; Sivaramakrishna, A.; Mehta, A. Degradation and detoxification of aflatoxin B1 by Pseudomonas putida. Int. Biodeterior. Biodegrad. 2014, 86, 202–209. [Google Scholar] [CrossRef]
- Zhao, L.; Jin, H.; Lan, J.; Zhang, R.; Ren, H.; Zhang, X.; Yu, G. Detoxification of zearalenone by three strains of Lactobacillus plantarum from fermented food invitro. Food Control 2015, 54, 158–164. [Google Scholar] [CrossRef]
- Bzduchawróbel, A.; Gniewosz, M.; Chlebowskaśmigiel, A. In vitro and in vivo mycotoxin binding through the bacteria of Lactobacillus and Bifidobacterium species. Med. Weter. 2015, 71, 748–757. [Google Scholar]
- Vila-Donat, P.; Marín, S.; Sanchis, V.; Ramos, A.J. A review of the mycotoxin adsorbing agents, with an emphasis on their multi-binding capacity, for animal feed decontamination. Food Chem. Toxicol. 2018, 114, 246–259. [Google Scholar] [CrossRef] [PubMed]
- Neeff, D.V.; Ledoux, D.R.; Rottinghaus, G.E.; Bermudez, A.J.; Dakovic, A.; Murarolli, R.A.; Oliveira, C.A. In vitro and in vivo efficacy of a hydrated sodium calcium aluminosilicate to bind and reduce aflatoxin residues in tissues of broiler chicks fed aflatoxin B1. Poult. Sci. 2013, 92, 131–137. [Google Scholar] [CrossRef]
- Marković, M.A.; Daković, A.S.; Rottinghaus, G.E.; Stojanović, M.D.; Dondur, V.T.; Kragović, M.M.; Gulišija, Z.P. Aflatoxin B1 adsorption by the natural aluminosilicates-concentrate of montmorillonite and zeolite. Hem. Ind. 2016, 70, 519–524. [Google Scholar] [CrossRef]
- Marković, M.; Daković, A.; Rottinghaus, G.E.; Kragović, M.; Petković, A.; Krajišnik, D.; Milić, J.; Mercurio, M.; Gennaro, B.D. Adsorption of the mycotoxin zearalenone by clinoptilolite and phillipsite zeolites treated with cetylpyridinium surfactant. Colloids Surf. B. Biointerfaces 2016, 151, 324–332. [Google Scholar] [CrossRef]
- Wang, G.; Miao, Y.; Sun, Z.; Zheng, S. Simultaneous adsorption of aflatoxin B1 and zearalenone by mono- and di-alkyl cationic surfactants modified montmorillonites. J. Colloid Interface Sci. 2017, 511, 67–76. [Google Scholar] [CrossRef]
- Hsiao, Y.H.; La Plante, E.C.; Nma, K.; Le, P.Y.; Neithalath, N.; Bauchy, M.; Sant, G. The Effects of Irradiation on Albite’s Chemical Durability. J. Phys. Chem. A 2017, 121, 7835–7845. [Google Scholar] [CrossRef]
- Kohn, S.C.; Dupree, R.; Smith, M.E. A multinuclear magnetic resonance study of the structure of hydrous albite glasses. Geochim. Cosmochim. Acta 1989, 53, 2925–2935. [Google Scholar] [CrossRef]
- Arnold, T.; Zorn, T.; Bernhard, G.; Nitsche, H. Sorption of uranium(VI) onto phyllite. Chem. Geol. 1998, 151, 129–141. [Google Scholar] [CrossRef]
- Walter, M.; Arnold, T.; Geipel, G.; Scheinost, A.; Bernhard, G. An EXAFS and TRLFS investigation on uranium(VI) sorption to pristine and leached albite surfaces. J. Colloid Interface Sci. 2005, 282, 293–305. [Google Scholar] [CrossRef] [PubMed]
- Feng, D.; Provis, J.L.; Deventer, J.S.J.V. Adsorption of gold on albite in acidic chloride media. Hydrometallurgy 2013, 134, 32–39. [Google Scholar] [CrossRef]
- Kohler, M.; Leckie, J. Neptunium (V) Sorption on Quartz and Albite in Aqueous Suspension; Los Alamos National Lab.: Los Alamos, NM, USA, 1991. [Google Scholar]
- Daković, A.; Tomasevićcanović, M.; Dondur, V.; Rottinghaus, G.E.; Medaković, V.; Zarić, S. Adsorption of mycotoxins by organozeolites. Colloids Surf. B Biointerfaces 2005, 46, 20–25. [Google Scholar] [CrossRef] [PubMed]
- Smith, J.A.; Jaffe, P.R.; Chiou, C.T. Effect of ten quaternary ammonium cations on tetrachloromethane sorption to clay from water. Environ. Sci. Technol. 1990, 24, 1167–1172. [Google Scholar] [CrossRef]
- Wang, J.P.; Li, Q.F.; Dong, F.Q.; He, X.; Zhang, W.; Yang, L.J.; Zhang, W.J. Study on Effect Characteristics and Mechanism of Staphylococcus aureus on Albite. Adv. Mater. Res. 2015, 1092–1093, 635–640. [Google Scholar] [CrossRef]
- Yang, Y.; Min, Y.; Lococo, J.; Jun, Y.S. Effects of Al/Si ordering on feldspar dissolution: Part I. Crystallographic control on the stoichiometry of dissolution reaction. Geochim. Cosmochim. Acta 2014, 126, 574–594. [Google Scholar] [CrossRef]
- Boizot, B.; Petite, G.; Ghaleb, D.; Reynard, B.; Calas, G. Raman study of β-irradiated glasses. J. Non-Cryst. Solids 1999, 243, 268–272. [Google Scholar] [CrossRef]
- Chernyshova, I.V.; Vidyadhar, K.H.R.; Shchukarev, A.V. Mechanism of Adsorption of Long-Chain Alkylamines on Silicates: A Spectroscopic Study. 2. Albite. Langmuir 2001, 17, 775–785. [Google Scholar] [CrossRef]
- Thommes, M.; Kaneko, K.; Neimark, A.V.; Olivier, J.P.; Rodriguez-Reinoso, F.; Rouquerol, J.; Sing, K.S. Physisorption of gases, with special reference to the evaluation of surface area and pore size distribution (IUPAC Technical Report). Pure Appl. Chem. 2015, 87, 1051–1069. [Google Scholar] [CrossRef]
- Deng, L.; Zeng, H.; Shi, Z.; Zhang, W.; Luo, J. Sodium dodecyl sulfate intercalated and acrylamide anchored layered double hydroxides: A multifunctional adsorbent for highly efficient removal of Congo red. J. Colloid Interface Sci. 2018, 521, 172–182. [Google Scholar] [CrossRef] [PubMed]
- Park, Y.; Ayoko, G.A.; Frost, R.L. Characterisation of organoclays and adsorption of p-nitrophenol: Environmental application. J. Colloid Interface Sci. 2011, 360, 440–456. [Google Scholar] [CrossRef] [PubMed] [Green Version]
- He, H.; Zhou, Q.; Martens, W.N.; Kloprogge, T.J.; Yuan, P.; Xi, Y.; Zhu, J.; Frost, R.L. Microstructure of HDTMA+-modified montmorillonite and its influence on sorption characteristics. Clays Clay Miner. 2006, 54, 689–696. [Google Scholar] [CrossRef] [Green Version]
- Wang, G.; Lian, C.; Xi, Y.; Sun, Z.; Zheng, S. Evaluation of nonionic surfactant modified montmorillonite as mycotoxins adsorbent for aflatoxin B1 and zearalenone. J. Colloid Interface Sci. 2018, 518, 48–56. [Google Scholar] [CrossRef] [Green Version]
- Marković, M.; Daković, A.; Rottinghaus, G.E.; Petković, A.; Kragović, M.; Krajišnik, D.; Milić, J. Ochratoxin A and zearalenone adsorption by the natural zeolite treated with benzalkonium chloride. Colloids Surf. Physicochem. Eng. Asp. 2017, 529, 7–17. [Google Scholar] [CrossRef]
- Magdalane, C.M.; Kaviyarasu, K.; Vijaya, J.J.; Siddhardha, B.; Jeyaraj, B. Photocatalytic activity of binary metal oxide nanocomposites of CeO 2 /CdO nanospheres: Investigation of optical and antimicrobial activity. J. Photochem. Photobiol. B Biol. 2016, 163, 77–86. [Google Scholar] [CrossRef]
- Jiang, X.; Li, C.; Chi, Y.; Yan, J. TG-FTIR study on urea-formaldehyde resin residue during pyrolysis and combustion. J. Hazard. Mater. 2010, 173, 205–210. [Google Scholar] [CrossRef]
- Sun, Z.; Park, Y.; Zheng, S.; Ayoko, G.A.; Frost, R.L. Thermal stability and hot-stage Raman spectroscopic study of Ca-montmorillonite modified with different surfactants: A comparative study. Thermochim. Acta 2013, 569, 151–160. [Google Scholar] [CrossRef] [Green Version]
- Duan, Q.; Li, X.; Wu, Z.; Alsaedi, A.; Hayat, T.; Chen, C.; Li, J. Adsorption of 17β-estradiol from aqueous solutions by a novel hierarchically nitrogen-doped porous carbon. J. Colloid Interface Sci. 2019, 533, 700–708. [Google Scholar] [CrossRef]
- Zhang, F.; Zhang, H.; Chen, R.; Liu, Q.; Liu, J.; Wang, C.; Sun, Z.; Wang, J. Mussel-inspired antifouling magnetic activated carbon for uranium recovery from simulated seawater. J. Colloid Interface Sci. 2019, 534, 172–182. [Google Scholar] [CrossRef]
- Arancibia-Miranda, N.; Baltazar, S.E.; García, A.; Munoz-Lira, D.; Sepúlveda, P.; Rubio, M.A.; Altbir, D. Nanoscale zero valent supported by zeolite and montmorillonite: Template effect of the removal of lead ion from an aqueous solution. J. Hazard. Mater. 2016, 301, 371–380. [Google Scholar] [CrossRef] [PubMed]
- Gao, Y.; Kang, R.; Xia, J.; Yu, G.; Deng, S. Understanding the adsorption of sulfonamide antibiotics on MIL-53s: Metal dependence of breathing effect and adsorptive performance in aqueous solution. J. Colloid Interface Sci. 2019, 535, 159–168. [Google Scholar] [CrossRef] [PubMed]
- Zhou, Y.; Liu, X.; Tang, L.; Zhang, F.; Zeng, G.; Peng, X.; Luo, L.; Deng, Y.; Pang, Y.; Zhang, J. Insight into highly efficient co-removal of p-nitrophenol and lead by nitrogen-functionalized magnetic ordered mesoporous carbon: Performance and modelling. J. Hazard. Mater. 2017, 333, 80–87. [Google Scholar] [CrossRef] [PubMed]
- Fu, J.; Chen, Z.; Wang, M.; Liu, S.; Zhang, J.; Zhang, J.; Han, R.; Xu, Q. Adsorption of methylene blue by a high-efficiency adsorbent (polydopamine microspheres): Kinetics, isotherm, thermodynamics and mechanism analysis. Chem. Eng. J. 2015, 259, 53–61. [Google Scholar] [CrossRef]
- Sun, Z.; Yang, X.; Zhang, G.; Zheng, S.; Frost, R.L. A novel method for purification of low grade diatomite powders in centrifugal fields. Int. J. Miner. Process. 2013, 125, 18–26. [Google Scholar] [CrossRef] [Green Version]
- Cerri, G.; Langella, A.; Pansini, M.; Cappelletti, P. Methods of determining cation exchange capacities for clinoptilolite-rich rocks of the Logudoro region in northern Sardinia, Italy. Clays Clay Miner. 2002, 50, 127–135. [Google Scholar] [CrossRef]
- Clemens, E.; Stevens, C.; Southworth, M. Sites of organic acid production and pattern of digesta movement in the gastrointestinal tract of swine. J. Nutr. 1975, 105, 759–768. [Google Scholar] [CrossRef]


| Sample | C (w%) | H (w%) | N (w%) | GSL (CEC) |
|---|---|---|---|---|
| NA | - | - | - | 0.000 |
| OA | 5.94 | 1.26 | 0.34 | 0.998 |
| Sample | SBET a (m2/g) | Pore Volume b (cm3/g) | Pore Size c (nm) |
|---|---|---|---|
| NA | 9.80 | 0.02 | 7.92 |
| OA | 4.87 | 0.02 | 17.86 |
| Sample | Mass Loss (%) | |||
|---|---|---|---|---|
| 25–200 °C | 200–500 °C | 500–800 °C | ∑(25–800) °C | |
| NA | 0.97 | 1.57 | 2.43 | 4.97 |
| OA | 0.54 | 7.71 | 1.93 | 10.18 |
| Kinetic Model | Parameters | pH = 7 | pH = 3 | ||
|---|---|---|---|---|---|
| NA | OA | NA | OA | ||
| Pseudo-first order | qe (mg/g) | 0.220 | 1.945 | 0.209 | 1.954 |
| k1 (1/min) | 0.120 | 0.431 | 0.166 | 0.573 | |
| R2 | 0.997 | 0.994 | 0.997 | 0.993 | |
| Pseudo-second order | qe (mg/g) | 0.233 | 1.975 | 0.218 | 1.975 |
| k2 (g/mg/min) | 0.812 | 0.701 | 1.372 | 1.202 | |
| R2 | 0.974 | 0.998 | 0.974 | 0.997 | |
| pH | Langmuir Model | Freundlich Model | ||||
|---|---|---|---|---|---|---|
| qm (mg/g) | kL (L/mg) | R2 | kF (mg1 − 1/n L1/n/g) | 1/n | R2 | |
| pH 7 | 10.580 | 1.171 | 0.998 | 5.301 | 0.531 | 0.960 |
| pH 3 | 9.287 | 0.935 | 0.999 | 4.131 | 0.512 | 0.970 |
© 2019 by the authors. Licensee MDPI, Basel, Switzerland. This article is an open access article distributed under the terms and conditions of the Creative Commons Attribution (CC BY) license (http://creativecommons.org/licenses/by/4.0/).
Share and Cite
Zhang, W.; Zhang, S.; Wang, J.; Dong, J.; Cheng, B.; Xu, L.; Shan, A. A Novel Adsorbent Albite Modified with Cetylpyridinium Chloride for Efficient Removal of Zearalenone. Toxins 2019, 11, 674. https://0-doi-org.brum.beds.ac.uk/10.3390/toxins11110674
Zhang W, Zhang S, Wang J, Dong J, Cheng B, Xu L, Shan A. A Novel Adsorbent Albite Modified with Cetylpyridinium Chloride for Efficient Removal of Zearalenone. Toxins. 2019; 11(11):674. https://0-doi-org.brum.beds.ac.uk/10.3390/toxins11110674
Chicago/Turabian StyleZhang, Wei, Shihua Zhang, Jingjing Wang, Jiawen Dong, Baojing Cheng, Li Xu, and Anshan Shan. 2019. "A Novel Adsorbent Albite Modified with Cetylpyridinium Chloride for Efficient Removal of Zearalenone" Toxins 11, no. 11: 674. https://0-doi-org.brum.beds.ac.uk/10.3390/toxins11110674