Assessing the Effect of Mycotoxin Combinations: Which Mathematical Model Is (the Most) Appropriate?


1
Department of Biophysics, Faculty of Pharmacy and Biochemistry, University of Zagreb, A. Kovačića 1, Zagreb 10000, Croatia
2
Department of Microbiology, Faculty of Pharmacy and Biochemistry, University of Zagreb, Schrottova 39, Zagreb 10000, Croatia
*
Author to whom correspondence should be addressed.
Toxins 2020, 12(3), 153; https://0-doi-org.brum.beds.ac.uk/10.3390/toxins12030153
Submission received: 8 January 2020
/
Revised: 17 February 2020
/
Accepted: 26 February 2020
/
Published: 29 February 2020
(This article belongs to the Special Issue Toxicological Effects of Mycotoxins on Target Cells)
Abstract
:In the past decades, many studies have examined the nature of the interaction between mycotoxins in biological models classifying interaction effects as antagonisms, additive effects, or synergisms based on a comparison of the observed effect with the expected effect of combination. Among several described mathematical models, the arithmetic definition of additivity and factorial analysis of variance were the most commonly used in mycotoxicology. These models are incorrectly based on the assumption that mycotoxin dose-effect curves are linear. More appropriate mathematical models for assessing mycotoxin interactions include Bliss independence, Loewe’s additivity law, combination index, and isobologram analysis, Chou-Talalays median-effect approach, response surface, code for the identification of synergism numerically efficient (CISNE) and MixLow method. However, it seems that neither model is ideal. This review discusses the advantages and disadvantages of these mathematical models.
Keywords:
mycotoxin interaction; Loewe additivity; combination index; isobologram; Chou-Talalay method; MixLowKey Contribution: Comments on methods for assessing mycotoxin combination effect.
1. Introduction
Mycotoxins are secondary metabolites mainly produced by fungi belonging to the genera of Aspergillus, Penicillium, or Fusarium [1]. Although the role of mycotoxins is not yet fully understood, it has been shown that mycotoxins form an integral part of microbial interactions in ecological niches where they protect fungi from competing or invading microbes (e.g., by antimicrobial activity and/or quorum sensing disruption) [2,3]. Throughout history, these fungal toxic metabolites have been recognized as harmful contaminants in crops, causing acute toxic, carcinogenic, mutagenic, teratogenic, immunotoxic, and oestrogenic effects in humans and animals [1,4]. From the public health point of view, the most important foodborne mycotoxins are aflatoxins (AFs), fumonisins (FBs), trichothecenes (including deoxynivalenol (DON) and T-2 and HT-2 toxins), ochratoxin A (OTA), patulin (PAT) and zearalenone (ZEN) and maximum levels have been set in European Union legislation to control these mycotoxin levels in food and feed [4,5]. Analytical methods based on the liquid chromatography tandem mass spectrometry (LC-MS/MS) have been developed for the simultaneous detection of multiple mycotoxins in foods which facilitated and enabled survey of their co-occurrence in various food matrices [6,7]. This methodology enabled the simultaneous detection of more than one hundred fungal metabolites including major mycotoxins as well as masked (e.g., DON-3-glucoside and ZEN-14 sulfate), modified mycotoxins (e.g., 15-acetyl-DON) and so called emerging mycotoxins (enniatins-ENN, beauvericin-BEA, and fusaproliferin-FUS and moniliformin-MON) [8,9,10,11,12,13]. The latter is defined as “mycotoxins, which are neither routinely determined, nor legislatively regulated; however, the evidence of their incidence is rapidly increasing” [13]. Recently, for the first time ever, reports were published on the multi-occurrence on major mycotoxins and their derivates as well as modified mycotoxins (such as DON-3-glucoside) and emerging mycotoxins in animal feeds and maize from Egypt. This study emphasized significant levels of AFB1 in this African region, but also suggested that low concentrations of the other detected mycotoxins should also be considered due to their unknown interactions [6]. As mycotoxins often co-occur in food and feed there is a possibility that, due to interactions between one or more mycotoxins, they can act harmfully, even if they are present at or below permitted concentrations (regulated mycotoxins) or are continuously present in low or high levels depending on the region (unregulated/emerging mycotoxins) [10,11,12]. Assunção et al. [5] underlined the priority of testing the most relevant mycotoxins mixtures taking into account human exposure assessments and the use of adequate mathematical approaches to evaluate interactions in experimental models. Kademi et al. [14] developed a mathematical model using a system of ordinary differential equations to describe the dynamics of AFs from plants (feeds) to animals, plants (plant foods) to humans, and animals to humans (carry-over effects) which showed that the entire dynamics depends on the numerical values of the threshold quantity defined as R01 and R02 (e.g., if R01 < 1 and R02 < 1 then AF concentrations in animals and plants will not reach toxic limit and vice versa). This kind of mathematical modeling can be useful in controlling AFs and other mycotoxin toxicity limits by employing various control measures like biological control and/or decontamination technologies. In addition, mathematical modeling has been applied to predict fungal germination, growth, mycotoxin production, inactivation and also to study the response to environmental factors which can be useful in the prediction of mycotoxin food contamination [15,16]. Taken together, mathematical modeling could be very helpful in the prediction and estimation of mycotoxin impact on human and animal health as well as in controlling contamination below acceptable limits.
In vitro studies of mycotoxin interactions reflect mycotoxin occurrence and co-occurrence in food/feed. Among Aspergillus- and/or Penicillium-derived mycotoxins, AFB1, OTA, citrinin (CIT), PAT and penicillic acid (PA) have been the most studied, while the most studied mycotoxins produced by Fusarium species were ZEN, FBs, nivalenol (NIV), T-2, DON and its derivates. Since in the last decade attention toward unregulated/emerging mycotoxins increased, interactions of these mycotoxins as well as their interactions with major mycotoxins have also been extensively studied [17,18]. The effects of binary, tertiary and multiple mixtures of these mycotoxins in vitro have been studied on cell models originating from the digestive system, i.e., intestinal Caco-2 cells and hepatic HepG2 cells, or kidney cells like i.e., monkey kidney Vero cells, porcine PK15, human kidney HK2, and occasionally immune system-derived cells like THP-1 macrophages [18,19,20,21]. A number of studies examined the nature of interaction between mycotoxins both in vivo and in vitro classifying interaction effects into three types: antagonistic effect, additive effect, and synergistic effect [18,19]. The definition of each interaction effect is based on a comparison of observed effects with the expected effects of combination. If the observed effect is greater than expected, it is defined as a synergism, and if the opposite is true, i.e., if the observed effect is lesser than expected, it is defined as an antagonism. The third case, when the expected value is equal to the observed one is called an additive effect [22,23]. These simple definitions leave one problem though: estimations of expected effects for combinations of two non-interacting mycotoxins. Among the several available mathematical models that may be used to describe mycotoxin interactions, the arithmetic definition of additivity was the most commonly used one [24]. Other models included a factorial analysis of variance [25], Bliss independence criterion [26], Loewe’s additivity law [27], response surface [28], combination index and isobologram analysis [29], Chou-Talalay’s median effect approach [30], and the MixLow method [31]. These models will be discussed later on in this review. Additionally, the highest single agent model [32] and CISNE (code for the identification of synergism numerically efficient) [33], that have not been used so far in mycotoxicology, will also be discussed.
The most comprehensive review on mycotoxin interactions in cell cultures of human and animal origin was given by Alassane-Kpembi et al. [18]; the majority of conducted studies used the arithmetic definition of additivity. In the studies conducted in the last four years (Table 1 and Table 2) the interactions between mycotoxins in vitro were evaluated using more appropriate mathematical models than the arithmetic definition of additivity.
2. Mathematical Models for Assessing Mycotoxin Interactions
In this paper, E will serve as an abbreviation for “effect” in equations. It is also assumed that effect is relative to maximal effect, i.e., percentage of cell viability suppression, where suppression is equal to difference between negative control (100% viability) and treated cells (100%-effect viability).
2.1. Simple Addition of Effects
The simplest method for estimating interactions between mycotoxins is the assumption of effect additivity known as arithmetic definition of additivity or response additivity (Equation (1)):
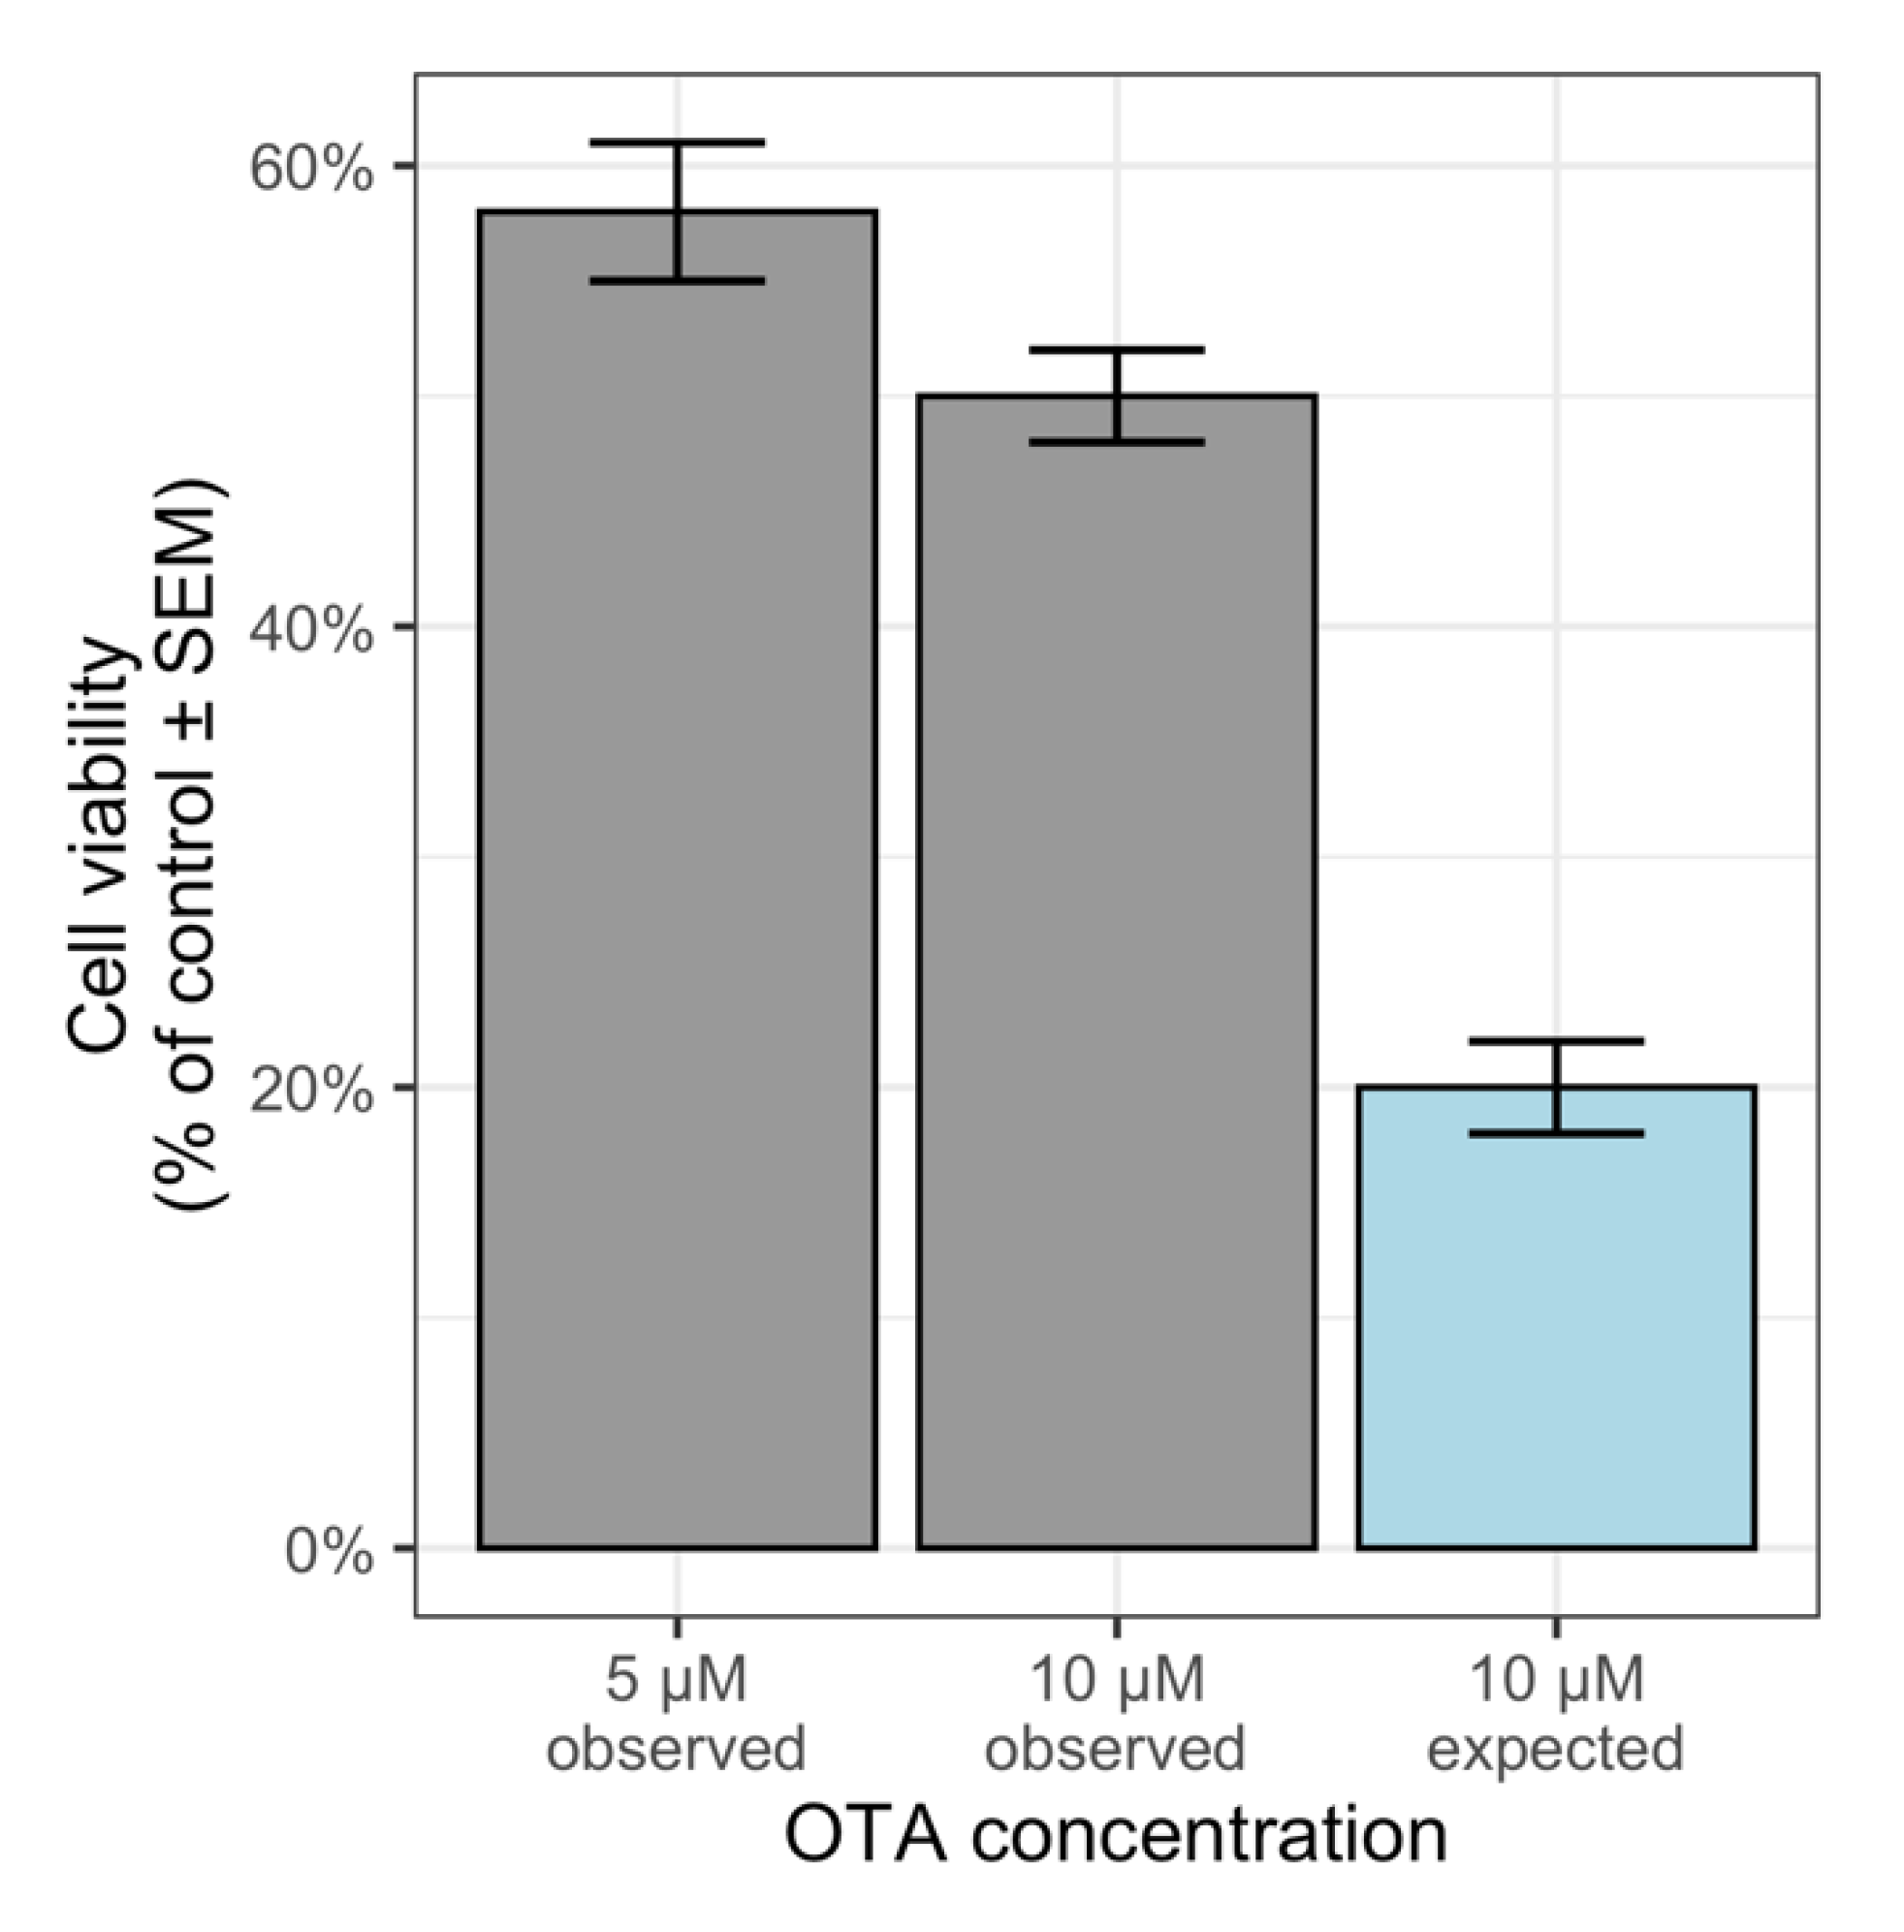
where Eexp is the expected effect of combination of mycotoxin M1 in dose D1 and mycotoxin M2 in dose D2, while EM1 and EM2 are the effects of single tested mycotoxins M1 and M2 in doses D1 and D2, respectively. That simple addition of effect was applied by Šegvić Klarić et al. [34] for assessing the combination effect of beauvericin (BEA) and OTA using Equation (1) and observed synergistic effect for two combinations. Mathematically, this approach would be incorrect most of the time because the dose-effect curve is not linear. Using the data on cytotoxicity of OTA alone of the mentioned paper, it is easy to see that using this method we can prove that OTA applied in combination with itself at concentrations of 5 µM and 5 µM revealed an antagonistic effect; the expected cell viability would be around 20%, while the observed value for cell viability after treatment with 10 µM ochratoxin A was around 50% (Figure 1). Interestingly, despite an inaccurate estimation of expected effects, this model was widely applied; Alassane-Kpembi et al. [18] in their review cited 52 studies out of 83 that used this method.
Eexp = EM1 + EM2
Some studies presented in Table 1 [35,36] used simple addition of effects according to Weber et al. [24] who modified Equation (1) by subtracting the 100% (or 1) from the sum of the mean effects. Needless to say, the unexplained subtraction of 100% did not account for the non-linearity of the dose response curves.
2.2. Factorial Analysis of Variance
This model uses simple 2-way ANOVA for modelling the detection of interactions between two mycotoxins (Equation (2)):
where E is the estimated effect, β0 is the part of the effect achieved by negative control, β1/β2 is the coefficient that increases effect for each increase in one unit of dose D1/D2 of mycotoxin M1/M2 and β3 is the interaction term.
E = β0 + β1 × D1 + β2 × D2 + β3 × D1 × D2
Eight studies that have used this approach to define mycotoxin interactions were reviewed in detail by Alassane-Kpembi et al. [18]. If the interaction term was significantly (in a statistical manner) different than zero, it was concluded that an interaction between mycotoxins occurred. The main problem with this method is that ANOVA can be very misleading, similarly to the simple addition of effects method because ANOVA is based on linear modelling which is not useful for modelling nonlinear dose-effect curves [25]. This method was recently applied in only one study for testing the dual combination effects of ZEN and OTA or α-ZEL in HepG2 cells [37], as summarized in Table 1.
2.3. Bliss Independence Criterion
Bliss introduced this model in 1939 for predicting the proportion of animals that will die after combining two toxins under the assumption that there is no interaction between the toxins (i.e., they have completely different mechanisms of action or act in different compartments):
where Eexp is the expected effect of a combination of mycotoxin M1 in dose D1 and mycotoxin M2 in dose D2, while EM1 and EM2 are the effects of single tested mycotoxins M1 and M2 in doses D1 and D2, respectively [26], all effects need to be expressed as proportions ranging from 0 to 1 (Equation (3)).
Eexp = 1 − (1 − EM1) × (1 − EM2) = EM1 + EM2 − EM1 × EM2
Similarly to the simple addition of effects, Bliss can result in a detection of an interaction of some mycotoxin with itself but that is not possible in model validation since this would a priori violate the assumption of two toxins acting independently.
Several of the recent studies listed in Table 1 simultaneously used different mathematical models, e.g., response additivity and Bliss independence criterion [38,39] or Bliss independence and Loewe additivity [40] or Chou-Talalay method [39,41]. As expected, these studies obtained different conclusions on mycotoxin interactions depending on the mathematical models that have been applied. For example, Smit et al. [39] obtained a synergism of DON + ZEN at low and medium concentrations by both response additivity and Bliss independence model; while at high concentrations in combinations, an additive effect was obtained with Bliss independence model and antagonism by response additivity.
2.4. Loewe’s Additivity Law
Loewe’s additivity law (also called isobolografic method, concentration additivity or dose additivity) assumes that mycotoxins act within the same compartment on the same biological size by the same mechanism. The only difference is in their potency. This model is based on the dose equivalence principle and the sham combination principle; in short, every dose D1 of mycotoxin M1 gives an equal effect as D 2(1) of mycotoxin M2, and vice versa, and any D2(1) can be added to any other dose of D2 to show the additive effect [27] as presented by Equation (4):
where E is the effect, D1 is the dose of mycotoxin M1, D2 is the dose of mycotoxin M2, D1(2) dose of mycotoxin M1 that provokes same effect as D2 dose of mycotoxin M2, D2(1) dose of mycotoxin M2 that provokes same effect as D1 of mycotoxin M1. For additive effects, the following Equation (5) is valid:
where D1 and D2 are the doses of mycotoxins M1 and M2 applied in combination, and DE1 and DE2 are the dose of mycotoxin M1 and M2 applied alone. All doses (D1+D2, DE1 or DE2) result with the same effect E.
E (D1 + D2) = E (D1 + D1(2)) = E (D2(1) +D2)
D1/DE1 + D2/DE2 = 1,
Additionally, Loewe’s additivity law makes a larger number of assumptions; each mycotoxin in a mixture must have an equal maximum effect and all log(dose)-effect curves must be parallel and have constant relative potency [42,43], according to Equation (6):
(R = DE1/DE2)
Finding two mycotoxins in a combination that fulfils all of these assumptions seems somewhat impossible. For example, apart from the Bliss independence criterion, Li et al. [44] also used this method (as a concentration addition model) to assess the nature of interaction between OTA and ZEN. Since their dose-effect curves did not meet all of the assumptions, it is easy to see that Equation (4), on which Loewe’s additivity law is based, does not hold true when we assign the values EC10 (OTA) = 0.8 μM and EC10 (ZEN) = 11.84 μM [44], and try to apply the main principles of dose equivalence and sham combination of this model (Equations (7) and (8)):
E (EC10 OTA + EC 10 ZEN) = E (EC10 OTA + EC10 OTA) = E (EC10 ZEN + EC10 ZEN)
E (2 × 0.8 μM of OTA) = E (2 × 11.84 μM of ZEN)
This does not seem to be correct according to the dose-response curves for OTA (E (1.60 μM of OTA) ≈ 30%) and ZEN (E (23.68 μM of ZEN) ≈ 50%) presented in aforementioned article [44], which raises the question: can the observed synergies be trusted at all?
Even though this model is mathematically valid, due to the excessive number of assumptions that need to be fulfilled, this model probably remains inapplicable for assessing combinations of mycotoxins [43].
2.5. Response Surface
Some authors expanded the Loewe’s additivity law and Bliss independence criterion to the whole surface defined by all predicted additive concentration combinations (in all ratios, for all effects) [45,46] as presented in Table 1. In mycotoxicology, Assunção et al. [46] implemented model generalization built by Jonker et al. [28]. They estimated the deviation from Loewe’s additivity law by Equation (9):
where G is the deviation function defined separately for 4 models. If G = 0, then Equation (9) collapses to Equation (5), suggesting an additive effect. To test for synergism or antagonism G is substituted with (Equation (10)):
where parameter a is less than zero for synergisms and greater than zero for antagonisms, z1 and z2 are relative contribution to toxicity, i.e., for z1 as presented by Equation (11):
D1/DE1 + D2/DE2 = eG
G (z1, z2) = a × z1 × z2
z1 = D1/DE1 / (D1/DE1 + D2/DE2)
Jonker et al. [28] also define more complicated interaction patterns between two toxins and with the inclusion of parameters b1 for detection of dose ratio-dependent deviation (Equation (12)), and parameters bDL for the detection of dose level-dependent deviations (Equation (13)) from a non-interacting additive model:
G (z1, z2) = (a + b1 × z1) × z1 × z2
G (z1, z2) = a × (1 − bDL × (D1/DM1 + D2/DM2)) × z1 × z2
The procedure by Jonker et al. [28] suggests fitting all four models (defined by four deviation functions) and then choosing the best one to make conclusions about the nature of the interaction at different dose ratios or dose levels based on parameters a, b1, and bDL according to Table 1 of Jonker et al. [28].
This method provides more information than the other methods mentioned in this article, but it comes with a greater cost of the experiment since a checkerboard experimental design is needed, with dense concentration ranges in all combinations.
2.6. Highest Single Agent (HSA) Model
This model is also referred to as the Gaddums non-interaction [32], it defines the expected effect as the maximum of single mycotoxin effects (Equation (14)):
where Eexp is the expected effect of a combination of mycotoxin M1 in dose D1 and mycotoxin M2 in dose D2, while EM1 and EM2 are the effects of single tested mycotoxins M1 and M2 in doses D1 and D2, respectively.
Eexp = max (EM1, EM2)
Because of underestimations of the expected combination effect, this model is not appropriate for detection of synergistic effects, except in cases: (i) where one compound is completely inactive at any concentration for the measured effect (which is rare in the field of mycotoxins); (ii) where a mycotoxin with maximal effect does not reach full effect (i.e., never suppresses viability to 0%). On the other hand, this method is useful for detecting antagonistic effects since observing a combination effect less than the maximal effect of a mycotoxin alone clearly demonstrates an interaction of antagonistic nature. However, underestimations of the expected combination effect can hide milder antagonistic effects. The great advantage of this model is the financial cost of the experiment: to prove an antagonistic effect, it is sufficient to test three concentrations, each mycotoxin alone and a combination of the mycotoxins. Another advantage is that this method is also independent of the mechanism of action, and it does not make any assumptions on the dose-effect curve. However, this simple approach has never been applied in mycotoxicology.
2.7. Combination Index and Isobologram Analysis
Applying Loewe’s additivity law or similar methods can allow researchers to use the Interaction/combination index which is based on Equation (5) for describing the nature of the combination effect (Equation (15)):
where CI is the interaction/combination index: CI < 1 indicates synergism, CI = 1 indicates an additive effect and CI > 1 indicates an antagonism [29]. Isobologram analysis is just a “fancy” name for the graphical representation of the combination index for the same effect in different ratios of two mycotoxins. It is a simple plot with the dose/concentration of mycotoxin 1 on the x axis and the dose/concentration of mycotoxin 2 on the y axis. The characteristic line, isobole, connects the y intercept and x intercept which represents the doses needed for achieving a defined effect (i.e., 50%) for single acting mycotoxins. Plotting the dot with coordinates of doses in combination that achieve the same defined effect gives us a clue about the nature of the combination effect. All of the dots below the isobole indicate synergy, the dots above the isobole indicate antagonism, while the dots on the isobole indicate a possible additive effect [49]. The combination index and isobologram method were applied in 15 studies reviewed in Alassane-Kpembi et al. [18] and was the second most used method for assessing mycotoxin interactions and much more appropriate than the arithmetic definition of additivity or factorial design.
CI = D1/DE1 + D2/DE2,
The problems of not meeting the assumptions of Loewe’s additivity law affect the combination index and isobologram. For example, if the two dose-response curves are not parallel, instead of one linear isobole, there will be two curvilinear isoboles around the former, linear one. The area between the two new curvilinear isoboles is not an area of synergy, nor is it an area of antagonism [43]. A recent study by Anastasiadi et al. [50] generalized the Loewe’s model accounting for nonparallel dose-response curves. As a result, Equation (15) was expanded to Equation (16):
where m1 and m2 are the slopes of the dose-response curves for mycotoxin 1 and mycotoxin 2.
CI = (D1/DE1)m1/m2 + D2/DE2, m1 < m2
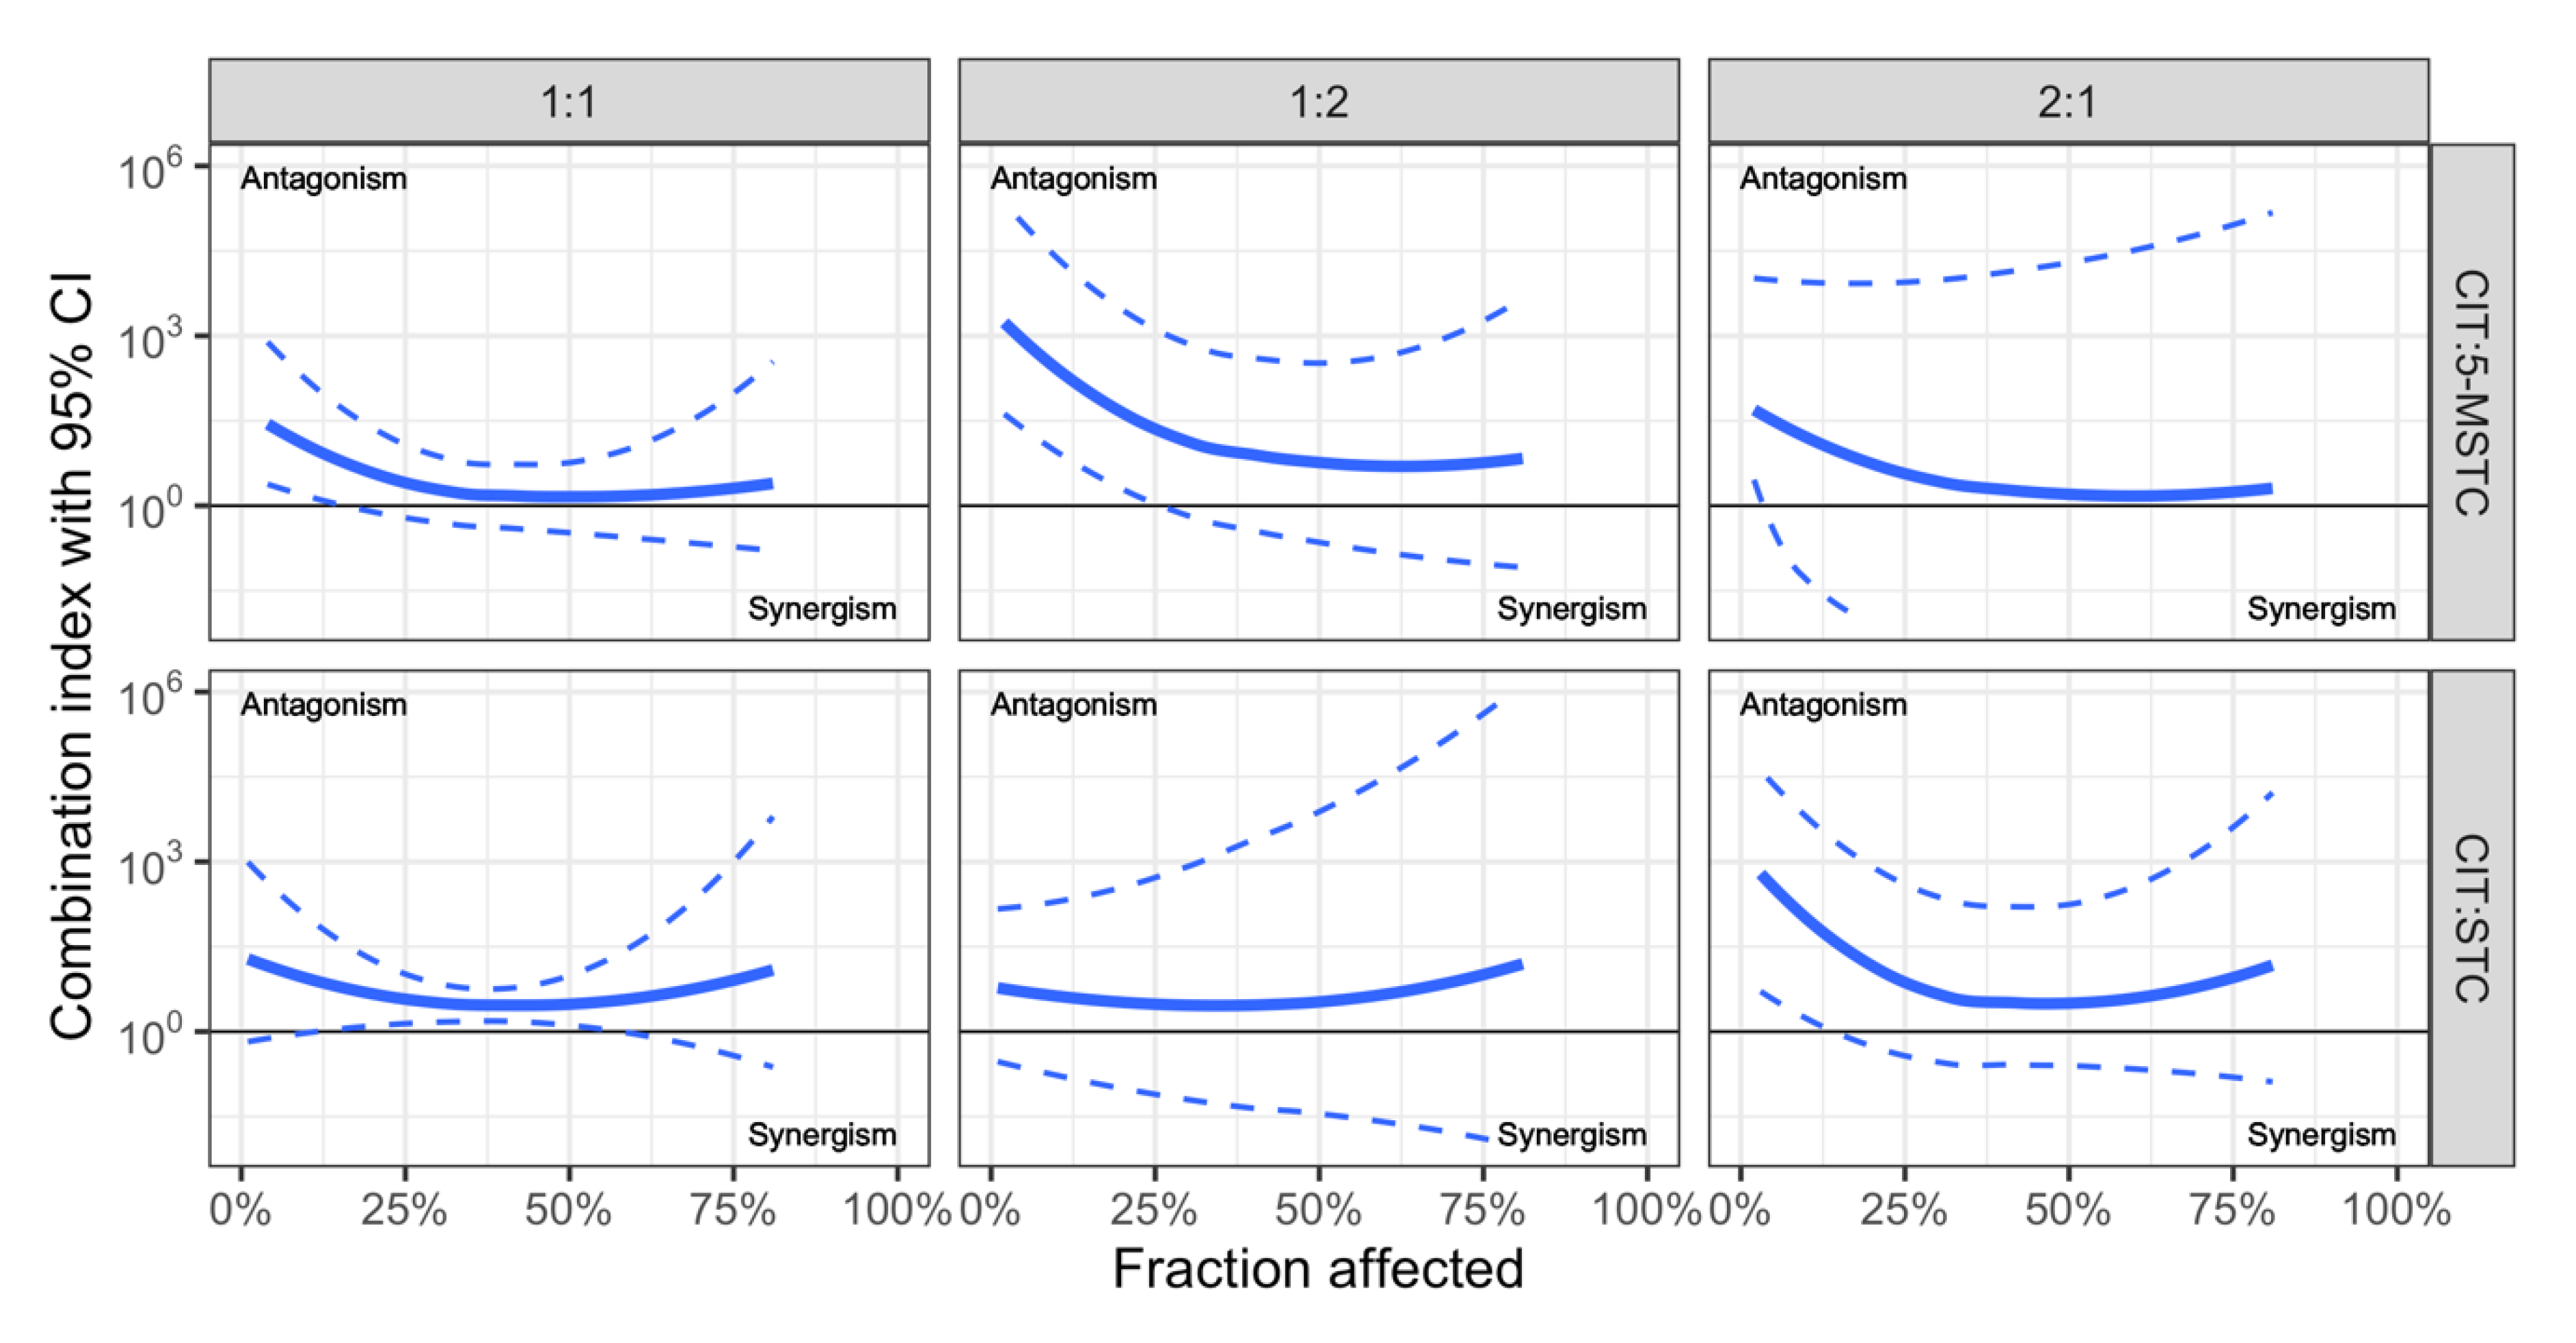
Recently we tested the cytotoxicity (MTT test, 24 h) of single CIT, STC and 5-M-STC and dual combinations of CIT with STC and 5-M-STC in A549 cells (Table 2). The cytotoxicity of the mycotoxins was as follows: 5-M-STC (IC50 = 5.5 µM) > STC (IC50 = 60 µM) > CIT (IC50 =128 µM). Mycotoxin interactions of 1:1, 1:2 and 2:1 of IC50 concentration ratios were tested by applying a concentration addition model with correction for unparalleled dose-response curves as developed by Anastasiadi et al. [50], as presented in Figure 2.
2.8. Chou and Talalay’s Median Effect Approach
Chou and Talalay developed a unified general theory for the Michaelis-Menten, Hill, Henderson-Hasselbalch, and Scatchard equations, mathematically presented by Equation (17):
where E is the effect (between 0 and 1), D is the dose, DM is the median effective dose (i.e., EC50) and m is a parameter for shape definition (if m < 1 dose-effect curve is hyperbolic, and if m ≥ 1 dose-effect curve is sigmoidal) [30]. Using Equation (17), it is possible to estimate the doses needed to achieve a particular effect which can be used in Equation (15) for the estimation of CI, which is then used for assessing the nature of the combination effect. Similarly to Loewe’s additivity model, the isobologram can be constructed. The Chou-Talalay model combined with an isobologram has been applied in the majority of the recently published studies [39,51,52,53,54,55,56,57,58,59,60,61,62,63,64,65] listed in Table 2. Its great advantage is the recent development of a method for the estimation of confidence intervals for the combination index which enables the application of statistics [66]. This method can easily be implemented using the web-based CalcuSyn software which automatically calculates dose-effect curves and combination indices.
E = 1/1 + (DM/D)m
2.9. MixLow Method
Compared to the Chou-Talalay method, the MixLow method (Table 2) used by Lin et al. [67] improves model fitting and removes bias by fitting the log-logistic curve without prior linearization, similarly to the CISNE method (discussed in Section 2.10). However, another improvement of the MixLow method is the inclusion of random effects in a model that can account for different batches (trays) in the experiment and fit the model for both toxins and combination simultaneously [31]. Mixed modelling enables a more precise estimation of the combination index’s (CI, here called Loewe’s index) and more reliable confidence intervals or standard errors by accounting for both the error of single applied mycotoxins and combinations.
The MixLow method comes with the mixlow R package, which also includes functions for straigthforward data import and minimal data preprocessing, especially if the pattern suggested on the tray is followed during experimental design [68].
2.10. CISNE (Code for the Identification of Synergism Numerically Efficient)
Even though Chou-Talalay’s method exceeded two and a half thousand citations in relevant article databases, it does possess some technical problems in model fitting leading to bias inclusion in parameter estimation. By Chou-Talalay’s protocol Equation (17) is rearranged and transformed to linear form (Equation (18)):
where y is log[E/(1 − E)], the intercept is -m × log(DM), the slope is m, and x is the log(D) of the linear equation form. Estimating slope and intercept by least squares fit, and calculating Dm as presented by Equation (19):
log[E/(1 − E)] = m × log(D) − m × log(DM),
DM = e−intercept/slope
This leads to bias, along with the exclusion of data points with effects smaller than 0% or larger than 100% (i.e., stimulation) which could not be used in the logarithm on the left side of Equation (18). García-Fuente et al. [33] showed that these biases can lead to significant false positive or false negative errors, depending on the slope of the dose-response curve. They also found that fitting the same equation as a non-linear regression model estimates model parameters better and reduces the rate of false positives or negatives, especially when the slope (m) deviates from 1. This non-linear regression can be easily applied using the free CISNE software [69]. In contrast, it has not yet been applied in mycotoxicology combination testing.
2.11. Other methods
Most of the recent studies used mathematical modelling according to Bliss or/and Loewe (or some modified Loewe’s method) for assessing the nature of the effect of combination of mycotoxins. However several in vitro studies assed mycotoxin combined effects comparing the effect of combination to the effect of single mycotoxin [70,71,72] or only to negative controls [73,74,75,76] without estimating the theoretical (expected) effect of the combination (Table 3). Conclusions based on those studies are unreliable because the question of the nature of interaction of combination has not even been asked in a scientific manner to get a clear and exact answer. For example, Smith et al. [75] did not define the nature DON + ZEN interaction in HepRG cells; since the cytotoxic effect of a single DON was similar to the effect of DON + ZEN, it was concluded that a combined effect could not be classified as antagonistic nor synergistic. Any conclusion about an antagonistic or synergistic effect should include the effect of ZEN too, since it is a part of the mycotoxin combination.
3. Conclusions
Some of the methods found in studies assessing the effects of mycotoxins combination have been incorrectly based on the assumption that mycotoxin dose-effect curves are linear (simple addition of effects, factorial analysis of variance). For that reason, many conclusions have been derived incorrectly in published articles or review articles based on published data. There are many articles reviewing methods and discussing the problem of the misuse of some method, but it seems that the problem persists. The only appropriate approach to assess the nature of an interaction is to correctly estimate the dose-effect curves of each mycotoxin and combination and apply a well-defined model (based on Bliss or Loewe’s theory) with respecting the model’s assumptions and fitting the model by a direct estimation of all model parameters from a nonlinear least squares fitting. Results should be presented in a simple and clearly defined way (i.e., isobologram or combination index) with some of the most expected (mean) values accompanied by uncertainty bounds, where a 95% confidence interval should have priority over the standard error due to asymmetrical distributions.
Improvements to the presented methods are continuously being made but are not readily applied in the field of mycotoxicology.
Author Contributions
Conceptualization, D.K. and M.Š.K.; methodology, D.K.; investigation, D.K., D.J. and M.Š.K.; writing—original draft preparation, D.K., D.J. and M.Š.K. All authors have read and agreed to the published version of the manuscript.
Funding
This research was funded by Croatian Science Foundation, grant number IP-09-2014-5982.
Acknowledgments
The authors want to thank Makso Herman, MA for English language editing.
Conflicts of Interest
The authors declare no conflict of interest.
References
- Pitt, J.I.; David Miller, J. A Concise History of Mycotoxin Research. J. Agric. Food Chem. 2017, 65, 7021–7033. [Google Scholar] [CrossRef] [PubMed]
- Venkatesh, N.; Keller, N.P. Mycotoxins in conversation with bacteria and fungi. Front. Microbiol. 2019, 10, 403. [Google Scholar] [CrossRef]
- Fox, E.M.; Howlett, B.J. Secondary metabolism: Regulation and role in fungal biology. Curr. Opin. Microbiol. 2008, 11, 481–487. [Google Scholar] [CrossRef]
- Van Egmond, H.P.; Schothorst, R.C.; Jonker, M.A. Regulations relating to mycotoxins in food. Anal. Bioanal. Chem. 2007, 389, 147–157. [Google Scholar] [CrossRef] [PubMed] [Green Version]
- Assunção, R.; Silva, M.J.; Alvito, P. Challenges in risk assessment of multiple mycotoxins in food. World Mycotoxin J. 2016, 9, 791–811. [Google Scholar] [CrossRef] [Green Version]
- Abdallah, M.F.; Girgin, G.; Baydar, T.; Krska, R.; Sulyok, M. Occurrence of multiple mycotoxins and other fungal metabolites in animal feed and maize samples from Egypt using LC-MS/MS. J. Sci. Food Agric. 2017, 97, 4419–4428. [Google Scholar] [CrossRef] [PubMed]
- Malachová, A.; Sulyok, M.; Beltrán, E.; Berthiller, F.; Krska, R. Optimization and validation of a quantitative liquid chromatography-tandem mass spectrometric method covering 295 bacterial and fungal metabolites including all regulated mycotoxins in four model food matrices. J. Chromatogr. A 2014, 1362, 145–156. [Google Scholar] [CrossRef] [Green Version]
- Gruber-Dorninger, C.; Novak, B.; Nagl, V.; Berthiller, F. Emerging Mycotoxins: Beyond Traditionally Determined Food Contaminants. J. Agric. Food Chem. 2017, 65, 7052–7070. [Google Scholar] [CrossRef]
- Kovač, M.; Šubarić, D.; Bulaić, M.; Kovač, T.; Šarkanj, B. Yesterday masked, today modified; what do mycotoxins bring next? Arh. Hig. Rada Toksikol. 2018, 69, 196–214. [Google Scholar] [CrossRef] [Green Version]
- Ibáñez-Vea, M.; González-Peñas, E.; Lizarraga, E.; López de Cerain, A. Co-occurrence of aflatoxins, ochratoxin A and zearalenone in barley from a northern region of Spain. Food Chem. 2012, 132, 35–42. [Google Scholar] [CrossRef]
- Santini, A.; Meca, G.; Uhlig, S.; Ritieni, A. Fusaproliferin, beauvericin and enniatins: Occurrence in food-A review. World Mycotoxin J. 2012, 5, 71–81. [Google Scholar] [CrossRef]
- Streit, E.; Schatzmayr, G.; Tassis, P.; Tzika, E.; Marin, D.; Taranu, I.; Tabuc, C.; Nicolau, A.; Aprodu, I.; Puel, O.; et al. Current situation of mycotoxin contamination and co-occurrence in animal feed focus on Europe. Toxins 2012, 4, 788–809. [Google Scholar] [CrossRef] [PubMed] [Green Version]
- Vaclavikova, M.; Malachova, A.; Veprikova, Z.; Dzuman, Z.; Zachariasova, M.; Hajslova, J. “Emerging” mycotoxins in cereals processing chains: Changes of enniatins during beer and bread making. Food Chem. 2013, 136, 750–757. [Google Scholar] [CrossRef]
- Kademi, H.I.; Baba, I.A.; Saad, F.T. Modelling the dynamics of toxicity associated with aflatoxins in foods and feeds. Toxicol. Rep. 2017, 4, 358–363. [Google Scholar] [CrossRef] [PubMed]
- Garcia, D.; Ramos, A.J.; Sanchis, V.; Marín, S. Predicting mycotoxins in foods: A review. Food Microbiol. 2009, 26, 757–769. [Google Scholar] [CrossRef] [PubMed]
- Lee, S.; Yoon, Y.; Kim, D.M.; Kim, D.S.; Park, K.H.; Chun, H.S. Mathematical models to predict kinetic behavior and aflatoxin production of Aspergillus flavus under various temperature and water activity conditions. Food Sci. Biotechnol. 2014, 23, 975–982. [Google Scholar] [CrossRef]
- Smith, M.C.; Madec, S.; Coton, E.; Hymery, N. Natural Co-occurrence of mycotoxins in foods and feeds and their in vitro combined toxicological effects. Toxins 2016, 8, 94. [Google Scholar] [CrossRef]
- Alassane-Kpembi, I.; Schatzmayr, G.; Taranu, I.; Marin, D.; Puel, O.; Oswald, I.P. Mycotoxins co-contamination: Methodological aspects and biological relevance of combined toxicity studies. Crit. Rev. Food Sci. Nutr. 2017, 57, 3489–3507. [Google Scholar] [CrossRef]
- Grenier, B.; Oswald, I. Mycotoxin co-contamination of food and feed: Meta-analysis of publications describing toxicological interactions. World Mycotoxin J. 2011, 4, 285–313. [Google Scholar] [CrossRef]
- Šegvić Klarić, M. Adverse effects of combined mycotoxins. Arh. Hig. Rada Toksikol. 2012, 63, 519–530. [Google Scholar] [CrossRef] [Green Version]
- Šegvić Klarić, M.; Rašić, D.; Peraica, M. Deleterious effects of mycotoxin combinations involving ochratoxin A. Toxins 2013, 5, 1965–1987. [Google Scholar]
- Tekin, E.; Beppler, C.; White, C.; Mao, Z.; Savage, V.M.; Yeh, P.J. Enhanced identification of synergistic and antagonistic emergent interactions among three or more drugs. J. R. Soc. Interface 2016, 13, 18–20. [Google Scholar] [CrossRef] [PubMed]
- Foucquier, J.; Guedj, M. Analysis of drug combinations: Current methodological landscape. Pharmacol. Res. Perspect. 2015, 3. [Google Scholar] [CrossRef] [PubMed]
- Weber, F.; Freudinger, R.; Schwerdt, G.; Gekle, M. A rapid screening method to test apoptotic synergisms of ochratoxin A with other nephrotoxic substances. Toxicol. Vitr. 2005, 19, 135–143. [Google Scholar] [CrossRef] [PubMed]
- Caudle, R.M.; Williams, G.M. The misuse of analysis of variance to detect synergy in combination drug studies. Pain 1993, 55, 313–317. [Google Scholar] [CrossRef]
- Bliss, C.I. The toxicity of poisons applied jointly. Ann. Appl. Biol. 1939, 26, 585–615. [Google Scholar] [CrossRef]
- Loewe, S.; Muischnek, H. Über Kombinationswirkungen. Arch. Für Exp. Pathol. Und Pharmakologie 1926, 114, 313–326. [Google Scholar] [CrossRef]
- Jonker, M.J.; Svendsen, C.; Bedaux, J.J.M.; Bongers, M.; Kammenga, J.E. Significance testing of synergistic/antagonistic, dose level–dependent, or dose ratio–dependent effects in mixture dose–response analysis. Environ. Toxicol. Chem. 2005, 24, 2701. [Google Scholar] [CrossRef] [Green Version]
- Berenbaum, M.C. Criteria for analyzing interactions between biologically active agents. Adv. Cancer Res. 1981, 35, 269–335. [Google Scholar]
- Chou, T.-C. Theoretical basis, experimental design, and computerized simulation of synergism and antagonism in drug combination studies. Pharmacol. Rev. 2006, 58, 621–681. [Google Scholar] [CrossRef]
- Boik, J.C.; Newman, R.A.; Boik, R.J. Quantifying synergism/antagonism using nonlinear mixed-effects modeling: A simulation study. Stat. Med. 2008, 27, 1040–1061. [Google Scholar] [CrossRef] [PubMed]
- Berenbaum, M.C. What is synergy? Pharmacol. Rev. 1989, 41, 93–141. [Google Scholar]
- García-Fuente, A.; Vázquez, F.; Viéitez, J.M.; García Alonso, F.J.; Martín, J.I.; Ferrer, J. CISNE: An accurate description of dose-effect and synergism in combination therapies. Sci. Rep. 2018, 8, 1–9. [Google Scholar] [CrossRef] [PubMed]
- Šegvić Klarić, M.; Daraboš, D.; Rozgaj, R.; Kašuba, V.; Pepeljnjak, S. Beauvericin and ochratoxin A genotoxicity evaluated using the alkaline comet assay: Single and combined genotoxic action. Arch. Toxicol. 2010, 84, 641–650. [Google Scholar] [CrossRef]
- Huang, X.; Gao, Y.; Li, S.; Wu, C.; Wang, J.; Zheng, N. Modulation of Mucin (MUC2, MUC5AC AND MUC5B) mRNA expression and protein production and secretion in Caco-2/HT29-MTX co-cultures following exposure to individual and combined aflatoxin M1 and ochratoxin A. Toxins 2019, 11, 132. [Google Scholar] [CrossRef] [PubMed] [Green Version]
- Du, M.; Liu, Y.; Zhang, G. Interaction of aflatoxin B1 and fumonisin B1 in HepG2 cell apoptosis. Food Biosci. 2017, 20, 131–140. [Google Scholar] [CrossRef]
- Zheng, N.; Gao, Y.N.; Liu, J.; Wang, H.W.; Wang, J.Q. Individual and combined cytotoxicity assessment of zearalenone with ochratoxin A or α-zearalenol by full factorial design. Food Sci. Biotechnol. 2018, 27, 251–259. [Google Scholar] [CrossRef]
- Smith, M.-C.; Gheux, A.; Coton, M.; Madec, S.; Hymery, N.; Coton, E. In vitro co-culture models to evaluate acute cytotoxicity of individual and combined mycotoxin exposures on Caco-2, THP-1 and HepaRG human cell lines. Chem. Biol. Interact. 2018, 281, 51–59. [Google Scholar] [CrossRef]
- Smith, M.C.; Hymery, N.; Troadec, S.; Pawtowski, A.; Coton, E.; Madec, S. Hepatotoxicity of fusariotoxins, alone and in combination, towards the HepaRG human hepatocyte cell line. Food Chem. Toxicol. 2017, 109, 439–451. [Google Scholar] [CrossRef]
- Li, Y.; Wang, T.Q.; Wu, J.; Zhang, X.L.; Xu, Y.Y.; Qian, Y.Z. Multi-parameter analysis of combined hepatotoxicity induced by mycotoxin mixtures in HepG2 cells. World Mycotoxin J. 2018, 11, 225–235. [Google Scholar] [CrossRef]
- Vejdovszky, K.; Warth, B.; Sulyok, M.; Marko, D. Non-synergistic cytotoxic effects of Fusarium and Alternaria toxin combinations in Caco-2 cells. Toxicol. Lett. 2016, 241, 1–8. [Google Scholar] [CrossRef] [PubMed]
- Tallarida, R.J. Quantitative methods for assessing drug synergism. Genes Cancer 2011, 2, 1003–1008. [Google Scholar] [CrossRef] [PubMed] [Green Version]
- Geary, N. Understanding synergy. Am. J. Physiol. Metab. 2013, 304, E237–E253. [Google Scholar] [CrossRef] [PubMed]
- Li, Y.; Zhang, B.; He, X.; Cheng, W.H.; Xu, W.; Luo, Y.; Liang, R.; Luo, H.; Huang, K. Analysis of individual and combined effects of ochratoxin a and zearalenone on HepG2 and KK-1 cells with mathematical models. Toxins 2014, 6, 1177–1192. [Google Scholar] [CrossRef] [PubMed] [Green Version]
- Oh, S.Y.; Cedergreen, N.; Yiannikouris, A.; Swamy, H.V.L.N.; Karrow, N.A. Assessing interactions of binary mixtures of Penicillium mycotoxins (PMs) by using a bovine macrophage cell line (BoMacs). Toxicol. Appl. Pharmacol. 2017, 318, 33–40. [Google Scholar] [CrossRef] [PubMed]
- Assunção, R.; Pinhão, M.; Loureiro, S.; Alvito, P.; Silva, M.J. A multi-endpoint approach to the combined toxic effects of patulin and ochratoxin a in human intestinal cells. Toxicol. Lett. 2019, 313, 120–129. [Google Scholar] [CrossRef]
- Vejdovszky, K.; Sack, M.; Jarolim, K.; Aichinger, G.; Somoza, M.M.; Marko, D. In vitro combinatory effects of the Alternaria mycotoxins alternariol and altertoxin II and potentially involved miRNAs. Toxicol. Lett. 2017, 267, 45–52. [Google Scholar] [CrossRef]
- Solhaug, A.; Karlsøen, L.M.; Holme, J.A.; Kristoffersen, A.B.; Eriksen, G.S. Immunomodulatory effects of individual and combined mycotoxins in the THP-1 cell line. Toxicol. Vitr. 2016, 36, 120–132. [Google Scholar] [CrossRef] [Green Version]
- Tallarida, R.J. Revisiting the isobole and related quantitative methods for assessing drug synergism. J. Pharmacol. Exp. Ther. 2012, 342, 2–8. [Google Scholar] [CrossRef] [Green Version]
- Anastasiadi, M.; Polizzi, K.; Lambert, R.J.W. An improved model for the analysis of combined antimicrobials: A replacement for the Chou-Talalay combination index method. J. Appl. Microbiol. 2018, 124, 97–107. [Google Scholar] [CrossRef] [Green Version]
- Vejdovszky, K.; Hahn, K.; Braun, D.; Warth, B.; Marko, D. Synergistic estrogenic effects of Fusarium and Alternaria mycotoxins in vitro. Arch. Toxicol. 2017, 91, 1447–1460. [Google Scholar] [CrossRef] [PubMed] [Green Version]
- Aupanun, S.; Phuektes, P.; Poapolathep, S.; Alassane-Kpembi, I.; Oswald, I.P.; Poapolathep, A. Individual and combined cytotoxicity of major trichothecenes type B, deoxynivalenol, nivalenol, and fusarenon-X on Jurkat human T cells. Toxicon 2019, 160, 29–37. [Google Scholar] [CrossRef] [PubMed]
- Alassane-Kpembi, I.; Puel, O.; Pinton, P.; Cossalter, A.M.; Chou, T.C.; Oswald, I.P. Co-exposure to low doses of the food contaminants deoxynivalenol and nivalenol has a synergistic inflammatory effect on intestinal explants. Arch. Toxicol. 2017, 91, 2677–2687. [Google Scholar] [CrossRef] [PubMed]
- Ferreira Lopes, S.; Vacher, G.; Ciarlo, E.; Savova-Bianchi, D.; Roger, T.; Niculita-Hirzel, H. Primary and Immortalized Human Respiratory Cells Display Different Patterns of Cytotoxicity and Cytokine Release upon Exposure to Deoxynivalenol, Nivalenol and Fusarenon-X. Toxins 2017, 9, 337. [Google Scholar] [CrossRef] [Green Version]
- Zhou, H.; George, S.; Li, C.; Gurusamy, S.; Sun, X.; Gong, Z.; Qian, H. Combined toxicity of prevalent mycotoxins studied in fish cell line and zebrafish larvae revealed that type of interactions is dose-dependent. Aquat. Toxicol. 2017, 193, 60–71. [Google Scholar] [CrossRef]
- Zouaoui, N.; Mallebrera, B.; Berrada, H.; Abid-Essefi, S.; Bacha, H.; Ruiz, M.J. Cytotoxic effects induced by patulin, sterigmatocystin and beauvericin on CHO-K1 cells. Food Chem. Toxicol. 2016, 89, 92–103. [Google Scholar] [CrossRef]
- Juan-García, A.; Tolosa, J.; Juan, C.; Ruiz, M.-J. Cytotoxicity, genotoxicity and disturbance of cell cycle in HepG2 Cells exposed to OTA and BEA: Single and combined actions. Toxins 2019, 11, 341. [Google Scholar] [CrossRef] [Green Version]
- Lei, Y.; Guanghui, Z.; Xi, W.; Yingting, W.; Xialu, L.; Fangfang, Y.; Goldring, M.B.; Xiong, G.; Lammi, M.J. Cellular responses to T-2 toxin and/or deoxynivalenol that induce cartilage damage are not specific to chondrocytes. Sci. Rep. 2017, 7, 1–14. [Google Scholar] [CrossRef] [Green Version]
- Yang, Y.; Yu, S.; Tan, Y.; Liu, N.; Wu, A. Individual and combined cytotoxic effects of co-occurring deoxynivalenol family mycotoxins on human gastric epithelial cells. Toxins 2017, 9, 96. [Google Scholar] [CrossRef] [Green Version]
- Zhou, H.; George, S.; Hay, C.; Lee, J.; Qian, H.; Sun, X. Individual and combined effects of aflatoxin B1, deoxynivalenol and zearalenone on HepG2 and RAW 264.7 cell lines. Food Chem. Toxicol. 2017, 103, 18–27. [Google Scholar] [CrossRef]
- Gao, Y.N.; Wang, J.Q.; Li, S.L.; Zhang, Y.D.; Zheng, N. Aflatoxin M1 cytotoxicity against human intestinal Caco-2 cells is enhanced in the presence of other mycotoxins. Food Chem. Toxicol. 2016, 96, 79–89. [Google Scholar] [CrossRef] [PubMed]
- Marin, D.E.; Pistol, G.C.; Bulgaru, C.V.; Taranu, I. Cytotoxic and inflammatory effects of individual and combined exposure of HepG2 cells to zearalenone and its metabolites. Naunyn. Schmiedebergs. Arch. Pharmacol. 2019, 392, 937–947. [Google Scholar] [CrossRef] [PubMed]
- Juan-García, A.; Juan, C.; Manyes, L.; Ruiz, M.J. Binary and tertiary combination of alternariol, 3-acetyl-deoxynivalenol and 15-acetyl-deoxynivalenol on HepG2 cells: Toxic effects and evaluation of degradation products. Toxicol. Vitr. 2016, 34, 264–273. [Google Scholar] [CrossRef]
- Sobral, M.M.C.; Faria, M.A.; Cunha, S.C.; Ferreira, I.M.P.L.V.O. Toxicological interactions between mycotoxins from ubiquitous fungi: Impact on hepatic and intestinal human epithelial cells. Chemosphere 2018, 202, 538–548. [Google Scholar] [CrossRef] [PubMed]
- Fernández-Blanco, C.; Elmo, L.; Waldner, T.; Ruiz, M.J. Cytotoxic effects induced by patulin, deoxynivalenol and toxin T2 individually and in combination in hepatic cells (HepG2). Food Chem. Toxicol. 2018, 120, 12–23. [Google Scholar] [CrossRef] [PubMed]
- Lee, J.J.; Kong, M. Confidence Intervals of Interaction Index for Assessing Multiple Drug Interaction. Stat. Biopharm. Res. 2009, 1, 4–17. [Google Scholar] [CrossRef] [PubMed] [Green Version]
- Lin, X.; Shao, W.; Yu, F.; Xing, K.; Liu, H.; Zhang, F.; Goldring, M.B.; Lammi, M.J.; Guo, X. Individual and combined toxicity of T-2 toxin and deoxynivalenol on human C-28/I2 and rat primary chondrocytes. J. Appl. Toxicol. 2019, 39, 343–353. [Google Scholar] [CrossRef]
- Boik, J.C.; Narasimhan, B. An R package for assessing drug synergism/antagonism. J. Stat. Softw. 2010, 34, 1–18. [Google Scholar] [CrossRef] [Green Version]
- CISNE Code for the Identification of Synergism Numerically Efficient. Available online: https://cisnecode.github.io (accessed on 29 February 2020).
- Ren, Z.; Deng, H.; Deng, Y.; Liang, Z.; Deng, J.; Zuo, Z.; Hu, Y.; Shen, L.; Yu, S.; Cao, S. Combined effects of deoxynivalenol and zearalenone on oxidative injury and apoptosis in porcine splenic lymphocytes in vitro. Exp. Toxicol. Pathol. 2017, 69, 612–617. [Google Scholar] [CrossRef]
- Gayathri, L.; Karthikeyan, B.S.; Rajalakshmi, M.; Dhanasekaran, D.; Li, A.P.; Akbarsha, M.A. Metabolism-dependent cytotoxicity of citrinin and ochratoxin A alone and in combination as assessed adopting integrated discrete multiple organ co-culture (IdMOC). Toxicol. Vitr. 2018, 46, 166–177. [Google Scholar] [CrossRef]
- Gong, L.; Zhu, H.; Li, T.; Ming, G.; Duan, X.; Wang, J.; Jiang, Y. Molecular signatures of cytotoxic effects in human embryonic kidney 293 cells treated with single and mixture of ochratoxin A and citrinin. Food Chem. Toxicol. 2019, 123, 374–384. [Google Scholar] [CrossRef] [PubMed]
- Juan-García, A.; Juan, C.; Tolosa, J.; Ruiz, M.J. Effects of deoxynivalenol, 3-acetyl-deoxynivalenol and 15-acetyl-deoxynivalenol on parameters associated with oxidative stress in HepG2 cells. Mycotoxin Res. 2019, 35, 197–205. [Google Scholar] [CrossRef] [PubMed]
- Juan-García, A.; Taroncher, M.; Font, G.; Ruiz, M.J. Micronucleus induction and cell cycle alterations produced by deoxynivalenol and its acetylated derivatives in individual and combined exposure on HepG2 cells. Food Chem. Toxicol. 2018, 118, 719–725. [Google Scholar] [CrossRef] [PubMed]
- Smith, M.C.; Madec, S.; Pawtowski, A.; Coton, E.; Hymery, N. Individual and combined toxicological effects of deoxynivalenol and zearalenone on human hepatocytes in in vitro chronic exposure conditions. Toxicol. Lett. 2017, 280, 238–246. [Google Scholar] [CrossRef]
- Springler, A.; Vrubel, G.J.; Mayer, E.; Schatzmayr, G.; Novak, B. Effect of Fusarium-derived metabolites on the barrier integrity of differentiated intestinal porcine epithelial cells (IPEC-J2). Toxins 2016, 8, 345. [Google Scholar] [CrossRef]
Figure 1.
Cytotoxicity of OTA (5 μM and 10 μM observed) on PK15 cells after 24 h of exposure [34]; arithmetic additivity calculation shows that upon treatment with 5 + 5 μM of OTA expected viability is much lower than observed viability indicating antagonism (no copyright permission needed as we created this figure).

Figure 2.
Combination indices calculated according to Anastasiadi et al. [50] accounting for different slopes of dose-response curves, 95% confidence interval (CI) was estimated using Monte Carlo simulations (N = 10000). All dose-response curves were fitted using non-linear regression. Results show mostly additive effect, with an exception of CIT + 5-M-STC combination which shows antagonistic effect in the area of up to 20% of cells affected, and CIT + STC combination (only 1 IC50: 1 IC50 ratio) in the area of 25–50% of cells affected.


Table 1.
Interactions between mycotoxin combinations in vitro assessed by simple addition of effects, full factorial analysis, Bliss independence criterion, Loewe additivity law and response surface.
Table 1.
Interactions between mycotoxin combinations in vitro assessed by simple addition of effects, full factorial analysis, Bliss independence criterion, Loewe additivity law and response surface.
| Mycotoxin Combination | In Vitro Model | Mathematical Model Applied for the Endpoint | Endpoint Combined Effect | Reference |
|---|---|---|---|---|
| AFM1 + OTA | Caco-2/ human colon HT29-MTX co-cultures (100/0, 90/10, 75/25 and 0/100) | Simple addition of effects | Cell viability (Enhanced Cell Counting Kit-8, CCK-8): synergism in all cultures TEER: antagonism in all cultures, except additive effect in 90/10 co-culture Intestinal mucin MUC2 and MUC5B mRNA expression: synergistic effect in 75/25 and 0/100 cultures at 4 μg/mL additive effects at the low concentration (0.05 μg/mL) culture, antagonistic effects in 100/0 and 90/10 cultures at 4 μg/mL Intestinal mucin MUC5AC mRNA expression: antagonistic effect in 100/0 cultures, an additive effect in 0/100 cultures at two concentrations of the mixtures Intestinal mucin MUC5AC, MUC2 AND MUC5B on protein level: synergism at 0.05 and 4 μg/mL additive effect at 0.05 μg/mL in 75/25 and 90/10 cultures | [35] |
| AFB1 + FB1 | HepG2 cells | Simple addition of effects and factorial analysis (two-way ANOVA) | Cell cycle analysis (flow citometry assay): synergism on apoptosis at 10% and 30% of IC50 | [36] |
| ZEN (30 or 60 µM) + OTA (6 or 12 µM) ZEN (30 or 60 µM) + α-ZEL (15 or 30 µM) | HepG2 cells | Full factorial analysis: 3 × 3 two-way ANOVA matrix | Cytotoxicity (MTT test): synergism of ZEN (60 µM) + α-ZEL (15 or 30 µM) antagonism in all other combinations Oxidative stress parameters (MDA, GSH, Gpx, SOD): synergism of ZEN (60 µM) + α-ZEL (15 or 30 µM) antagonism in all other combinations | [37] |
| DON + ZEN | Bi- and tri-culture systems: A) Caco-2 and HepaRG; B) Caco-2 and THP-1; C) HepaRG and THP-1 D) Caco-2, HepaRG and THP-1 | Response additivity, CIRA) and Bliss independence criterion (independent joint action, CIIjA); IC10 (1:1) and IC30 (1:1) | Cytotoxicity (MTS test): additive effect for combination of IC10 in A–D (CIRA and CIIjA) synergism for combination of IC30 in A–C (CIRA and CIIjA) additive effect for combination of IC30 in D (CIRA and CIIjA) | [38] |
| DON + MON DON + FB1 DON + ZEN NIV + T-2 | HepaRG cells | Response additivity (CIRA) and Bliss independence criterion (independent joint action, CIIjA) | Cytotoxicity (MTS): synergism of DON + MON in all combinations except additive effect at highest concentration (1:1) (CIRA and CIIjA) synergism of DON + FB1 in all combinations (CIRA and CIIjA) except additive effect at highest concentration (1:1) (CIRA) synergism of DON + ZEN at low and medium concentrations (CIRA and CIIjA); additive effect (CIIJA) and antagonism at high concentrations (CRA) NIV + T-2 synergism at low concentrations (CIRA and CIIjA); additive effect or antagonism (CIIJA) and antagonism at medium and high concentrations (CIRA) | [39] |
| AFB1 + ZEN AFB1 + DON ZEN + DON AFB1 + ZEN + DON | HepG2 cells | Bliss independence criterion (IA) and Loewe additivity models (CA); CI-Isobologram method | Cell number (high content analysis by fluorescent labelling: IA and CA model: deviation from the obtained results; better consistency was achieved by CA model; CI model: antagonism at low fraction affected (0.05–0.15) changing to additive and synergistic effect as fraction affected increases for all combinations | [40] |
| TeA + ENN B; TeA + ZEN; TeA + DON; TeA + NIV; TeA + AURO; ENN B + ZEN; ENN B + DON; ENN B + NIV ENN B + AURO; ZEN + DON; ZEN + NIV; ZEN + AURO; DON + NIV; DON + AURO | Caco-2 cells | Bliss independence criterion combined with CI calculated by Chou (C) and Chou-Talalay (CT) method | Cytotxicity (WST-1 test): additive effects of binary mixtures at low concentrations calculated by Bliss independence criterion antagonism of binary mixtures ENN B, ZEN and DON as well as binary combinations of Fusarium toxins with TeA applied at cytotoxic concentrations as calculated by CI | [41] |
| ATX II + AOH | HepG2, HT29 cells and human corneal epithelial HCEC cells | Bliss independence criterion, constant ratio of 1:10 or 1:1 | Cytotoxicity (WST-1 test): dominant additive effect in all cell lines antagonism in specific doses of ratios 1:10 or 1:1 | [47] |
| AOH + DON AOH + ZEN ZEN + DON AOH + DON + ZEN | THP-1 monocytes differentiated into macrophages | Concentration addition (CA) and independent action (IA) model at equal effect concentration | CD14 expression: synergism of AOH + DON applied at low concentrations additive effects of binary and tertiary mixtures of AOH, ZEN and DON, as calculated by both CA and IA | [48] |
| CIT + OTA OTA + PAT OTA + MPA OTA + PA CIT + PAT CIT + MPA CIT + PA PAT + MPA PAT + PA MPA + PA | Bovine peritoneal macrophage BoMacs cells | CA and IA model; Penicillium toxins in IC25, ½ IC25 and ¼ IC25 | Cell proliferation (CyQUANT® GR dye): CIT + OTA synergism at ½ IC25 (CA, IA) OTA + PAT additive effects (CA, IA) OTA + MPA synergism at IC25, ½ IC25 and ¼ IC25 (CA) OTA + PA synergism at IC25 and ¼ IC25 (CA) - CIT + PAT antagonism at ½ IC25 (CA) CIT + MPA inconclusive (synergism CA, antagonism IA) CIT + PA antagonism at IC25, ½ IC25 (IA) PAT + MPA antagonism at IC25, ½ IC25 and ¼ IC25 (IA) PAT + PA synergism at ½ IC25; antagonism at IC25 MPA + PA inconclusive | [45] |
| OTA + PAT | Caco-2 cells | Concentration addition model (CA) and independent action (IA) model with Jonker’s generalization [28] | Cytotoxicity (MTT test): - additive effects (CA) synergism at high concentration of OTA and low of PAT (IA) antagonism at high concentration of PAT and low of OTA (IA) Gastrointestinal barrier integrity (TEER assay): synergism at low concentration and antagonism at high concentration; the change from synergism to antagonism at higher IC50 level (CA, IA) Genotoxicity (alkaline comet test): no dose-effect relationship of the single toxins; mathematical modelling was not applicable for the mixture | [46] |
AFB1 and AFM1: aflatoxin B1 and M1, DON: deoxynivalenol, ZEN: zearalenone, α and β-ZEL: α and β-zearalenol, OTA: ochratoxin A, FB1: fumonisn B1, PAT: patulin, CIT: citrinin, MPA: mycophenolic acid, PA: penicillic acid, NIV: nivalenol, ENN A and B: enniatins A and B, AURO: aurofusarin, AOH: alternariol, ATX II: altertoxin II, TeA: tenuasoic acid, IC10–90: inhibitory concentration 10–90%, MDA: malondyaldehide, GSH: glutathione, Gpx: glutathione peroxidase, SOD: superoxide dismutase, MTT: (3-(4,5 dimethylthiazol-2-yl)-2,5-diphenyltetrazolium bromide) tetrazolium, TEER: transepithelial/transendothelial electrical resistance, MTS: (3-(4,5-dimethylthiazol-2-yl)-5-(3-carboxymethoxyphenyl)-2-(4-sulfophenyl)-2H tetrazolium.
Table 2.
Interactions between mycotoxin combinations in vitro assessed by isobologram and Choul-Talalay method as well as MixLow model.
Table 2.
Interactions between mycotoxin combinations in vitro assessed by isobologram and Choul-Talalay method as well as MixLow model.
| Mycotoxin Combination | In Vitro Model | Mathematical Model Applied for the Endpoint | Endpoint Combined Effect | Reference |
|---|---|---|---|---|
| AOH (50 nM-10 µM) + ZEN (10 pM-1nM) AOH (50 nM-10 µM) + α-ZEL (1 pM-1nM) | Human endometrial adenocarcinoma cell line, Ishikawa | Chou and Chou-Talalay method | Estrogenic effect (AIP test) according to C: 61% synergism, 10% additive effect, 32% antagonism for AOH + ZEN 86% synergism, 14% antagonism for AOH + α-ZEL Estrogenic effect (AIP assay) according to CT: ZEN or α-ZEL:AOH (1:250) dominant synergism Cytotoxicity (SRB assay): not possible to calculate CI | [51] |
| DON + T2 | Human chondrocytic C28/I2, human hepatic epithelial L-02 and human tubular epithelial HK-2 cells | CI-Isobologram according to Chou-Talalay method; CI at IC10–90 (1:1) | Cytotoxicity (MTT test): synergism at IC10 in HK2 antagonism in C28/12, L-02 (IC10–90) and in HK2 (IC25–90) | [58] |
| DON + 15-ADON (1:1) DON + FX (3:1) DON + NIV (3:1) 15-ADON + FX (3:1) 15-ADON + NIV (3:1) FX + NIV (1:1) | Human gastric epithelial GES-1 cells | CI-Isobologram according to Chou-Talalay method; CI at IC10–IC90 | Cytotoxicity (OD test): synergism of DON + 15-ADON, DON + NIV, FX + NIV at IC10–IC70; DON +FX at IC10 and IC30; 15-ADON + FX at IC10 additive effect of FX + NIV at IC90 antagonism of 15A-DON + NIV at IC10–IC90; 15-ADON + FX at IC30-IC90; DON + FX at IC50-IC90; DON +15-ADON, DON + NIV, FX + NIV at IC90 | [59] |
| AFB1 + DON AFB1 + ZEN DON + ZEN AFB1 + DON + ZEN | HepG2 and (murine leukemia virus-induced tumor RAW 264.7 cells | CI-Isobologram according to Chou-Talalay method; CI at IC25,50,70 (1:1 and 1:1:1) | Cytotoxicity (Resazurin test) in HepG2: synergism of DON + ZEN AFB1 + DON + ZEN at IC25–70 additive effects of AFB1 + DON at IC25–70 antagonism of AFB1 + ZEN at IC25–70 Cytotoxicity in RAW 264.7: synergism of AFB1 + DON at IC25; DON + ZEN, AFB1 + DON + ZEN at IC50,70 additive effects of AFB1 + DON at IC50,70, DON + ZEN, AFB1 + DON + ZEN at IC25 antagonism of AFB1 + ZEN at IC25–70 | [60] |
| AFM1 + OTA AFM1 + α-ZEL AFM1 + ZEN OTA + ZEN OTA + α-ZEL ZEN + α-ZEL AFM1 + OTA + α-ZEL AFM1 + ZEN + α-ZEL AFM1 + OTA + ZEN OTA + ZEN + α-ZEL AFM1 + OTA + α-ZEL + ZEN | Caco-2 cells | CI-Isobologram according to Chou-Talalay method; CI at IC25,50,75,90 (1:1, 1:1:1 and 1:1:1.1) | Cytotoxicity (MTT test): synergism of AFM1 + OTA at IC50; OTA + ZEN at IC25,50; OTA + α-ZEL at IC25; ZEN + α-ZEL at IC75,90; AFM1 + ZEN + α-ZEL, AFM1 + OTA + ZEN and OTA + ZEN + α-ZEL at IC25; four toxins combination at IC25,50 additive effects of AFM1 + OTA at IC25,75; AFM1 + ZEN at IC25; OTA + ZEN and ZEN + α-ZEL at IC50; AFM1 + OTA + α-ZEL at IC25,50; AFM1 + OTA + ZEN and OTA + ZEN + α-ZEL at IC50 antagonism at AFM1 + OTA at IC90; AFM1 + α-ZEL at IC25–90; AFM1 + ZEN at IC50-90; OTA + ZEN at IC75,90; OTA + α-ZEL at IC25; ZEN + α-ZEL at IC25; AFM1 + OTA + α-ZEL, AFM1 + OTA + ZEN, OTA + ZEN + α-ZEL and AFM1 + OTA + α-ZEL + ZEN at IC75,90; AFM1 + ZEN + α-ZEL at IC50-90 | [61] |
| ZEN + α-ZEL ZEN + ß-ZEL α-ZEL + ß-ZEL | HepG2 cells | CI-Isobologram according to Chou-Talalay method; CI at IL25-IL75 (1:1) | Cytotoxicity (NR test): synergistic effect in all combinations, except additive effect for ZEA + β ZEL at IL25 Expression of pro-inflammatory cytokines (IL-1ß, TNF-α, IL-8): synergism of all mixtures for IL-8 at IL50.75; ZEN + α-ZEL (IL50,75) and, ZEN + β-ZEL (IL75) for IL-1β and TNF-α antagonism of all mixtures for all cytokines at IL25 except for ZEN + α-ZEL (synergism); ZEN + β-ZEL (IL50) for ILβ; α-ZEL + β-ZEL for IL-1β and TNF-α at IL50,75 | [62] |
| 3-ADON + AOH 15-ADON + AOH 3-ADON + 15-ADON AOH + 3-ADON + 15-ADON | HepG2 cells | CI-Isobologram according to Chou-Talalay method; CI at IC25,50,75,90 (1:1) | Cytotoxicity (MTT test) upon 24, 48 and 72 h: dominant synergism, 3-ADON + AOH (24 and 48 h and IC25 72 h), 15-ADON + AOH (24 h), 3-ADON + 15-ADON and AOH + 3-ADON + 15-ADON (all treatments) additive effect of 3-ADON + AOH IC50-90 (72 h); 15-ADON + AOH at IC25,50 (48 h) and IC50-90 (72 h) antagonism of 15-ADON + AOH at IC75,90 (48 h) and IC25 (72 h) | [63] |
| AFB1 + DON AFB1 + OTA DON+OTA | Caco-2 and HepG2 cells | CI-Isobologram according to Chou-Talalay method; CI at IC10–IC90 (1:1) | Cytotoxicity (MTT test) in Caco-2 cells: synergism of DON+OTA at IC10–IC90; AFB1 + DON at IC60-90; AFB1 + OTA at IC75-90 antagonism of AFB1 + OTA at IC10-50; AFB1 + DON at IC10,30 Cytotoxicity in HepG2 cells: synergism of AFB1 + DON at IC10-90; additive effects of AFB1 + OTA at IC10,90; DON + OTA at IC60,90 antagonism of DON + OTA at IC10-50 | [64] |
| DON + PAT DON + T2 PAT + T2 DON + T2 + PAT | HepG2 cells | CI-Isobologram according to Chou-Talalay method; CI at IC10–IC90 (1:1) | Cytotoxicity (MTT test) upon 24, 48 and 72 h: no synergism dominant additive effect of DON + PAT; DON + T2 upon 72 h and at IC75,90 (24 h); PAT + T2 upon 72 h and at IC10, 50-90 (24 h); DON + T2 + PAT upon 72 h and at IC50-90 (24 h) and IC25–90 (48 h) antagonism of DON + T2 upon 48 h and at IC10-50 (48 h); PAT + T-2 upon 48 h and at IC25 (24 h); DON + T2 + PAT at IC10,25 (24 h) and IC10 (48 h) | [65] |
| DON + NIV (1:0.6) NIV + FX (3:1) DON + FX (1:0.2) DON + NIV + FX (1:0.6:0.2) | Jurkat human T cells | CI-Isobologram according to Chou-Talalay method; CI at IC10, IC20 and IC30 | Cytotoxicity (MTT test): DON + NIV additive effect (IC10) and antagonism (IC20,30) NIV + FX synergism DON + FX antagonism DON + NIV + FX antagonism | [52] |
| DON + NIV | Differentiated three-dimensional porcine jejunal explants | CI-Isobologram according to Chou-Talalay method; CI at equimolar concentrations (1:1) | mRNA expression of cytokines: synergism in activation of all the tested pro-inflammatory genes (IL-1α,β, IL-8, IL-17A, IL-22) | [53] |
| DON + NIV DON + FX NIV + FX DON + NIV + FX | Human alveolar adenocarcinoma (A549) and bronchial 16HBE14o- cells primary human bronchial (hAECB) and nasal (hAECN) cells | CI-Isobologram method derived from the median-effect according to Chou at IC10,30,50 (1:1) | Cytotoxicity (MTT test): in A549 cells synergism of DON + NIV and DON + FX at IC10 and additive effect at IC30; antagonism of NIV + FX at IC30 and DON + NIV or FX at IC50 in 16HBE14o- cells synergism of DON + FX and NIV + FX at IC10-50; antagonism of DON + NIV at IC10-50 in hAECB cells synergism of binary mixtures at IC10.30 and NIV + FX at IC50; additive effects of DON + NIV and DON + FX at IC50 in hAECN cells of binary mixtures at IC30,50 and DON + NIV and NIV + FX at IC10; antagonism of DON + FX at IC10 | [54] |
| DON + ZEN (1:7.5) NIV + T-2 (1:0.067) (ratio of IC50) | HepaRG cells | CI-Isobologram according to Chou-Talalay method | Cytotoxicity (MTS): synergism of DON + ZEN at all applied concentrations - synergism of NIV + T-2 at low concentrations antagonism of NIV + T-2 at medium concentrations | [39] |
| AFB1 + DON (1:1.44) AFB1 + ZEN (1:15.19) DON + ZEN (1:10.56) AFB1 + DON + ZEN (1:1.44:15.19) | Fibroblast cell line BF-2 from the caudal fin of Lepomis macrochirus | CI-Isobologram according to Chou-Talalay method; CI at IC10-IC50 | Cytotoxicity (resazurin): synergism of AFB1 + DON and AFB1 + ZEN and ternary mixture at IC10-30 additive effect of ternary mixture at IC40 antagonism of DON + ZEN and ternary mixture at IC50 | [55] |
| BEA + STC (1:5) BEA + PAT (3.2:1) PAT + STC + (1:5) BEA + PAT + STC (3.2:1:5) | Chinese hamster ovary CHO-K1 cells | CI-Isobologram according to Chou-Talalay method; CI at IC5-IC50 | Cytotoxicity (MTT test) upon 24, 48 and 72 h: synergism of BEA + STC at IC5,10 (24 h); BEA + PAT at IC5 (24 h); PAT + STC at IC5,10 (24-72 h); BEA + PAT + STC at IC5,10 (24 h) and IC10-50 (72 h) additive effect of BEA + STC at IC25,50 (24 h), IC50 (48 h) and IC10-50 (72 h); BEA + PAT at IC10-50 (24 h) and IC25,50 (72 h); PAT + STC at IC25 (24-72 h) and IC50 (24, 48 h); BEA + PAT + STC at IC5 (72 h) and IC25,50 (24, 48h) antagonism of BEA + STC at IC5-25 (48 h); BEA +PAT at IC5-50 (48 h) and IC5,10 (72 h); PAT + STC at IC50 (72 h); BEA + PAT + STC at IC5,10 (48 h) | [56] |
| BEA + OTA | HepG2 cells | CI-Isobologram according to Chou-Talalay method; CI at IC25-IC90 (1:1) and equimolar ration (1:10) | Cytotoxicity (MTT test) upon 24, 48 and 72 h: synergism upon 72 h at IC25-IC90; 48 h at IC25-IC75; and 1:10 upon 48 and 72 h additive effects upon 24 h at IC25-IC90; 48 h at IC90; and 1:10 upon 24 h | [57] |
| CIT + STC CIT + M-STC | Human adenocarcinoma lung A549 cells | CI-Isobologram with correction for unparalleled dose-response curves, developed by Anastasiadi et al. [50]; “ray” desing with 1:1, 1:2 and 2:1 concentration ratios | Cytotoxicity (MTT test) additive effect antagonism exceptionally in low affected areas for CIT + 5-MSTC and 2:1 CIT + STC, also between IC25 and IC50 for CIT + STC | Personal unpublished data shown in Figure 2. |
| DON + T2 | Human C-28/I2 and newborn rat primary costal chondrocytes (RC) | MixLow method; combination ratios of DON and T-2 toxin (R1=1:1 R10= 10:1, R100=100:1 and R1000=1000:1). | Cytotoxicity (MTT test): synergism at fraction affected 0.5, 0.75, 0.9 of R10 concentrations in RC antagonism at fraction affected 0.25 of R100 in both cell types; fraction affected 0.5 of R100 in C-28/12; fraction 0.5 of R1000 in RC | [67] |
AFB1 and AFM1: aflatoxin B1 and M1, DON: deoxynivalenol, ZEN: zearalenone, OTA: ochratoxin A, FB1: fumonisn B1, PAT: patulin, BEA: beauvericin, CIT: citrinin, MPA: mycophenolic acid, PA: penicillic acid, 15-ADON: 15-acetyldeoxynivalenol, FX: fusarenon-X, NIV: nivalenol, AOH: alternariol, ATX II: altertoxin II, α and β-ZEL: α and β-Zearalenol, STC: sterigmatocystin, 5-M-STC: 5-Methoxysterigmatocystin; IC10–90: inhibitory concentration 10–90%, CI: combination index, AIP: alkaline phosphatase, MTT: (3-(4,5-dimethylthiazol-2-yl)-2,5-diphenyltetrazolium bromide) tetrazolium, OD: optical density, SRB: sulforhodamine B assay, NR: neutral red assay.
Table 3.
Interactions between mycotoxin combinations in vitro without applying a mathematical model.
Table 3.
Interactions between mycotoxin combinations in vitro without applying a mathematical model.
| Mycotoxin Combination | In Vitro Model | Statistical Analysis Applied for the Endpoint | Endpoint Combined Effect | Reference |
|---|---|---|---|---|
| DON + ZEN | Porcine splenic lymphocytes | ANOVA followed by the Tukey post hoc test (p < 0.05) | Antioxidant parameters (MDA, GSH, CAT, SOD, Gpx): synergism Apoptotic rate: synergism Expression of p53, Bcl-2, Bax, caspase-3, and caspase-8: synergism | [70] |
| DON + ZEN (at concentrations corresponding to the AED, TDI and ML) | HepaRG cells | Student’s t-test (p < 0.05) | Cytotoxicity (MTS test) upon 14, 28 and 42 days: at ML no antagonistic or synergistic effect Gene expression of CYP4F3B, CYP3A4, C/EBPα, HNF4α, aldolase B, transferrin, albumin and claudin-1 (qPCR): at AED majority of genes were ↑↑ after 14 days and ↓↓ after 28 days at TDI the gene expression upon 14 and 28 days were less different but more ↑↑ after 28 days at ML DON and DON+ZEA reduced the cell viability by more than 90%, no sufficient amounts of RNA DON + ZEN affected different genes than single DON and ZEA | [75] |
| DON + 3ADON (3:1) DON + 15-ADON (3:1) 3-ADON + 15-ADON (1:1) DON + 3-ADON + 15-ADON (3:1:1) (ratios of IC50) | HepG2 cells | ANOVA followed by the Tukey post hoc test (p ≤ 0.05) | Oxidative stress (ROS and MDA): binary mixtures significantly increased ROS vs. control and initial time binary and tertiary mixtures increased MDA vs. control (24, 48 and 72 h) Cell cycle distribution upon 48 h (flow cytometry): DON + 3-ADON ↓ G0/G1 and S, G0/G1 and S, G2/M phase ↑ at lower and ↓ at higher concentrations in respect to control DON + 15-ADON ↑ G0/G1 and G2/M at lower and ↓ at higher concentrations in respect to control 3-ADON + 15-ADON ↓ G0/G1 and S at all concentrations vs. control tertiary combination ↓ G0/G1, S and G2/M vs. control Micronuclei (MN): binary mixtures ↑ in MN at lower concentrations vs. control tertiary mixtures ↑ in MN at all concentrations vs. control | [73,74] |
| ENN A + A1 + B + B1 (1.5 or 3 µM) ENN A + A1 + B + B1 + DON (1.5 or 3 µM) BEA (2.5 µM) + DON (1.5 or 3 µM) Apicidin (0.438 µM) + DON (1.5 or 3 µM) AURO (5 µM) + DON (1.5 or 3 µM) | Porcine epithelial cells IPEC-J2 | ANOVA followed by the Dunnett’s t-test or Kruskall-Wallis test (p < 0.05) | TEER upon 24, 48 and 72 h: dominant additive effect DON had no effect on enniatin-induced TEER decrease BEA + DON did not significantly reduce TEER | [76] |
| OTA + CIT | Multiple organ co-culture (IdMOC) of HepG2 and 3T3 cells | Paired sample t-test (p < 0.05) | Luciferin-IPA metabolism assay: synergism at 20% IC50 (CTN forms a reactive metabolite that diffuses out of HepG2 to cause cytotoxicity to 3T3 cells synergistically with OTA) | [71] |
| OTA + CIT (equimolar concentrations 0–30 µM) | Human embryonic kidney HEK293 cells | No statistical analysis indicated/ effect of combination was compared to the effects of mycotoxins acting alone | Cytotoxicity (MTT test): synergism based on IC50 of single OTA (16 µM) and CIT (189 µM) vs. combination (7 µM) | [72] |
DON: deoxynivalenol, ZEN: zearalenone, BEA: beauvericin, 3-ADON: 3-acetyldeoxynivalenol, 15-ADON: 15-acetyldeoxynivalenol, ENN A and B: enniatins A and B, AURO: aurofusarin, OTA: ochratoxin A, CIT: citrinin, IC50: inhibitory concentration 50%, MDA: malondyaldehide, GSH: glutathione, Gpx: glutathione peroxidase, CAT: catalase, SOD: superoxide dismutase, ROS: reactive oxygen species, MTT: (3-(4,5-dimethylthiazol-2-yl)-2,5-diphenyltetrazolium bromide) tetrazolium, TEER: transepithelial/transendothelial electrical resistanceAED: average exposure dose of French adult population, TDI: Tolerable daily intake established by the JECFA, ML: maximum level permitted in cereals by the European regulation, ↑↑: up-regulated, ↓↓: down-regulated, ↑: increased, ↓: decreased.
© 2020 by the authors. Licensee MDPI, Basel, Switzerland. This article is an open access article distributed under the terms and conditions of the Creative Commons Attribution (CC BY) license (http://creativecommons.org/licenses/by/4.0/).
Share and Cite
MDPI and ACS Style
Kifer, D.; Jakšić, D.; Šegvić Klarić, M. Assessing the Effect of Mycotoxin Combinations: Which Mathematical Model Is (the Most) Appropriate? Toxins 2020, 12, 153. https://0-doi-org.brum.beds.ac.uk/10.3390/toxins12030153
AMA Style
Kifer D, Jakšić D, Šegvić Klarić M. Assessing the Effect of Mycotoxin Combinations: Which Mathematical Model Is (the Most) Appropriate? Toxins. 2020; 12(3):153. https://0-doi-org.brum.beds.ac.uk/10.3390/toxins12030153
Chicago/Turabian StyleKifer, Domagoj, Daniela Jakšić, and Maja Šegvić Klarić. 2020. "Assessing the Effect of Mycotoxin Combinations: Which Mathematical Model Is (the Most) Appropriate?" Toxins 12, no. 3: 153. https://0-doi-org.brum.beds.ac.uk/10.3390/toxins12030153
Note that from the first issue of 2016, this journal uses article numbers instead of page numbers. See further details here.