Article

Ethylenediaminetetraacetic Acid Disodium Salt Acts as an Antifungal Candidate Molecule against Fusarium graminearum by Inhibiting DON Biosynthesis and Chitin Synthase Activity

1
Key Laboratory of Pesticides, College of Plant Protection, Nanjing Agricultural University, Nanjing 210095, China
2
The Key Laboratory of Plant Immunity, Nanjing Agricultural University, Nanjing 210095, China
*
Author to whom correspondence should be addressed.
Submission received: 24 November 2020 / Revised: 14 December 2020 / Accepted: 24 December 2020 / Published: 27 December 2020
(This article belongs to the Section Mycotoxins)

Abstract

:
Fusarium fungi are the cause of an array of devastating diseases affecting yield losses and accumulating mycotoxins. Fungicides can be exploited against Fusarium and deoxynivalenol (DON) production. However, Fusarium resistance to common chemicals has become a therapeutic challenge worldwide, which indicates that new control agents carrying different mechanisms of action are desperately needed. Here, we found that a nonantibiotic drug, ethylenediaminetetraacetic acid disodium salt (EDTANa2), exhibited various antifungal activities against Fusarium species and DON biosynthesis. The infection of wheat seeding caused by F. graminearum was suppressed over 90% at 4 mM EDTANa2. A similar control effect was observed in field tests. Mycotoxin production assays showed DON production was significantly inhibited, 47% lower than the control, by 0.4 mM EDTANa2. In vitro experiments revealed a timely inhibition of H2O2 production as quickly as 4 h after amending cultures with EDTANa2 and the expression of several TRI genes significantly decreased. Chitin synthases of Fusarium were Mn2+-containing enzymes that were strongly inhibited by Mn2+ deficiency. EDTANa2 inhibited chitin synthesis and destroyed the cell wall and cytomembrane integrity of Fusarium, mainly via the chelation of Mn2+ by EDTANa2, and thus led to Mn deficiency in Fusarium cells. Taken together, these findings uncover the potential of EDTANa2 as a fungicide candidate to manage Fusarium head blight (FHB) and DON in agricultural production.
Key Contribution: EDTANa2 is identified as a fungicide candidate molecule to control the growth and DON production of Fusarium graminearum. The antifungal activity of EDTANa2 mainly results from Mn deficiency in cells.

1. Introduction

Fusarium is a globally important genus of fungal pathogens, responsible for many devastating diseases of plants and various serious diseases of humans [1,2]. Fusarium species are widely present in soil, plants and other organic substrates and have widespread distributions [3]. Species such as Fusarium graminearum, Fusarium oxysporum and Fusarium verticillioides can infect many crop plants, vegetables and flowers [2,4,5,6,7,8]. One of the major diseases caused by Fusarium is Fusarium head blight (FHB), which is becoming more and more serious recently and causing concern. FHB results in yield loss and damaging of cereal grains [9,10]. Additionally, Fusarium spp. produce various types of mycotoxins, including deoxynivalenol (DON) and acetyl-deoxy-nivalenol (3-ADON and 15-ADON), that suppress humoral and cellular immunity and are thus highly detrimental to human and animal health [11,12]. DON is a mycotoxin virulence factor that promotes growth of the F. graminearum fungus in wheat floral tissues [13].
Practices used to control FHB and DON include rotation with nonhost crops and tillage [14], planting of resistant cultivars [15], and application of fungicides [16]. Essentially, current protective measures against Fusarium species mainly rely on fungicides, such as benzimidazole, triazole, demethylation inhibitor and quinone outside inhibitor. However, some of these can lead to the enhancement of DON biosynthesis in the infected wheat [17,18]. Therefore, new molecules are needed to control FHB and inhibit DON biosynthesis.
In addition, Fusarium isolates are susceptible to mutations that lead to phenotypes of tolerance towards common antifungal drugs [19,20]. Resistance to fungicides allows pathogens to survive fungicide treatment. The time taken for a new resistant mutant to reach a population size that is unlikely to die out by chance is called “emergence time”. Prolonging emergence time would delay loss of control [21]. To date, the drawbacks of both scientific control strategies and the use of effective fungicides need to be addressed [8,22,23]. Undoubtedly, the processes of discovery and development of new antifungal drugs in the pharmaceutical industry are not only laborious and time consuming but also costly [24]. This is particularly true, as fungicides with novel modes of action are only rarely found, and resistance to single-target fungicides may occur within few years [25]. Some nonantibiotic drugs were recently reported to exhibit some antimicrobial activity against bacteria and Candida albicans [26,27].
Ethylenediaminetetraacetic acid (EDTA) is a chelating agent targeting divalent cations and has been previously used in oil fields to increase oil production and inhibit scale formation [28,29]. EDTA has also been shown to possess antimicrobial activities against bacteria and C. albicans because it can limit the availability of essential cations. The chelation of cations causes a separation of lipopolysaccharides from the outer membrane of microbial cells and thus increases the membrane permeability and subsequently leads to cell death in bacteria [30,31,32,33,34,35]. Generally considered safe, EDTA has been used intensively in the food and therapeutic industry [33,36,37]. Here, we demonstrated that EDTANa2 had antifungal activity against Fusarium graminearum and DON biosynthesis. Our study contributes to the understanding of the mechanisms underlying EDTANa2 control of FHB and provides a fungicide candidate molecule against Fusarium graminearum and its mycotoxin biosynthesis.

2. Results

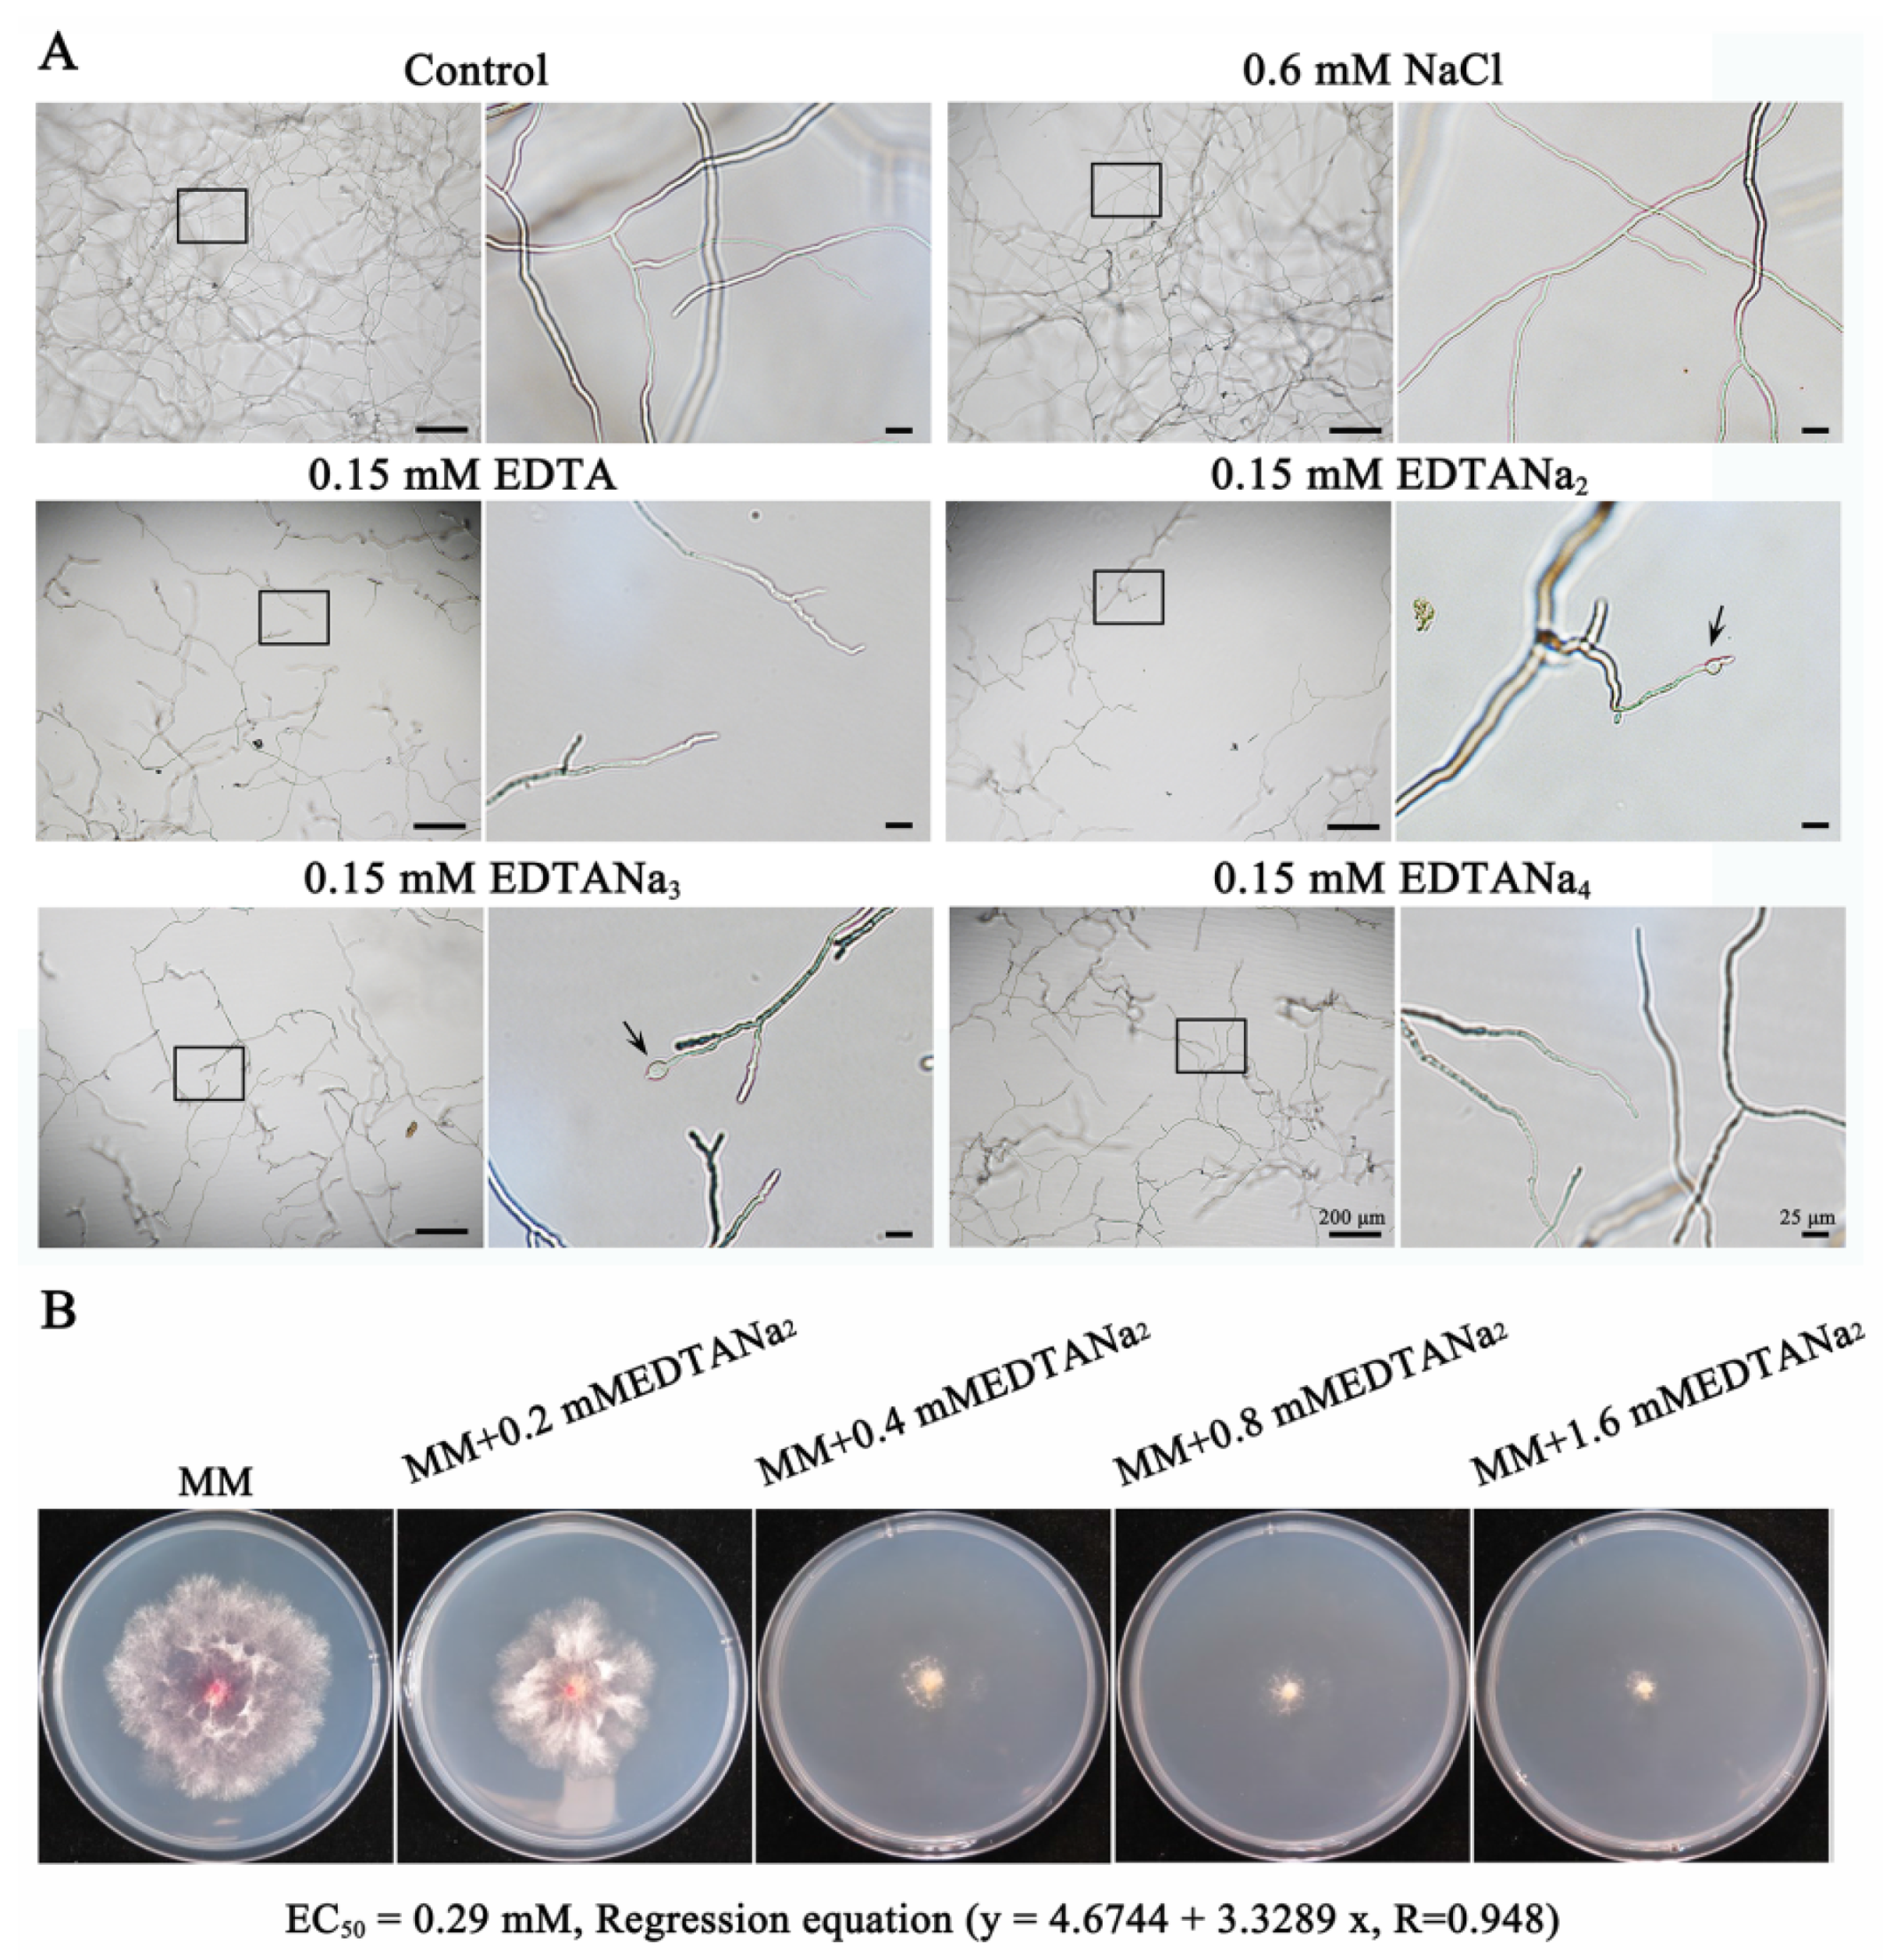
2.1. Ethylenediaminetetraacetic Acid Disodium Salt Exhibits Various Antifungal Activities against Fusarium Species

Mycelial growth was inhibited with 0.15 mM ethylenediaminetetraacetic acid or ethylenediaminetetraacetic acid sodium salt (Figure 1A). The effectiveness of ethylenediaminetetraacetic acid sodium salt was affected by its number of sodium ions. For all tested reagents, EDTANa2 had the best antifungal activity in terms of growth inhibition as well as cell swelling effects, closely followed by EDTANa3. The antifungal activity of EDTANa4 was similar to that of EDTA. Moreover, the mycelial growth and morphology with the 0.3, 0.45, 0.6 mM sodium ion treatments showed no difference from the control group (only the treatment with 0.6 mM sodium ion is shown in Figure 1A), indicating that the sodium ions had no effect on Fusarium growth at a concentration less than 0.6 mM.
To test the antifungal activity of EDTANa2, thirteen isolates of Fusarium, including F. acuminatum, F. asiaticum, F. avenaceum, F. concentricum, F. culmorum, F. equiseti, F. fujikuroi, F. graminearum, F. lateritium, F. oxysporum, F. proliferatum, F. solani and F. verticillioides were inoculated into 96-well microtiter plates. The minimum inhibitory concentrations (MICs) of EDTANa2 on the test pathogens varied from 9.37 to 18.75 mM (Table S1). The lowest MIC value was observed for F. asiaticum, F. avenaceum, F. equiseti, F. fujikuroi and F. proliferatum, while the other Fusarium isolates (except F. lateritium) had MIC values of 18.75 mM. The MIC value of EDTANa2 to F. lateritium was 200 mM. Surprisingly, EDTANa2 did not show any antifungal activity against F. lateritium but promoted its growth in the range of 4.69–150 mM.
For F. graminearum PH-1 strain, a linear regression of the percentage inhibition related to the control of mycelial growth versus the log10 transformation for each of EDTANa2 concentration was obtained. The median effective concentration (EC50) was calculated for each strain using a linear equation. The EC50 value of EDTANa2 for F. graminearum PH-1 strain was 0.29 mM (107.88 mg L−1) (Figure 1B).

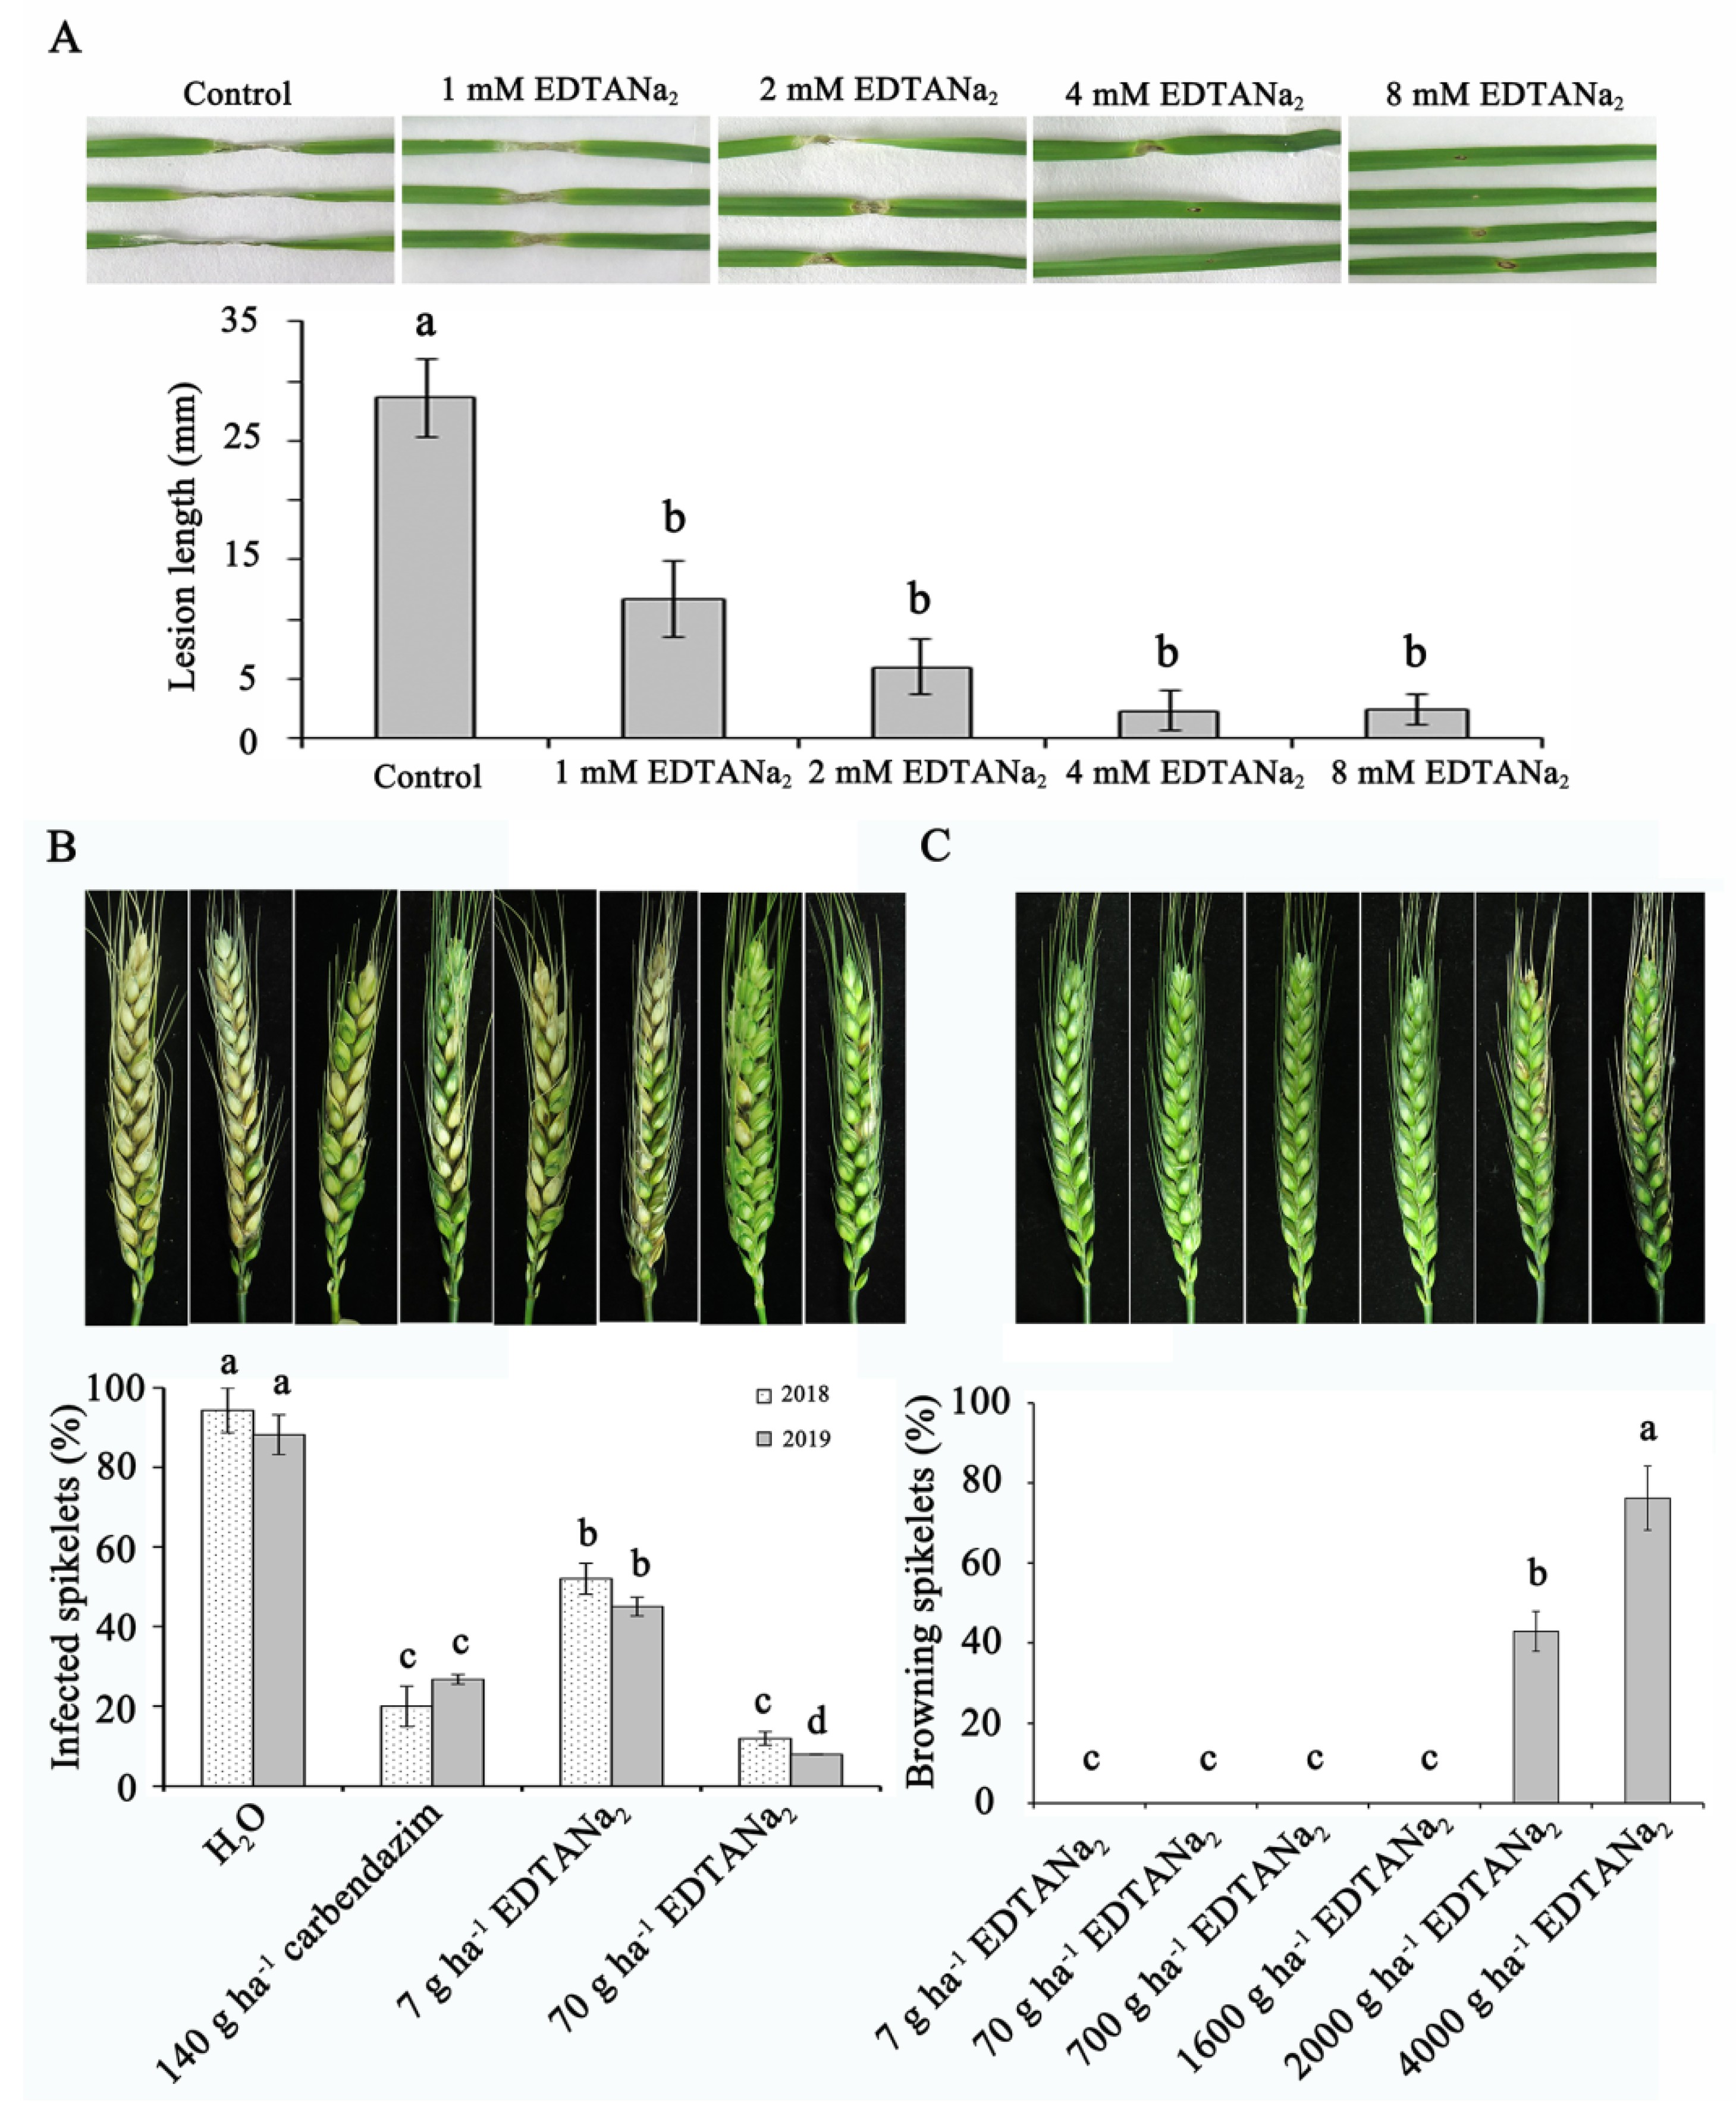
2.2. The Control Effect and Phytotoxicity Test of Ethylenediaminetetraacetic Acid Disodium Salt

The EDTANa2 for control of seedling blight in wheat was effective, reducing disease severity by 59%, 79%, 92% at 1 mM, 2 mM and both 4 mM and 8 mM, relative to the inoculated control, respectively (Figure 2A). No significant different effect was observed among 1 mM to 8 mM EDTANa2, indicating that the control effect was stable within that range under controlled conditions. To ascertain whether the EDTANa2 molecule could inhibit Fusarium infection under natural conditions, a crop phytopathogen, F. graminearum, was chosen for pathogenicity assays by spray inoculation experiments. The disease incidences were recorded 21 days post inoculation (dpi). The field experiment was conducted for two years (2018 and 2019) and produced similar results to the previously described experiments. As shown in Figure 2B, EDTANa2 significantly reduced Fusarium head blight in the field. After spray treatment with 7 g ha−1 EDTANa2, F. graminearum caused 52% and 45% spikelets infection at 21 dpi, 45% and 49% reduction compared to the sterile water control in 2018 and 2019, respectively. When the dosage of EDTANa2 increased to 70 g ha−1, the incidence of disease decreased to 12% and 8%, 87% and 91% reduction compared to the sterile water control in 2018 and 2019, respectively. In 2019, the incidence of disease treated with 70 g ha−1 EDTANa2 had a 70% reduction compared to the 140 g ha−1 carbendazim treatment (Figure 2B). To further analyze the influence of EDTANa2 treatments on spikelet morphology, we sprayed a series of EDTANa2 concentrations (7 g ha−1 to 4000 g ha−1) onto wheat spikelets, and the results showed that there was little change in spikelets morphology following spray application of 7 g ha−1 to 1600 g ha−1 EDTANa2. However, when the dosage of EDTANa2 increased to 2000 g ha−1, phytotoxicity was observed (Figure 2C). These results suggested that EDTANa2 could be used as a safe antifungal agent at low concentration.

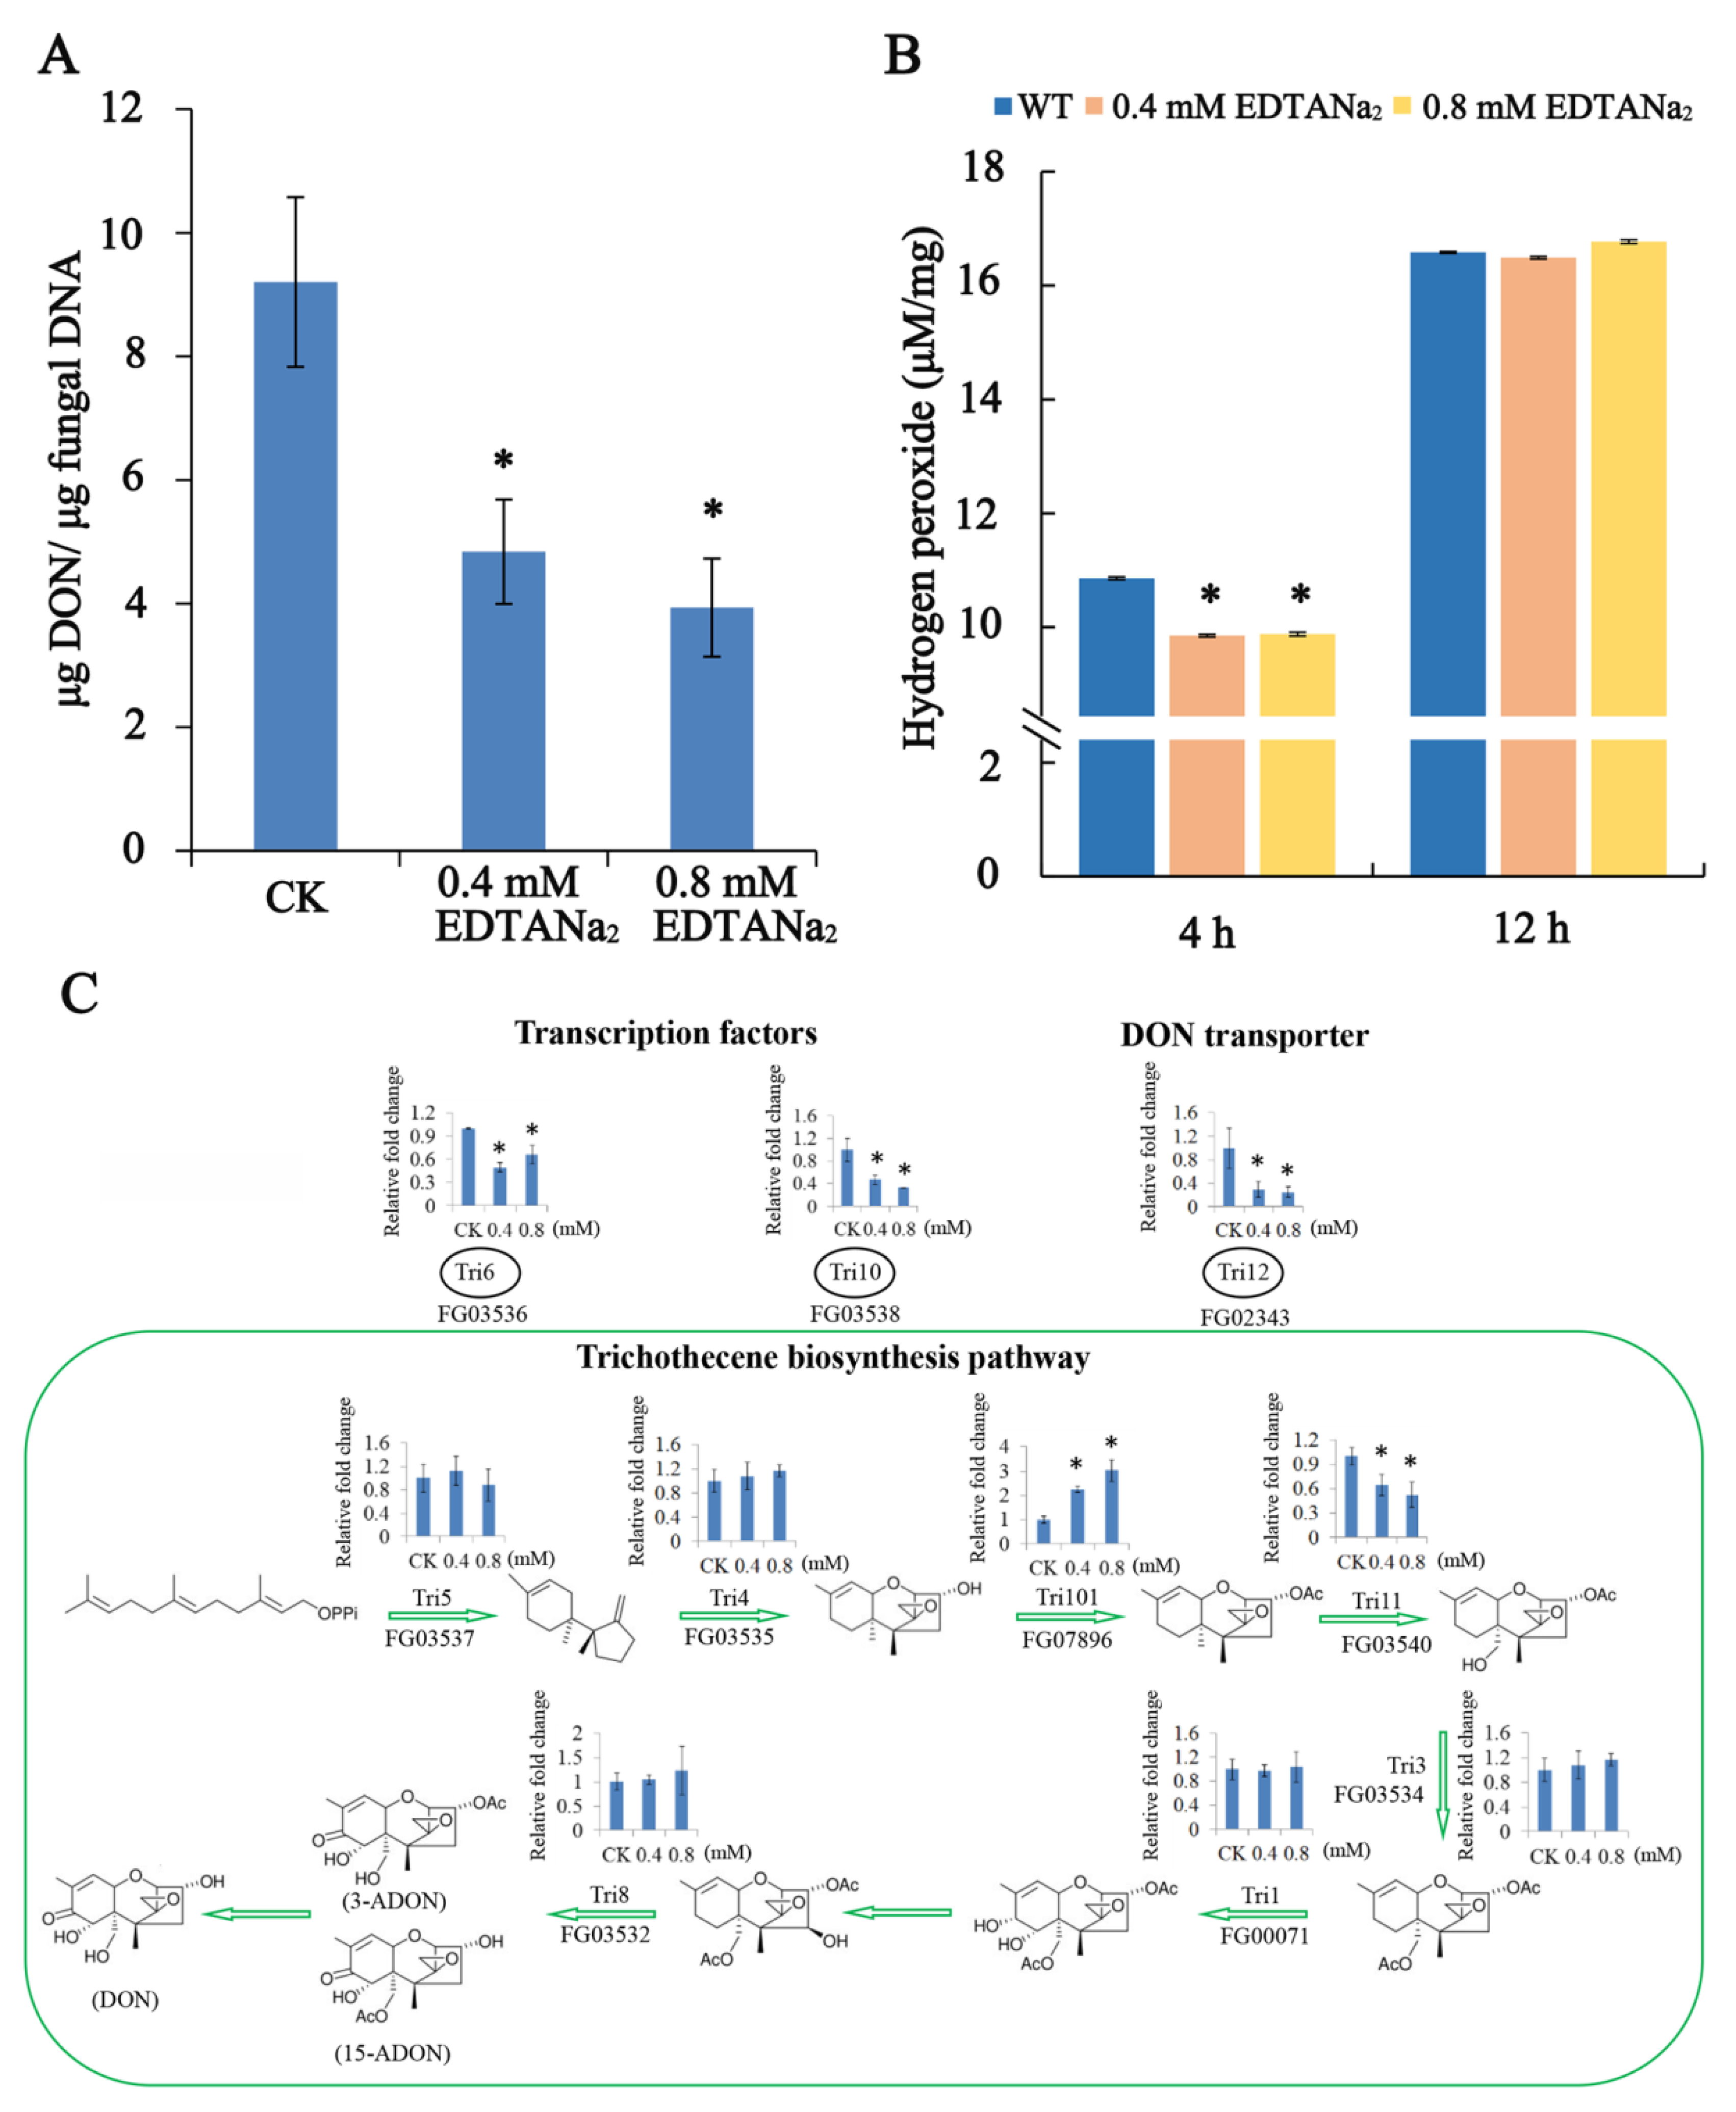
2.3. EDTANa2 Decreases DON Biosynthesis and TRI Gene Expression of Fusarium Graminearum In Vitro

Because the mycotoxin DON is a virulence factor, we investigated the mycotoxin biosynthesis potential of strains under EDTANa2 treatment. To verify the ability of the EDTANa2 to limit toxin production, DON amounts were measured using a competitive ELISA-approach. As shown in Figure 3A, the DON production in TBI media was significantly inhibited by 0.4 mM and 0.8 mM EDTANa2, about 47% and 57.3% lower than the control group, respectively.
As several lines of evidence in the literature corroborate an important role for H2O2 in induction of toxin production, the accumulation of H2O2 upon EDTANa2 application was monitored using an in vitro assay. It showed that adding 0.4 mM and 0.8 mM EDTANa2 resulted in a decreased H2O2 content in the medium compared to the control as fast as 4 h after the start of the assay (Figure 3B). This indicated that EDTANa2 decreased the intracellular oxygen content within a short time after adding to the medium, which may reduce the activation of oxygen to toxin synthesis.
To further reveal the expression profiles of individual genes and their coordination in the trichothecene biosynthesis pathway, we measured the expression of several TRI genes after treating with EDTANa2. We found four genes in the trichothecene biosynthesis pathway were significantly down-regulated compared with the control group (Figure 3C). After treating with 0.4 mM EDTANa2 at 12 h, the expression of the TRI6 and TRI10 genes, which have been identified as positive transcription factor genes for trichothecene biosynthesis in F. graminearum, decreased by 2- and 2.13-times; The TRI12 gene, which is associated with trichothecene accumulation and resistance in F. graminearum, decreased by 3.45-times compared with the control group; The expression of the TRI11 gene also decreased by 1.56-times. The inhibitory effect of 0.8 mM EDTANa2 on the TRI genes expression was consistent with that of 0.4 mM EDTANa2. It should be mentioned that the Tri101 gene encoding a trichothecene 3-O-acetyltransferase showed a remarkable up-regulation, with 2.24- and 3.02-fold more transcripts after treating with 0.4 mM and 0.8 mM EDTANa2, respectively (Figure 3C). These in vitro results suggested that EDTANa2 can indeed inhibit DON biosynthesis and may be useful for reducing DON contamination in grains caused by F. graminearum.

2.4. Ethylenediaminetetraacetic Acid Disodium Salt Affected Cell Wall Formation and Cell Permeability

The inhibition of Fusarium growth by EDTANa2 was observed, so we analyzed the cell wall formation and cell permeability of cells grown in the presence of EDTANa2. The mycelia treated by EDTANa2 were sensitive to the preparation condition of scanning electron microscopy (SEM), and were destroyed and lysed with SEM observation (Figure 4A). As shown in Figure 4B, the ultra-structures of the untreated cells exhibited normal electron-dense layers and patterns under transmission electron microscopy. In contrast, the cells cultured in 0.075 mM EDTANa2 had a clearly altered cell wall electron density, thickness and ultrastructure. The most notable visual alteration was a thicker cell wall in the treated cells, which topped 573 nm compared with that of the control cell, which had an average of 142 nm (the biggest thickness was 153 nm) (n = 20). Furthermore, the number of layers in the treated cell wall was reduced, and the electron density declined, whereas three layers were easily recognized in the normal cell wall. In filamentous fungi, chitin, a β-1,4-linked polysaccharide of N-acetylglucosamine, is a key structural component of the cell wall [38]. To further analyze the effect of EDTA and EDTANa2 on cell wall formation, we measured the chitin content of F. graminearum cell walls after EDTA or EDTANa2 treatment. The results illustrated that the EDTA and EDTANa2 treatment groups produced only 33.43% and 25.23% chitin relative to the hyphal dry weight, values 35.35% and 51.2% lower than those of the control group, respectively (Figure 4C). It is noteworthy that EDTANa2 was more effective than EDTA, which concurred with our above results.
In most cases, the mode of action of antimicrobials against pathogens depends on the destruction of the fungal cell membrane and the resulting increase in cell permeability. The change in electrical conductivity reflects the change in the cell membrane permeability of Fusarium. Additionally, our data showed that the relative conductivity of hypha was significantly increased by 11% and 15% after 0.15 mM EDTA and 0.15 mM EDTANa2 treatment compared with that of the control group, respectively (Figure 4D). There was no difference between 0.6 mM NaCl treatment and the control group. Therefore, EDTA and EDTANa2, especially EDTANa2, indeed affected both cell wall formation and cell permeability and resulted in a decreasing resistance to the external environment in F. graminearum.

2.5. The Inhibitory Effects of Ethylenediaminetetraacetic Acid Disodium Salt against Fusarium are Ameliorated by Mn2+ but not Mg2+ and Ca2+

In order to find out the mechanism of inhibiting effect of EDTANa2, we examined the effect of the saturation of EDTANa2 (0.15 mM) by the addition of excess cations (0.15 mM to 1.2 mM). As shown in Figure 5A, the adding of Mn2+ increased the biomass of mycelia, but the adding of Mg2+ and Ca2+ had no significant effect on mycelia biomass. In addition, when an additional 0.3 mM MgCl2, 0.3 mM CaCl2 or 0.15 mM FeCl3 was added into the media as sources of divalent ions to bind 0.15 mM EDTANa2, mycelial growth was not resumed. 0.15 mM EDTANa2 plus 0.3 mM Mn2+, however, rescued mycelial growth and morphology, which was similar to that in control wells not given EDTANa2 (Figure 5B). That indicated that the inhibiting effect of EDTANa2 was related to its function of chelation.
We further measured the trace element content of Fusarium hyphae in different treatments. As shown in Figure 5C, when EDTA and EDTANa2 were added to the medium, the Mg and Mn elements decreased as expected. However, the contents of Ca and Fe elements were not significantly changed after the addition of EDTA and EDTANa2. When an additional Mg2+ or Ca2+ was added into the medium containing EDTANa2, all the trace elements, except Mn, increased or showed no difference compared with the untreated group. The Mn was always in a deficient state in the mycelia treated by EDTA and EDTANa2 unless Mn2+ was added into the medium. These results suggested that intracellular Mn2+ was chelated by EDTANa2, resulting in cell wall and cell membrane defects.

2.6. Chitin Synthases are More Active in F. graminearum When Mn2+ Is Used as a Cofactor

To further study the mechanism of the EDTANa2 control effect, chitin synthases were extracted for enzymatic analysis. Unlike most chitin synthases in other fungi that used Mg2+ as the cofactor, chitin synthases in F. graminearum were more active when Mn2+ was used at the active site. The chitin synthases with 5 mM Mn2+ had a 26% higher activity than that with 5 mM Mg2+, indicating that chitin synthases in F. graminearum may use Mn2+ as the cofactor. The addition of 0.25 mM EDTANa2 into the reaction systems could decrease enzymatic activity by 40% and 44% after chelation of Mn2+ and Mg2+, respectively. However, chitin synthase in the Mn2+ reaction system still had a 33% higher activity than that in the Mg2+ reaction system. When the EDTANa2 concentration was increased to 1 mM, the activity of chitin synthase in the Mn2+ and Mg2+ reaction systems decreased to 0.09 and 0.11 nmol GlcNAc h−1 mg−1, respectively (Figure 6A). Consistent with this, the metal ion addition experiment showed that the chitin content returned to normal levels after the addition of 0.15 mM Mn2+ to SNA culture medium (containing 0.15 mM EDTANa2). While wells adding Mg2+ or Ca2+ produced equivalent chitin to wells adding EDTANa2 only, a 35–50% reduction was observed compared to the control group (Figure 6B).

3. Discussion

The genus Fusarium, which is pathogenic and toxic to plants and humans, is one of the most economically damaging fungal genera. Fusarium colonizes a wide range of environments, and control of Fusarium floral infections remains problematic. Some fungicides, including triazoles, benzimidazoles and strobilurins, are moderately effective, but reports of fungicide failure resulting from resistance have increased since the late 1960s [39,40]. To make matters worse, the development of new fungicides is much slower than the appearance of fungicide resistance in Fusarium populations [41,42]. Here, a nonantibiotic drug, EDTANa2, exhibited novel antifungal activity against F. graminearum and DON production. Through combined analyses of morphology, DON content and TRI gene expression detection, chitin detection, cell permeability, transmission electron microscopy and field experiments, we demonstrated that EDTANa2 destroyed cell wall and cytomembrane integrity and inhibited TRI gene expression in F. graminearum, and the antifungal effect of EDTANa2 relied on Mn2+-chelating abilities.
EDTA is considered as an ion chelator, and it has been recommended as an antimicrobial agent against bacteria and C. albicans [43,44,45]. The EC50 value of EDTANa2 for F. graminearum is 107.88 mg L−1, which is higher than that of carbendazim (about 0.5 mg L−1). The field test, however, shows that 70 g ha−1 EDTANa2 decreased the incidence of disease by 70% compared to 140 g ha−1 carbendazim treatment. As DON is an important virulence factor in wheat, previous studies suggest that significant decreases in FHB incidence in field situations are possible with proper DON inhibited fungicide applications [46]. In our study, the DON production was significantly inhibited by EDTANa2, which may increase the antifungal effects on FHB.
The fungal cell wall protects the cell against osmotic pressure and other environmental stresses and is considered the carbohydrate armor of the fungal cell [47]. After EDTANa2 treatment, all layers across the cell wall were affected, and the chitin content was decreased in Fusarium. In addition, the membrane permeability increased significantly when Fusarium was cultured in medium containing EDTANa2. This suggests that the fungal cells became more sensitive to changes in environmental stresses with EDTANa2 treatment.
Our next question was which divalent cation was chelated by EDTANa2 and then caused chitin content reduction and cell wall defects in Fusarium. There have been reports that calcium-binding agents inhibit Cryptococcus neoformans and C. albicans by disrupting the assembly of the polysaccharide capsule through Mg2+ and Ca2+ chelation [31,48,49]. However, the results in our paper showed that EDTANa2 chelated Mn2+ and resulted in a reduction of chitin synthesis. In fungi, chitin is synthesized by chitin synthase, whose activities are known to depend upon the presence of a divalent cation [50,51]. Chitin synthases (CHSs) in Fusarium were previously classified into seven categories [52]. Different chitin synthases are distinct in their responses to the divalent cation, for example, Chs2 and Chs3 are stimulated, while Chs1 is inhibited by Co2+ in Saccharomyces cerevisiae [53]. On the basis of the data obtained in our study, it may be logical to assume that Mn2+ is essential for the main chitin synthase of Fusarium. EDTA had a fungistatic effect on F. fujikuroi growth, a pathogen causing bakanae disease, and its action was largely suppressed by Mn2+ and slightly by Ca2+ [54]. Combining with our findings, we can speculate that this kind of chelating agent, such as EDTA and EDTANa2 inhibits Fusarium spp. mainly because of Mn2+ deficiency.
In summary, EDTANa2 inhibits DON production and disrupts the cell wall and cell membrane functionality of Fusarium, an effect that appears to mainly result from Mn2+ chelation. The results of our study provided new material and candidate compound against Fusarium in crop protection.

4. Materials and Methods

4.1. Fungi, Plants, and Culture Conditions

Fusarium graminearum strains PH-1, F. asiaticum strain 2021, F. acuminatum, F. avenaceum, F. concentricum, F. culmorum, F. equiseti, F. fujikuroi, F. lateritium, F. oxysporum, F. proliferatum, F. solani and F. verticillioides (Figure S1, Table S2) used in this study were stored in our laboratory [55]. The wheat variety Huaimai33 was maintained in our laboratory. Carboxymethyl cellulose (CMC) broth [56] and SNA medium (0.1% KH2PO4, 0.1% KNO3, 0.05% MgSO7H2O, 0.05% KCl, 0.02% glucose, and 0.02% sucrose) were used for conidia production and assessments of mycelial growth, respectively. EDTA (99%) and inorganic metal salts were purchased from Sigma-Aldrich (St. Louis, MO, USA).

4.2. Control Effect Measurement on Wheat Seedling Blight

The test was evaluated under controlled conditions using a completely randomized design with two replications for each treatment. Ten seedlings per treatment were inoculated on the fully expanded primary leaves 8 d after Huaimai33 planting. The EDTANa2 was sprayed on leaves at different concentration from 0.5 to 8 mM. After 24 h, leaves were punctured and inoculated with three microliter of macroconidia suspension (1 × 10⁶ spores mL−1). The lesions of diseased leaves were measured and photographed at 6th day post inoculation. Duncan’s multiple comparison test (SPSS20.0, IBM, Chicago, IL, USA) with a significant difference set as P < 0.05 was used to compare sample means. Mean values and standard deviations were reported. The differences between means with P less than 0.05 were considered statistically significant. The control effect was characterized by linear regression analysis (R = 0.94) using the SPSS statistical package.

4.3. Control Effect Measurement on Fusarium Head Blight and Phytotoxicity Field Test

The field study was conducted for two years (2018 and 2019) at the same location with different randomizations for each year (Table 1). Wheat (Triticum aestivum L. cv. Huaimai33) was grown on the experimental farm of Nanjing Agricultural University. At Zadok’s growth stage (ZGS) 65, while more than half of the wheat spikes were in bloom, field plots were arranged in a randomized block, which was designed with three 3 plots (each plot was 4 × 5 m). The treatments were as follows: (1) a control consisting of water; (2) 140 g ha−1 carbendazim; (3) 7 g ha−1 EDTANa2; (4) 70 g ha−1 EDTANa2. 7–4000 g ha−1 EDTANa2 were used for phytotoxicity assays. For floral spray inoculations, each plant was sprayed with 0.5 mL of 1 × 10⁴ spores mL−1 F. graminearum strain PH-1 conidia 24 h after EDTANa2 spray treatment. Pathogenicity assays were performed 14 or 21 days after EDTANa2 spray treatment as described previously [57]. The influence of EDTANa2 on wheat was tested by assessing browning spikelets. Thirty wheat heads were randomly selected to calculate the browning spikelets ratio for each concentration of EDTANa2. The browning spikelets ratio was defined as follows: browning spikelet (%) = browning spikelets/total spikelets. The experiment was replicated three times.

4.4. Mycelial Growth Inhibition by EDTANa2

For a fungicide-sensitivity assay in the laboratory, a three-day-old mycelial plug (5 mm in diameter) was placed in the center of a minimal medium (MM) (10 mM K2HPO4, 10 mM KH2PO4, 2.5 mM NaCl, 4 mM NH4NO3, 10 mM glucose) plate amended with EDTANa2 at 0, 0.1, 0.2, 0.4, 0.8, 1.6 mM (0, 37.2, 74.4, 148.8, 297.6, or 595.2 mg L−1). After 4 d at 25 °C, the colony diameters in two perpendicular directions of each plate were measured and averaged. Each combination of strain and concentration was represented by three biological replicates. The median effective concentration (EC50) value was calculated with DPS software (version 7.0, DPS Inc., Cary, NC, USA).

4.5. Optical, Scanning Electron Microscopy and Transmission Electron Microscopy Observation

Morphological observation of mycelia was performed using an inverted Olympus IX71 microscope (Olympus Canada, Markham, ON, Canada). Images were captured and analyzed by Image-Pro Plus 4.5 software (Media Cybernetics, Silver Spring, Maryland). Scanning electron microscopy (SEM) and transmission electron microscopy (TEM) were carried out using hyphae germinated from spores in SNA supplemented with 0.15 mM EDTANa2 at 25 °C for 24 h. All the cultures were performed in triplicate. For SEM determination, mycelia were fixed with 2.5% glutaraldehyde in 0.1 M sodium phosphate buffer (pH 7.2) at 4 °C for 12 h. The samples were then washed with sodium phosphate buffer (0.1 M, pH 7.2) and treated with 1% osmium tetroxide in sodium phosphate buffer for 1 h, subjected to gradual dehydration in ethanol (70, 80, 90 and 100%), and dried to the critical point (CPD 030 Critical Point BALTEC Dryer, Leica Microsystems, Liechtenstein). After drying, the samples were glued on stubs using carbon tape and coated with gold (Sputter Coater BALTEC SDC 050, Leica Microsystems, Liechtenstein). For TEM determination, sections were prepared and visualized using a H-7650 transmission electron microscope (Hitachi, Tokyo, Japan) as described by Song et al. [57].

4.6. Measurement of H2O2 and DON

H2O2 formation in the fungicide experiments was measured 4 h and 12 h after 0.4 mM or 0.8 mM EDTANa2 treatment using a TMB (tri-methyl-benzidin) assay [58]. H2O2 formation was determined by measuring the absorbance at 620 nm in duplicate in each time point and in three independent experiments. In each experiment, a standard curve of pure H2O2 was added in a concentration range of 0.01 mM up to 100 mM. The H2O2 formed in the in vitro assay was calculated based on this standard curve.
DON production in TBI cultures was assayed with a competitive ELISA-based DON detection plate kit (Wise, Zhenjiang, China) according to previous studies [59]. Ten microliter of conidia (1.5 × 10⁷/mL) were inoculated in 30 mL TBI and cultured at 28 °C for 24 h in dark, and then 0.4 mM or 0.8 mM EDTANa2 was added and cultured for additional 6 days. The experiment was repeated three times. To assay TRI gene expression, hyphae were harvested from 2-day-old TBI cultures (1 day after EDTANa2 adding) and used for RNA isolation. qPCR was performed as previously describe (Table S3) [57]. The tubulin gene of F. graminearum was used as the internal control. The results were calculated with the data from three biological replicates.

4.7. Chitin Content, Chitin Synthase Activity and Cell Membrane Permeability Measurement

Macroconidia (104 mL−1) were cultured in SNA, SNA amended with 0.15 mM EDTA or SNA amended with 0.15 mM EDTANa2 for 7 days and were used for chitin determination as previously described [57]. Fresh mycelium cultured in Czapek’s medium (3 g L1 of NaNO3, 1.31 g L1 of K2HPO4, 0.5 g L1 of KCl, 0.5 g L1 of MgSO4·7H2O, 0.01 g L1 of FeSO4·7H2O, 30 g L1 of sucrose, pH 7.2) for 5 d were collected and finely ground with liquid nitrogen for chitin synthase extraction. Chitin synthase activity was extracted and measured according to Song et al. [57] with some modifications. Chitin synthase activity was measured by following (14C) GlcNAc incorporation into the filter-retainable polymer in the presence of 0–1 mM EDTANa2 plus 5 mM Mg2+ or Mn2+. To measure the cell membrane permeability, macroconidia (final concentration was 103 mL−1) were inoculated into SNA, SNA with 0.3 mM NaCl, SNA with 0.15 mM EDTA or SNA with 0.15 mM EDTANa2 at 25 °C for 7 days. The conductivity was measured with a conductometer (CON510 Eutech/Oakton, Singapore) as described previously [60]. The conductivity of mycelia boiled for 5 min represented the final conductivity. The relative conductivity was calculated as follows: relative conductivity (%) = conductivity/final conductivity × 100. Three biological replicates were tested for each treatment.

4.8. Fungicidal Activity of EDTANa(n) against Fusarium spp.

Ten microliters of spores (104 mL−1) of F. graminearum PH-1 were plated in a 96-well flat bottom culture plate containing 0.15 mM EDTA, EDTANa2, EDTANa3 or EDTANa4 in 100 μL of SNA medium (pH 4.2). The plates were cultured at 25 °C for 24 h and observed using an inverted microscope. The growth and morphology of mycelia were photographed and compared among treatments using NIS-Elements AR software (version 3.2, Nikon, Tokyo, Japan). The experiment was replicated three times.
The determination of the minimum inhibitory concentration (MIC) was performed using 96-well microtiter plates. The Fusarium spp. (listed in ‘Fungi, plants, and culture conditions’) fungal inoculated in 96-well microtiter plates were treated with EDTANa2 at different concentrations and incubated for 24 or 36 h. The lowest concentration that demonstrated no visible growth was determined as the MIC. Measurements were repeated three times.

4.9. Effect of Metal Ions on EDTANa2 Activity

To assess whether cations would ameliorate the inhibitory effects of EDTANa2 on mycelial growth and chitin synthesis, an additional 0.3 mM MgCl2, 0.3 mM CaCl2, 0.3 mM MnCl2 or 0.15 mM FeCl3 was added into SNA medium separately to bind the preadded 0.15 mM EDTANa2, followed by inoculation at 25 °C for 24 h and subsequent micro-examination. Corresponding amounts of MgCl2, CaCl2, MnCl2 or FeCl3 were used as controls. Subsequently, a series of MgCl2, CaCl2 or MnCl2 concentrations (0, 0.15, 0.3, 0.45, 0.6, 1.2 mM) was added to the media to saturate the 0.15 mM EDTANa2 to different degrees, and the fungi were cultured for 52 h to measure the mycelial biomass at OD290. The mycelia that were treated with 0.3 mM cations were collected at 7 d, frozen and dried for chitin content and trace element measurements [61]. Three independent experiments were performed, and the average was calculated.

4.10. Statistical Analysis

Statistical analysis was performed using Duncan’s multiple comparison test (for multiple comparisons) and Student’s t-test, all at a significance level of 0.05.

Supplementary Materials

The following are available online at https://0-www-mdpi-com.brum.beds.ac.uk/2072-6651/13/1/17/s1, Table S1: Minimum inhibitory concentrations of EDTANa2; Table S2: Strains used in this study; Table S3: Primers used in TRI genes qPCR; Figure S1: Internal transcribed spacer (ITS) sequences alignment of Fusarium isolates used in this study. ITS sequences of different strains were amplified using primers ITS-F/ITS-R (ITS-F: TCCGTAGGTGAACCTGCGG, ITS-R: TCCTCCGCTTATTGATATGC). Sequences alignment was performed using NCBI Blastn (https://blast.ncbi.nlm.nih.gov/Blast.cgi) with default parameters.

Author Contributions

M.Z. conceived and designed the experiments. X.-S.S., K.-X.G. and J.G. performed the experiments and analyzed the data. J.-X.W. and S.-C.D. contributed reagents and materials. X.-S.S. wrote and revised the manuscript. All authors have read and agreed to the published version of the manuscript.

Funding

This research was supported by the National Natural Science Foundation of China (31730072) and the Fundamental Research Funds for the Central Universities (KYXK202011).

Conflicts of Interest

The authors declare no conflict of interest.

References

  1. Ma, L.J.; Geiser, D.M.; Proctor, R.H.; Rooney, A.P.; O’Donnell, K.; Trail, F.; Gardiner, D.M.; Manners, J.M.; Kazan, K. Fusarium pathogenomics. Annu. Rev. Microbiol. 2013, 67, 399–416. [Google Scholar] [CrossRef] [PubMed] [Green Version]
  2. Summerell, B.A. Resolving Fusarium: Current status of the genus. Annu. Rev. Phytopathol. 2019, 25, 323–339. [Google Scholar] [CrossRef] [PubMed]
  3. Nelson, P.E.; Dignani, M.C.; Anaissie, E.J. Taxonomy, biology, and clinical aspects of Fusarium species. Clin. Microbiol. Rev. 1994, 7, 479–504. [Google Scholar] [CrossRef] [PubMed]
  4. Bai, G.H.; Shaner, G. Management and resistance in wheat and barley to Fusarium head blight. Annu. Rev. Phytopathol. 2004, 42, 135–161. [Google Scholar] [CrossRef] [PubMed]
  5. Gordon, T.R. Fusarium oxysporum and the Fusarium Wilt Syndrome. Annu. Rev. Phytopathol. 2017, 55, 23–39. [Google Scholar] [CrossRef] [PubMed]
  6. Kazan, K.; Gardiner, D.M.; Manners, J.M. On the trail of a cereal killer: Recent advances in Fusarium graminearum pathogenomics and host resistance. Mol. Plant. Pathol. 2012, 13, 399–413. [Google Scholar] [CrossRef]
  7. Loffler, M.; Kessel, B.; Ouzunova, M.; Miedaner, T. Population parameters for resistance to Fusarium graminearum and Fusarium verticillioides ear rot among large sets of early, mid-late and late maturing European maize (Zea mays L.) inbred lines. Theor. Appl. Genet. 2010, 120, 1053–1062. [Google Scholar] [CrossRef]
  8. Xu, X.; Nicholson, P. Community ecology of fungal pathogens causing wheat head blight. Annu. Rev. Phytopathol. 2009, 47, 83–103. [Google Scholar] [CrossRef]
  9. Edwards, J.E., Jr.; Bodey, G.P.; Bowden, R.A.; Buchner, T.; de Pauw, B.E.; Filler, S.G.; Ghannoum, M.A.; Glauser, M.; Herbrecht, R.; Kauffman, C.A.; et al. International conference for the development of a consensus on the management and prevention of severe candidal infections. Clin. Infect Dis. 1997, 25, 43–59. [Google Scholar] [CrossRef]
  10. Treikale, O.; Priekule, I.; Javoisha, B.; Lazareva, L. Fusarium head blight: Distribution in wheat in Latvia. Commun. Agric. Appl. Biol. Sci. 2010, 75, 627–634. [Google Scholar]
  11. Pestka, J.J. Deoxynivalenol: Mechanisms of action, human exposure, and toxicological relevance. Arch. Toxicol. 2010, 84, 663–679. [Google Scholar] [CrossRef] [PubMed]
  12. Woloshuk, C.P.; Shim, W.B. Aflatoxins, fumonisins, and trichothecenes: A convergence of knowledge. Fems. Microbiol. Rev. 2013, 37, 94–109. [Google Scholar] [CrossRef] [PubMed] [Green Version]
  13. Brauer, E.K.; Balcerzak, M.; Rocheleau, H.; Leung, W.; Schernthaner, J.; Subramaniam, R.; Ouellet, T. Genome editing of a deoxynivalenol-induced transcription factor confers resistance to Fusarium graminearum in wheat. Mol. Plant Microbe Interact. 2020, 33, 553–560. [Google Scholar] [CrossRef] [PubMed]
  14. Dill-Macky, R.; Jones, R.K. The effect of previous crop residues and tillage on Fusarium head blight of wheat. Plant Dis. 2000, 84, 71–76. [Google Scholar] [CrossRef] [Green Version]
  15. McMullen, M.; Bergstrom, G.; De Wolf, E.; Dill-Macky, R.; Hershman, D.; Shaner, G.; Van Sanford, D. A unified effort to fight an enemy of wheat and barley: Fusarium head blight. Plant Dis. 2012, 96, 1712–1728. [Google Scholar] [CrossRef] [Green Version]
  16. D’Angelo, D.L.; Bradley, C.A.; Ames, K.A.; Willyerd, K.T.; Madden, L.V.; Paul, P.A. Efficacy of fungicide applications during and after anthesis against Fusarium head blight and deoxynivalenol in soft red winter wheat. Plant Dis. 2014, 98, 1387–1397. [Google Scholar] [CrossRef] [Green Version]
  17. Zhang, Y.J.; Yu, J.J.; Zhang, Y.N.; Zhang, X.; Cheng, C.J.; Wang, J.X.; Hollomon, D.W.; Fan, P.S.; Zhou, M.G. Effect of carbendazim resistance on trichothecene production and aggressiveness of Fusarium graminearum. Mol. Plant Microbe Interact. 2009, 22, 1143–1150. [Google Scholar] [CrossRef] [Green Version]
  18. Qiu, J.; Shi, J. Genetic relationships, carbendazim sensitivity and mycotoxin production of the Fusarium graminearum populations from maize, wheat and rice in eastern China. Toxins 2014, 6, 2291–2309. [Google Scholar] [CrossRef] [Green Version]
  19. Chen, C.J.; Wang, J.X.; Luo, Q.Q.; Yuan, S.K.; Zhou, M.G. Characterization and fitness of carbendazim-resistant strains of Fusarium graminearum (wheat scab). Pest. Manag. Sci. 2007, 63, 1201–1207. [Google Scholar] [CrossRef]
  20. Chen, Y.; Chen, C.; Wang, J.; Jin, L.; Zhou, M. Genetic study on JS399-19 resistance in hyphal fusion of Fusarium graminearum by using nitrate nonutilizing mutants as genetic markers. J. Genet. Genom. 2007, 34, 469–476. [Google Scholar] [CrossRef]
  21. Mikaberidze, A.; Paveley, N.; Bonhoeffer, S.; van den Bosch, F. Emergence of resistance to fungicides: The role of fungicide dose. Phytopathology 2017, 107, 545–560. [Google Scholar] [CrossRef] [PubMed] [Green Version]
  22. Al-Hatmi, A.M.; Meis, J.F.; de Hoog, G.S. Fusarium: Molecular diversity and intrinsic drug resistance. PLoS Pathog. 2016, 12, e1005464. [Google Scholar] [CrossRef] [PubMed]
  23. Cordova-Alcantara, I.M.; Venegas-Cortes, D.L.; Martinez-Rivera, M.A.; Perez, N.O.; Rodriguez-Tovar, A.V. Biofilm characterization of Fusarium solani keratitis isolate: Increased resistance to antifungals and UV light. J. Microbiol. 2019, 57, 485–497. [Google Scholar] [CrossRef] [PubMed]
  24. Muregi, F.W. Antimalarial drugs and their useful therapeutic lives: Rational drug design lessons from pleiotropic action of quinolines and artemisinins. Curr. Drug Discov. Technol. 2010, 7, 280–316. [Google Scholar] [CrossRef] [PubMed] [Green Version]
  25. Deising, H.B.; Reimann, S.; Pascholati, S.F. Mechanisms and significance of fungicide resistance. Braz. J. Microbiol. 2008, 39, 286–295. [Google Scholar] [CrossRef] [PubMed] [Green Version]
  26. Al-Bakri, A.G.; Othman, G.; Bustanji, Y. The assessment of the antibacterial and antifungal activities of aspirin, EDTA and aspirin-EDTA combination and their effectiveness as antibiofilm agents. J. Appl. Microbiol. 2009, 107, 280–286. [Google Scholar] [CrossRef]
  27. Taha, M.O.; Al-Bakri, A.G.; Zalloum, W.A. Discovery of potent inhibitors of pseudomonal quorum sensing via pharmacophore modeling and in silico screening. ACS Med. Chem. Lett. 2006, 16, 5902–5906. [Google Scholar] [CrossRef]
  28. Cikes, M.; Vranjesevic, B.; Tomic, M.; Jamnicky, O. A successful treatment of formation damage caused by high-density brine. Spe. Prod. Eng. 1990, 5, 175–179. [Google Scholar] [CrossRef]
  29. Crabtree, M.; Eslinger, D.; Fletcher, P.; Miller, M.; King, G. Fighting scale-removal and prevention. Oilfield Rev. 1999, 11, 30–45. [Google Scholar]
  30. Banin, E.; Brady, K.M.; Greenberg, E.P. Chelator-induced dispersal and killing of Pseudomonas aeruginosa cells in a biofilm. Appl. Environ. Microbiol. 2006, 72, 2064–2069. [Google Scholar] [CrossRef] [Green Version]
  31. Gil, M.L.; Casanova, M.; Martinez, J.P. Changes in the cell wall glycoprotein composition of Candida albicans associated to the inhibition of germ tube formation by EDTA. Arch. Microbiol. 1994, 161, 489–494. [Google Scholar] [CrossRef] [PubMed]
  32. Gray, G.W.; Wilkinson, S.G. The effect of ethylenediaminetetra-acetic acid on the cell walls of some gram-negative bacteria. J. Gen. Microbiol. 1965, 39, 385–399. [Google Scholar] [CrossRef] [PubMed] [Green Version]
  33. Ramage, G.; Wickes, B.L.; López-Ribot, J.L. Inhibition on Candida albicans biofilm formation using divalent cation chelators (EDTA). Mycopathologia 2007, 164, 301–306. [Google Scholar] [CrossRef] [PubMed]
  34. Saadat, M.; Roudbarmohammadi, S.; Yadegari, M.; Khavarinejad, R. Evaluation of antibacterial effects of catechin and EDTA on planktonic and biofilm cells of Pseudomonas aeruginosa. Malays. J. Microbiol. 2013, 9, 184–188. [Google Scholar] [CrossRef] [Green Version]
  35. Yakandawala, N.; Gawande, P.V.; LoVetri, K.; Madhyastha, S. Effect of ovotransferrin, protamine sulfate and EDTA combination on biofilm formation by catheter-associated bacteria. J. Appl. Microbiol. 2010, 102, 722–727. [Google Scholar] [CrossRef]
  36. Chauhan, A.A. Full and broad-spectrum in vivo eradication of catheter-associated biofilms using gentamicin-EDTA antibiotic lock therapy. Antimicrob. Agents Chemother. 2012, 56, 6310–6318. [Google Scholar] [CrossRef] [Green Version]
  37. Shaikh, A.I.; Musaddiq, M. Antibiotic-EDTA combination induced dispersal of Pseudomonas aeruginosa biofilm. J. Pure Appl. Microbiol. 2012, 6, 363–367. [Google Scholar]
  38. Bartnicki-Garcia, S. Cell wall chemistry, morphogenesis, and taxonomy of fungi. Annu. Rev. Microbiol. 1968, 22, 87–108. [Google Scholar] [CrossRef]
  39. Brent, K.J. Fungicide Resistance in Crop Pathogens: How Can It Be Managed? 2nd ed.; Fungicide Resistance Action Committee: Basel, Switzerland, 1995; Available online: http://www.frac.info (accessed on 27 December 2020).
  40. Dekker, J. Prospects for the use of systemic fungicides in view of the resistance problem. Lab. Phytopathol. 1976, 3, 60–66. [Google Scholar]
  41. Grimmer, M.K.; van den Bosch, F.; Powers, S.J.; Paveley, N.D. Evaluation of a matrix to calculate fungicide resistance risk. Pest Manag. Sci. 2014, 70, 1008–1016. [Google Scholar] [CrossRef] [PubMed]
  42. van den Bosch, F.; Gilligan, C.A. Models of fungicide resistance dynamics. Annu. Rev. Phytopathol. 2008, 46, 123–147. [Google Scholar] [CrossRef] [PubMed] [Green Version]
  43. Ates, M.; Akdeniz, B.G.; Sen, B.H. The effect of calcium chelating or binding agents on Candida albicans. Oral Surg. Oral. Med. Oral. Pathol. Oral. Radiol. Endod. 2005, 100, 626–630. [Google Scholar] [CrossRef] [PubMed]
  44. Ding, Q.; Alborzi, S.; Bastarrachea, L.J.; Tikekar, R.V. Novel sanitization approach based on synergistic action of UV-A light and benzoic acid: Inactivation mechanism and a potential application in washing fresh produce. Food Microbiol. 2018, 72, 39–54. [Google Scholar] [CrossRef] [PubMed]
  45. Lai, Y.-W.; Campbell, L.T.; Wilkins, M.R.; Pang, C.N.I.; Chen, S.; Carter, D.A. Synergy and antagonism between iron chelators and antifungal drugs in Cryptococcus. Int. J. Antimicrob. Agents 2016, 48, 388–394. [Google Scholar] [CrossRef] [PubMed]
  46. Mesterhazy, A.; Toth, B.; Varga, M.; Bartok, T.; Szabo-Hever, A.; Farady, L.; Lehoczki-Krsjak, S. Role of fungicides, application of nozzle types, and the resistance level of wheat varieties in the control of Fusarium head blight and deoxynivalenol. Toxins 2011, 3, 1453–1483. [Google Scholar] [CrossRef] [Green Version]
  47. Latge, J.P. The cell wall: A carbohydrate armour for the fungal cell. Mol. Microbiol. 2007, 66, 279–290. [Google Scholar] [CrossRef]
  48. Holmes, A.R.; Cannon, R.D.; Shepherd, M.G. Effect of calcium ion uptake on Candida albicans morphology. FEMS Microbiol. Lett. 2010, 77, 187–194. [Google Scholar] [CrossRef]
  49. Robertson, E.J.; Wolf, J.M.; Casadevall, A. EDTA inhibits biofilm formation, extracellular vesicular secretion, and shedding of the capsular polysaccharide glucuronoxylomannan by Cryptococcus neoformans. Appl. Environ. Microbiol. 2012, 78, 7977–7984. [Google Scholar] [CrossRef] [Green Version]
  50. Choi, W.J.; Cabib, E. The use of divalent cations and pH for the determination of specific yeast chitin synthetases. Anal. Biochem. 1994, 219, 368. [Google Scholar] [CrossRef]
  51. Choi, W.J.; Sburlati, A.; Cabib, E. Chitin synthase 3 from yeast has zymogenic properties that depend on both the CAL1 and the CAL3 genes. Proc. Natl. Acad. Sci. USA 1994, 91, 4727–4730. [Google Scholar] [CrossRef] [PubMed] [Green Version]
  52. Cheng, W.; Song, X.S.; Li, H.P.; Cao, L.H.; Sun, K.; Qiu, X.L.; Xu, Y.B.; Yang, P.; Huang, T.; Zhang, J.B.; et al. Host-induced gene silencing of an essential chitin synthase gene confers durable resistance to Fusarium head blight and seedling blight in wheat. Plant Biotechnol. J. 2015, 13, 1335–1345. [Google Scholar] [CrossRef] [PubMed]
  53. Orlean, P. Two chitin synthases in Saccharomyces cerevisiae. J. Biol. Chem. 1987, 262, 5732–5739. [Google Scholar] [PubMed]
  54. Kim, S.W.; Park, J.K.; Lee, C.H.; Hahn, B.S.; Koo, J.C. Comparison of the antimicrobial properties of chitosan oligosaccharides (COS) and EDTA against Fusarium fujikuroi causing rice bakanae disease. Curr. Microbiol. 2016, 72, 496–502. [Google Scholar] [CrossRef]
  55. Chen, Y.; Zhou, M.G. Characterization of Fusarium graminearum isolates resistant to both carbendazim and a new fungicide JS399-19. Phytopathology 2009, 99, 441–446. [Google Scholar] [CrossRef] [Green Version]
  56. Duvick, J.P.; Rood, T.; Rao, A.G.; Marshak, D.R. Purification and characterization of a novel antimicrobial peptide from maize (Zea mays L.) kernels. J. Biol. Chem. 1992, 267, 18814–18820. [Google Scholar]
  57. Song, X.S.; Li, H.P.; Zhang, J.B.; Song, B.; Huang, T.; Du, X.M.; Gong, A.D.; Liu, Y.K.; Feng, Y.N.; Agboola, R.S.; et al. Trehalose 6-phosphate phosphatase is required for development, virulence and mycotoxin biosynthesis apart from trehalose biosynthesis in Fusarium graminearum. Fungal. Genet. Biol. 2014, 63, 24–41. [Google Scholar] [CrossRef]
  58. Audenaert, K.; Callewaert, E.; Hofte, M.; De Saeger, S.; Haesaert, G. Hydrogen peroxide induced by the fungicide prothioconazole triggers deoxynivalenol (DON) production by Fusarium graminearum. BMC Microbiol. 2010, 10, 112. [Google Scholar] [CrossRef] [Green Version]
  59. Zhou, Z.; Duan, Y.; Zhou, M. Carbendazim-resistance associated β2-tubulin substitutions increase deoxynivalenol biosynthesis by reducing the interaction between β2-tubulin and IDH3 in Fusarium graminearum. Environ. Microbiol. 2020, 22, 598–614. [Google Scholar] [CrossRef]
  60. Xu, C.; Hou, Y.; Wang, J.; Yang, G.; Liang, X.; Zhou, M. Activity of a novel strobilurin fungicide benzothiostrobin against Sclerotinia sclerotiorum. Pestic Biochem. Physiol. 2014, 115, 32–38. [Google Scholar] [CrossRef]
  61. Valentin, J.L.; Watling, R.J. Provenance establishment of coffee using solution ICP-MS and ICP-AES. Food Chem. 2013, 141, 98–104. [Google Scholar] [CrossRef] [PubMed]
Figure 1. The antifungal activity of ethylenediaminetetraacetic acid disodium salt (EDTANa)(n) against Fusarium graminearum. (A) The influence of sodium ion on EDTA effects. Conidia of F. graminearum were grown in SNA (1 g L−1 KH2PO4, 1.0 g L−1 KNO3, 0.5 g L−1 MgSO4˙7H2O, 0.5 g L−1 KC1, 0.2 g L−1 glucose, 0.2 g L−1 sucrose) medium with 0.15 mM EDTANa(n) (n = 0, 2, 3 or 4; pH 4.2) and were photographed after 24 h of cultivation. The effect of sodium ions was assayed by replacing EDTANa(n) with NaCl and was used as the second control group. Each right panel is an enlarged view of the area in the black box in the left panel. The arrows indicate conglobate structures after 24 h in response to EDTANa(n). The experiment was repeated three times with the same patterns. (B) Sensitivities of F. graminearum to EDTANa2. The measurement was performed on minimal medium (MM) after 4 d at 25 °C. Photos were taken 3 days after incubation. The experiment was repeated three times with the same patterns.
Toxins 13 00017 g001
Figure 2. Control effect and phytotoxicity test of EDTANa2. (A) Control effect of EDTANa2 on wheat seedling blight in laboratory. The test was designed with two random replications for each race of plant. Ten seedlings per treatment were inoculated with macroconidia suspension 24 h after EDTANa2 spray. The lesions of diseased leaves were measured and photographed on sixth day post inoculation. Different letters represent a significant difference at p < 0.05. A linear regression equation of the percentage control effect for each EDTANa2 concentration was developed using the SPSS 20.0 (IBM, Chicago, IL, USA) statistical package (y = 4.67 + 3.329x, R = 0.9476). (B) Control effect of EDTANa2 on Fusarium head blight in the field. Wheat spikelets (cultivar Huaimai33) were sprayed with water, 40% carbendazim (140 g ha−1), or EDTANa2. Twenty-four hours later, the spikelets were inoculated via a spray inoculation experiment with a conidial suspension. Each combination of fungicide treatment and fungus was represented by 30 heads. After 21 days, the percentages of infected spikelets were determined, and representative heads were photographed. Values are means ± SD. Different letters represent a significant difference at P < 0.05. (C) Phytotoxicity test of EDTANa2 in the field. Wheat spikelets (cultivar Huaimai33) were sprayed with EDTANa2 and photographed at 21 days post inoculation. The data are an average ± standard error from 30 randomly selected heads. The experiment was replicated three times.
Toxins 13 00017 g002
Figure 3. Effect of EDTANa2 on production of deoxynivalenol (DON) (A), H2O2 concentrations (B) and TRI genes expression (C). DON content was determined using a competitive ELISA approach 7 d after start of the experiments. The experiment was repeated three times. H2O2 was measured at 4 h and 12 h and calculated based on a standard curve included in each experiment. TRI gene expression was assayed by qRT-PCR. Hyphae were harvested from 2-day-old TBI cultures (1 day after EDTANa2 adding). Data are represented as the means ± SD of three biological replicates (significant differences at * p < 0.05).
Toxins 13 00017 g003
Figure 4. Effects of EDTANa2 on Fusarium cell wall formation and cell permeability. (A) Scanning electron microscopy of hyphae of Fusarium graminearum treated with or without EDTANa2. (B) Transmission electron microscopy of hyphae of F. graminearum treated with or without EDTANa2. The right panel is an enlarged view of the area in the black box in the left panel. CW, cell wall; EL, external electron-dense layer; ML, middle electron-dense layer; IL, internal electron-dense layer; PM, plasma membrane. Chitin content (C) and relative conductivity assay (D) of F. graminearum treated with 0.3 mM NaCl, 0.15 mM EDTA or EDTANa2. The experiment was performed in triplicate. Different letters represent a significant difference at p < 0.05.
Toxins 13 00017 g004
Figure 5. (A) EDTANa2 saturation with Mg2+, Ca2+ and Mn2+ induces the resumption of mycelial growth. The mycelial biomass was measured after 52 h of incubation as from MgCl2, CaCl2 or MnCl2 adding. Mycelial biomass was expressed as absorbance. (B) Effects of different cations on EDTANa2 activity against Fusarium graminearum. The right panel is an enlarged view of the area in the black box in the left panel. The arrows indicate conglobate structures. The same amounts of cations were added to the medium as controls. The experiment was repeated three times with the same patterns. (C) Concentration of selected trace elements in fungi treated with 0.15 mM EDTANa2 or 0.15 mM EDTANa2 plus 0.3 mM additional cations. Mycelial biomass and trace element assays were performed using three biological replicates for each group.
Toxins 13 00017 g005
Figure 6. Chitin synthase activity and chitin content assay of Fusarium graminearum. (A) Chitin synthase activity was measured following (14C) GlcNAc incorporation into the filter-retainable polymer in the presence of Mg2+ or Mn2+. Data are expressed as nmol of GlcNAc incorporated per hour per mg of protein. (B) Mycelia were treated with EDTANa2 or EDTANa2 with additional cations. EDTANa2 (0.15 mM) was saturated by adding Mg2+, Ca2+ or Mn2+ (0.45 mM) to SNA media. Data are represented as the means ± SD of three biological replicates (* indicates significant differences at p < 0.05 compared to CK).
Toxins 13 00017 g006
Table 1. Climate conditions in the field study.
YearExperimental DateRainy PeriodTemperature a (°C)
TavTmaxTmin
201820 Apr.–4 May.21 Apr.–23 Apr., 29 Apr.–1 May213011
201920 Apr.–11 May.21 Apr., 27 Apr. and 28 Apr.18309
a Data represent the average of the daily mean (Tav), minimum (Tmin) and maximum (Tmax) temperatures recorded during each experimental period.
Publisher’s Note: MDPI stays neutral with regard to jurisdictional claims in published maps and institutional affiliations.

