Variation of Aflatoxin Levels in Stored Edible Seed and Oil Samples and Risk Assessment in the Local Population

 ,
,  ,
,  ,
,  ,
,  and
and
Abstract
:1. Introduction
2. Results and Discussion
2.1. HPLC Method Validation
2.2. Occurrence of Afs in Inedible Seeds and Oil Samples
3. Dietary Assessment of Aflatoxins in Edible Oil Samples
4. Conclusions
5. Methodology
5.1. Sampling
5.2. Chemicals and Reagents
5.3. Edible Seed Samples and Aflatoxins Extraction
5.4. Oil Samples and Extraction of Aflatoxins
5.5. HPLC Conditions
5.6. Dietary Intake Assessment
5.7. Statistical Analysis
Author Contributions
Funding
Institutional Review Board Statement
Informed Consent Statement
Data Availability Statement
Acknowledgments
Conflicts of Interest
References
- FAO; IFAD; UNICEF; WFP; WHO. The State of Food Security and Nutrition in the World 2020. In Transforming Food Systems for Affordable Healthy Diets FAO; FAO: Rome, Italy, 2020; 320p. [Google Scholar] [CrossRef]
- Iqbal, S.; Sherazi, S.T.H.; Bhanger, M.I. The vegetable oil industry in Pakistan. Econ. World Trade 2005, 18. [Google Scholar]
- Ferozi, M. Edible Oil and Pakistan. Available online: https://dailytimes.com.pk/860903/edible-oils-and-pakistan/ (accessed on 26 July 2022).
- Set, E.; Erkmen, O. The aflatoxin contamination of ground red pepper and pistachio nuts sold in Turkey. Food Chem. Toxicol. 2010, 48, 2532–2537. [Google Scholar] [CrossRef] [PubMed]
- Razis, A.F.A.; Shehzad, M.M.; Usman, S.; Ali, N.B.; Iqbal, S.Z.; Naheed, N.; Asi, M.R. Seasonal Variation in Aflatoxin Levels in Edible Seeds, Estimation of Its Dietary Intake and Vitamin E Levels in Southern Areas of Punjab, Pakistan. Int. J. Environ. Res. Public Health 2020, 17, 8964. [Google Scholar] [CrossRef] [PubMed]
- Iqbal, S.Z.; Malik, S.; Asi, M.R.; Jinap, S.; Malik, N. Natural occurrence of patulin in different fruits, juices and smoothies and evaluation of dietary intake in Punjab, Pakistan. Food Contr. 2018, 84, 370–374. [Google Scholar] [CrossRef]
- Wenndt, A.; Sudini, H.K.; Pingali, P.; Nelson, R. Exploring aflatoxin contamination and household-level exposure risk in diverse Indian food systems. PLoS ONE 2020, 15, e0240565. [Google Scholar] [CrossRef] [PubMed]
- Ogungbemile, O.A.; Etaware, P.M.; Odebode, A.C. Aflatoxin Detection and Quantification in Stored Cowpea Seeds in Ibadan, Nigeria. J. Biomed. Biotechnol. 2020, 3, 10–17. [Google Scholar] [CrossRef]
- Iqbal, S.Z.; Mehmood, Z.; Asi, M.R.; Shahid, M.; Sehar, M.; Malik, N. Co-occurrence of aflatoxins and ochratoxin A in nuts, dry fruits, and nuty products. J. Food Saf. 2018, 38, e12462. [Google Scholar] [CrossRef]
- Iqbal, S.Z.; Asi, M.R.; Nisar, S.; Zia, K.M.; Jinap, S.; Malik, N. A Limited Survey of Aflatoxins and Zearalenone in Feed and Feed Ingredients from Pakistan. J. Food Prot. 2016, 79, 1798–1801. [Google Scholar] [CrossRef]
- IARC. Overall evaluations of carcinogenicity. Some naturally occurring substances: Food items and constituents, heterocyclic aromatic amines and mycotoxins. In IARC Monographs on Evaluation of Carcinogenic Risk to Humans. 1993, No. 56. Lyons, France; World Health Organization: Geneva, Switzerland, 1993. [Google Scholar]
- Iqbal, S.Z.; Asi, M.R.; Malik, N. The seasonal variation of aflatoxin M1 in milk and dairy products and assessment of dietary intake in Punjab, Pakistan. Food Contr. 2017, 79, 292–296. [Google Scholar] [CrossRef]
- Wangia, R.N.; Tang, L.; Wang, J.S. Occupational exposure to aflatoxins and health outcomes: A review. J. Environ. Sci. Health Part C Environ. Carcinog. Rev. 2019, 37, 215–234. [Google Scholar] [CrossRef]
- Robert, H.; Payros, D.; Pinton, P.; Théodorou, V.; Mercier-Bonin, M.; Oswald, I.P. Impact of mycotoxins on the intestine: Are mucus and microbiota new targets? J. Toxicol. Environ. Health Part B Crit. Rev. 2017, 20, 249. [Google Scholar] [CrossRef] [PubMed]
- Jin, S.; Yang, H.; Jiao, Y.; Pang, Q.; Wang, Y.; Wang, M.; Shan, A.; Feng, X. Dietary Curcumin Alleviated Acute Ileum Damage of Ducks (Anas platyrhynchos) Induced by AFB1 through Regulating Nrf2-ARE and NF-κB Signaling Pathways. Foods 2021, 10, 1370. [Google Scholar] [CrossRef] [PubMed]
- El-Sayed Mostafa, H.; Ahmed Allithy, A.N.; Abdellatif, N.A.; Anani, M.; Fareed, S.A.; El-Shafei, D.A.; Alaa El-Din, E.A. Amelioration of Pulmonary Aflatoxicosis by Green Tea Extract: An in Vivo Study. Toxicon 2021, 189, 48–55. [Google Scholar] [CrossRef] [PubMed]
- Zhou, H.; Wang, J.; Ma, L.; Chen, L.; Guo, T.; Zhang, Y.; Dai, H.; Yu, Y. Oxidative DNA Damage and Multi-Organ Pathologies in Male Mice Subchronically Treated with Aflatoxin B1. Ecotoxicol. Environ. Saf. 2019, 186, 109697. [Google Scholar] [CrossRef] [PubMed]
- Akinrinde, A.S.; Adebiyi, O.E.; Asekun, A. Amelioration of Aflatoxin B1-Induced Gastrointestinal Injuries by Eucalyptus Oil in Rats. J. Complement. Integr. Med. 2019, 17, 1–11. [Google Scholar] [CrossRef]
- Pu, J.; Yuan, Q.; Yan, H.; Tian, G.; Chen, D.; He, J.; Zheng, P.; Yu, J.; Mao, X.; Huang, Z.; et al. Effects of Chronic Exposure to Low Levels of Dietary Aflatoxin B1 on Growth Performance, Apparent Total Tract Digestibility and Intestinal Health in Pigs. Animals 2021, 11, 336. [Google Scholar] [CrossRef]
- Hernández-Ramírez, J.O.; Nava-Ramírez, M.J.; Merino-Guzmán, R.; Téllez-Isaías, G.; Vázquez-Durán, A.; Méndez-Albores, A. The Effect of Moderate-Dose Aflatoxin B1 and Salmonella Enteritidis Infection on Intestinal Permeability in Broiler Chickens. Mycotoxin Res. 2020, 36, 31–39. [Google Scholar] [CrossRef]
- Pickova, D.; Ostry, V.; Toman, J.; Malir, F. Aflatoxins: History, Significant Milestones, Recent Data on Their Toxicity and Ways to Mitigation. Toxins 2021, 13, 399. [Google Scholar] [CrossRef]
- Karunarathna, N.B.; Fernando, C.J.; Munasinghe, D.M.S.; Fernando, R. Occurrence of aflatoxins in edible vegetable oils in Sri Lanka. Food Contr. 2019, 101, 97–103. [Google Scholar] [CrossRef]
- Bordin, K.; Sawada, M.M.; da Costa Rodrigues, C.E.; da Fonseca, C.R.; Oliveira, C.A.F. Incidence of aflatoxins in oil seeds and possible transfer to oil: A review. Food Eng. Rev. 2014, 6, 20–28. [Google Scholar] [CrossRef]
- Banu, N.; Muthumary, J. Aflatoxin B1 contamination in sunflower oil collected from sunflower oil refinery situated in Karnataka. Health 2010, 2, 973. [Google Scholar] [CrossRef]
- Ferracane, R.; Tafuri, A.; Logieco, A.; Galvano, F.; Balzano, D.; Ritieni, A. Simultaneous determination of aflatoxin B1 and ochratoxin A and their natural occurrence in Mediterranean virgin olive oil. Food Addit. Contam. 2007, 24, 173–180. [Google Scholar] [CrossRef]
- Mariod, A.A.; Idris, Y.M.A. Aflatoxin B1 levels in groundnut and sunflower oils in different Sudanese states. Food Addit Contam Part B. 2015, 8, 266–270. [Google Scholar]
- Waqas, M.; Iqbal, S.Z.; Razis, A.F.A.; Pervaiz, W.; Ahmad, T.; Usman, S.; Ali, N.B.; Asi, M.R. Occurrence of Aflatoxins in Edible Vegetable Seeds and Oil Samples Available in Pakistani Retail Markets and Estimation of Dietary Intake in Consumers. Int. J. Environ. Res. Public Health. 2021, 18, 8015. [Google Scholar] [CrossRef]
- Yeboah, A.; Ahiakpa, J.K.; Adjei-Nsiah, S. Aflatoxin levels in seeds of commonly grown groundnut varieties (Arachis hypogaea L.) in Ghana as influenced by storage method. African J. Food, Agric. Nutr. Dev. 2020, 20, 15402–15414. [Google Scholar] [CrossRef]
- Mohammed, S.; Munissi, J.J.E.; Nyandoro, S.S. Aflatoxins in sunflower seeds and unrefined sunflower oils from Singida, Tanzania. Food Addit. Contam. Part B 2018, 11, 161–166. [Google Scholar] [CrossRef]
- Beheshti, H.R.; Asadi, M. Aflatoxins in sunflower and safflower seeds from Iran. Food Addit. Contam. Part B 2013, 6, 68–71. [Google Scholar] [CrossRef] [PubMed]
- Nabizadeh, S.; Shariatifar, N.; Shokoohi, E.; Shoeibi, S.; Gavahian, M.; Fakhri, Y.; Khaneghah, A.M. Prevalence and probabilistic health risk assessment of aflatoxins B1, B2, G1, and G2 in Iranian edible oils. Environ. Sci. Pollut. Res. 2018, 25, 35562–35570. [Google Scholar] [CrossRef] [PubMed]
- Shar, Z.H.; Pirkash, O.; Shar, H.H.; Sherazi, S.T.H.; Mahesar, S.A. Aflatoxins in cotton seeds and cotton seed cake from Pakistan. Food Addit Contam: Part B 2020, 13, 72–76. [Google Scholar] [CrossRef]
- Nesci, A.; Barra, P.; Etcheverry, M. Integrated management of insect vectors of Aspergillus flavus in stored maize using synthetic antioxidants and natural phytochemicals. J. Stored Prod. Res. 2011, 47, 231–237. [Google Scholar] [CrossRef]
- 34 Nesci, A.; Montemarani, A.; Passone, M.A.; Etcheverry, M. Insecticidal activity of synthetic antioxidants, natural phytochemicals, and essential oils against an Aspergillus section Flavi vector (Oryzaephilus surinamensis L.) in microcosm. J. Pest. Sci. 2011, 84, 107–115. [Google Scholar] [CrossRef]
- Okello, D.K.; Kaaya, A.N.; Bisikwa, J.; Were, M.; Olota, H.K. Management of Aflatoxins in groundnut: Manual for farmers, processors, traders and consumers in Uganda; Makerere University, National Agricultural Research Organisation: Kampala, Uganda, 2010. [Google Scholar]
- Sugri, I.; Osiru, M.; Larbi, A.; Buah, S.S.; Nutsugah, S.K.; Asieku, Y.; Lamini, S. Aflatoxin manage ment in Northern Ghana: Current prevalence and priority strategies in maize (Zea mays L). J. Stored Prod. Postharvest. Res. 2015, 6, 48e55. [Google Scholar]
- Temba, M.C.; Njobeh, P.B.; Kayitesi, E. Storage stability of maize-groundnut composite flours and an assessment of aflatoxin B1 and ochratoxin A contamination in flours and porridges. Food Control. 2017, 71, 178–186. [Google Scholar] [CrossRef]
- Hell, K.; Cardwell, K.F.; Setamou, M.; Poehling, H.M. The influence of storage practices on aflatoxin contamination in maize in four agroecological zones of Benin, West Africa. J. Stored Prod. Res. 2000, 36, 365–382. [Google Scholar] [CrossRef]
- Iqbal, S.Z.; Razis, A.F.A.; Usman, S.; Ali, N.B.; Asi, M.R. Variation of Deoxynivalenol Levels in Corn and Its Products Available in Retail Markets of Punjab, Pakistan, and Estimation of Risk Assessment. Toxins 2021, 13, 296. [Google Scholar] [CrossRef] [PubMed]
- Fels-Klerx, H.J.V.D.; Klemsdal, S.; Hietaniemi, V.; Lindblad, M.; Ioannou-Kakouri, E.; Van Asselt, E.D. Mycotoxin contamination of cereal grain commodities in relation to climate in North West Europe. Food Addit. Contam. Part A 2012, 29, 1581–1592. [Google Scholar] [CrossRef] [PubMed]
- Shapira, R.; Paster, N. Control of mycotoxins in storage and techniques for their decontamination. In Mycotoxins in Food: Detection and Control; Olsen, M.N., Ed.; Elsevier Science: Cambridge, UK, 2004; pp. 190–223. [Google Scholar]
- Okello, D.K.; Biruma, M.; Deom, C.M. Overview of groundnuts research in Uganda: Past, present and future. Afr. J. Biotechnol. 2010, 9, 6448–6459. [Google Scholar]
- Waqas, M.; Pervaiz, W.; Zia, K.M.; Iqbal, S.Z. Assessment of aflatoxin B1 in animal feed and aflatoxin M1 in raw milk samples of different species of milking animals from Punjab, Pakistan. J. Food Safe. 2021, 41, e12893. [Google Scholar]
- AOAC. Official methods of analysis. In Association of Official Analytical Chemists, 16th ed.; AOAC: Washington, DC, USA, 2007. [Google Scholar]
- AOAC. International Official Methods of Analysis of AOAC International, 18th ed.; Association of Analytical Communities: Gaithersburg, MD, USA, 2008. [Google Scholar]
- Iqbal, S.Z.; Asi, M.R.; Hanif, U.; Zuber, M.; Jinap, S. The presence of aflatoxins and ochratoxin A in rice and rice products; and evaluation of dietary intake. Food Chem. 2016, 210, 135–140. [Google Scholar] [CrossRef]
- Iqbal, S.Z.; Asi, M.R.; Zuber, M.; Akhtar, J.; Saif, M.J. Natural occurrence of aflatoxins and ochratoxin A in commercial chilli and chilli sauce samples. Food Contr. 2013, 30, 621. [Google Scholar] [CrossRef]


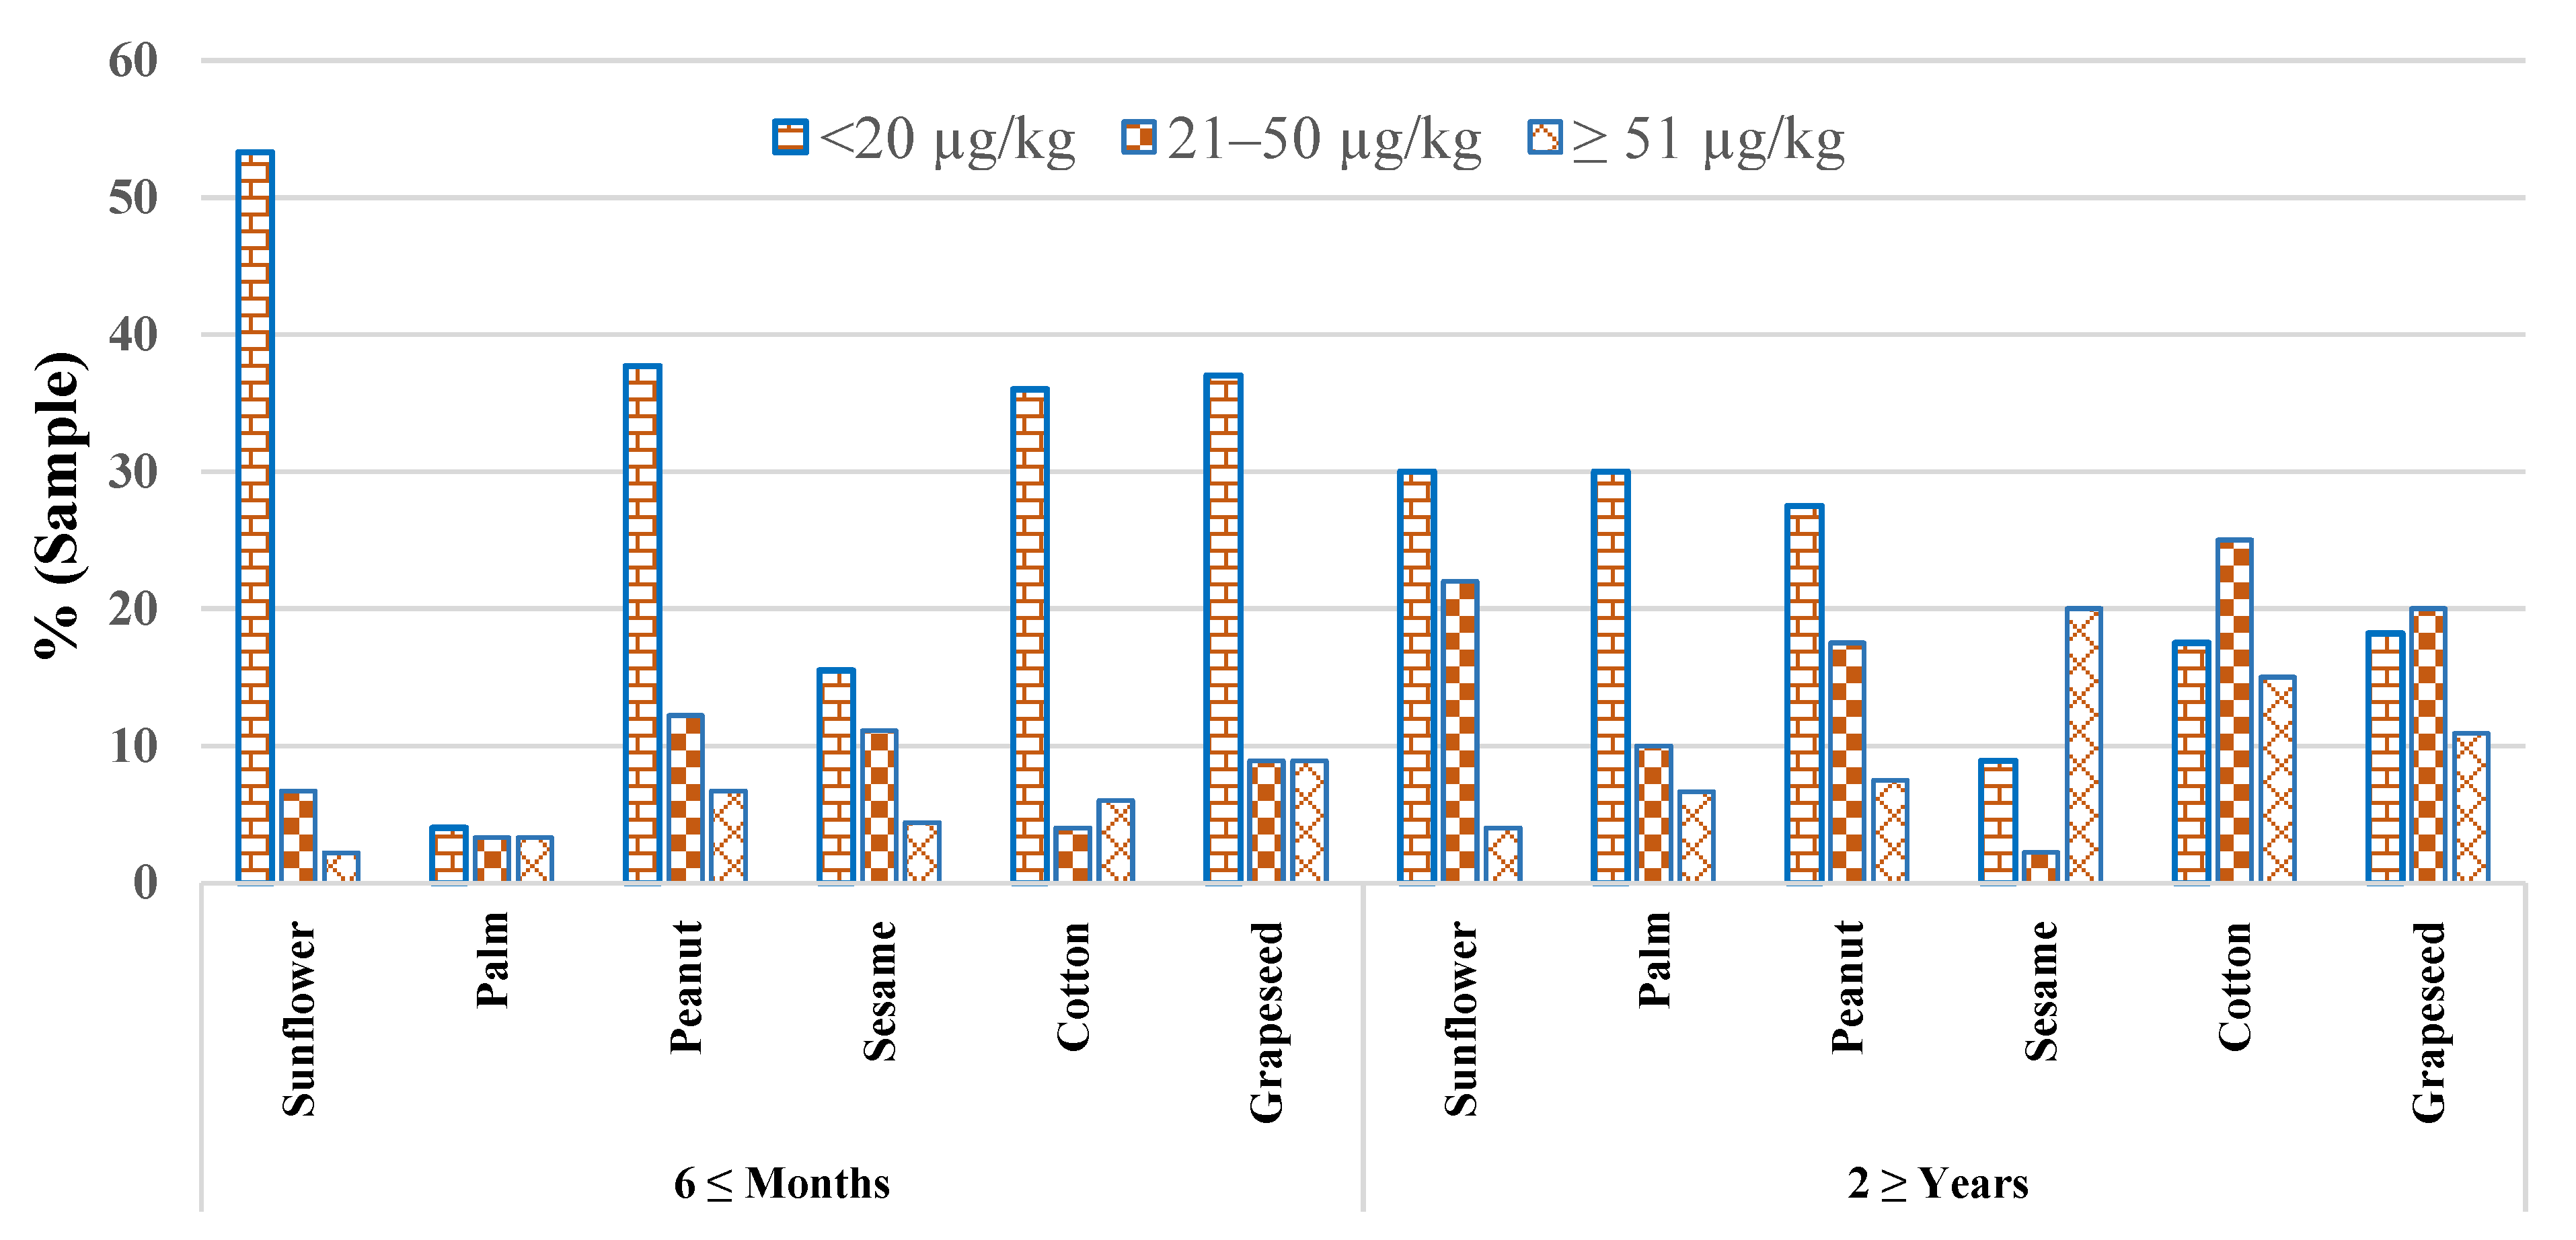
| Sample Category | 6 ≤ Months Storage Period | 2 ≥ Years Storage Period | ||||||||
|---|---|---|---|---|---|---|---|---|---|---|
| Samples | Positive | Mean AFB1 | Mean AFs | Range Total AFs | Sample | Positive | Mean AFB1 | Mean AFs | Range Total AFs | |
| n | n (%) | µg/kg | µg/kg | µg/kg | n | n (%) | µg/kg | µg/kg | µg/kg | |
| Sunflower | 45 | 28 (62.2) | 11.9 ± 2.5 | 14.3 ± 1.80 ** | LOD-98.6 | 50 | 28 (56.0) | 15.1 ± 3.4 | 22.5 ± 6.5 ** | LOD-112.5 |
| Palm | 30 | 14 (46.6) | 9.96 ± 2.4 | 11.7 ± 1.90 ** | LOD-65.5 | 30 | 14 (46.6) | 16.5 ± 6.5 | 25.8 ± 7.4 ** | LOD-110.5 |
| Peanut | 45 | 21 (46.6) | 18.24 ± 3.4 | 20.9 ± 3.70 ** | LOD-98.6 | 40 | 21 (52.5) | 28.2 ± 8.5 | 36.4 ± 9.1 ** | LOD-170.8 |
| Sesame | 45 | 14 (31.1) | 22.1 ± 2.5 | 24.6 ± 4.50 ** | LOD-60.5 | 45 | 14 (31.1) | 28.6 ± 4.5 | 51.3 ± 10.4 ** | LOD-75.5 |
| Cotton | 50 | 23 (46.0) | 23.6 ± 4.5 | 25.3 ± 5.60 ** | LOD-125.8 | 40 | 23 (57.5) | 26.2 ± 6.5 | 41.9 ± 9.4 ** | LOD-145.5 |
| Grapeseed | 45 | 25 (55.5) | 24.0 ± 4.6 | 29.1 ± 7.50 ** | LOD-175.5 | 55 | 27 (49.0) | 27.8 ± 7.6 | 45.4 ± 11.3 ** | LOD-155.75 |
| Total | 260 | 125 (48.1) | 260 | 127 (48.8) | ||||||
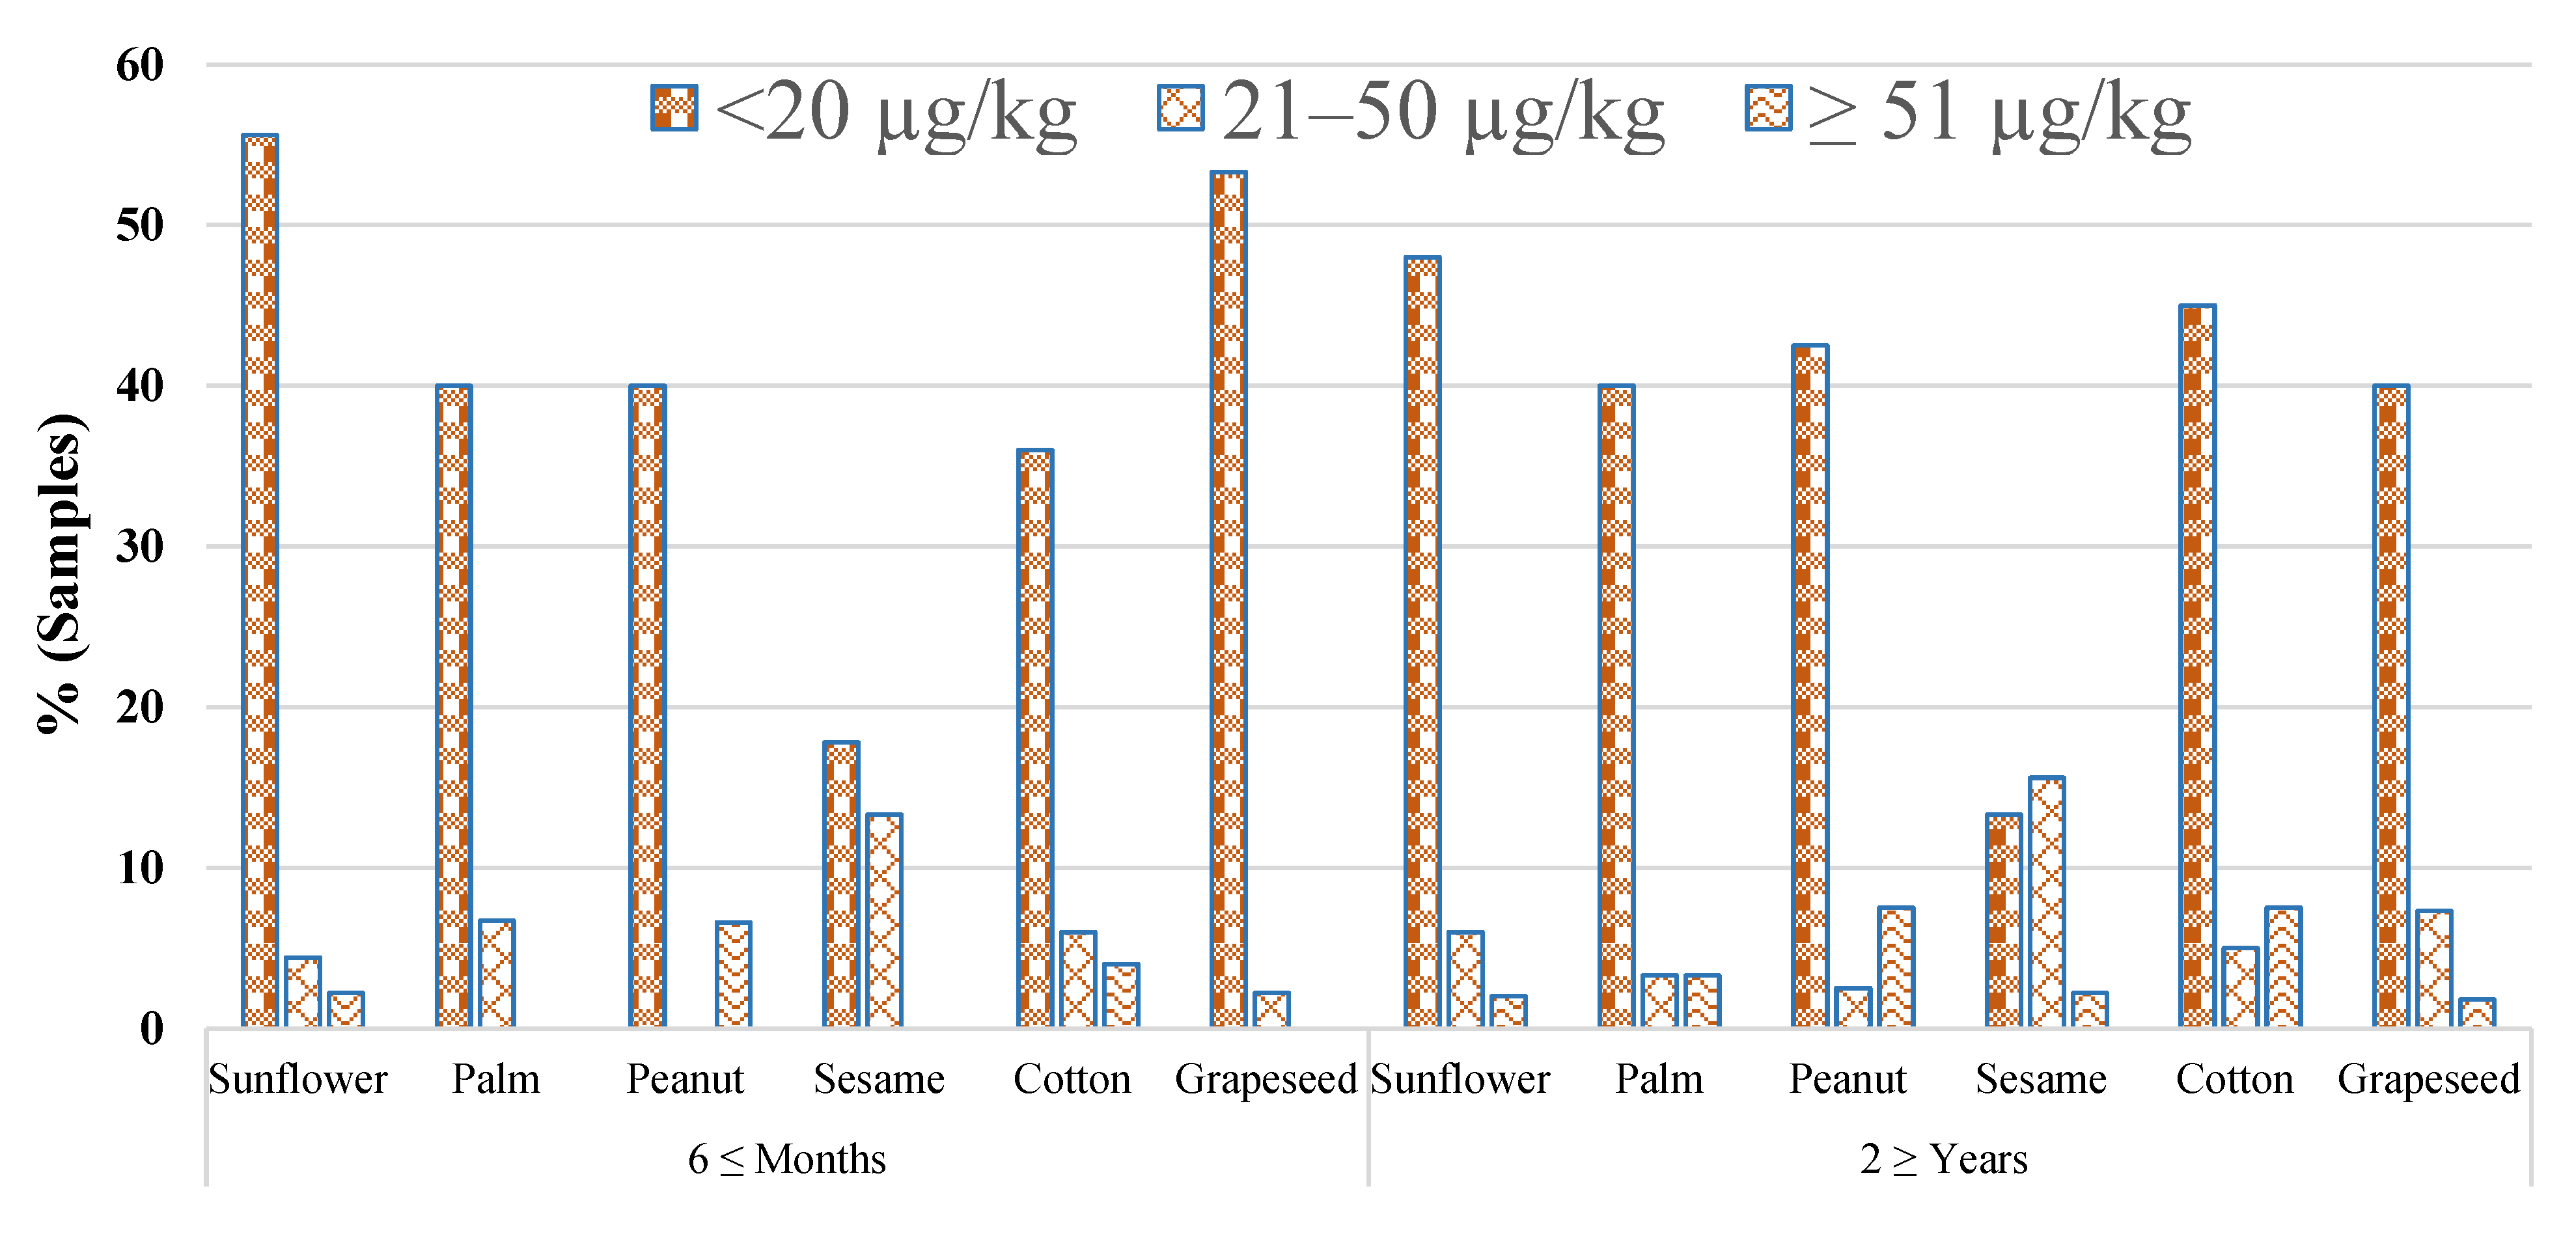
| Sample Category | 6 ≤ Months Storage Period | 2 ≥ Years Storage Period | ||||||||
|---|---|---|---|---|---|---|---|---|---|---|
| Sample | Positive Samples | Mean AFB1 | Mean AFs | Range Total AFs | Samples | Positive Samples | Mean AFB1 | Mean AFs | Range Total AFs | |
| n | n (%) | µg/kg | µg/kg | µg/kg | n | n (%) | µg/kg | µg/kg | µg/kg | |
| Sunflower | 45 | 28 (62.2) | 9.19 ± 2.10 N.S | 10.81 ± 2.40 N.S | LOD-78.5 | 50 | 28 (56.0) | 11.96 ± 2.40 | 13.70 ± 2.50 N.S | LOD-95.5 |
| Palm | 30 | 14 (46.6) | 7.80 ± 1.70 ** | 7.90 ± 3.15 ** | LOD-44.5 | 30 | 14 (46.6) | 12.20 ± 3.20 ** | 13.4 ± 3.90 ** | LOD-75.5 |
| Peanut | 45 | 21 (46.6) | 13.32 ± 2.70 ** | 15.00 ± 3.20 ** | LOD-70.5 | 40 | 21 (52.5) | 21.43 ± 2.60 ** | 25.96 ± 4.30 ** | LOD-150.5 |
| Sesame | 45 | 14 (31.1) | 18.77 ± 3.20 NS | 20.10 ± 3.50 N.S | LOD-42.9 | 45 | 14 (31.1) | 21.66 ± 4.50 NS | 23.79 ± 3.90 NS | LOD-55.5 |
| Cotton | 50 | 23 (46.0) | 17.29 ± 2.40 ** | 20.25 ± 3.80 ** | LOD-99.5 | 40 | 25 (62.5) | 22.42 ± 3.50 ** | 25.31 ± 3.60 ** | LOD-122.5 |
| Grapeseed | 45 | 25 (55.5) | 6.25 ± 3.20 ** | 6.48 ± 4.30 ** | LOD-33.5 | 55 | 30 (54.5) | 12.17 ± 3.40 ** | 14.42 ± 3.70 ** | LOD-110.5 |
| Total | 260 | 125 (48.1) | 260 | 132 (50.7) | ||||||
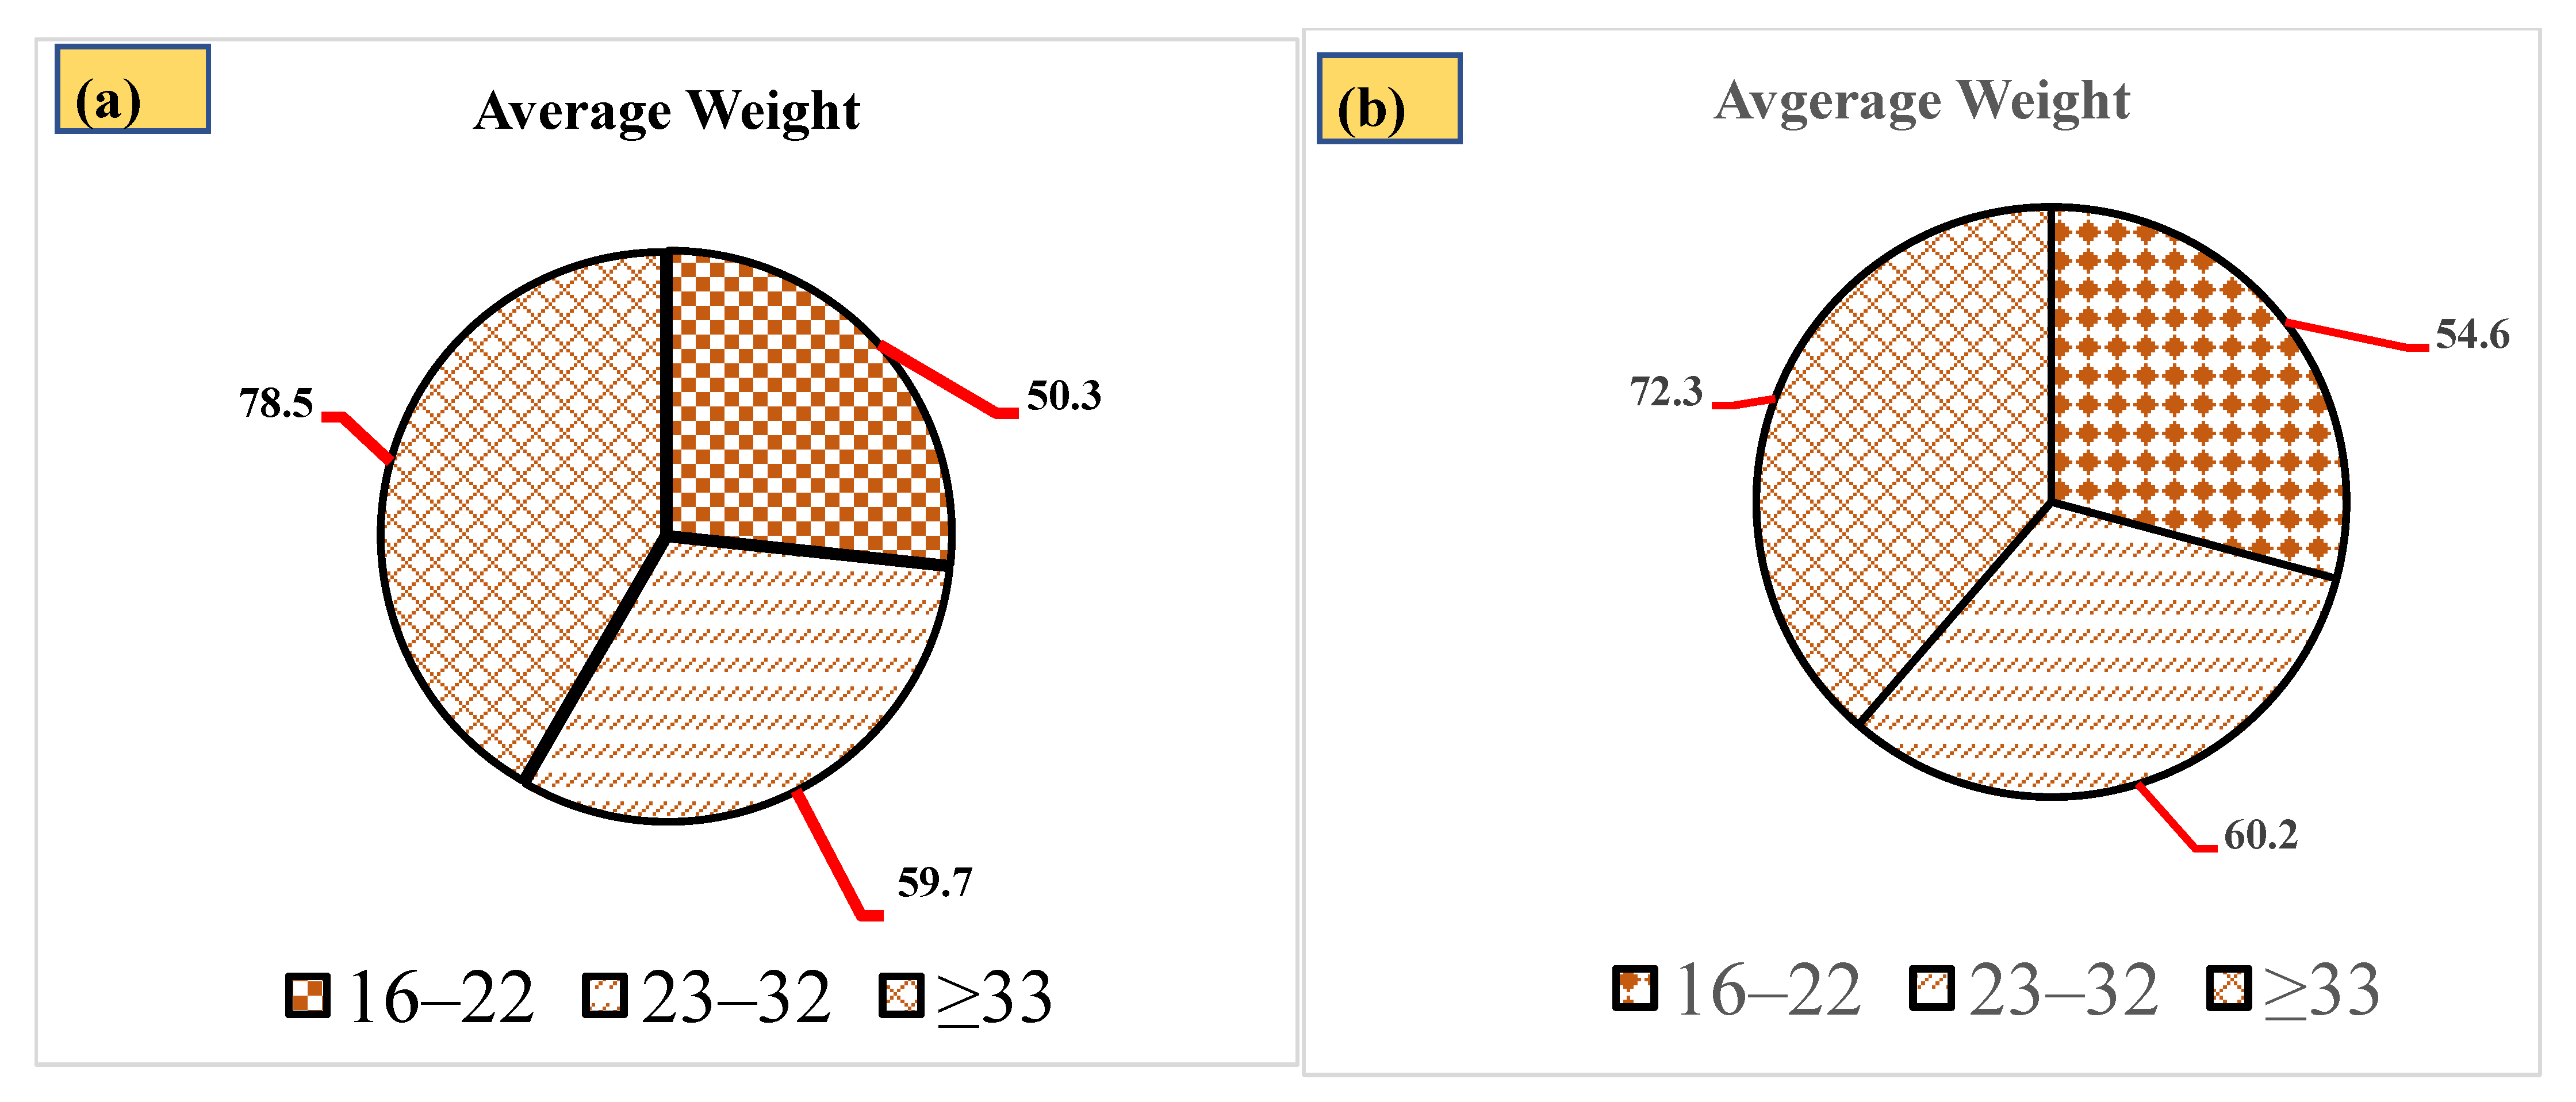
| Category | Type | Central Punjab | Southern Punjab | ||||||||||
|---|---|---|---|---|---|---|---|---|---|---|---|---|---|
| Age Groups | Age Groups | ||||||||||||
| 16–22 | 23–32 | ≤33 | 16–22 | 23–32 | ≥33 | ||||||||
| Mean | Max. | Mean | Max. | Mean | Max. | Mean | Max. | Mean | Max. | Mean | Max. | ||
| ≤6 Months Storage | Consumption kg/day | 0.0027 | 0.0025 | 0.0041 | 0.0025 | 0.0027 | 0.049 | ||||||
| AFs average amount (µg/kg) | 10.81 | 78.5 | 10.81 | 78.5 | 10.81 | 78.5 | 10.81 | 78.5 | 10.81 | 78.5 | 10.81 | 78.5 | |
| Dietary intake ng/kg/day | 0.53 | 3.90 | 0.45 | 3.30 | 0.61 | 4.50 | 0.53 | 3.90 | 0.45 | 3.30 | 7.3 | 53.2 | |
| ≥2 Years Storage | Consumption kg/day | 0.0027 | 0.0025 | 0.0049 | 0.0025 | 0.0027 | 0.049 | ||||||
| AFs average amount (µg/kg) | 13.70 | 95.5 | 13.70 | 95.5 | 13.70 | 95.5 | 13.70 | 95.5 | 13.70 | 95.5 | 13.70 | 95.5 | |
| Dietary intake ng/kg/day | 0.74 | 5.10 | 0.57 | 4.00 | 0.86 | 6.00 | 0.68 | 4.70 | 1.65 | 11.50 | 8.55 | 59.60 | |
Publisher’s Note: MDPI stays neutral with regard to jurisdictional claims in published maps and institutional affiliations. |
© 2022 by the authors. Licensee MDPI, Basel, Switzerland. This article is an open access article distributed under the terms and conditions of the Creative Commons Attribution (CC BY) license (https://creativecommons.org/licenses/by/4.0/).
Share and Cite
Iqbal, S.Z.; Waqas, M.; Razis, A.F.A.; Usman, S.; Ali, N.B.; Asi, M.R. Variation of Aflatoxin Levels in Stored Edible Seed and Oil Samples and Risk Assessment in the Local Population. Toxins 2022, 14, 642. https://0-doi-org.brum.beds.ac.uk/10.3390/toxins14090642
Iqbal SZ, Waqas M, Razis AFA, Usman S, Ali NB, Asi MR. Variation of Aflatoxin Levels in Stored Edible Seed and Oil Samples and Risk Assessment in the Local Population. Toxins. 2022; 14(9):642. https://0-doi-org.brum.beds.ac.uk/10.3390/toxins14090642
Chicago/Turabian StyleIqbal, Shahzad Zafar, Muhammad Waqas, Ahmad Faizal Abdull Razis, Sunusi Usman, Nada Basheir Ali, and Muhammad Rafique Asi. 2022. "Variation of Aflatoxin Levels in Stored Edible Seed and Oil Samples and Risk Assessment in the Local Population" Toxins 14, no. 9: 642. https://0-doi-org.brum.beds.ac.uk/10.3390/toxins14090642