
Parametric Optimization of Electric Discharge Machining of Metal Matrix Composites Using Analytic Hierarchy Process

 ,
,
Abstract
:1. Introduction
- Analyze the influence of the EDM process parameters on the 65vol% SiC/A356.2 (sample I, procured from CPS System, Dallas, TX, USA) and 10vol% SiC-5vol% quartz/Al composites (sample II, produced by a controlled environmental stir casting process);
- Evaluate the outcomes, such as the MER (metal erosion rate), SR (surface roughness), and σ (residual stresses), utilizing the L18 Taguchi experimental design and optimizing the process parameters using AHP.
2. Material and Methods
2.1. Material
2.2. Method
2.3. Experimentation
2.4. Analysis of Variance for MER, SR, Residual Stress
- MER:
- The ANOVA results show that the current and pulse-on contributed significantly to changes in MER. Additionally, the variations in the workpiece material had significant effects on the MER. On the contrary, the dielectric medium, pulse-off time, and electrode material had no significant effect. It was observed that with increases in pulse-on time and current, the MER increases significantly, since increases in the current and pulse-on time increase the spark energy duration; thus, with increased heat input, the temperature increases, resulting in the workpiece’s higher melting or evaporation rate;
- SR:
- The surface roughness of the machined surface was significantly influenced by factors such as the powder concentration, current, and pulse-on time. Furthermore, the two materials showed quite different SR values. The roughness increased with increases in current and pulse-on time, whereas the powder in the dielectric medium improved the surface finish. An increase in current or pulse-on time increases the spark energy, which drives the formation of bigger and deeper craters, leading to a rough machined surface. The addition of powder consistently improved the finish of the machined surfaces; the spark becomes more uniform with increased frequency and widens the spark gap. This reduced the magnitude of the impact forces, resulting in small and shallow craters and lowering the surface roughness [24,25];
- Residual Stress:
- The ANOVA results show that the pulse off time, powder mixing in the dielectric medium, and current significantly affected the σ. Additionally, the selected MMCs showed different residual stress values for similar parameter settings. It can be seen from the results that the pulse-on time affected the MER and SR but had no effect on σ. On the other hand, the pulse-off time hada significant impact on the development of residual stress due to the re-solidification time duration. The presence of suspended particles in the dielectric medium facilitates the easy formation of plasma channels between the electrode and the workpiece, resulting in lower SR and residual stress. The conductivity of suspended particles plays the major role in determining the SR but has no impact on the development of σ.
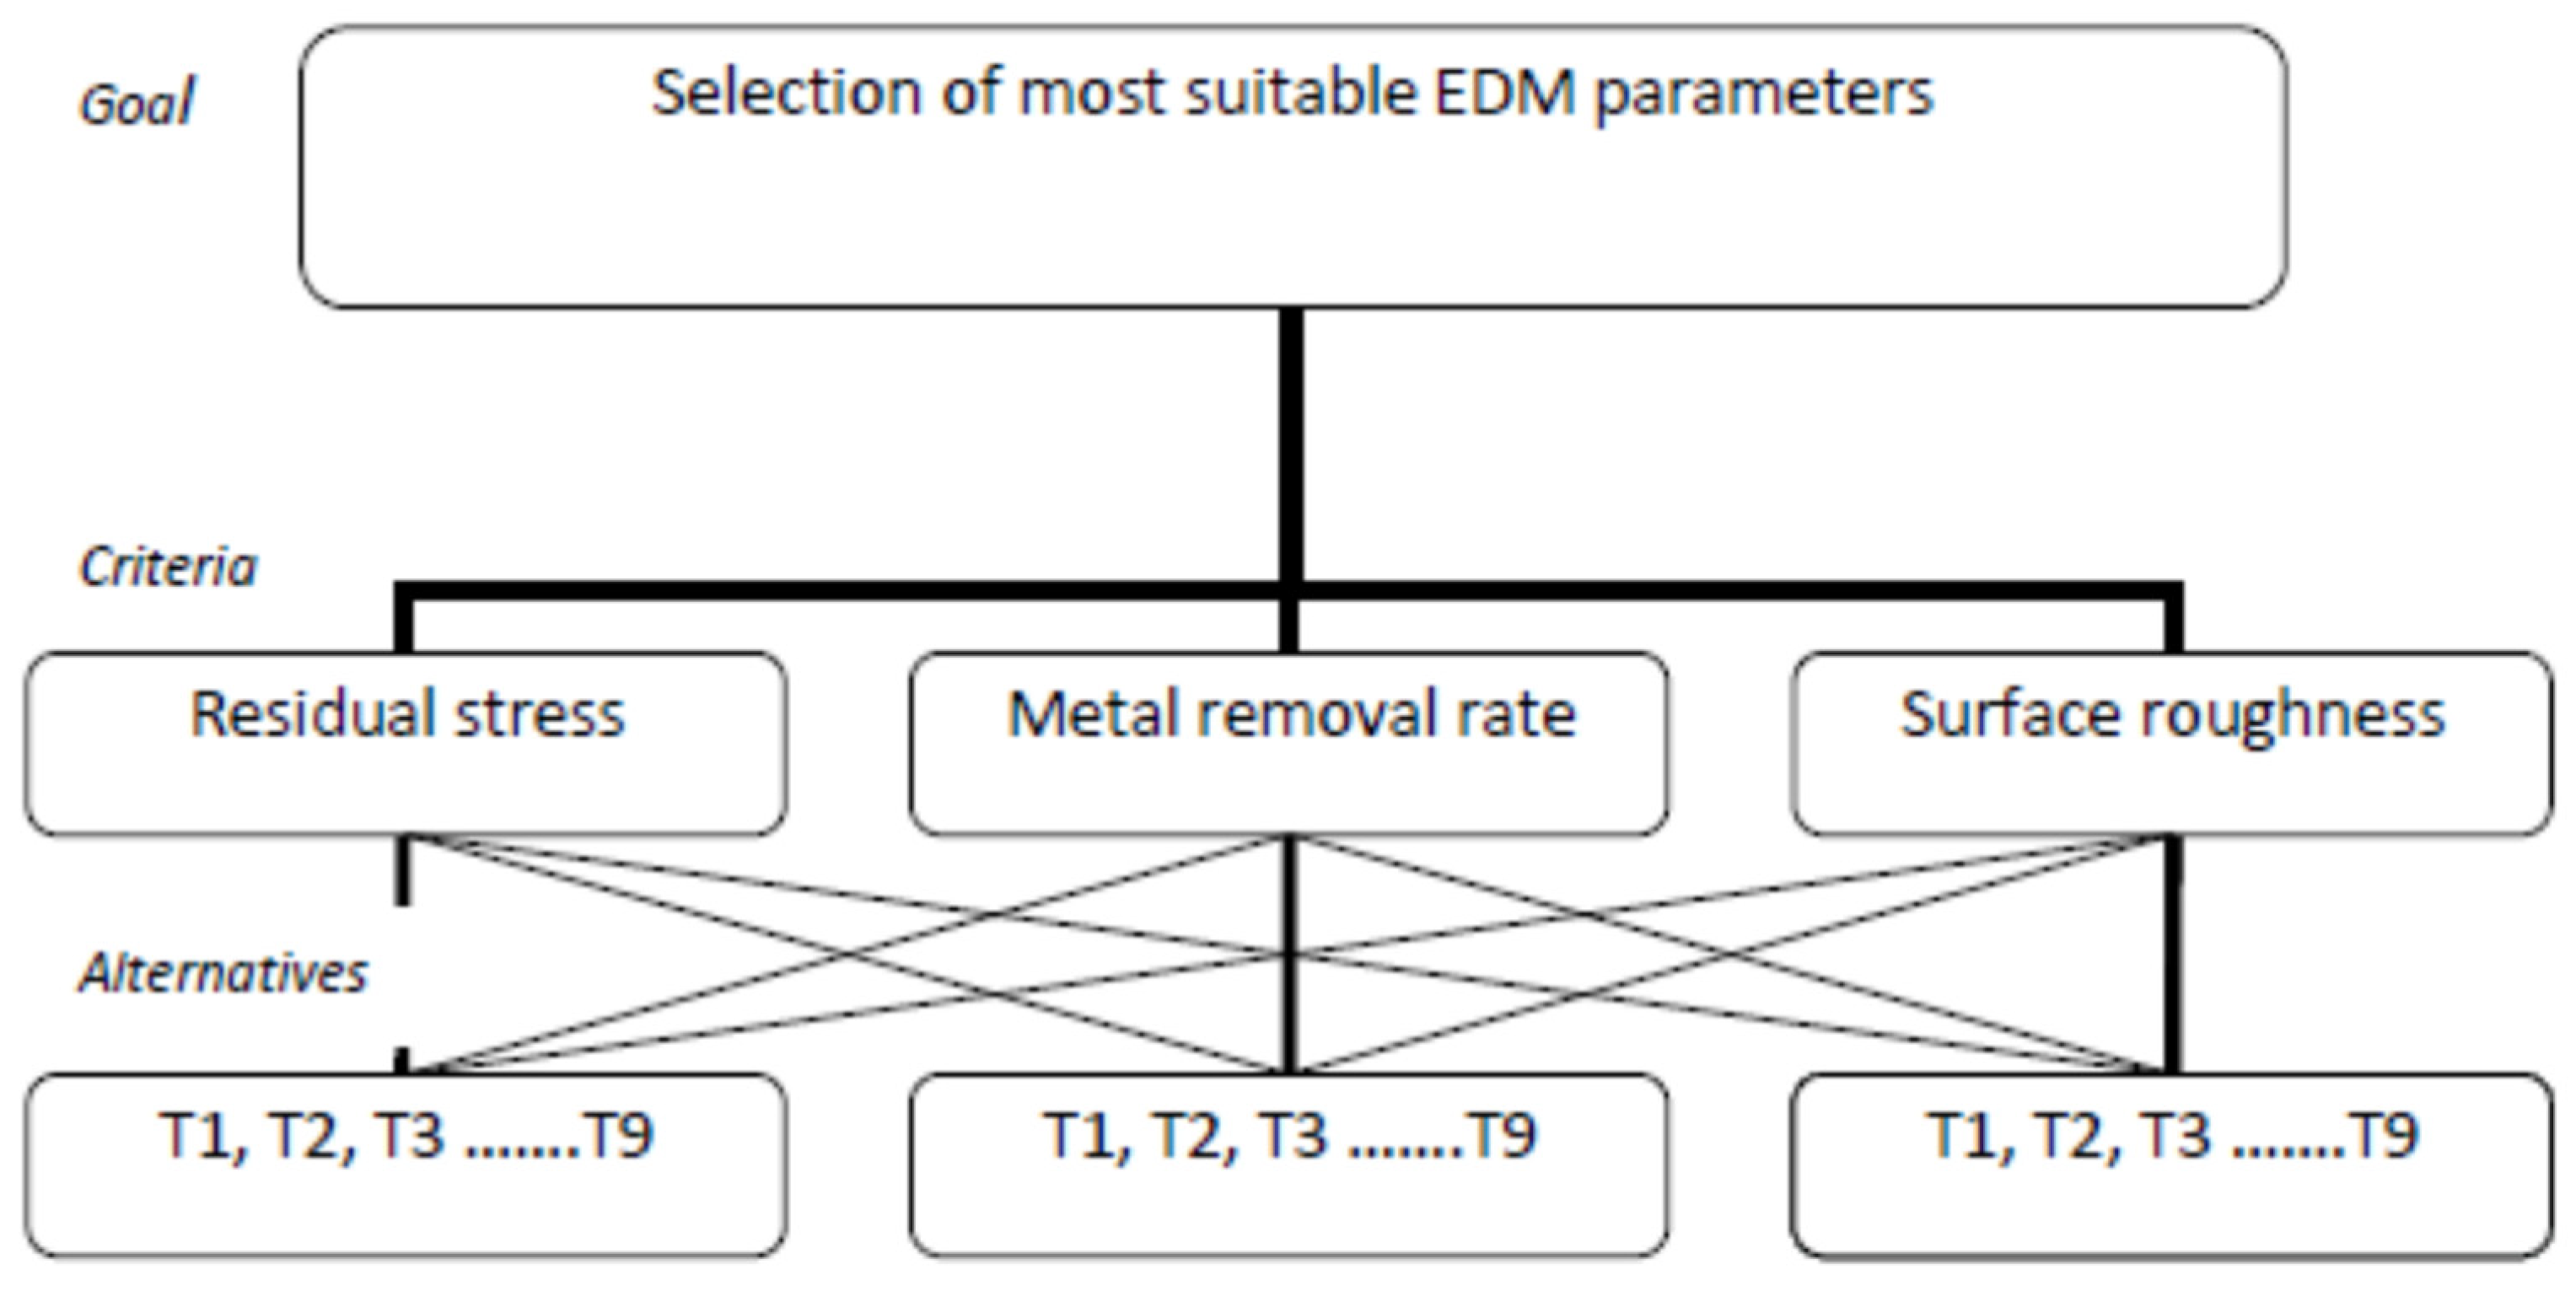
3. Analytical Hierarchical Process
- Define the objective and evaluation criteria and develop the hierarchical structure, with an objective at the top level, the criteria and sub-criteria at the intermediate level, and the available alternatives at the lowest level;
- Form a pair-wise comparison matrix for each level with respect to the higher level and determine the relative importance of the different alternatives with respect to its immediately superior sub-criteria. The comparison is made on a 9-point “fundamental scale of Saaty”, as represented in Table 7.
- Compute the relative weights for the pair-wise comparison matrices using eigenvector methods;
- Judge the scope of inconsistency by using the largest eigenvector. The judgment of the accepted degree of consistency can be checked by means of the consistency ratio (CR) of the consistency index (CI) with the appropriate value of the random index (RI) from Table 8.
- Repeat the above steps for all levels in the hierarchy, with the overall relative value evaluated by the linear addition function.
Implementation of AHP in EDM Process
4. Conclusions
Author Contributions
Funding
Conflicts of Interest
References
- Callister, W.D. Composite. In Material Science and Engineering Material, 6th ed.; Wiley: New York, NY, USA, 2004; pp. 527–559. [Google Scholar]
- Bains, P.S.; Sidhu, S.; Payal, H.S. Fabrication and Machining of Metal Matrix Composites: A Review. Mater. Manuf. Process. 2016, 31, 553–573. [Google Scholar] [CrossRef]
- Ablyaz, T.; Bains, P.; Sidhu, S.; Muratov, K.; Shlykov, E. Impact of Magnetic Field Environment on the EDM Performance of Al-SiC Metal Matrix Composite. Micromachines 2021, 12, 469. [Google Scholar] [CrossRef]
- Ahamed, A.R.; Asokan, P.; Aravindan, S. EDM of hybrid Al–SiCp–B4Cp and Al–SiCp–Glassp MMCs. Int. J. Adv. Manuf. Technol. 2009, 44, 520–528. [Google Scholar] [CrossRef]
- Sidhu, S.S.; Kumar, S.; Batish, A. Metal Matrix Composites for Thermal Management: A Review. Crit. Rev. Solid State Mater. Sci. 2015, 41, 132–157. [Google Scholar] [CrossRef]
- Dufour, B.; McNulty, M.; Miller, S. Microwave multi-chip module utilizing aluminum silicon carbide with in-situ cast components and high density interconnect technology. Int. J. Microcircuits Electron. Packag. 1997, 20, 303–308. [Google Scholar]
- Novich, B.E.; Adams, R.W.; Occhionero, M.A. Low-Cost MCM-D Cavity Substrates for Packaging High Density Si and GaAs Devices. In Proceedings of the 10th European Microelectronics Conference, ISHM, Copenhagen, Denmark, 14–17 May 1995; pp. 475–481. [Google Scholar]
- Sidhu, S.S.; Batish, A.; Kumar, S. Fabrication and electrical discharge machining of metal–matrix composites: A review. J. Reinf. Plast. Compos. 2013, 32, 1310–1320. [Google Scholar] [CrossRef]
- Sidhu, S.; Batish, A.; Kumar, S. Study of Surface Properties in Particulate-Reinforced Metal Matrix Composites (MMCs) Using Powder-Mixed Electrical Discharge Machining (EDM). Mater. Manuf. Process. 2014, 29, 46–52. [Google Scholar] [CrossRef]
- Bains, P.S.; Singh, S.; Sidhu, S.S.; Kaur, S.; Ablyaz, T.R. Investigation of Surface Properties of Al–SiC Composites in Hybrid Electrical Discharge Machining. In Structural Materials; Springer: Cham, Switzerland, 2018; pp. 181–196. [Google Scholar]
- Rafaqat, M.; Mufti, N.A.; Ahmed, N.; AlAhmari, A.M.; Hussain, A. EDM of D2 Steel: Performance Comparison of EDM Die Sinking Electrode Designs. Appl. Sci. 2020, 10, 7411. [Google Scholar] [CrossRef]
- Khanra, A.; Sarkar, B.; Bhattacharya, B.; Pathak, L.; Godkhindi, M. Performance of ZrB2–Cu composite as an EDM electrode. J. Mater. Process. Technol. 2007, 183, 122–126. [Google Scholar] [CrossRef]
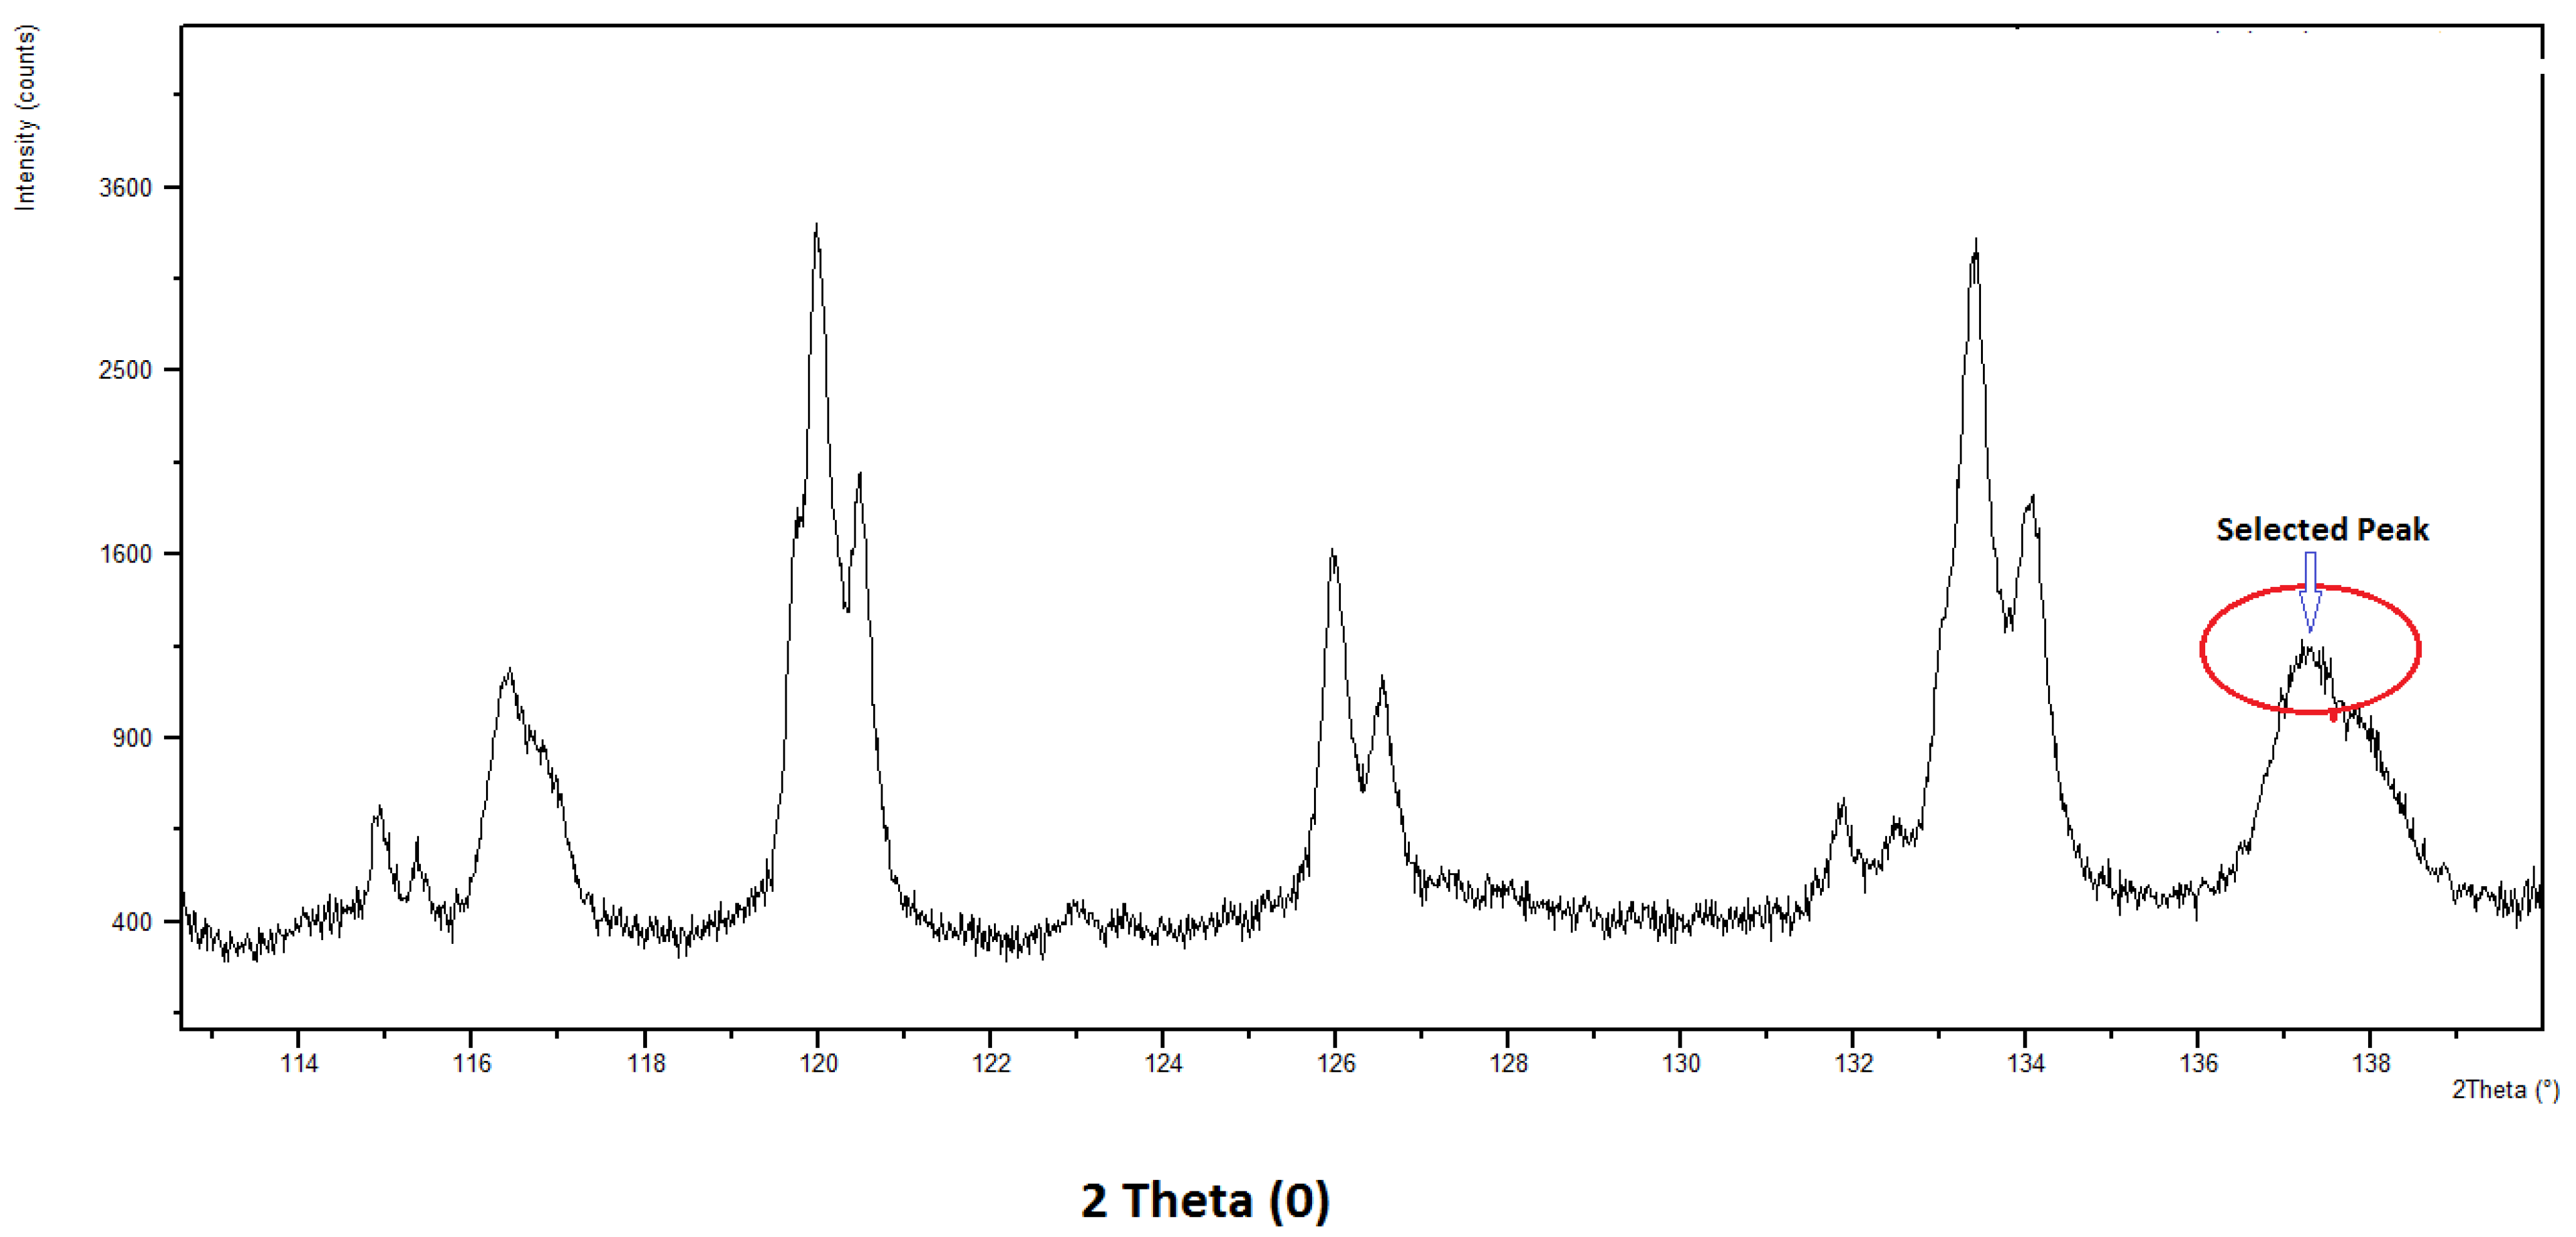
- Withers, P.; Bhadeshia, H.K.D.H. Residual stress. Part 1—Measurement techniques. Mater. Sci. Technol. 2001, 17, 355–365. [Google Scholar] [CrossRef]
- Welzel, U.; Ligot, J.; Lamparter, P.; Vermeulen, A.C.; Mittemeijer, E.J. Stress analysis of polycrystalline thin films and surface regions by X-ray diffraction. J. Appl. Crystallogr. 2005, 38, 1–29. [Google Scholar] [CrossRef]
- Cuullity, B.D. Elements of X-ray Diffraction, 2nd ed.; Addison-Wesley: New York, NY, USA, 1978. [Google Scholar]
- Sidhu, S.; Batish, A.; Kumar, S. Neural network–based modeling to predict residual stresses during electric discharge machining of Al/SiC metal matrix composites. Proc. Inst. Mech. Eng. Part B J. Eng. Manuf. 2013, 227, 1679–1692. [Google Scholar] [CrossRef]
- Singh, P.; Raghukandan, K.; Rathinasabapathi, M.; Pai, B. Electric discharge machining of Al–10%SiCP as-cast metal matrix composites. J. Mater. Process. Technol. 2004, 155-156, 1653–1657. [Google Scholar] [CrossRef]
- Tzeng, Y.-F.; Chen, F.-C. Multi-objective optimisation of high-speed electrical discharge machining process using a Taguchi fuzzy-based approach. Mater. Des. 2007, 28, 1159–1168. [Google Scholar] [CrossRef]
- Sidhu, S.S.; Batish, A.; Kumar, S. EDM of Metal Matrix Composite for Parameter Design Using Lexicographic Goal Programming. Mater. Manuf. Process. 2013, 28, 495–500. [Google Scholar] [CrossRef]
- Saaty, T.L. A scaling method for priorities in hierarchical structures. J. Math. Psychol. 1977, 15, 234–281. [Google Scholar] [CrossRef]
- Al-Harbi, K.M.-S. Application of the AHP in project management. Int. J. Proj. Manag. 2001, 19, 19–27. [Google Scholar] [CrossRef]
- Whitaker, R. Validation examples of the Analytic Hierarchy Process and Analytic Network Process. Math. Comput. Model. 2007, 46, 840–859. [Google Scholar] [CrossRef]
- Banerjee, S.; Sutradhar, G.; Sahoo, P. Design of experiment analysis of elevated temperature wear of Mg-WC nano-composites. Rep. Mech. Eng. 2021, 2, 202–211. [Google Scholar] [CrossRef]
- Singh, G.; Ablyaz, T.R.; Shlykov, E.S.; Muratov, K.R.; Bhui, A.S.; Sidhu, S.S. Enhancing Corrosion and Wear Resistance of Ti6Al4V Alloy Using CNTs Mixed Electro-Discharge Process. Micromachines 2020, 11, 850. [Google Scholar] [CrossRef]
- Haque, R.; Sekh, M.; Kibria, G.; Haidar, S. Improvement of Surface Quality of Ti-6Al-4VAlloy by Powder Mixed Electrical Discharge Machining Using Copper Powder. Facta Univ. Ser. Mech. Eng. 2021. [Google Scholar] [CrossRef]
- Taha, H.A. Operation research an introduction. In Decision Analysis and Games, 7th ed.; Pearson Education: New York, NY, USA, 2002; pp. 503–511. [Google Scholar]
- Das, S.; Chattopadhyay, A. Application of the analytic hierarchy process for estimating the state of tool wear. Int. J. Mach. Tools Manuf. 2003, 43, 1–6. [Google Scholar] [CrossRef]


| Factors | Conditions |
|---|---|
| Characteristic X-ray | Cu–Kα1 + 2 |
| Measurement method | Ω-Diffractometer method |
| Diffraction plane, (hkl) | (422) |
| Tube voltage, KV | 45 |
| Tube current, mA | 40 |
| Diffraction angle (2θ) | 40°–140° |
| Diffraction plane, (hkl) | (422) |
| Parameters (Symbol) | Levels | ||
|---|---|---|---|
| Level-1 | Level-2 | Level-3 | |
| Workpiece (WP) | 65 vol% SiC/A356.2 (WP I) | 10 vol% SiC-5 vol% quartz/Al (WP II) | ----- |
| Tool Electrode (TE) | Cu | Gr | Cu-Gr |
| Dielectric medium(D) | EDM oil (D) | PMEDM (Cu) | PMEDM (Gr) |
| Current (A) Amp | 4 | 8 | 12 |
| Pulse-on (Ton) µs | 10 | 30 | 50 |
| Pulse-off (Toff) µs | 15 | 30 | 45 |
| Trial. No. (T(n)) Where n = 1–18 | Process Parameters | Output Responses | ||||||||
|---|---|---|---|---|---|---|---|---|---|---|
| WP | TE | Toff (µs) | Ton (µs) | D | A | σ0 (MPa) | σn (MPa) Calculated from Equation (5) | MER (mg/min) | SR (µm) | |
| 1 | WP I | 1 | 15 | 10 | 1 | 4 | 63.3 | 66.7 | 2.64 | 2.94 |
| 2 | WP I | 1 | 30 | 30 | 2 | 8 | 74.6 | 55.4 | 14.275 | 2.05 |
| 3 | WP I | 1 | 45 | 45 | 3 | 12 | 82.8 | 47.2 | 23.17 | 5.67 |
| 4 | WP I | 2 | 15 | 45 | 2 | 8 | 36.3 | 93.7 | 23.38 | 2.09 |
| 5 | WP I | 2 | 30 | 10 | 3 | 12 | 63.6 | 66.4 | 18.97 | 4.12 |
| 6 | WP I | 2 | 45 | 30 | 1 | 4 | 110.3 | 19.7 | 3.04 | 3.00 |
| 7 | WP I | 3 | 15 | 30 | 1 | 12 | 61.4 | 68.6 | 22.240 | 5.01 |
| 8 | WP I | 3 | 30 | 45 | 2 | 4 | 78.5 | 51.5 | 9.860 | 2.06 |
| 9 | WP I | 3 | 45 | 10 | 3 | 8 | 129 | 1 | 9.460 | 5.06 |
| 10 | WP II | 1 | 15 | 30 | 3 | 8 | 70.4 | 162.1 | 20.90 | 6.69 |
| 11 | WP II | 1 | 30 | 45 | 1 | 12 | 104 | 128.5 | 60.67 | 10.46 |
| 12 | WP II | 1 | 45 | 10 | 2 | 4 | 78.1 | 154.4 | 10.860 | 4.69 |
| 13 | WP II | 2 | 15 | 45 | 3 | 4 | 41.8 | 190.7 | 57.99 | 6.46 |
| 14 | WP II | 2 | 30 | 10 | 1 | 8 | 149.3 | 83.2 | 18.86 | 8.44 |
| 15 | WP II | 2 | 45 | 30 | 2 | 12 | 132.9 | 99.6 | 29.96 | 4.44 |
| 16 | WP II | 3 | 15 | 10 | 2 | 12 | 77.7 | 154.8 | 65.5 | 6.76 |
| 17 | WP II | 3 | 30 | 30 | 3 | 4 | 89.2 | 143.3 | 10.07 | 6.12 |
| 18 | WP II | 3 | 45 | 45 | 1 | 8 | 231.5 | 1 | 45.72 | 7.95 |
| Sample I | Sample II | |
|---|---|---|
| Elastic constants T−1 Pa (1/2S2) | 6.98 | 16.84 |
| ψ | Sin2 ψ | dφψ | Єψφ | a+ | a− | |
|---|---|---|---|---|---|---|
| 0 | 0 | 0.827269 | 0 | |||
| Positive ψ | 12.92 | 0.05 | 0.827286 | 0.00002050 | 5.08 × 10⁻⁵ | −3.02 × 10⁻⁵ |
| 18.44 | 0.1 | 0.827311 | 0.00005060 | −1.70 × 10⁻⁵ | 6.76 × 10⁻⁵ | |
| 22.79 | 0.15 | 0.827472 | 0.00024500 | 1.97 × 10⁻⁴ | 4.82 × 10⁻⁵ | |
| 26.57 | 0.2 | 0.827425 | 0.00018900 | 2.48 × 10⁻⁴ | −5.90 × 10⁻⁵ | |
| 30.00 | 0.25 | 0.827450 | 0.00021900 | 1.84 × 10⁻⁴ | 3.52 × 10⁻⁵ | |
| 33.21 | 0.3 | 0.827499 | 0.00027800 | 9.01 × 10⁻⁵ | 1.88 × 10⁻⁴ | |
| 36.27 | 0.35 | 0.827564 | 0.00035700 | 2.10 × 10⁻⁴ | 1.47 × 10⁻⁴ | |
| 39.23 | 0.4 | 0.827434 | 0.00020000 | 1.11 × 10⁻⁴ | 8.91 × 10⁻⁵ | |
| 42.13 | 0.45 | 0.827673 | 0.00048800 | 2.94 × 10⁻⁴ | 1.94 × 10⁻⁴ | |
| 45 | 0.5 | 0.827543 | 0.00033100 | 3.58 × 10⁻⁴ | −2.73 × 10⁻⁵ | |
| Negative ψ | 12.92 | 0.05 | 0.827336 | 0.00008099 | ||
| 18.44 | 0.1 | 0.827199 | −0.00008462 | |||
| 22.79 | 0.15 | 0.827392 | 0.00014868 | |||
| 26.57 | 0.2 | 0.827523 | 0.00030703 | |||
| 30.00 | 0.25 | 0.827392 | 0.00014868 | |||
| 33.21 | 0.3 | 0.827188 | −0.00009791 | |||
| 36.27 | 0.35 | 0.827321 | 0.00006286 | |||
| 39.23 | 0.4 | 0.827287 | 0.00002176 | |||
| 42.13 | 0.45 | 0.827351 | 0.00009912 | |||
| 45 | 0.5 | 0.827588 | 0.00038561 | |||
| Factors | dof | Sum of Squares | Variance | F-Value | ||||||
|---|---|---|---|---|---|---|---|---|---|---|
| MER | SR | σ | MER | SR | σ | MER | SR | σ | ||
| W/Pc | 1 | 1977.26 | 50.0333 | 4204.4 | 1977.26 | 50.0333 | 4204.4 | 10.50 * | 80.99 * | 9.13 * |
| Electrode | 2 | 62.50 | 1.9590 | 3284.0 | 31.25 | 0.9795 | 1641.98 | 0.17 | 1.59 | 3.57 * |
| Pulse-off | 2 | 435.50 | 0.9768 | 14262.5 | 217.75 | 0.4884 | 7131.27 | 1.16 | 0.79 | 15.49 * |
| Pulse-on | 2 | 1448.53 | 4.6520 | 110.5 | 724.26 | 2.3260 | 55.26 | 3.85 * | 3.77 * | 0.12 |
| Dielectric medium | 2 | 10.67 | 22.5037 | 6526.1 | 5.33 | 11.2519 | 3263.04 | 0.03 | 18.21 * | 7.09 * |
| Current | 2 | 1494.86 | 10.6571 | 4725.5 | 747.43 | 5.3286 | 2362.75 | 3.97 * | 8.63 * | 5.13 * |
| Error | 6 | 1129.73 | 3.7064 | 2762.6 | 188.29 | 0.6177 | 460.44 | |||
| Total | 17 | 6559.04 | 94.4886 | 35875.7 | ||||||
| Scale Value | Explanation |
|---|---|
| 1 | Equally preferred |
| 3 | Slightly more preferred |
| 5 | Strongly preferred |
| 7 | Very strongly preferred |
| 9 | Extremely preferred |
| 2, 4, 6, 8 | Used to reflect compromise between scale values |
| k | 1 | 2 | 3 | 4 | 5 | 6 | 7 | 8 | 9 | 10 | 11 | 12 | 13 |
|---|---|---|---|---|---|---|---|---|---|---|---|---|---|
| RI | 0.00 | 0.00 | 0.58 | 0.90 | 1.12 | 1.24 | 1.32 | 1.41 | 1.45 | 1.49 | 1.51 | 1.48 | 1.48 |
| σ | MER | SR | Priority Vector | |
|---|---|---|---|---|
| σ | 1 | 2 | 5 | 0.581552 |
| MER | 1/2 | 1 | 3 | 0.308996 |
| SR | 1/5 | 1/3 | 1 | 0.109452 |
| λmax = 3.00369 | CI = 0.0018473, RI = 0.58, CR = 0.003 | |||
| . | T1 | T2 | T3 | T4 | T5 | T6 | T7 | T8 | T9 | Priority Vector |
|---|---|---|---|---|---|---|---|---|---|---|
| T1 | 1 | 1 | 1 | 1 | 1 | 3 | 1 | 1 | 9 | 0.130829 |
| T2 | 1 | 1 | 1 | 1/2 | 1 | 3 | 1 | 1 | 9 | 0.12105 |
| T3 | 1 | 1 | 1 | 1/2 | 1 | 2 | 1 | 1 | 9 | 0.115577 |
| T4 | 1 | 2 | 2 | 1 | 1 | 5 | 1 | 2 | 9 | 0.180525 |
| T5 | 1 | 1 | 1 | 1 | 1 | 3 | 1 | 1 | 9 | 0.130829 |
| T6 | 1/3 | 1/3 | 1/2 | 1/5 | 1/3 | 1 | 1/4 | 1/3 | 9 | 0.050517 |
| T7 | 1 | 1 | 2 | 1 | 1 | 4 | 1 | 1 | 9 | 0.136302 |
| T8 | 1 | 1 | 1 | 1/2 | 1 | 3 | 1 | 1 | 9 | 0.12105 |
| T9 | 1/9 | 1/9 | 1/9 | 1/9 | 1/9 | 1/9 | 1/9 | 1/9 | 1 | 0.0133204 |
| λmax = 9.23034 | CI = 0.0287927, RI = 1.45, CR = 0.0198 | |||||||||
| T1 | T2 | T3 | T4 | T5 | T6 | T7 | T8 | T9 | Priority Vector | |
|---|---|---|---|---|---|---|---|---|---|---|
| T1 | 1 | 1/5 | 1/9 | 1/9 | 1/7 | 1 | 1/8 | 1/4 | 1/4 | 0.02080 |
| T2 | 5 | 1 | 1/2 | 1/2 | 1 | 5 | 1/2 | 1 | 1 | 0.09982 |
| T3 | 9 | 2 | 1 | 1 | 1 | 9 | 1 | 3 | 3 | 0.19547 |
| T4 | 9 | 2 | 1 | 1 | 1 | 8 | 1 | 2 | 2 | 0.17520 |
| T5 | 7 | 1 | 1 | 1 | 1 | 6 | 1 | 2 | 2 | 0.15448 |
| T6 | 1 | 1/5 | 1/9 | 1/8 | 1/6 | 1 | 1/7 | 1/3 | 1/3 | 0.02328 |
| T7 | 8 | 2 | 1 | 1 | 1 | 7 | 1 | 2 | 2 | 0.17034 |
| T8 | 4 | 1 | 1/3 | 1/2 | 1/2 | 3 | 1/2 | 1 | 1 | 0.08303 |
| T9 | 4 | 1 | 1/3 | 1/2 | 1/2 | 3 | 1/2 | 1 | 1 | 0.08303 |
| λmax = 9.02762 | CI = 0.00640, RI = 1.45, CR = 0.0023 | |||||||||
| T1 | T2 | T3 | T4 | T5 | T6 | T7 | T8 | T9 | Priority Vector | |
|---|---|---|---|---|---|---|---|---|---|---|
| T1 | 1 | 1 | 1/2 | 1 | 1 | 1 | 1/2 | 1 | 1/2 | 0.0834519 |
| T2 | 1 | 1 | 1/3 | 1 | 1/2 | 1 | 1/2 | 1 | 1/2 | 0.0728733 |
| T3 | 2 | 3 | 1 | 3 | 1 | 2 | 1 | 3 | 1 | 0.176214 |
| T4 | 1 | 1 | 1/3 | 1 | 1/2 | 1 | 1/2 | 1 | 1/2 | 0.0728733 |
| T5 | 1 | 2 | 1 | 2 | 1 | 1 | 1 | 2 | 1 | 0.133865 |
| T6 | 1 | 1 | 1/2 | 1 | 1 | 1 | 1/2 | 1 | 1/2 | 0.0834519 |
| T7 | 2 | 2 | 1 | 2 | 1 | 1 | 1 | 2 | 1 | 0.152199 |
| T8 | 1 | 1 | 1/3 | 1 | 1/2 | 1/2 | 1 | 1 | 1/2 | 0.0728733 |
| T9 | 2 | 2 | 1 | 2 | 1 | 1 | 1/2 | 2 | 1 | 0.152199 |
| λmax = 9.10338 | CI = 0.0129221, RI = 1.45, CR = 0.008911 | |||||||||
| T10 | T11 | T12 | T13 | T14 | T15 | T16 | T17 | T18 | Priority Vector | |
|---|---|---|---|---|---|---|---|---|---|---|
| T10 | 1 | 1 | 1 | 1 | 2 | 2 | 1 | 1 | 9 | 0.138612 |
| T11 | 1 | 1 | 1 | 1/2 | 2 | 1 | 1 | 1 | 9 | 0.119842 |
| T12 | 1 | 1 | 1 | 1 | 2 | 2 | 1 | 1 | 9 | 0.138612 |
| T13 | 1 | 2 | 1 | 1 | 2 | 2 | 1 | 1 | 9 | 0.165782 |
| T14 | 1/2 | 1/2 | 1/2 | 1/2 | 1 | 1 | 1/2 | 1/2 | 9 | 0.0758749 |
| T15 | 1/2 | 1 | 1/2 | 1/2 | 1 | 1 | 1/2 | 1/2 | 9 | 0.089421 |
| T16 | 1 | 1 | 1 | 1 | 2 | 2 | 1 | 1 | 9 | 0.129583 |
| T17 | 1 | 1 | 1 | 1 | 2 | 2 | 1 | 1 | 9 | 0.128872 |
| T18 | 1/9 | 1/9 | 1/9 | 1/9 | 1/9 | 1/9 | 1/9 | 1/9 | 1 | 0.0134007 |
| λmax = 9.1803 | CI = 0.0225376, RI = 1.45, CR = 0.0155 | |||||||||
| T10 | T11 | T12 | T13 | T14 | T15 | T16 | T17 | T18 | Priority Vector | |
|---|---|---|---|---|---|---|---|---|---|---|
| T10 | 1 | 1/3 | 2 | 1/3 | 1 | 1 | 1/3 | 2 | 1/2 | 0.068095 |
| T11 | 3 | 1 | 6 | 1 | 3 | 2 | 1 | 6 | 1 | 0.185247 |
| T12 | 1/2 | 1/2 | 1 | 1/5 | 1/2 | 1/3 | 1/6 | 1 | 1/4 | 0.0330161 |
| T13 | 3 | 3 | 3 | 1 | 3 | 2 | 1 | 6 | 1 | 0.181600 |
| T14 | 1 | 1 | 1 | 1 | 1 | 1/2 | 1/3 | 2 | 1/2 | 0.0629946 |
| T15 | 1 | 1 | 1 | 1 | 1 | 1 | 1/2 | 3 | 1/2 | 0.0923417 |
| T16 | 3 | 3 | 3 | 3 | 3 | 3 | 1 | 6 | 1 | 0.1852470 |
| T17 | 1/2 | 1/2 | 1/2 | 1/2 | 1/2 | 1/2 | 1/2 | 1 | 1/5 | 0.0314636 |
| T18 | 2 | 2 | 2 | 2 | 2 | 2 | 2 | 2 | 1 | 0.159995 |
| λmax = 9.05235 | CI = 0.00654334, RI = 1.45, CR = 0.00451 | |||||||||
| T10 | T11 | T12 | T13 | T14 | T15 | T16 | T17 | T18 | Priority Vector | |
|---|---|---|---|---|---|---|---|---|---|---|
| T10 | 1 | 1/2 | 1 | 1 | 1 | 2 | 1 | 1 | 1 | 0.107181 |
| T11 | 2 | 1 | 2 | 2 | 1 | 2 | 2 | 2 | 1 | 0.171361 |
| T12 | 1 | 1/2 | 1 | 1 | 1/2 | 1 | 1 | 1 | 1/2 | 0.0858196 |
| T13 | 1 | 1/2 | 1 | 1 | 1 | 1 | 1 | 1 | 1 | 0.0990902 |
| T14 | 1 | 1 | 2 | 1 | 1 | 2 | 1 | 1 | 1 | 0.126548 |
| T15 | 1/2 | 1/2 | 1 | 1 | 1/2 | 1 | 1/2 | 1 | 1/2 | 0.0741207 |
| T16 | 1 | 1/2 | 1 | 1 | 1 | 2 | 1 | 1 | 1 | 0.107181 |
| T17 | 1 | 1/2 | 1 | 1 | 1 | 1 | 1 | 1 | 1 | 0.0990902 |
| T18 | 1 | 1 | 2 | 1 | 1 | 2 | 2 | 1 | 1 | 0.12661 |
| λmax = 9.16155 | CI = 0.0201939, RI = 1.45, CR = 0.0139 | |||||||||
| T1 | T2 | T3 | T4 | T5 | T6 | T7 | T8 | T9 | |
|---|---|---|---|---|---|---|---|---|---|
| T1 | 0.13434 | 0.10405 | 0.10405 | 0.17208 | 0.13433 | 0.12442 | 0.13585 | 0.11843 | 0.12329 |
| T2 | 0.13434 | 0.10405 | 0.10405 | 0.08604 | 0.13433 | 0.12442 | 0.13585 | 0.11843 | 0.12329 |
| T3 | 0.13434 | 0.10405 | 0.10405 | 0.08604 | 0.13433 | 0.08295 | 0.13585 | 0.11843 | 0.12329 |
| T4 | 0.13434 | 0.20809 | 0.20809 | 0.17208 | 0.13433 | 0.20737 | 0.13585 | 0.23685 | 0.12329 |
| T5 | 0.13434 | 0.10405 | 0.10405 | 0.17208 | 0.13433 | 0.12442 | 0.13585 | 0.11843 | 0.12329 |
| T6 | 0.04478 | 0.05202 | 0.05202 | 0.03442 | 0.04478 | 0.04147 | 0.03396 | 0.03948 | 0.12329 |
| T7 | 0.13434 | 0.20809 | 0.20809 | 0.17208 | 0.13433 | 0.16590 | 0.13585 | 0.11843 | 0.12329 |
| T8 | 0.13434 | 0.10405 | 0.10405 | 0.08604 | 0.13433 | 0.12442 | 0.13585 | 0.11843 | 0.12329 |
| T9 | 0.01493 | 0.01156 | 0.01156 | 0.01912 | 0.01493 | 0.00461 | 0.01509 | 0.01316 | 0.01370 |
| Trials | σ (0.581552) | MER (0.308996) | SR (0.109452) | Overall Priority Vector | Ideal Weight Vector |
|---|---|---|---|---|---|
| T1 | 0.130829 | 0.02080 | 0.0834519 | 0.091645 | 0.548453 |
| T2 | 0.12105 | 0.09982 | 0.0728733 | 0.109219 | 0.653623 |
| T3 | 0.115577 | 0.19547 | 0.176214 | 0.146899 | 0.879124 |
| T4 | 0.180525 | 0.17520 | 0.0728733 | 0.167097 | 1.000000 * |
| T5 | 0.130829 | 0.15448 | 0.133865 | 0.138471 | 0.828682 |
| T6 | 0.050517 | 0.02328 | 0.0834519 | 0.045707 | 0.273534 |
| T7 | 0.136302 | 0.17034 | 0.152199 | 0.148560 | 0.889066 ** |
| T8 | 0.12105 | 0.08303 | 0.0728733 | 0.103185 | 0.617514 |
| T9 | 0.0133204 | 0.08303 | 0.152199 | 0.049217 | 0.294540 |
| Trials | σ (0.581552) | MER (0.308996) | SR (0.109452) | Overall Priority Vector | Ideal Weight Vector |
|---|---|---|---|---|---|
| T10 | 0.138612 | 0.068095 | 0.107181 | 0.113791 | 0.73091 |
| T11 | 0.119842 | 0.185247 | 0.171361 | 0.146440 | 0.940701 |
| T12 | 0.138612 | 0.0330161 | 0.0858196 | 0.100555 | 0.645949 |
| T13 | 0.165782 | 0.181600 | 0.0990902 | 0.155672 | 1.000000 * |
| T14 | 0.0758749 | 0.0629946 | 0.126548 | 0.077638 | 0.498728 |
| T15 | 0.089421 | 0.0923417 | 0.0741207 | 0.088929 | 0.571260 |
| T16 | 0.129583 | 0.1852470 | 0.107181 | 0.149991 | 0.963508 ** |
| T17 | 0.128872 | 0.0314636 | 0.0990902 | 0.095874 | 0.615871 |
| T18 | 0.0134007 | 0.159995 | 0.12661 | 0.071110 | 0.456796 |
| Parameter | WP I | WP II |
|---|---|---|
| Tool Electrode | Graphite | Graphite |
| Dielectric medium | PMEDM (Cu) | PMEDM (Gr) |
| Pulse-off time | 15 µs | 15 µs |
| Pulse-on time | 45 µs | 45 µs |
| Current | 8 Amp | 4 Amp |
Publisher’s Note: MDPI stays neutral with regard to jurisdictional claims in published maps and institutional affiliations. |
© 2021 by the authors. Licensee MDPI, Basel, Switzerland. This article is an open access article distributed under the terms and conditions of the Creative Commons Attribution (CC BY) license (https://creativecommons.org/licenses/by/4.0/).
Share and Cite
Sidhu, S.S.; Ablyaz, T.R.; Bains, P.S.; Muratov, K.R.; Shlykov, E.S.; Shiryaev, V.V. Parametric Optimization of Electric Discharge Machining of Metal Matrix Composites Using Analytic Hierarchy Process. Micromachines 2021, 12, 1289. https://0-doi-org.brum.beds.ac.uk/10.3390/mi12111289
Sidhu SS, Ablyaz TR, Bains PS, Muratov KR, Shlykov ES, Shiryaev VV. Parametric Optimization of Electric Discharge Machining of Metal Matrix Composites Using Analytic Hierarchy Process. Micromachines. 2021; 12(11):1289. https://0-doi-org.brum.beds.ac.uk/10.3390/mi12111289
Chicago/Turabian StyleSidhu, Sarabjeet Singh, Timur Rizovich Ablyaz, Preetkanwal Singh Bains, Karim Ravilevich Muratov, Evgeny Sergeevich Shlykov, and Vladislav Vitalyevich Shiryaev. 2021. "Parametric Optimization of Electric Discharge Machining of Metal Matrix Composites Using Analytic Hierarchy Process" Micromachines 12, no. 11: 1289. https://0-doi-org.brum.beds.ac.uk/10.3390/mi12111289