
Remote Recognition of Moving Behaviors for Captive Harbor Seals Using a Smart-Patch System via Bluetooth Communication


 and
and
Abstract
:1. Introduction
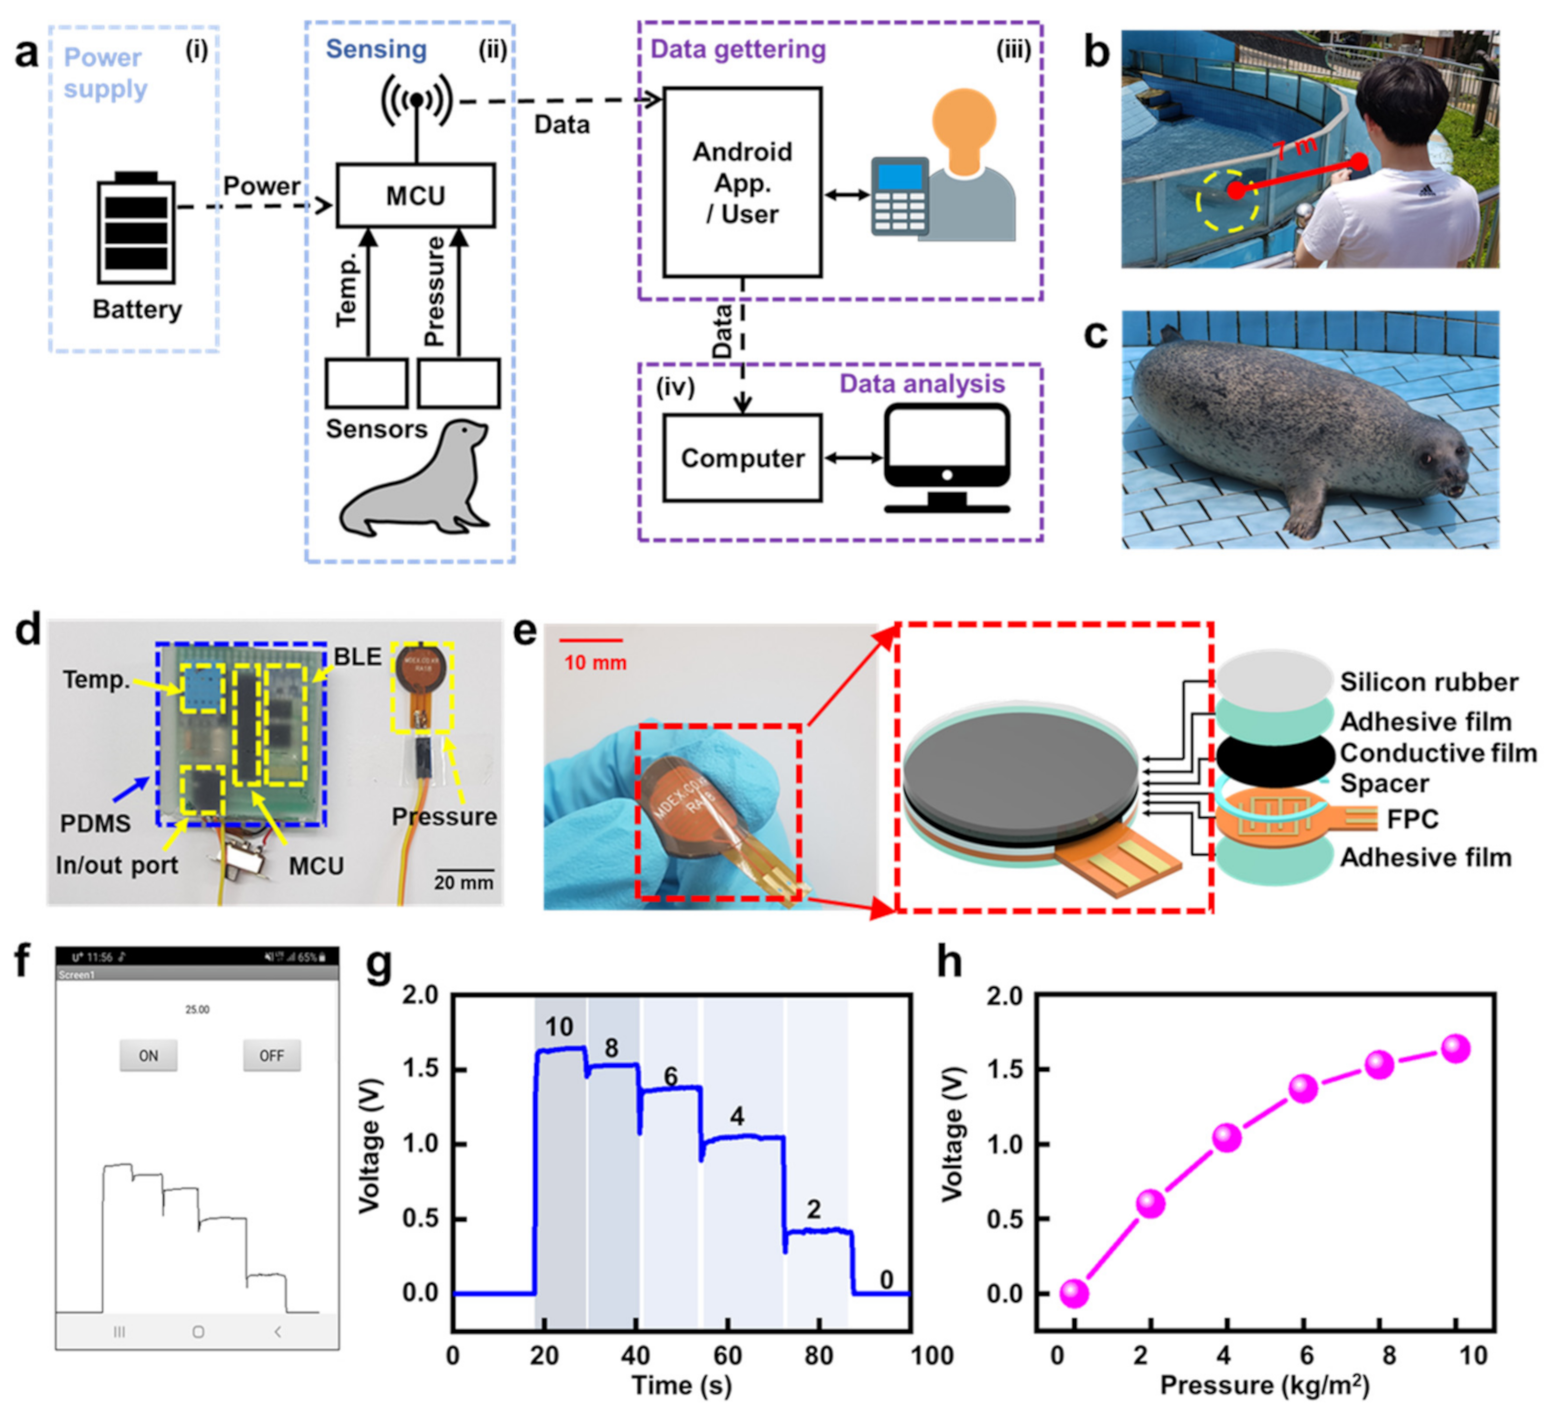
2. System Architecture
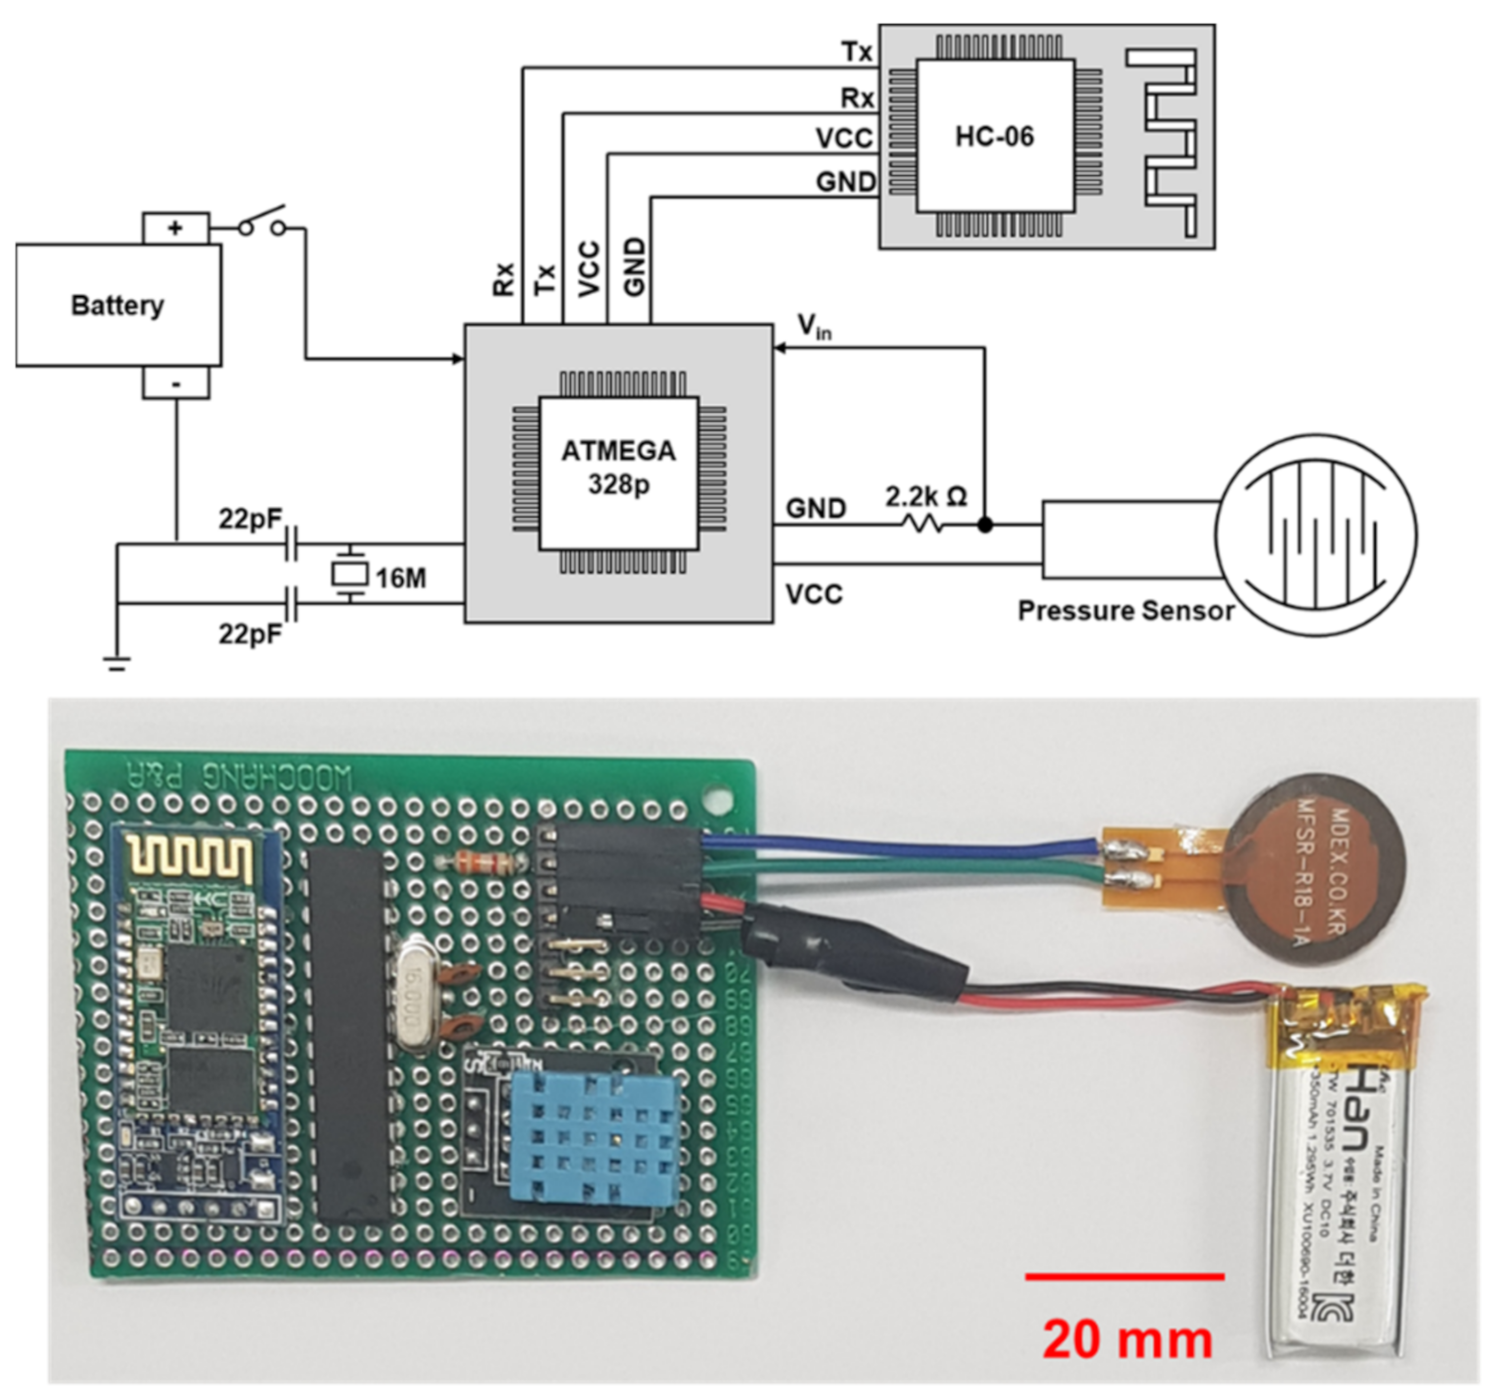
2.1. Hardware
2.1.1. Background on Sensors for Motion Capture
2.1.2. Specifications of Microcontroller Units (MCUs)
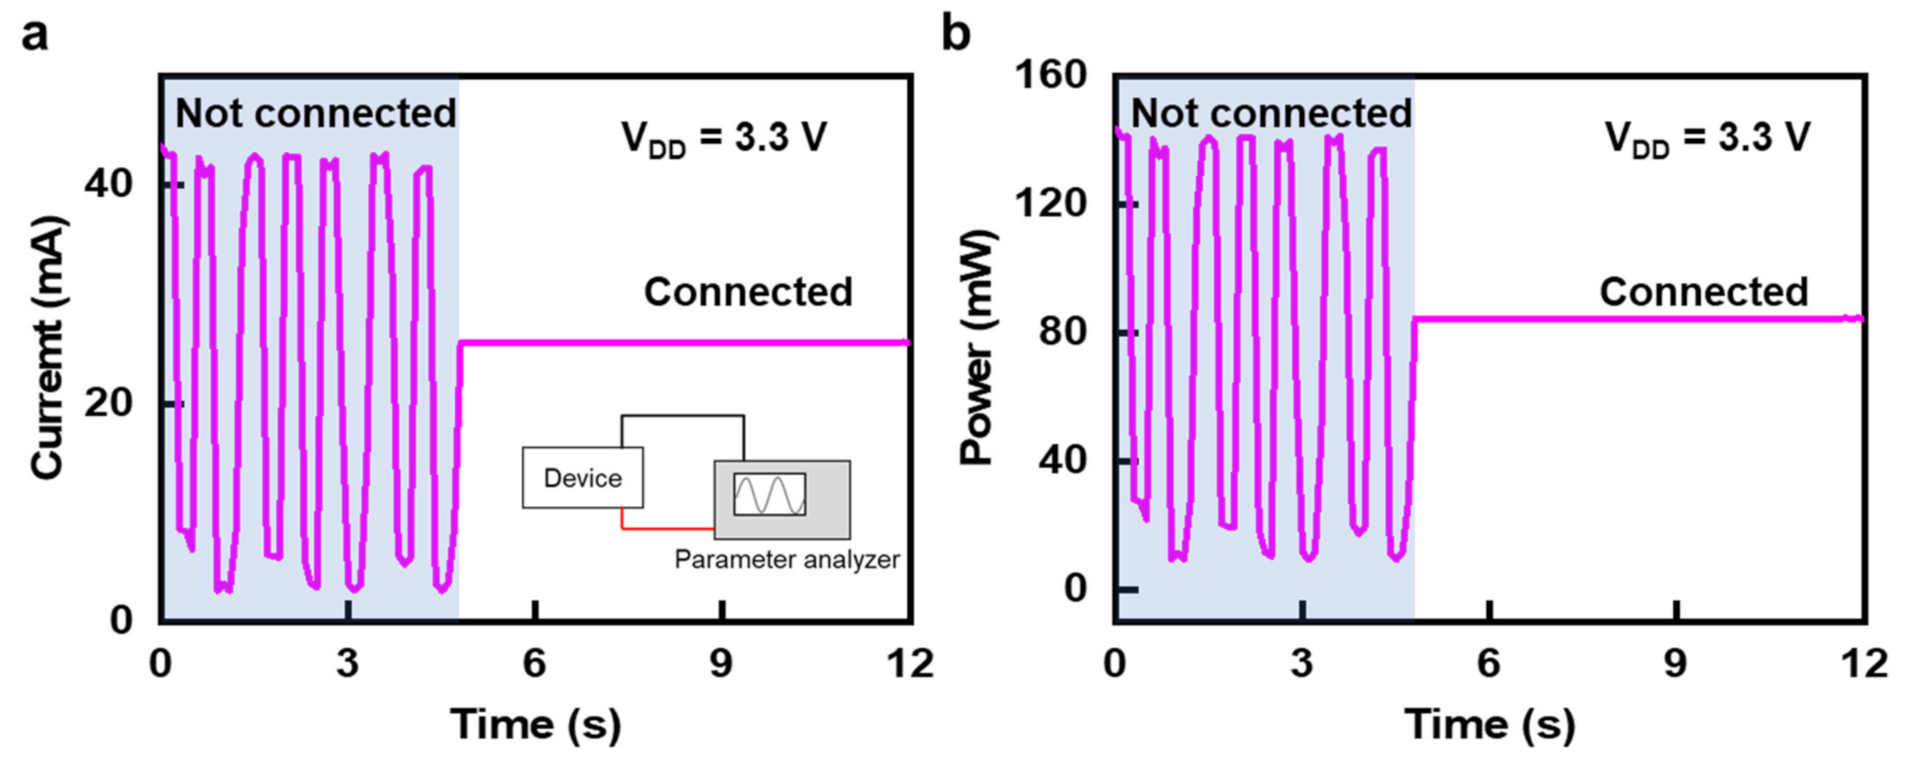
2.1.3. Estimation of Power Consumption
2.2. Software Platforms for Biologging System
2.3. System Design
3. Results
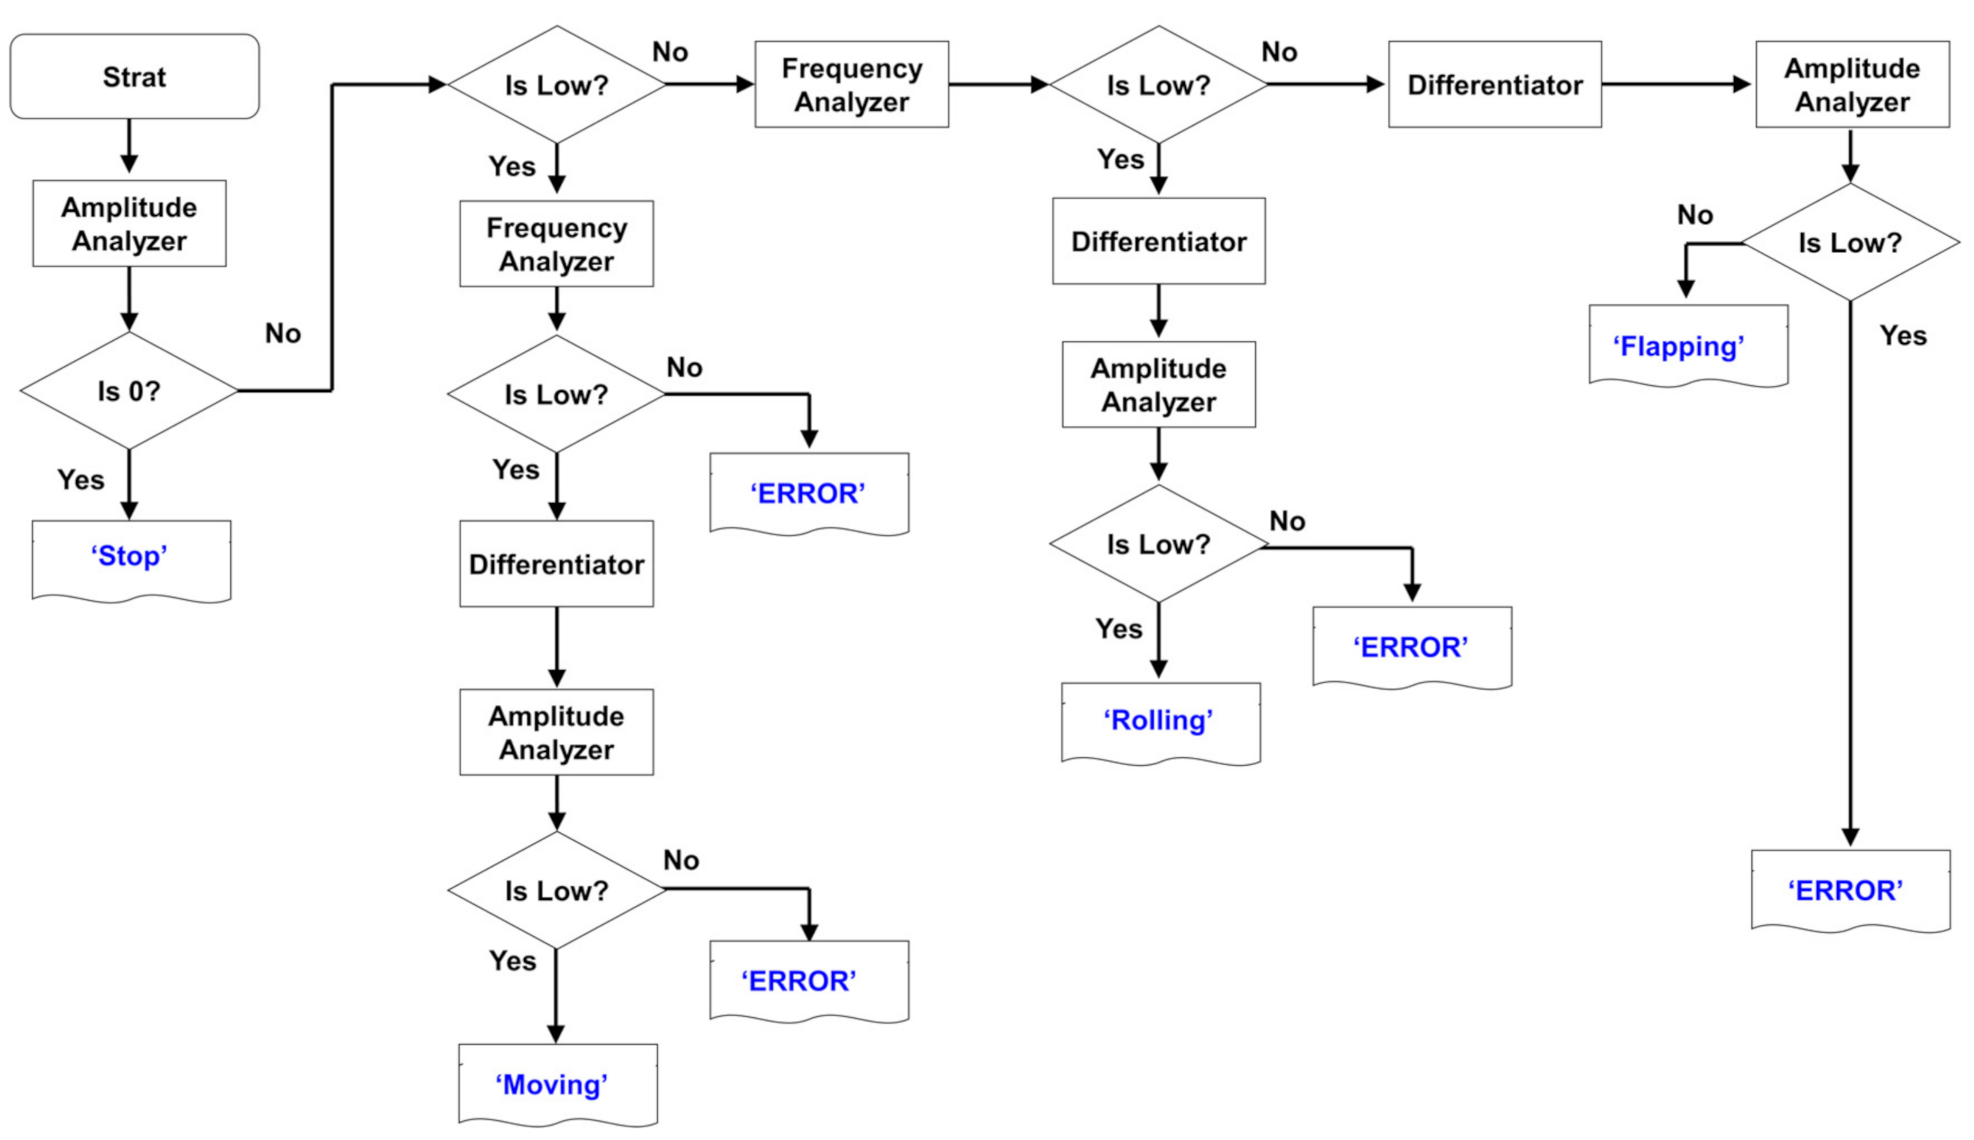
3.1. Method
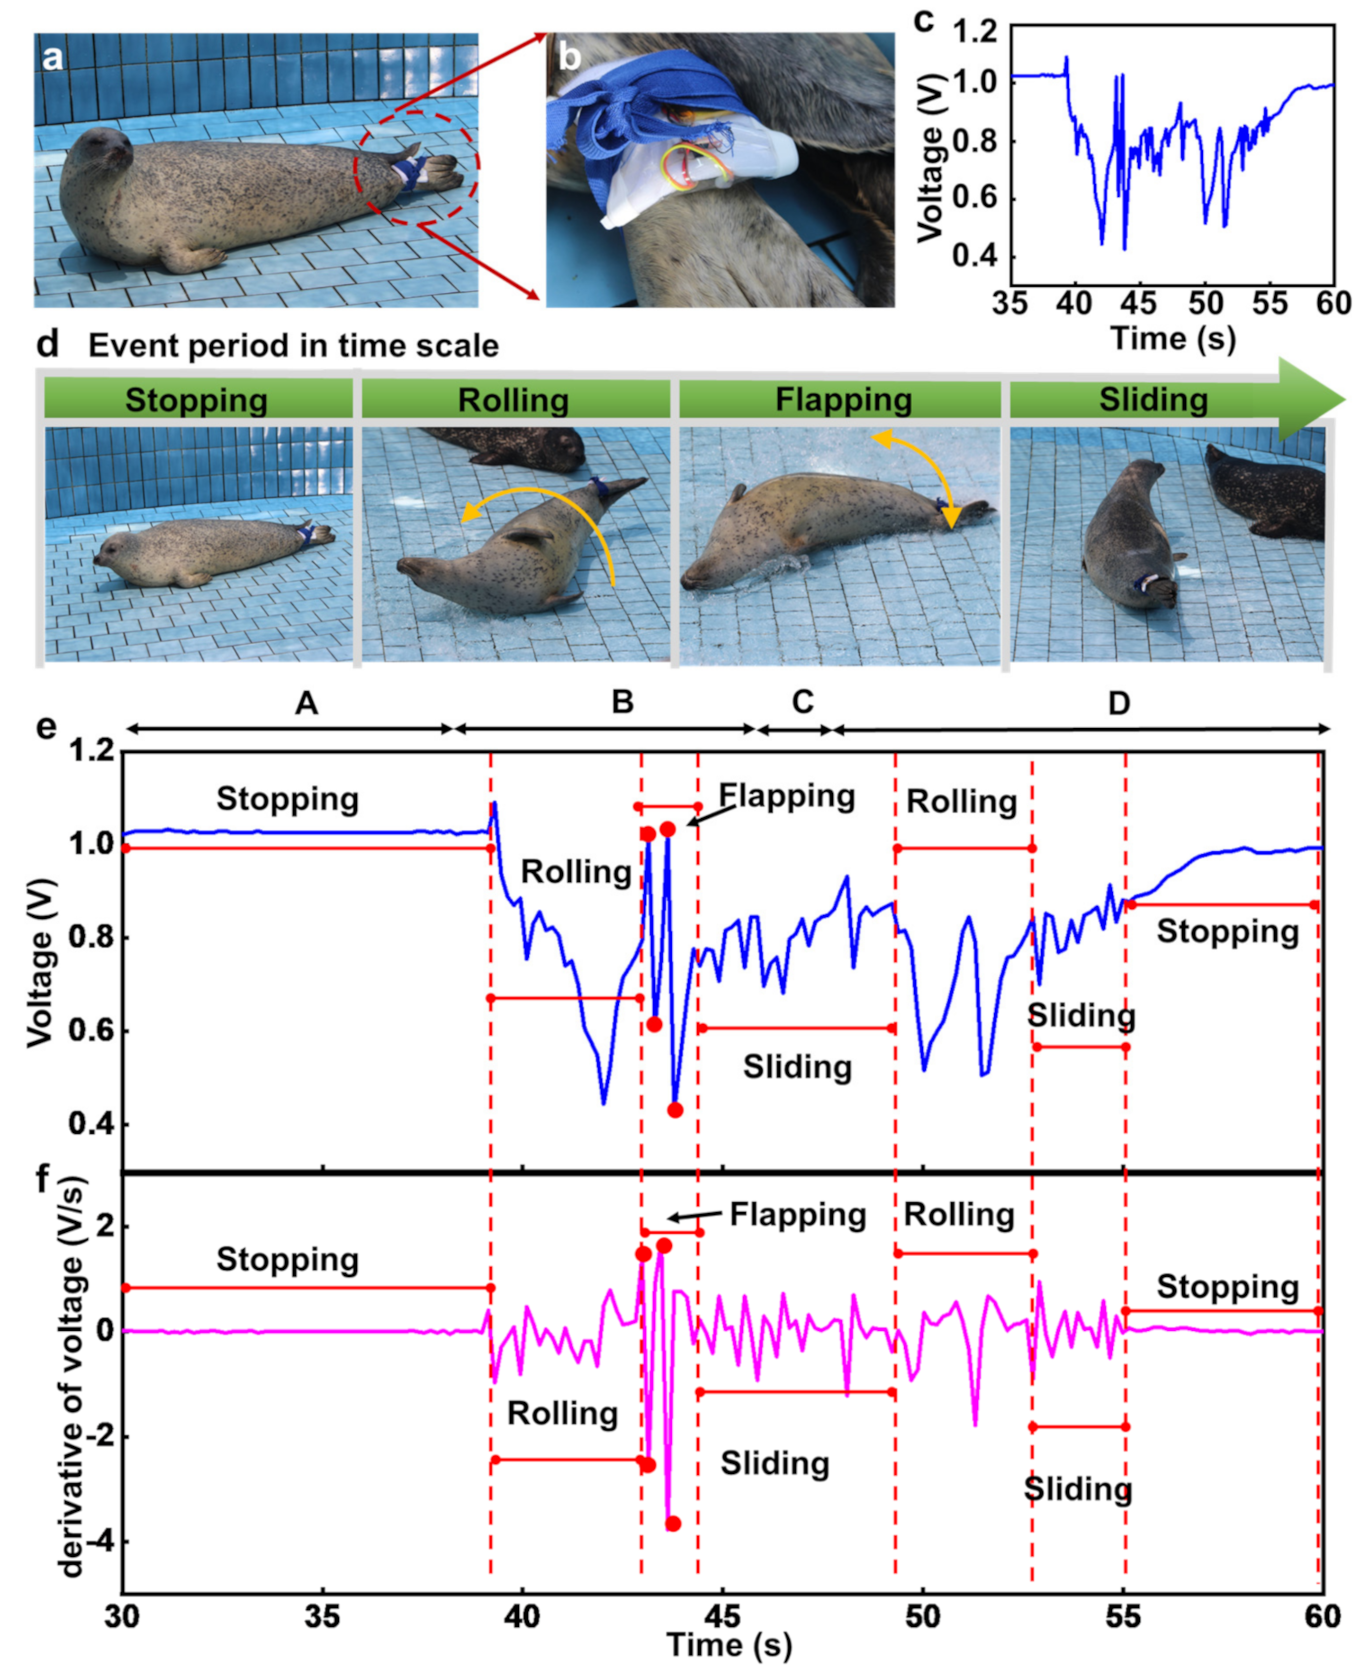
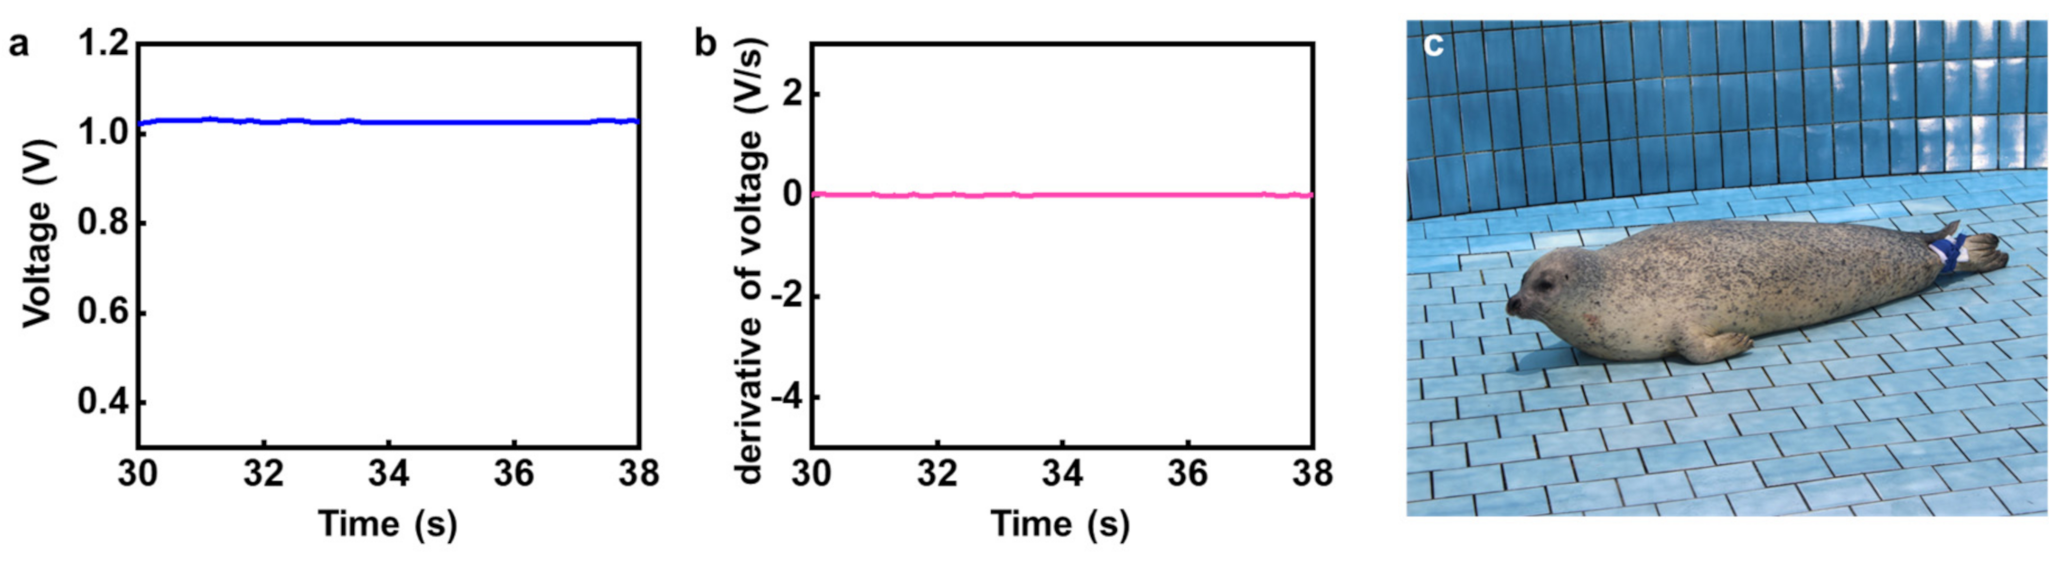
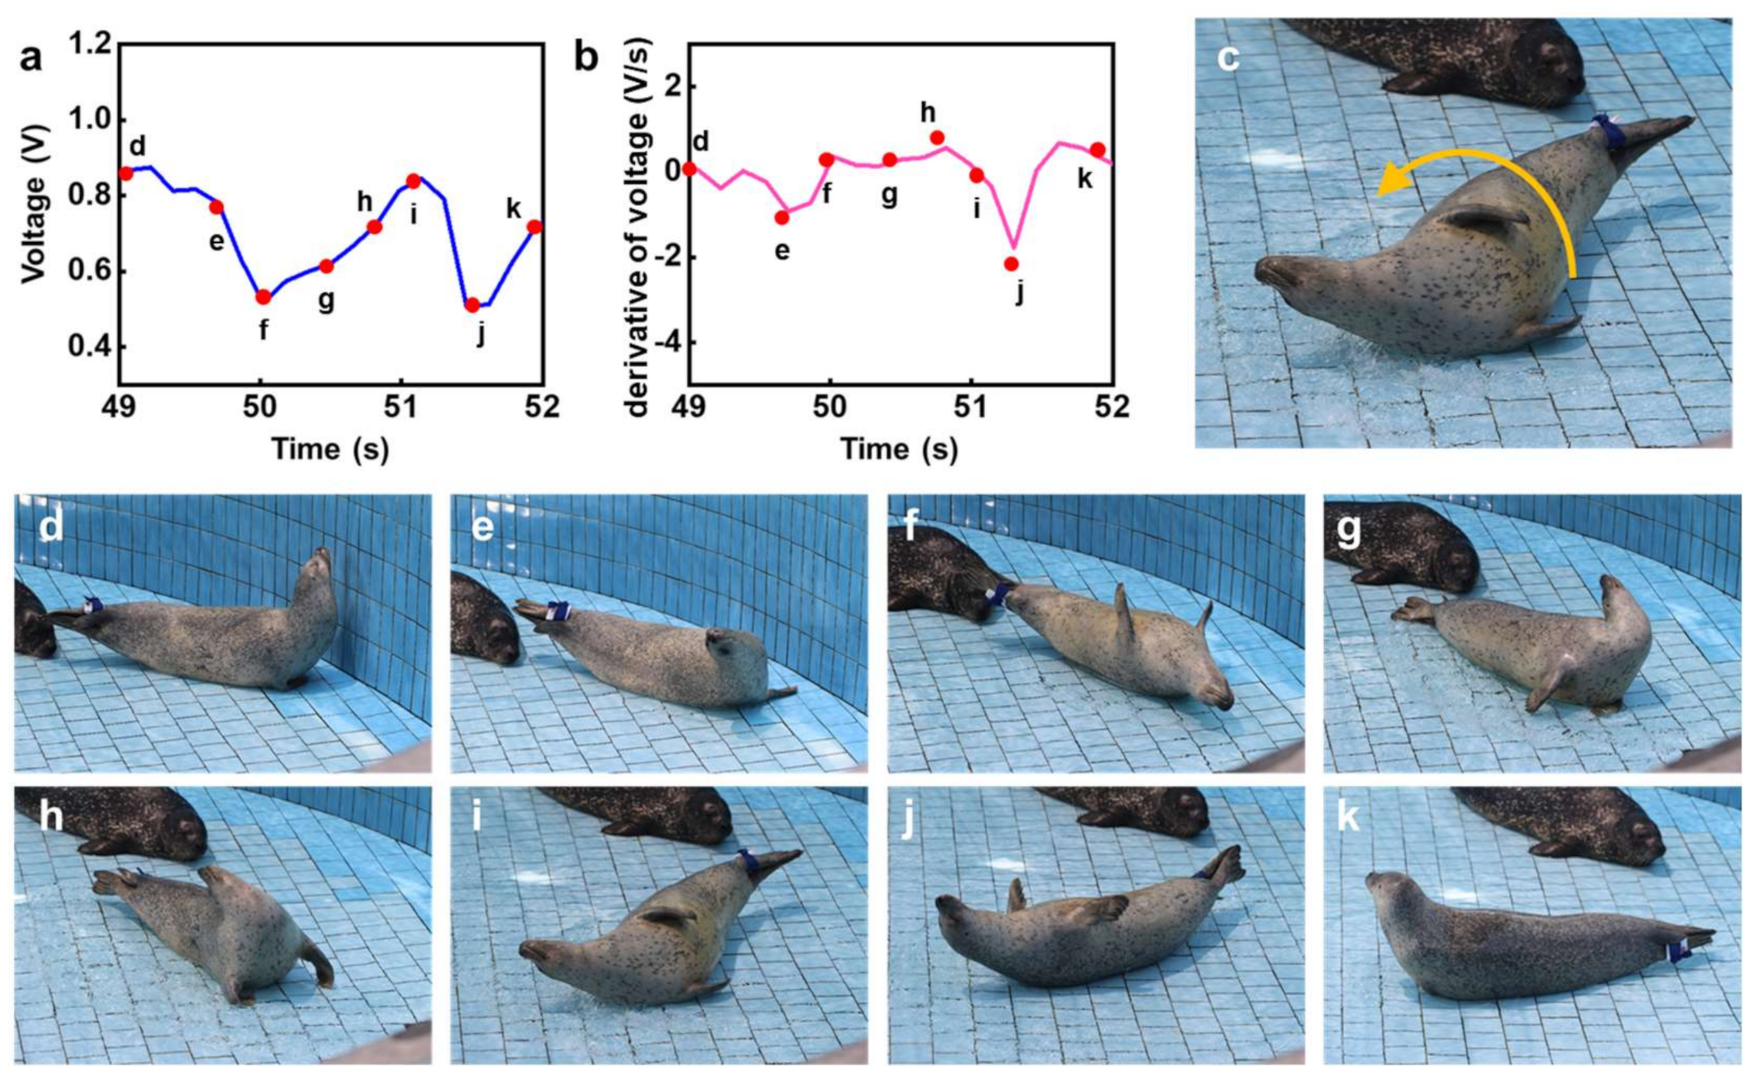
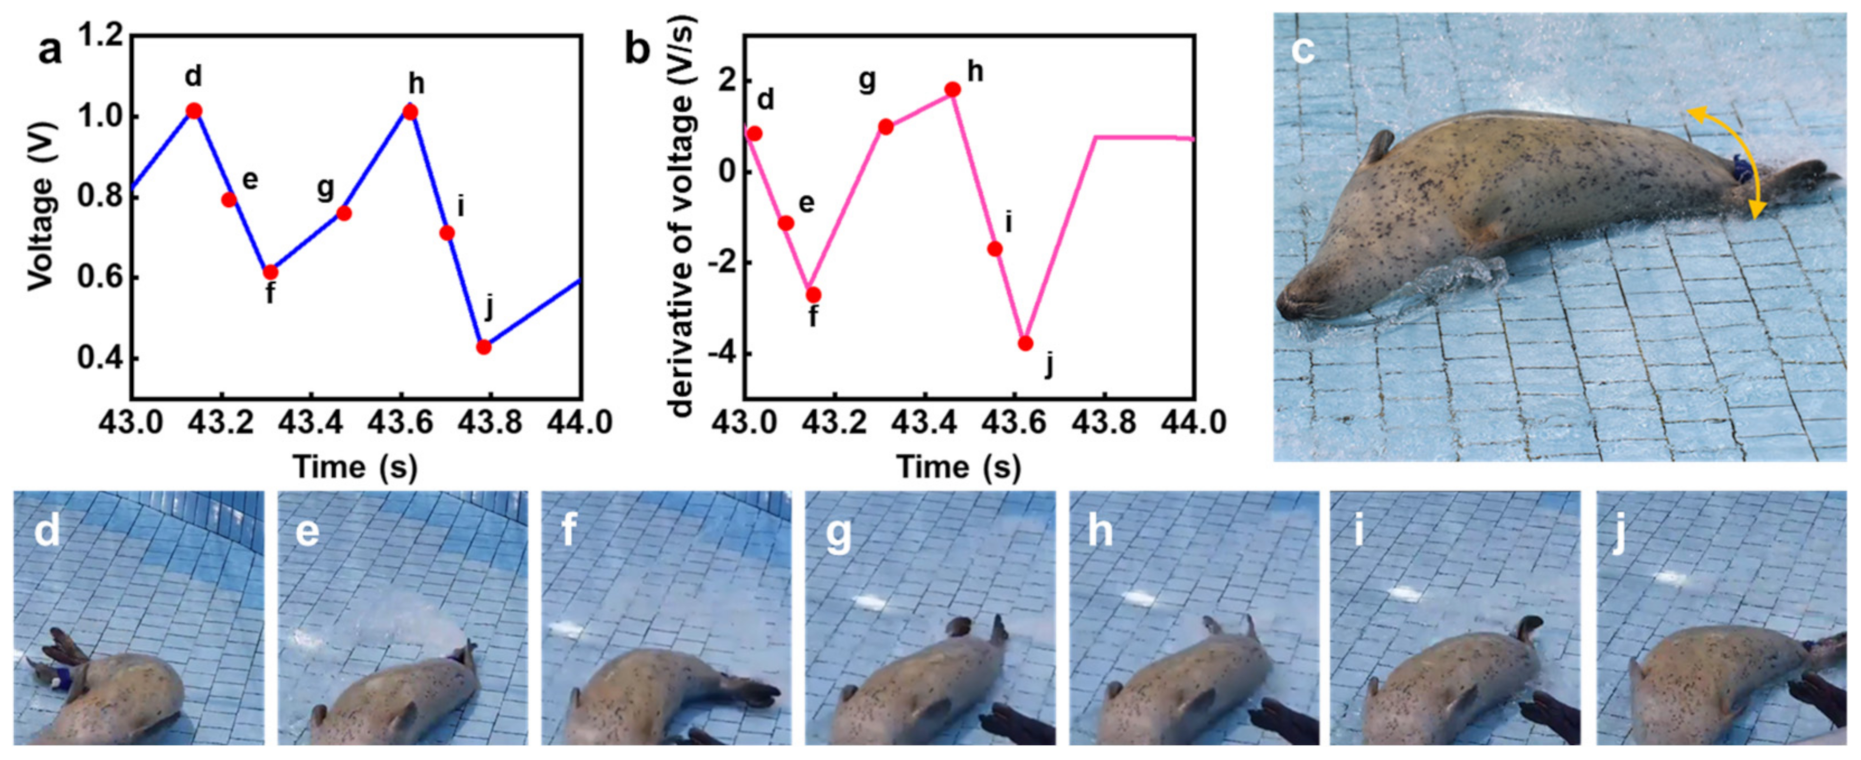
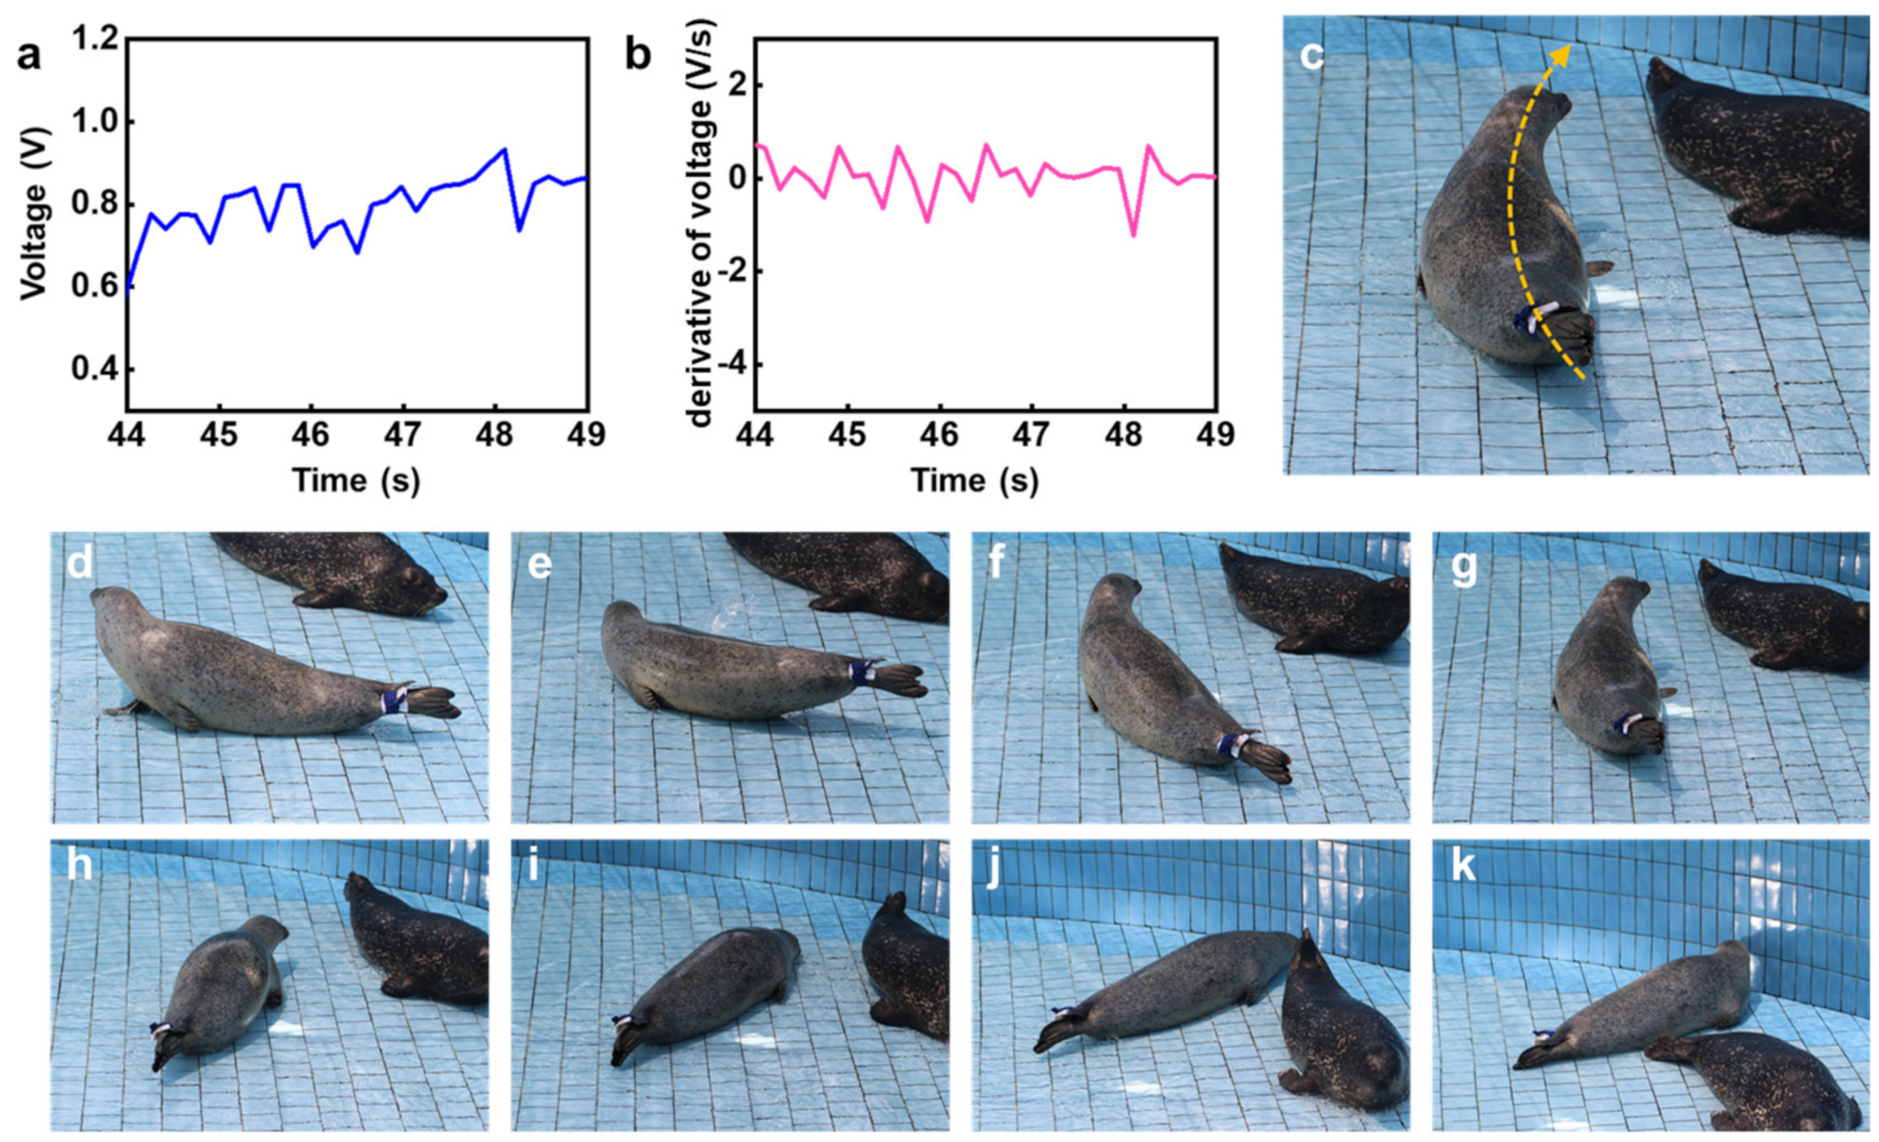
3.2. Observed Behavior
4. Conclusions
Supplementary Materials
Author Contributions
Funding
Institutional Review Board Statement
Acknowledgments
Conflicts of Interest
References
- Scheibe, K.M.; Gromann, C. Application testing of a new three-dimensional acceleration measuring system with wireless data transfer (WAS) for behavior analysis. Behav. Res. Methods 2006, 38, 427–433. [Google Scholar] [CrossRef] [PubMed] [Green Version]
- Brown, D.D.; Lapoint, S.; Kays, R.; Heidrich, W.; Kümeth, F.; Wikelski, M. Accelerometer-informed GPS telemetry: Reducing the trade-off between resolution and longevity. Wildl. Soc. Bull. 2012, 36, 139–146. [Google Scholar] [CrossRef]
- Murchie, K.J.; Cooke, S.J.; Danylchuk, A.J.; Suski, C.D. Estimates of field activity and metabolic rates of bonefish (Albula vulpes) in coastal marine habitats using acoustic tri-axial accelerometer transmitters and intermittent-flow respirometry. J. Exp. Mar. Biol. Ecol. 2011, 396, 147–155. [Google Scholar] [CrossRef]
- Lear, K.O.; Whitney, N.M. Bringing data to the surface: Recovering data loggers for large sample sizes from marine vertebrates. Anim. Biotelemetry 2016, 4, 1–10. [Google Scholar] [CrossRef] [Green Version]
- Kraska, J.; Crespo, G.O.; Johnston, D.W. Bio-logging of marine migratory species in the law of the sea. Mar. Policy 2015, 51, 394–400. [Google Scholar] [CrossRef]
- Hvas, M.; Folkedal, O.; Oppedal, F. Heart rate bio-loggers as welfare indicators in Atlantic salmon (Salmo salar) aquaculture. Aquaculture 2020, 529, 735630. [Google Scholar] [CrossRef]
- Huff, D.D.; Lindley, S.T.; Wells, B.K.; Chai, F. Green Sturgeon Distribution in the Pacific Ocean Estimated from Modeled Oceanographic Features and Migration Behavior. PLoS ONE 2012, 7, e45852. [Google Scholar] [CrossRef] [PubMed]
- Ladds, M.A.; Thompson, A.P.; Slip, D.J.; Hocking, D.P.; Harcourt, R.G. Seeing it all: Evaluating supervised machine learning methods for the classification of diverse otariid behaviours. PLoS ONE 2016, 11, e0166898. [Google Scholar] [CrossRef]
- Jeantet, L.; Dell’Amico, F.; Forin-Wiart, M.A.; Coutant, M.; Bonola, M.; Etienne, D.; Gresser, J.; Regis, S.; Lecerf, N.; Lefebvre, F.; et al. Combined use of two supervised learning algorithms to model sea turtle behaviours from tri-axial acceleration data. J. Exp. Biol. 2018, 221. [Google Scholar] [CrossRef] [Green Version]
- Korpela, J.; Suzuki, H.; Matsumoto, S.; Mizutani, Y.; Samejima, M.; Maekawa, T.; Nakai, J.; Yoda, K. Machine learning enables improved runtime and precision for bio-loggers on seabirds. Commun. Biol. 2020, 3, 1–9. [Google Scholar] [CrossRef]
- Klimley, A.P. Highly directional swimming by scalloped hammerhead sharks, Sphyrna lewini, and subsurface irradiance, temperature, bathymetry, and geomagnetic field. Mar. Biol. 1993, 117, 1–22. [Google Scholar] [CrossRef]
- Zhang, D.; van der Hoop, J.M.; Petrov, V.; Rocho-Levine, J.; Moore, M.J.; Shorter, K.A. Simulated and experimental estimates of hydrodynamic drag from bio-logging tags. Mar. Mammal. Sci. 2020, 36, 136–157. [Google Scholar] [CrossRef]
- Abe, T.; Kubo, N.; Abe, K.; Suzuki, H.; Yoda, K.; Tadakuma, R.; Tsumaki, Y. Study on hypercompact and lightweight data logger separators for wild animals. Adv. Robot. 2021, 35, 81–92. [Google Scholar] [CrossRef]
- Nourani, E.; Becciu, P.; Bierregaard, R.O.; Duriez, O.; Giokas, S.; Higuchi, H.; Kassara, C.; Kulikova, O.; Lecomte, N.; Monti, F.; et al. Sea-crossing along migratory flyways is limited more strongly by wind than by lack of uplift. bioRxiv 2020, 1–13. [Google Scholar] [CrossRef]
- Shiomi, K.; Kokubun, N.; Shimabukuro, U.; Takahashi, A. Homing Ability of Adélie Penguins Investigated with Displacement Experiments and Bio-Logging. Ardea 2019, 107, 333–339. [Google Scholar] [CrossRef]
- Whitford, M.; Klimley, A.P. An overview of behavioral, physiological, and environmental sensors used in animal biotelemetry and biologging studies. Anim. Biotelemetry 2019, 7, 1–24. [Google Scholar] [CrossRef]
- Fehlmann, G.; King, A.J. Bio-logging. Curr. Biol. 2016, 26, R830–R831. [Google Scholar] [CrossRef] [PubMed] [Green Version]
- Liechti, F.; Bauer, S.; Dhanjal-Adams, K.L.; Emmenegger, T.; Zehtindjiev, P.; Hahn, S. Miniaturized multi-sensor loggers provide new insight into year-round flight behaviour of small trans-Sahara avian migrants. Mov. Ecol. 2018, 6, 1–10. [Google Scholar] [CrossRef] [PubMed] [Green Version]
- Brown, D.D.; Kays, R.; Wikelski, M.; Wilson, R.; Klimley, A. Observing the unwatchable through acceleration logging of animal behavior. Anim. Biotelemetry 2013, 1, 20. [Google Scholar] [CrossRef] [Green Version]
- Natio, Y. New steps in bio-logging science. Mem. Natl. Inst. Polar Res. Spec. Issue 2004, 58, 50–57. [Google Scholar]
- Whitney, N.M.; Papastamatiou, Y.P.; Holland, K.N.; Lowe, C.G. Use of an acceleration data logger to measure diel activity patterns in captive whitetip reef sharks, Triaenodon obesus. Aquat. Living Resour. 2008, 305, 299–305. [Google Scholar] [CrossRef] [Green Version]
- Rothwell, E.S.; Bercovitch, F.B.; Andrews, J.R.M.; Anderson, M.J. Estimating daily walking distance of captive African elephants using an accelerometer. Zoo Biol. 2011, 30, 579–591. [Google Scholar] [CrossRef] [PubMed]
- Ismail, A.; Rahman, F.; Miyazaki, N.; Naito, Y. Initial application of bio-logging techniques on captive Milky Stork (Mycteria cinerea) in Malaysia. Trop. Ecol. 2012, 53, 177–181. [Google Scholar]
- Clayton, S.; Fraser, J.; Saunders, C.D. Zoo experiences: Conversations, connections, and concern for animals. Zoo Biol. 2009, 28, 377–397. [Google Scholar] [CrossRef] [PubMed]
- Alex Shorter, K.; Shao, Y.; Ojeda, L.; Barton, K.; Rocho-Levine, J.; van der Hoop, J.; Moore, M. A day in the life of a dolphin: Using bio-logging tags for improved animal health and well-being. Mar. Mammal. Sci. 2017, 33, 785–802. [Google Scholar] [CrossRef]
- Lowry, L. Phoca vitulina, Harbor Seal. IUCN Red List Threat. Species 2016. [Google Scholar] [CrossRef]
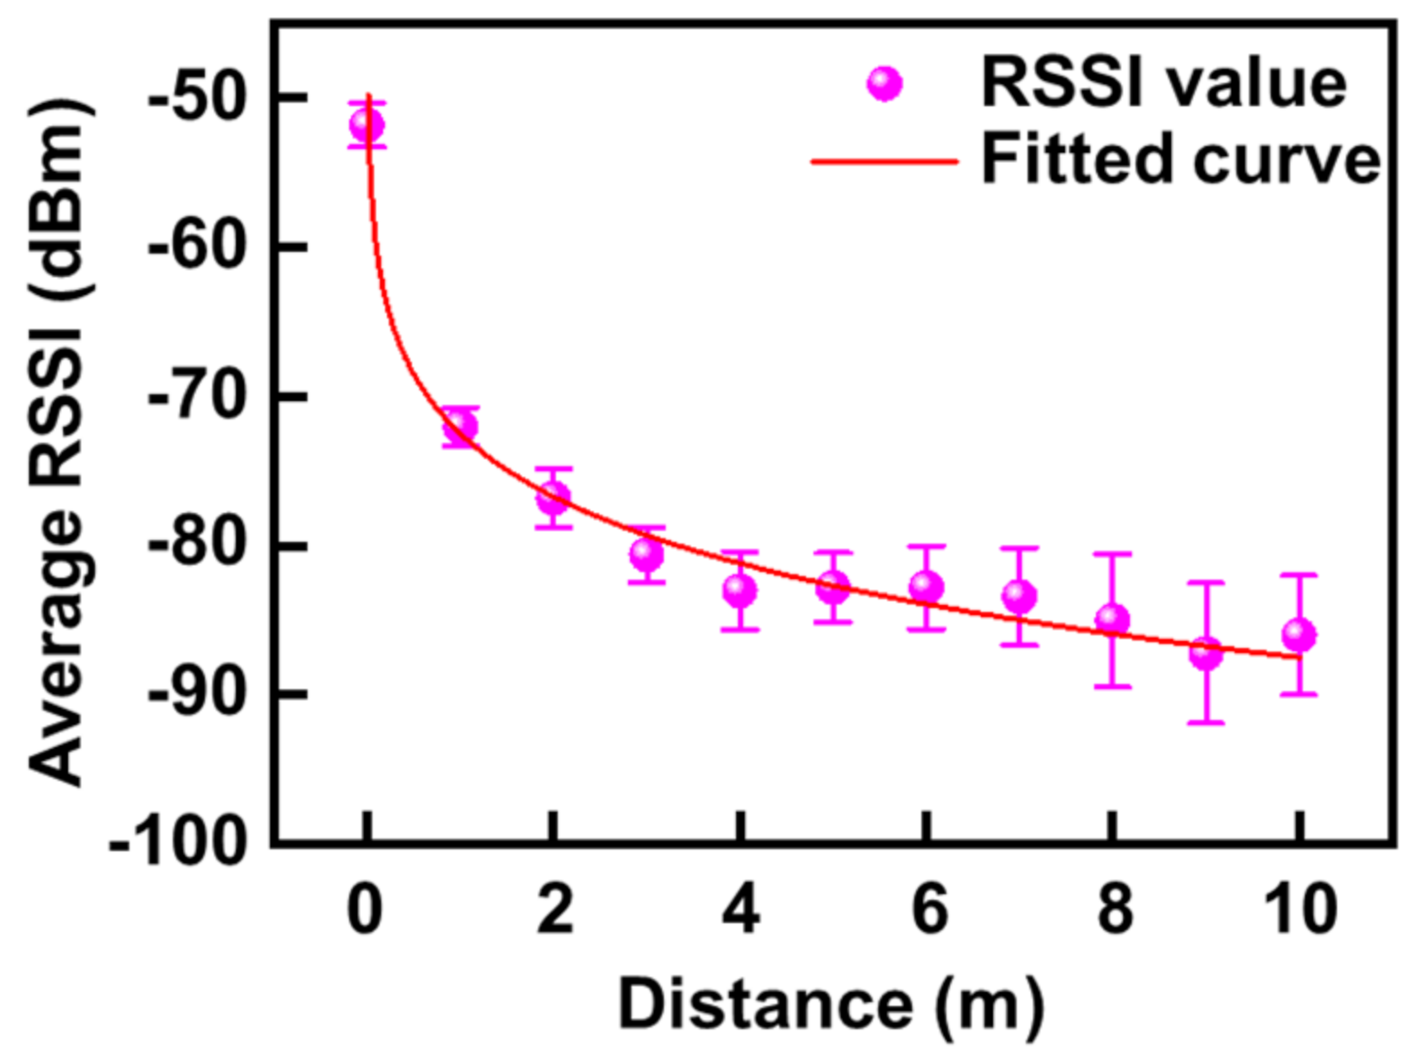
- Bakula, C.; Schneider, W.H.; Roth, J. Probabilistic model based on the effective range and vehicle speed to determine bluetooth MAC address matches from roadside traffic monitoring. J. Transp. Eng. 2011, 138, 43–49. [Google Scholar] [CrossRef] [Green Version]
- Etxaniz, J.; Alonso, A.; Aranguren, G. Influence of the the distance between Bluetooth 2.0 nodes and their link mode with the communication delay. In Proceedings of the 2010 Third International Conference on Advances in Circuits, Electronics and Micro-Electronics, Venice/Mestre, Italy, 18–25 July 2010; pp. 12–16. [Google Scholar] [CrossRef]
- Bertuletti, S.; Cereatti, A.; Della, U.; Caldara, M.; Galizzi, M. Indoor distance estimated from Bluetooth Low Energy signal strength: Comparison of regression models. In Proceedings of the 2016 IEEE Sensors Applications Symposium (SAS), Catania, Italy, 20–22 April 2016. [Google Scholar] [CrossRef]
- Klimley, A.P.; Agosta, T.V.; Ammann, A.J.; Battleson, R.D.; Pagel, M.D.; Thomas, M.J. Real-time nodes permit adaptive management of endangered species of fishes. Anim. Biotelemetry 2017, 5, 1–15. [Google Scholar] [CrossRef] [Green Version]
- Cigas, J.; Klimley, A.P. A microcomputer interface for decoding telemetry data and displaying them numerically and graphically in real time. Behav. Res. Methods Instrum. Comput. 1987, 19, 19–25. [Google Scholar] [CrossRef]
- Wilson, K.; Littnan, C.; Halpin, P.; Read, A. Integrating multiple technologies to understand the foraging behaviour of Hawaiian monk seals. R. Soc. Open Sci. 2017, 4, 160703. [Google Scholar] [CrossRef]
- Hammond, T.T.; Springthorpe, D.; Walsh, R.E.; Berg-Kirkpatrick, T. Using accelerometers to remotely and automatically characterize behavior in small animals. J. Exp. Biol. 2016, 219, 1618–1624. [Google Scholar] [CrossRef] [Green Version]
- McClune, D.W.; Marks, N.J.; Wilson, R.P.; Houghton, J.D.R.; Montgomery, I.W.; McGowan, N.E.; Gormley, E.; Scantlebury, M. Tri-axial accelerometers quantify behaviour in the Eurasian badger (Meles meles): Towards an automated interpretation of field data. Anim. Biotelemetry 2014, 2, 1–6. [Google Scholar] [CrossRef] [Green Version]
- Chakravarty, P.; Cozzi, G.; Ozgul, A.; Aminian, K. A novel biomechanical approach for animal behaviour recognition using accelerometers. Methods Ecol. Evol. 2019, 10, 802–814. [Google Scholar] [CrossRef] [Green Version]
- Wang, F.; Lei, S.; Ou, J.; Li, W. Effect of PDMS on the waterproofing performance and corrosion resistance of cement mortar. Appl. Surf. Sci. 2020, 507, 145016. [Google Scholar] [CrossRef]
- Guo, Y.; Zhou, W.; Wang, L.; Dong, Y.; Yu, J.; Li, X.; Ding, B. Stretchable PDMS Embedded Fibrous Membranes Based on an Ethanol Solvent System for Waterproof and Breathable Applications. ACS Appl. Bio Mater. 2019, 2, 5949–5956. [Google Scholar] [CrossRef]
- Lin, Y.F.; Wang, W.W.; Chang, C.Y. Environmentally sustainable, fluorine-free and waterproof breathable PDMS/PS nanofibrous membranes for carbon dioxide capture. J. Mater. Chem. A 2018, 6, 9489–9497. [Google Scholar] [CrossRef]
- Petrosyan, T.; Dunoyan, A.; Mkrtchyan, H. Application of Motion Capture Systems in Ergonomic Analysis. Armen. J. Spec. Educ. 2020, 1, 107–117. [Google Scholar] [CrossRef]
- Pang, M.; Guo, S.; Huang, Q.; Ishihara, H.; Hirata, H. Electromyography-based quantitative representation method for upper-limb elbow joint angle in sagittal plane. J. Med. Biol. Eng. 2015, 35, 165–177. [Google Scholar] [CrossRef] [Green Version]
- Lee, J.; Shin, S.Y.; Ghorpade, G.; Akbas, T.; Sulzer, J. Sensitivity comparison of inertial to optical motion capture during gait: Implications for tracking recovery. IEEE Int. Conf. Rehabil. Robot. 2019, 2019, 139–144. [Google Scholar] [CrossRef]
- Kim, J.Y.; Park, M.J.; Park, K. Control algorithm and evaluation of a powered wheeled walker for tracking a user. Adv. Mech. Eng. 2017, 9, 1–12. [Google Scholar] [CrossRef] [Green Version]
- Yahya, M.; Shah, J.A.; Warsi, A.; Kadir, K.; Khan, S.; Izani, M. Real Time Elbow Angle Estimation Using Single RGB Camera. arXiv 2018, arXiv:1808.07017. [Google Scholar]
- Manghisi, V.M.; Uva, A.E.; Fiorentino, M.; Bevilacqua, V.; Trotta, G.F.; Monno, G. Real time RULA assessment using Kinect v2 sensor. Appl. Ergon. 2017, 65, 481–491. [Google Scholar] [CrossRef] [PubMed]
- Rawal, A.; Chehata, A.; Horberry, T.; Shumack, M.; Chen, C.; Bonato, L. Defining the upper extremity range of motion for safe automobile driving. Clin. Biomech. 2018, 54, 78–85. [Google Scholar] [CrossRef] [PubMed]
- Méry, D.; Singh, N.K. Real-Time Static Gesture Recognition for Upper Extremity Rehabilitation Using the Leap Motion. Lect. Notes Comput. Sci. 2015, 9185, 345–357. [Google Scholar] [CrossRef]
- Li, Q.; Li, J.; Tran, D.; Luo, C.; Gao, Y.; Yu, C.; Xuan, F. Engineering of carbon nanotube/polydimethylsiloxane nanocomposites with enhanced sensitivity for wearable motion sensors. J. Mater. Chem. C 2017, 5, 11092–11099. [Google Scholar] [CrossRef]
- Cai, Y.; Shen, J.; Ge, G.; Zhang, Y.; Jin, W.; Huang, W.; Shao, J.; Yang, J.; Dong, X. Stretchable Ti3C2Tx MXene/Carbon Nanotube Composite Based Strain Sensor with Ultrahigh Sensitivity and Tunable Sensing Range. ACS Nano 2018, 12, 56–62. [Google Scholar] [CrossRef]
- Yang, Z.; Pang, Y.; Han, X.L.; Yang, Y.; Yang, Y.; Ling, J.; Jian, M.; Zhang, Y.; Ren, T.L. Graphene Textile Strain Sensor with Negative Resistance Variation for Human Motion Detection. ACS Nano 2018, 12, 9134–9141. [Google Scholar] [CrossRef] [PubMed]
- Oh, J.; Yang, J.C.; Kim, J.O.; Park, H.; Kwon, S.Y.; Lee, S.; Sim, J.Y.; Oh, H.W.; Kim, J.; Park, S. Pressure insensitive strain sensor with facile solution-based process for tactile sensing applications. ACS Nano 2018, 12, 7546–7553. [Google Scholar] [CrossRef]
- Gao, Y.; Guo, F.; Cao, P.; Liu, J.; Li, D.; Wu, J.; Wang, N.; Su, Y.; Zhao, Y. Winding-Locked Carbon Nanotubes/Polymer Nanofibers Helical Yarn for Ultrastretchable Conductor and Strain Sensor. ACS Nano 2020, 14, 3442–3450. [Google Scholar] [CrossRef] [PubMed]
- Deng, C.; Gao, P.; Lan, L.; He, P.; Zhao, X.; Zheng, W.; Chen, W.; Zhong, X.; Wu, Y.; Liu, L.; et al. Ultrasensitive and Highly Stretchable Multifunctional Strain Sensors with Timbre-Recognition Ability Based on Vertical Graphene. Adv. Funct. Mater. 2019, 29, 1–11. [Google Scholar] [CrossRef]
- Hwang, H.; Kim, Y.; Park, J.H.; Jeong, U. 2D Percolation Design with Conductive Microparticles for Low-Strain Detection in a Stretchable Sensor. Adv. Funct. Mater. 2020, 30, 1–11. [Google Scholar] [CrossRef]
- Amjadi, M.; Pichitpajongkit, A.; Lee, S.; Ryu, S.; Park, I. Highly stretchable and sensitive strain sensor based on silver nanowire-elastomer nanocomposite. ACS Nano 2014, 8, 5154–5163. [Google Scholar] [CrossRef] [PubMed]
- Lewandowski, M.; Orczyk, T.; Porwik, P. Dedicated AVR bootloader for performance improvement of prototyping process. In Proceedings of the 2017 MIXDES-24th International Conference Mixed Design of Integrated Circuits and Systems, Bydgoszcz, Poland, 22–24 June 2017; pp. 553–557. [Google Scholar] [CrossRef]
- Bravo-Zanoguera, M.; Cuevas-González, D.; García-Vázquez, J.P.; Avitia, R.L.; Reyna, M.A. Portable ECG System Design Using the AD8232 Microchip and Open-Source Platform. Proceedings 2019, 42, 49. [Google Scholar] [CrossRef] [Green Version]
- Bocca, A.; Sassone, A.; Shin, D.; Macii, A.; Macii, E.; Poncino, M. An equation-based battery cycle life model for various battery chemistries. IEEE/IFIP Int. Conf. VLSI Syst. VLSI-SoC 2015, 2015, 57–62. [Google Scholar] [CrossRef]
- Park, D.Y.; Joe, D.J.; Kim, D.H.; Park, H.; Han, J.H.; Jeong, C.K.; Park, H.; Park, J.G.; Joung, B.; Lee, K.J. Self-Powered Real-Time Arterial Pulse Monitoring Using Ultrathin Epidermal Piezoelectric Sensors. Adv. Mater. 2017, 29, 1–9. [Google Scholar] [CrossRef] [PubMed]
- Niu, S.; Matsuhisa, N.; Beker, L.; Li, J.; Wang, S.; Wang, J.; Jiang, Y.; Yan, X.; Yun, Y.; Burnett, W.; et al. A wireless body area sensor network based on stretchable passive tags. Nat. Electron. 2019, 2, 361–368. [Google Scholar] [CrossRef]
- Ma, J.; Harpaz, D.; Liu, Y.; Eltzov, E. Smartphone-Based Whole-Cell Biosensor Platform Utilizing an Immobilization Approach on a Filter Membrane Disk for the Monitoring ofWater Toxicants. Sensors 2020, 20, 5486. [Google Scholar] [CrossRef] [PubMed]
- Ali, S.M.; Chung, W. Monitoring Transepidermal Water Loss and Skin Wettedness Factor with Battery-Free NFC Sensor. Sensors 2020, 20, 5549. [Google Scholar] [CrossRef]
- Wang, J.M.; Yang, M.T.; Chen, P.L. Design and implementation of an intelligent windowsill system using smart handheld device and fuzzy microcontroller. Sensors 2017, 17, 830. [Google Scholar] [CrossRef] [Green Version]
- Ruiz-Rube, I.; Mota, J.M.; Person, T.; Corral, J.M.R.; Dodero, J.M. Block-based development of mobile learning experiences for the internet of things. Sensors 2019, 19, 5467. [Google Scholar] [CrossRef] [Green Version]
- Mnati, M.J.; Van den Bossche, A.; Chisab, R.F. A smart voltage and current monitoring system for three phase inverters using an android smartphone application. Sensors 2017, 17, 872. [Google Scholar] [CrossRef] [PubMed]


| Current (mA) | Power (mW) | |
|---|---|---|
| MCU | ~7 | 23.1 |
| Bluetooth | ~18 | 59.4 |
| Temp sensor | ~0 | ~0 |
| Pressure sensor | ~0 | ~0 |
| Behavior | Frequency (Hz) | Amplitude (V) | Amplitude for the Signal of ‘Derivative of Amplitude’ (dV/dt) |
|---|---|---|---|
| Stop | - | <0.1 | - |
| Rolling | >1 | >0.5 | <3 |
| Flapping | <1 | >0.5 | >3 |
| Sliding | <1 | <0.5 | <3 |
Publisher’s Note: MDPI stays neutral with regard to jurisdictional claims in published maps and institutional affiliations. |
© 2021 by the authors. Licensee MDPI, Basel, Switzerland. This article is an open access article distributed under the terms and conditions of the Creative Commons Attribution (CC BY) license (http://creativecommons.org/licenses/by/4.0/).
Share and Cite
Kim, S.; Jeong, J.; Seo, S.G.; Im, S.; Lee, W.Y.; Jin, S.H. Remote Recognition of Moving Behaviors for Captive Harbor Seals Using a Smart-Patch System via Bluetooth Communication. Micromachines 2021, 12, 267. https://0-doi-org.brum.beds.ac.uk/10.3390/mi12030267
Kim S, Jeong J, Seo SG, Im S, Lee WY, Jin SH. Remote Recognition of Moving Behaviors for Captive Harbor Seals Using a Smart-Patch System via Bluetooth Communication. Micromachines. 2021; 12(3):267. https://0-doi-org.brum.beds.ac.uk/10.3390/mi12030267
Chicago/Turabian StyleKim, Seungyeob, Jinheon Jeong, Seung Gi Seo, Sehyeok Im, Won Young Lee, and Sung Hun Jin. 2021. "Remote Recognition of Moving Behaviors for Captive Harbor Seals Using a Smart-Patch System via Bluetooth Communication" Micromachines 12, no. 3: 267. https://0-doi-org.brum.beds.ac.uk/10.3390/mi12030267