Article

SIRT2 Contributes to the Resistance of Melanoma Cells to the Multikinase Inhibitor Dasatinib

by
Iwona Karwaciak
1,
Anna Sałkowska
2,
Kaja Karaś
2,
Marta Sobalska-Kwapis
3,4,
Aurelia Walczak-Drzewiecka
5,
Łukasz Pułaski
1,
Dominik Strapagiel
3,4,
Jarosław Dastych
5 and
Marcin Ratajewski
2,*
1
Laboratory of Transcriptional Regulation, Institute of Medical Biology, Polish Academy of Sciences, 93-232 Lodz, Poland
2
Laboratory of Epigenetics, Institute of Medical Biology, Polish Academy of Sciences, 93-232 Lodz, Poland
3
Biobank Lab, Department of Molecular Biophysics, Faculty of Biology and Environmental Protection, University of Lodz, 90-237 Lodz, Poland
4
BBMRI.pl Consortium, 54-066 Wroclaw, Poland
5
Laboratory of Cellular Immunology, Institute of Medical Biology, Polish Academy of Sciences, 93-232 Lodz, Poland
*
Author to whom correspondence should be addressed.
Submission received: 5 April 2019 / Revised: 8 May 2019 / Accepted: 12 May 2019 / Published: 14 May 2019
(This article belongs to the Collection Drug Resistance and Novel Therapies in Cancers)

Abstract

:
Malignant melanoma is the most aggressive skin cancer and can only be cured if detected early. Unfortunately, later stages of the disease do not guarantee success due to the rapid rate of melanoma cell metastasis and their high resistance to applied therapies. The search for new molecular targets and targeted therapy may represent the future in the development of effective methods for combating this cancer. SIRT2 is a promising target; thus, we downregulated SIRT2 expression in melanoma cells in vertical growth and metastatic phases and demonstrated that sirtuin acts as regulator of the basic functions of melanoma cells. A detailed transcriptomic analysis showed that SIRT2 regulates the expression of multiple genes encoding the tyrosine kinase pathways that are molecular targets of dasatinib. Indeed, cells with low SIRT2 expression were more susceptible to dasatinib, as demonstrated by multiple techniques, e.g., neutral red uptake, 3/7 caspase activity, colony formation assay, and in vitro scratch assay. Furthermore, these cells showed an altered phosphorylation profile for proteins playing roles in the response to dasatinib. Thus, our research indicates new, previously unknown SIRT2 functions in the regulation of gene expression, which is of key clinical significance.

1. Introduction

Malignant melanoma is the most aggressive skin cancer, and its incidence is increasing each year [1]. Standard chemotherapy with dacarbazine and immunotherapy with recombinant IL-2 or INFα provide low response rates, and have no effect on the overall survival of patients [2,3,4,5,6]. Combination therapy with several compounds used concurrently, e.g., cisplatin, vinblastine, and dacarbazine (CVD regiment) or cisplatin, dacarbazine, carmustine, and tamoxifen (DBCT regiment, or Darmouth regimen), shows a greater response rate percentage [7,8,9], but does not significantly influence overall survival [3]. Failures in the treatment of advanced melanomas are caused by the intrinsic resistance of the cells to known chemotherapeutic agents, which may be related to melanocyte physiology, particularly the production of melanin. This metabolic process generates many highly cytotoxic compounds that create the endogenous melanogenic cytotoxicity (EMC) to which melanocytes are well adapted [10,11]. It is possible that the factor(s) that allows a normal cell to perform its function also supplies a cancer cell with a weapon that we are not yet able to defeat. The exact processes by which resistance is acquired by melanoma cells are, to a great extent, unknown, and our knowledge in this area is greatly limited. There is evidence that the regulation of apoptosis-related processes by overexpression of some proteins, such as ABC transporters, may have significance [12,13,14,15,16]. Other potential mechanisms of resistance include the altered expression of transcription factors (e.g., MITF) [17] and the interaction of melanoma cells with fibroblasts and macrophages in the tumor microenvironment [18,19,20,21].
As mentioned earlier, standard therapy for melanoma patients provides poor results. Nevertheless, understanding the molecular mechanisms by which melanoma cells acquire the ability to undergo uncontrolled proliferation has facilitated the discovery of new therapeutic targets and the development of targeted therapy. A high percentage (66%) of malignant melanomas carry the V600E BRAF gene mutation [22]. This mutation results in constitutive expression of the active protein activating the MAPK pathway via MEK1/2 and ERK1/2 [23] and dysregulation of the control of proliferation, differentiation, adhesion and migration [21,24]. This discovery led to the development of mutant-specific inhibitors of BRAF, vemurafenib (PLX4032) [25,26] and dabrafenib [27], which provided better clinical responses, including improved overall survival of melanoma patients compared with standard chemotherapy regimens [28,29]. Although the use of new inhibitors has improved chemotherapy for melanomas, the clinical response to these novel drugs is not permanent, and typically lasts for 6–8 months due to the acquisition of drug resistance by mutational or altered genetic expression events that reactivate the MAPK pathway [30,31,32,33,34].
Among potential molecular therapeutic targets in melanoma that have recently been gathering attention are sirtuins [35,36], which are NAD(+)-dependent, multifunctional lysine deacylases characterized by a conserved catalytic domain, the sirtuin core domain, and N- and C-terminal domains that differ in different proteins [37,38,39,40]. Different sirtuins exhibit different intracellular localizations. SIRT3, 4 and 5 are localized in mitochondria [41], while SIRT1, 2, 6 and 7 are considered nuclear proteins [42,43]. However, SIRT1 and 2 can also localize in the cytoplasm [44,45]. Most studies of sirtuin functions in melanoma have concentrated on SIRT1 [46,47,48]; however, our group [49] and others [50] have also demonstrated the possible involvement of SIRT2 in the multidrug resistance of melanomas. Using in vitro melanoma cell line-based screening, we previously identified an inhibitor of SIRT2, AC-93253, as a compound that downregulates the expression of genes involved in melanoma progression and chemoresistance acquisition [49]. This compound was subsequently also identified as an SRC inhibitor [51]. These findings prompted us to perform a more detailed analysis of the role of SIRT2 in melanoma cells. We created melanoma cell lines with downregulated SIRT2 expression in the early and metastatic phases and examined their gene expression and resistance to dasatinib treatment. We found that downregulation of SIRT2 drastically altered the gene expression profiles of melanoma cells and sensitized them to dasatinib, suggesting a potential role for SIRT2 in the melanoma therapy failures of this drug.

2. Results

2.1. Identification of SIRT2-Dependent Genetic Information in Melanoma Cells

To characterize the role of SIRT2 in melanoma cells, we downregulated the expression of this gene in two human melanoma cell lines: WM853 and MDA-MB-435S. Because earlier work has suggested that the role of SIRT2 may vary depending on the stage of disease [52], we chose two cell lines representing different stages of disease development (primary/vertical growth P/VG—WM853 and metastasis—MDA-MB-435S). When SIRT2 expression was analyzed at the protein level, the protein was below the detection level in clones transfected with SIRT2 shRNA. However, SIRT2 protein levels were the same in maternal lines in cells transfected with the control shRNA (Figure 1a). Initially, inhibition of SIRT2 expression significantly affected the phenotype in both cell lines (Figure S1a). This finding encouraged us to analyze cellular clones for gene expression profiles. To achieve this goal, RNA-seq analysis of control cells and cells with downregulated SIRT2 expression was performed. The resultant data were processed with three bioinformatics software packages: DESeq v1.32 [53], DESeq2 v1.20.0 [54] and edgeR v3.1 [55]. To identify the most significant hits, we considered only genes that were identified in all three bioinformatics analyses (to show how each tool overlaps with other tools, Venn diagrams were used, Figure S2). In WM853 and MDA-MB-435S cells, we found 3550 and 624 differentially expressed transcripts, respectively. Gene ontology analysis revealed that GO terms related to adhesion, migration, differentiation, and proliferation were overrepresented (in both melanoma cell lines) among the differentially expressed genes (Table S1 and Dataset S3). Comparisons of changes in gene expression resulting from SIRT2 depletion in the two examined cell lines showed that the expression of certain genes was altered in the same direction in the considered cell lines (e.g., ITGA1, EGFR, EPHA2, and CDKN2D were downregulated, and FGFR1 was upregulated in both cell lines), while the expression of other genes showed an opposite direction of change (e.g., SDC2 and NCAM1, upregulated in WM863 and downregulated in MDA-MB-435S; AXL, downregulated in WM863 and upregulated in MDA-MB-435S). They also included genes with altered expression in only one of the SIRT2-depleted cell lines (Table 1 and Table 2). A list of the genes that were differentially expressed included several genes coding adhesion receptors associated with cell migration, proliferation, and metastasis (integrins, cadherins, selectins, syndecans) [56,57,58,59] and cell cycle regulators [60,61,62] (Table 1 and Table 2). A particularly interesting category of differentially expressed genes comprised those encoding receptor tyrosine kinases as well as other signaling proteins involved in the MAP/ERK pathway, indicating that this particular signaling pathway might be directly or indirectly controlled by SIRT2 (Table 1 and Table 2). To assess whether the genes identified in the RNA-seq analysis were subject to expression changes in other melanoma cells when SIRT2 was inhibited, we treated A375 cells (stage: metastasis) with the SIRT2 inhibitor thiomyristoyl [63]. In contrast to other SIRT2 inhibitors, this compound inhibits deacetylation and demyristoylation functions of SIRT2 [64]. The pharmacological inhibition of SIRT2 in A375 resulted in significant inhibition of EGFR, EPHA2, ITGA1, SDC2, DDR1 and EPHB1 that was similar to the SS15 clone in MDA-MB-435S cells (Table S2).

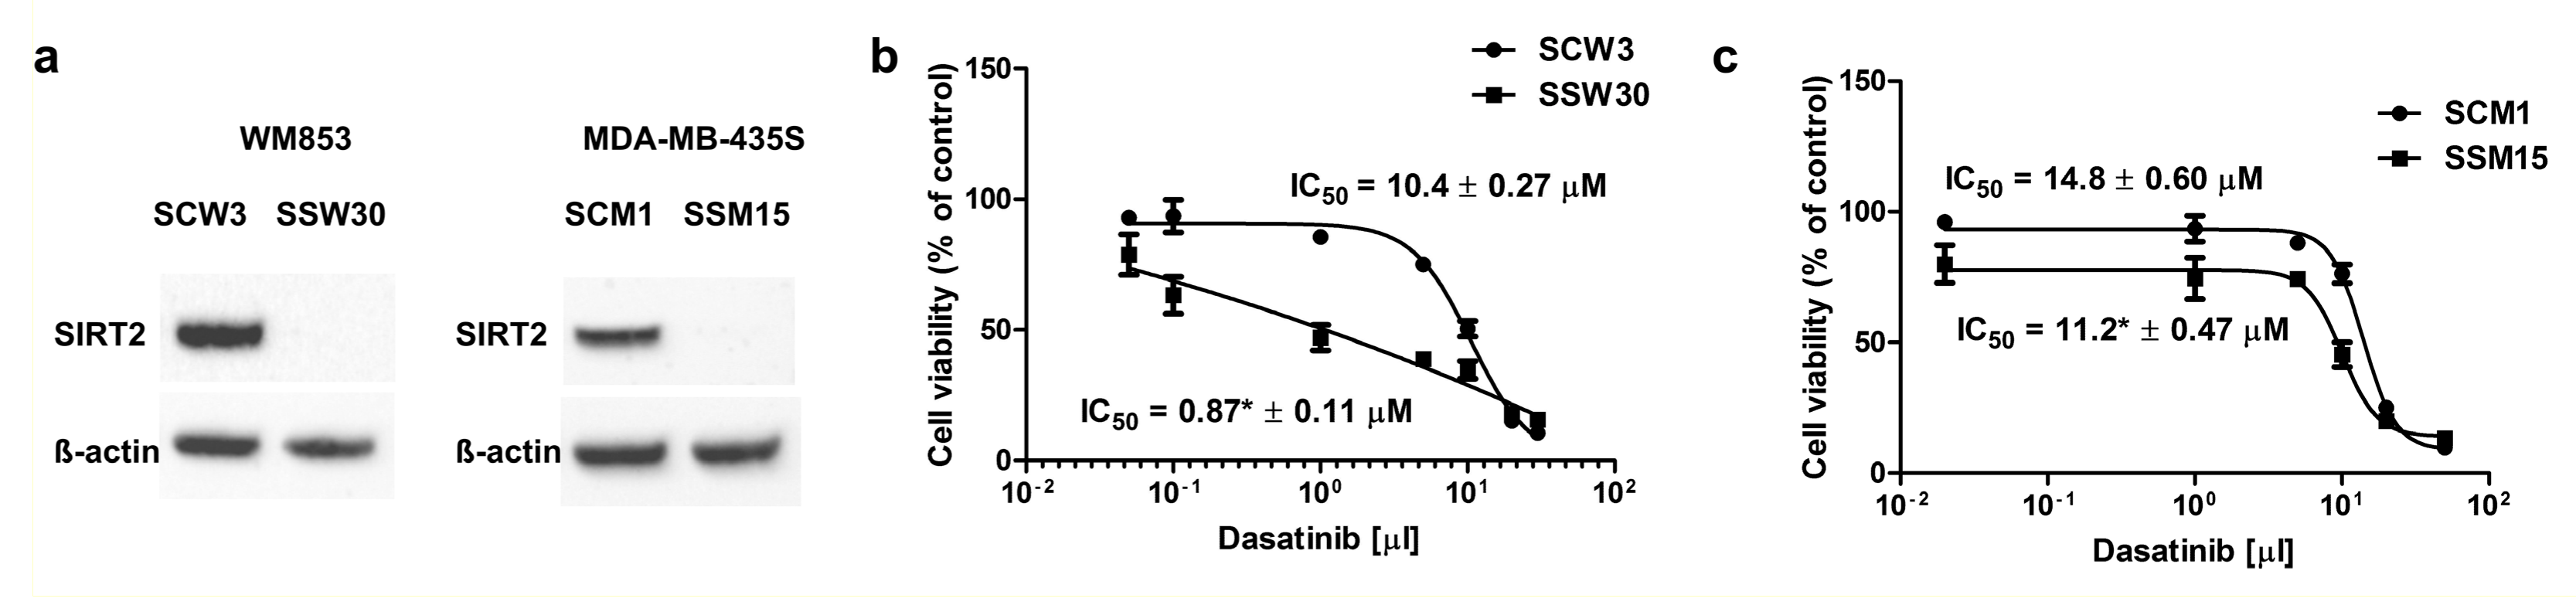
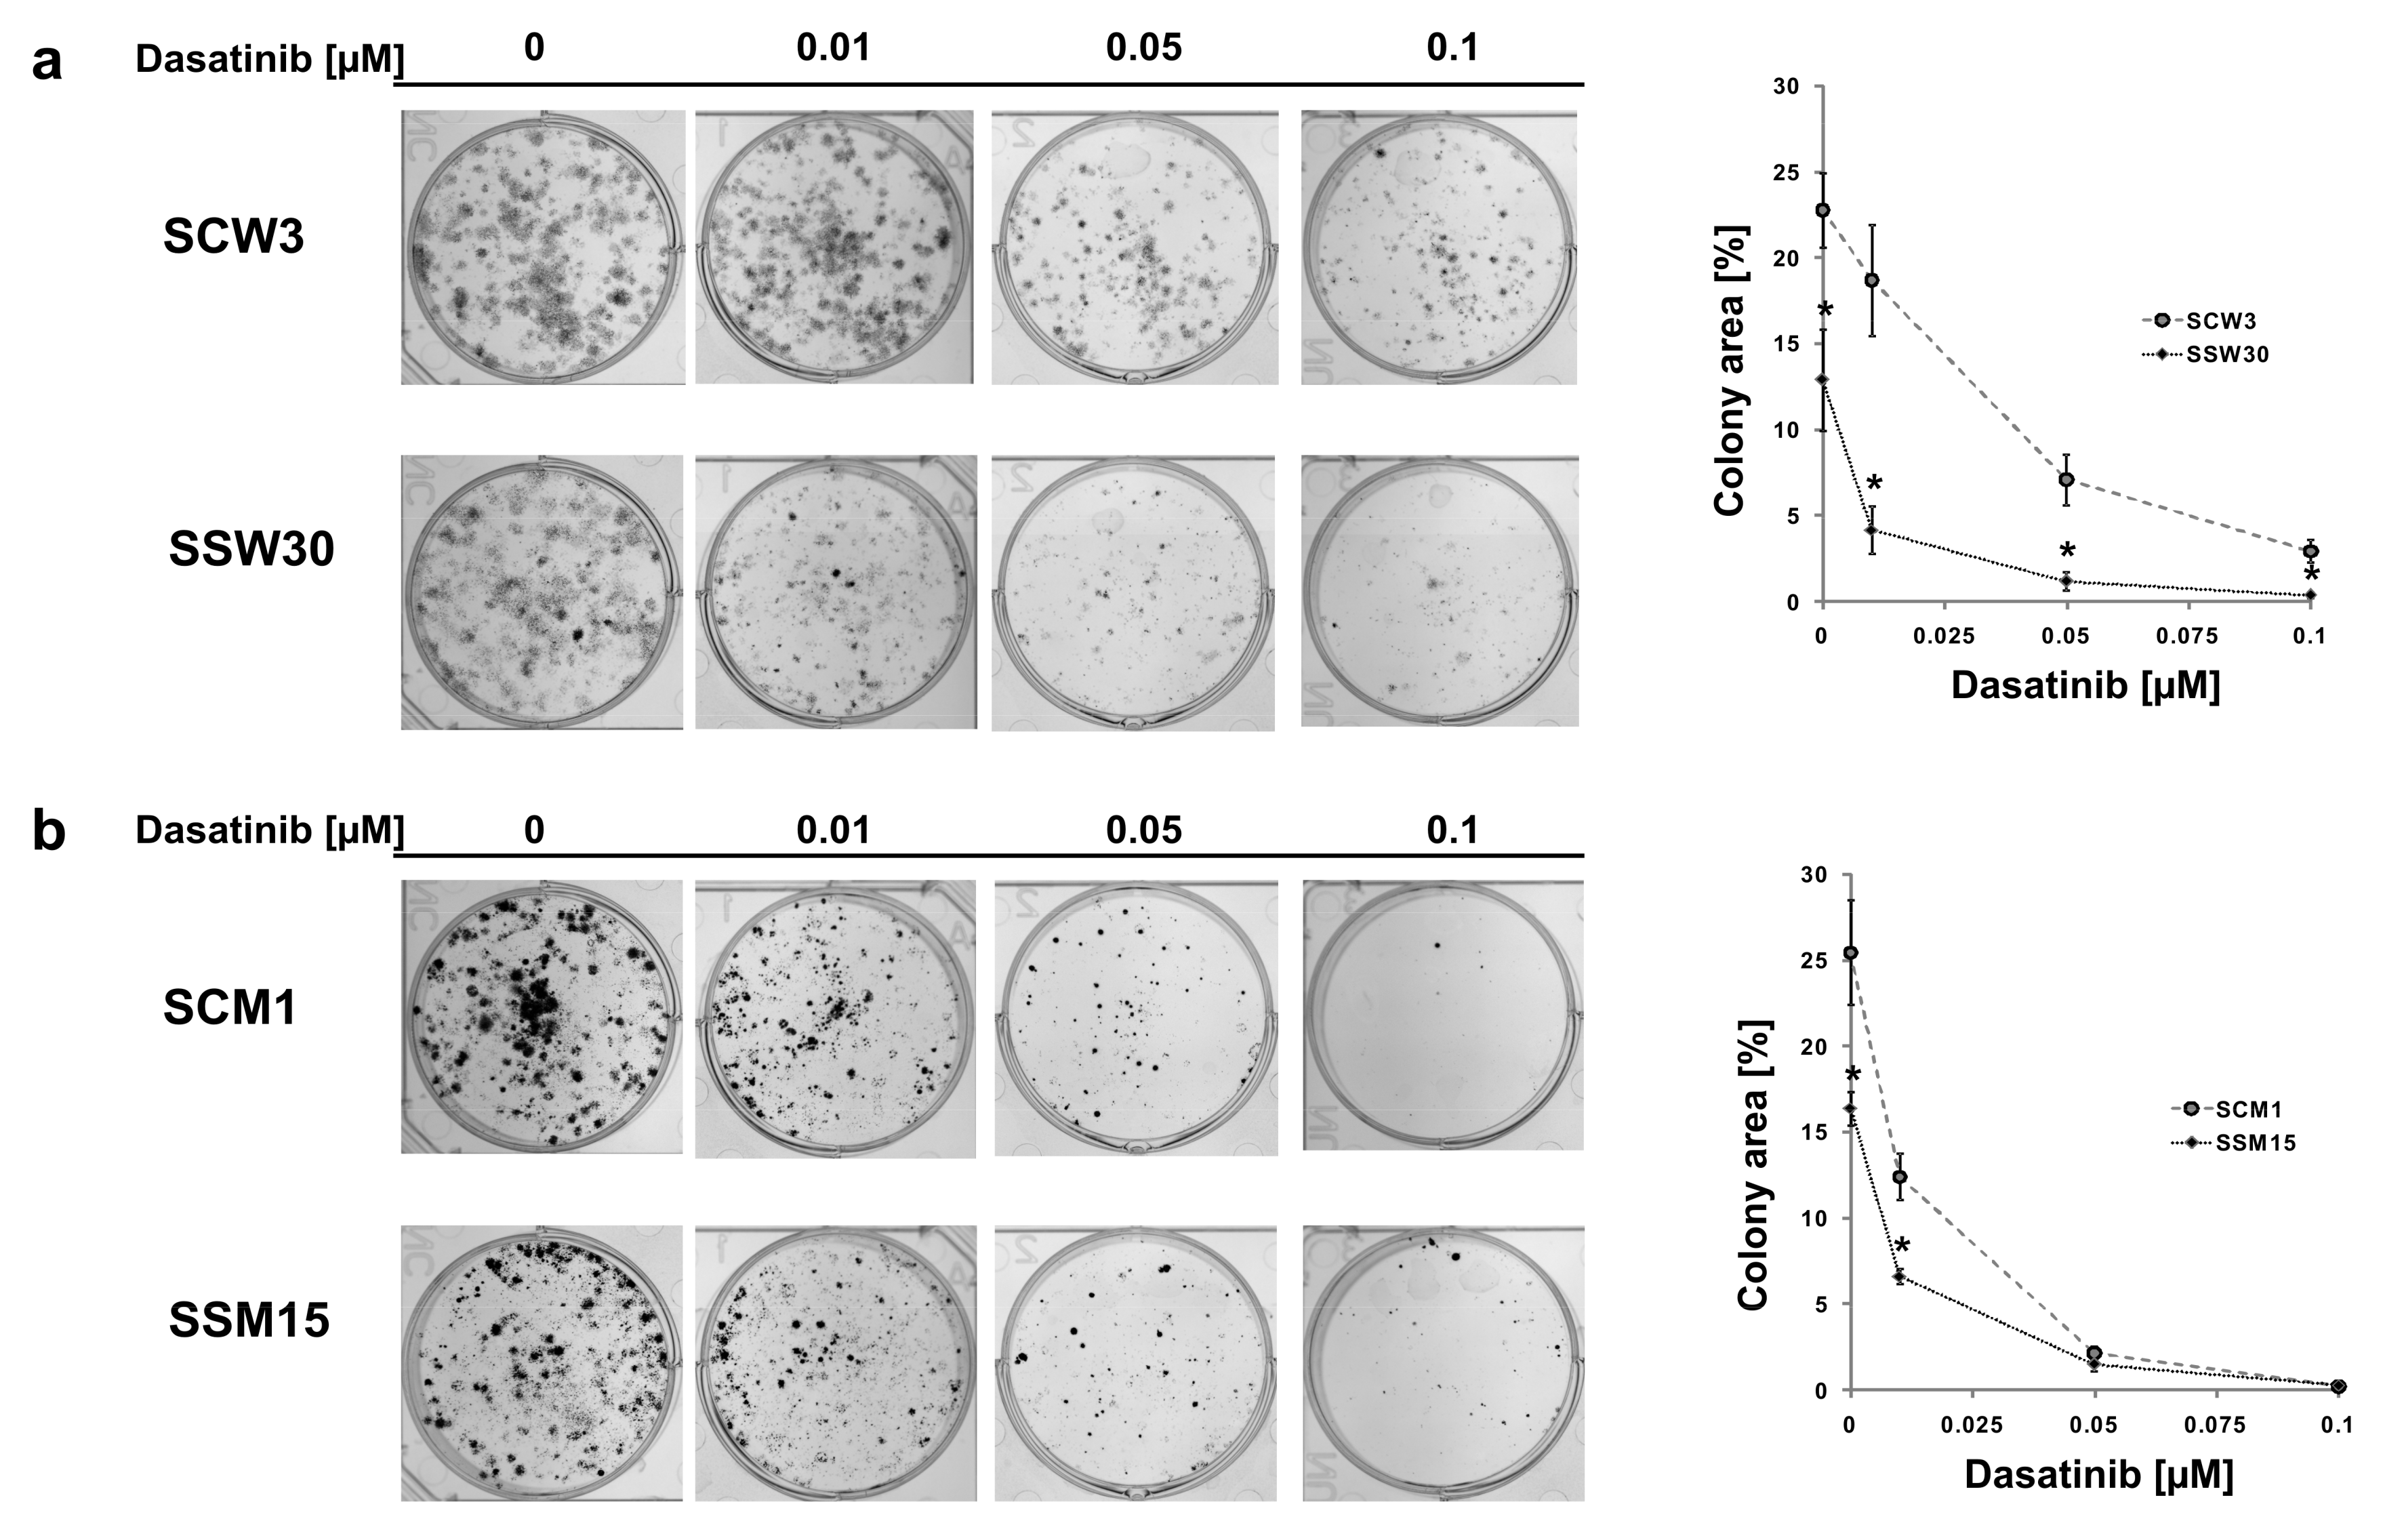
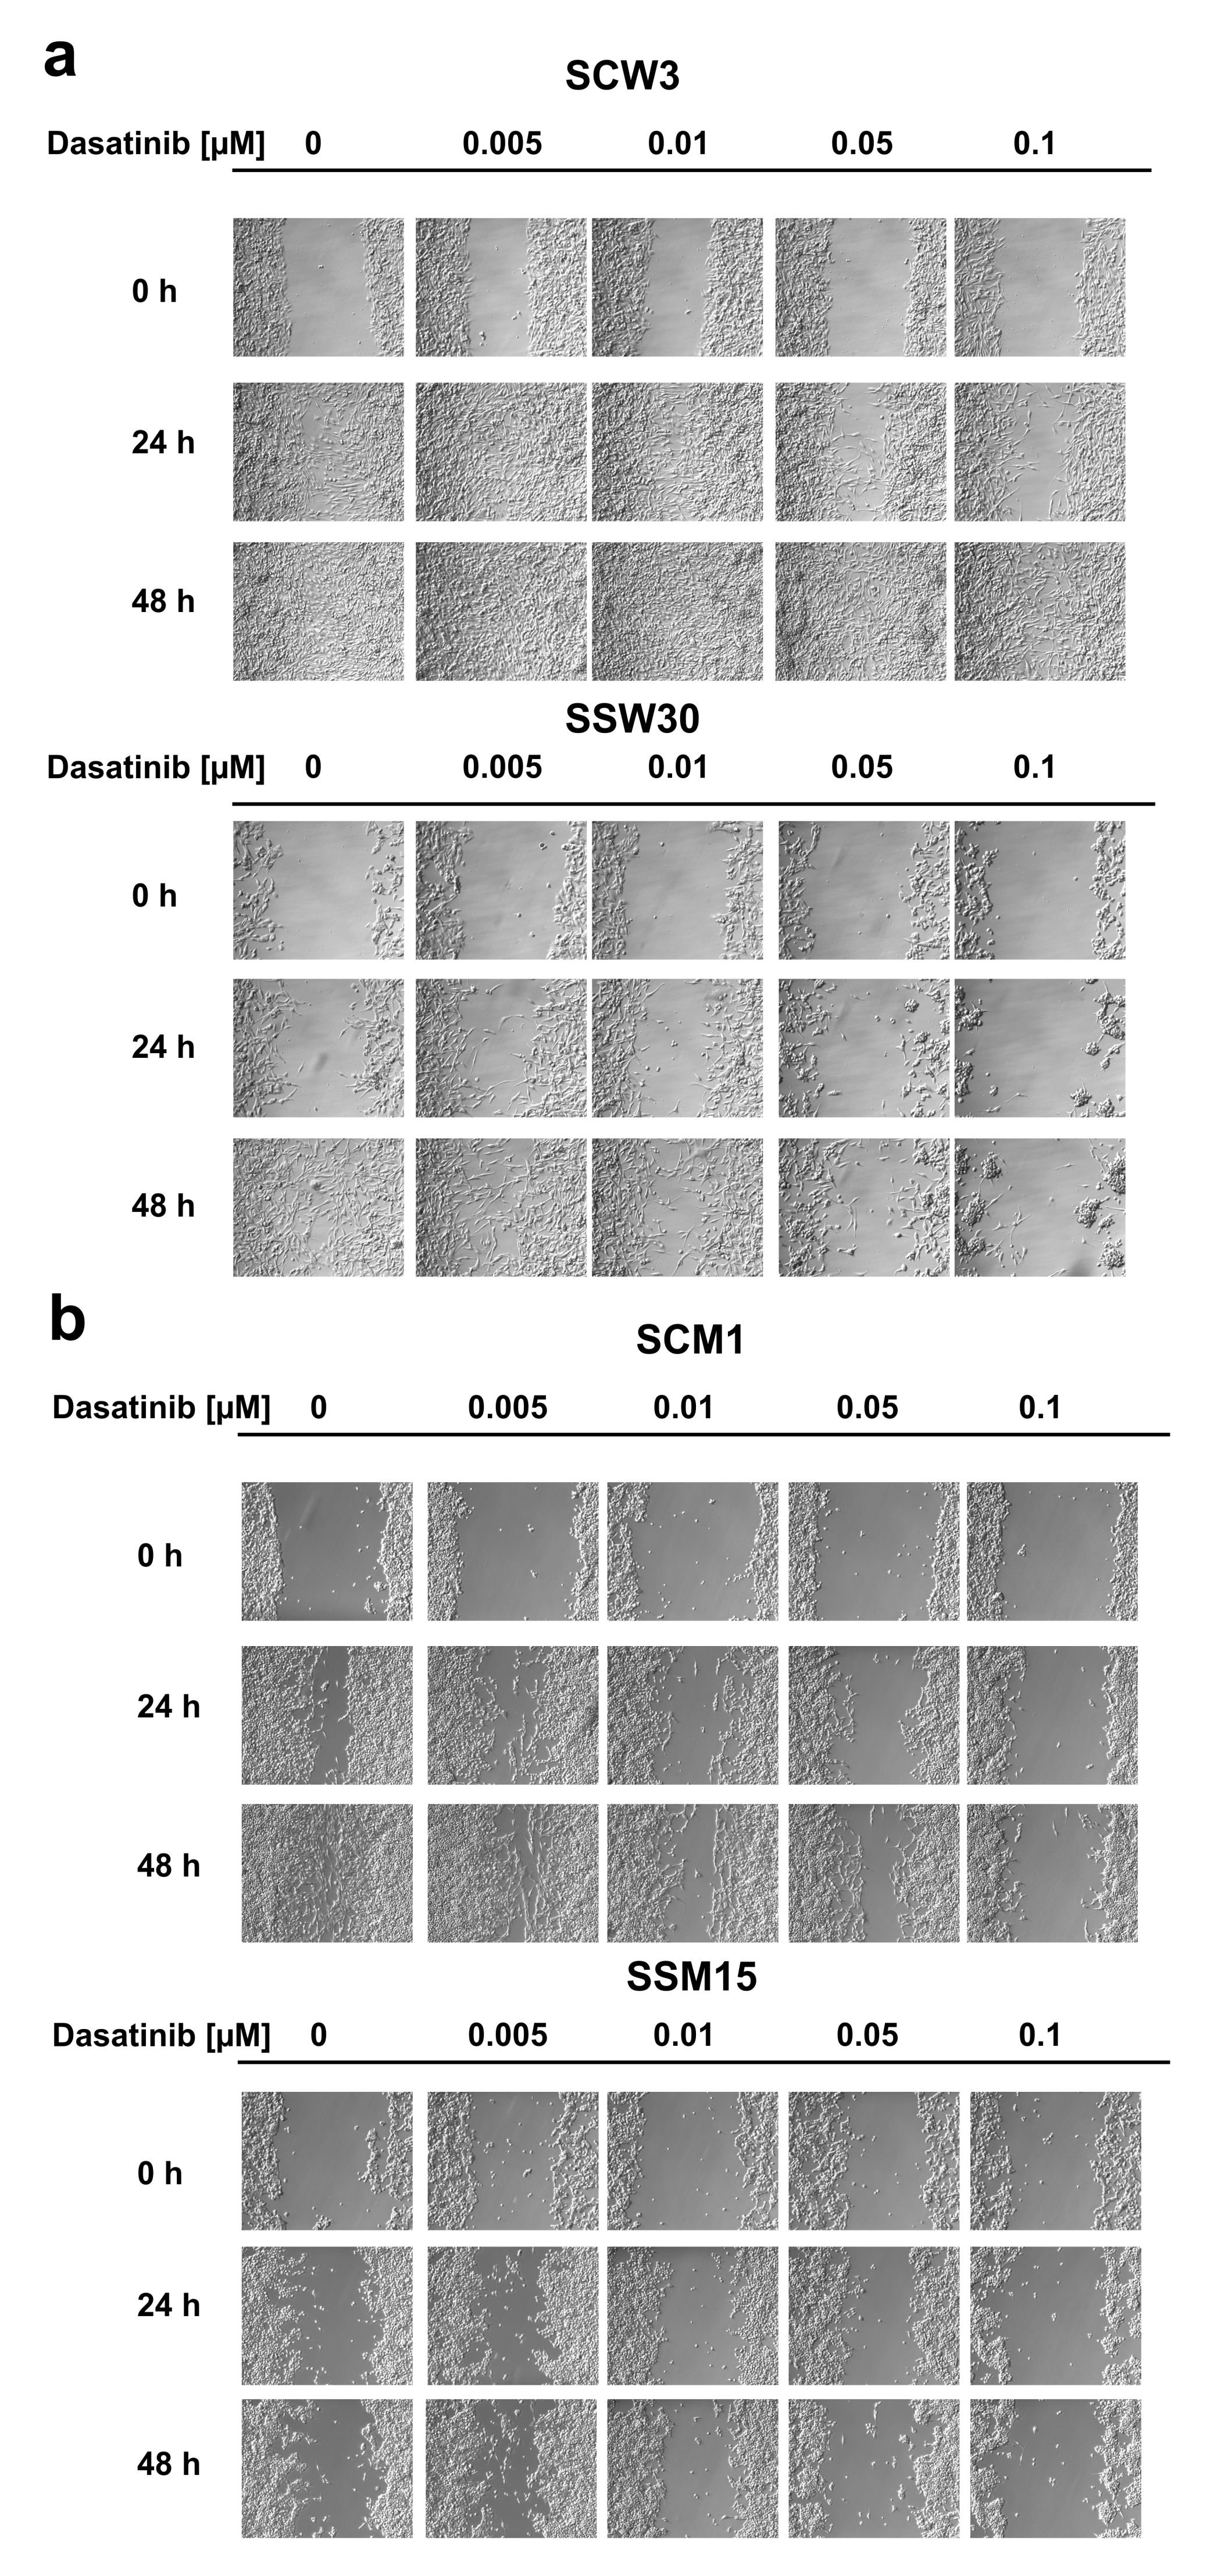
2.2. SIRT2-Inhibition Sensitizes Melanoma Cells to Dasatinib

Analyses of the transcriptomes of the created SIRT2-deficient cell lines revealed the altered expression of numerous genes identified as targets of dasatinib (e.g., EGFR, EPHA2, EPHB1, BTK, MAP3K4, MAP3K14, DDR1, GAK, and LYN) [65,66] (Table 1 and Table 2), which prompted us to examine whether SIRT2 downregulation could sensitize melanoma cells to dasatinib. Cells with low expression of SIRT2 were more sensitive to dasatinib treatment compared with those with normal expression of the gene (Figure 1b,c), and this effect was accompanied with higher susceptibility to early membrane damage and apoptosis (Figure S3). However, it should be noted that the effects of dasatinib were much stronger in the P/VG cell line than in the cell line representing the metastasis stage.
To confirm the differences in the reproductive viability of cells with low SIRT2 expression following dasatinib treatment, we performed colony formation assays. Inhibition of SIRT2 expression had a much greater impact on the ability to form colonies in the P/VG line (WM853), and treatment with dasatinib further reduced the cell potential for colony formation (Figure 2a). In the metastatic melanoma line, inhibition of SIRT2 expression had a slightly reduced effect on colony formation in the control-treated cells, and treatment with dasatinib had much smaller effect on colony formation in the SIRT2-deficient cell line (Figure 2b) than in the P/VG line. We next investigated the effects of the combination of SIRT2 knockout and dasatinib treatment on the migratory function of melanoma cells using the scratch assay. Our results showed that lack of SIRT2 expression in the P/VG melanoma line significantly inhibited cell motility by 4.5-fold (24 h) to 470-fold (48 h), and treatment with dasatinib strongly increased the observed inhibitory effects of SIRT2 depletion (Figure 3a and Figure S4a). In metastatic cells (Figure 3b and Figure S4b), the lack of SIRT2 expression caused 2.5-fold and 5-fold inhibition of migration, but the effect of dasatinib in SIRT2-deficient cells seems to be reduced compared to that of control cells. One possible explanation is that the lack of SIRT2 decreased the migratory potential of cells to the extent where any additional inhibitory effects are difficult to observe.

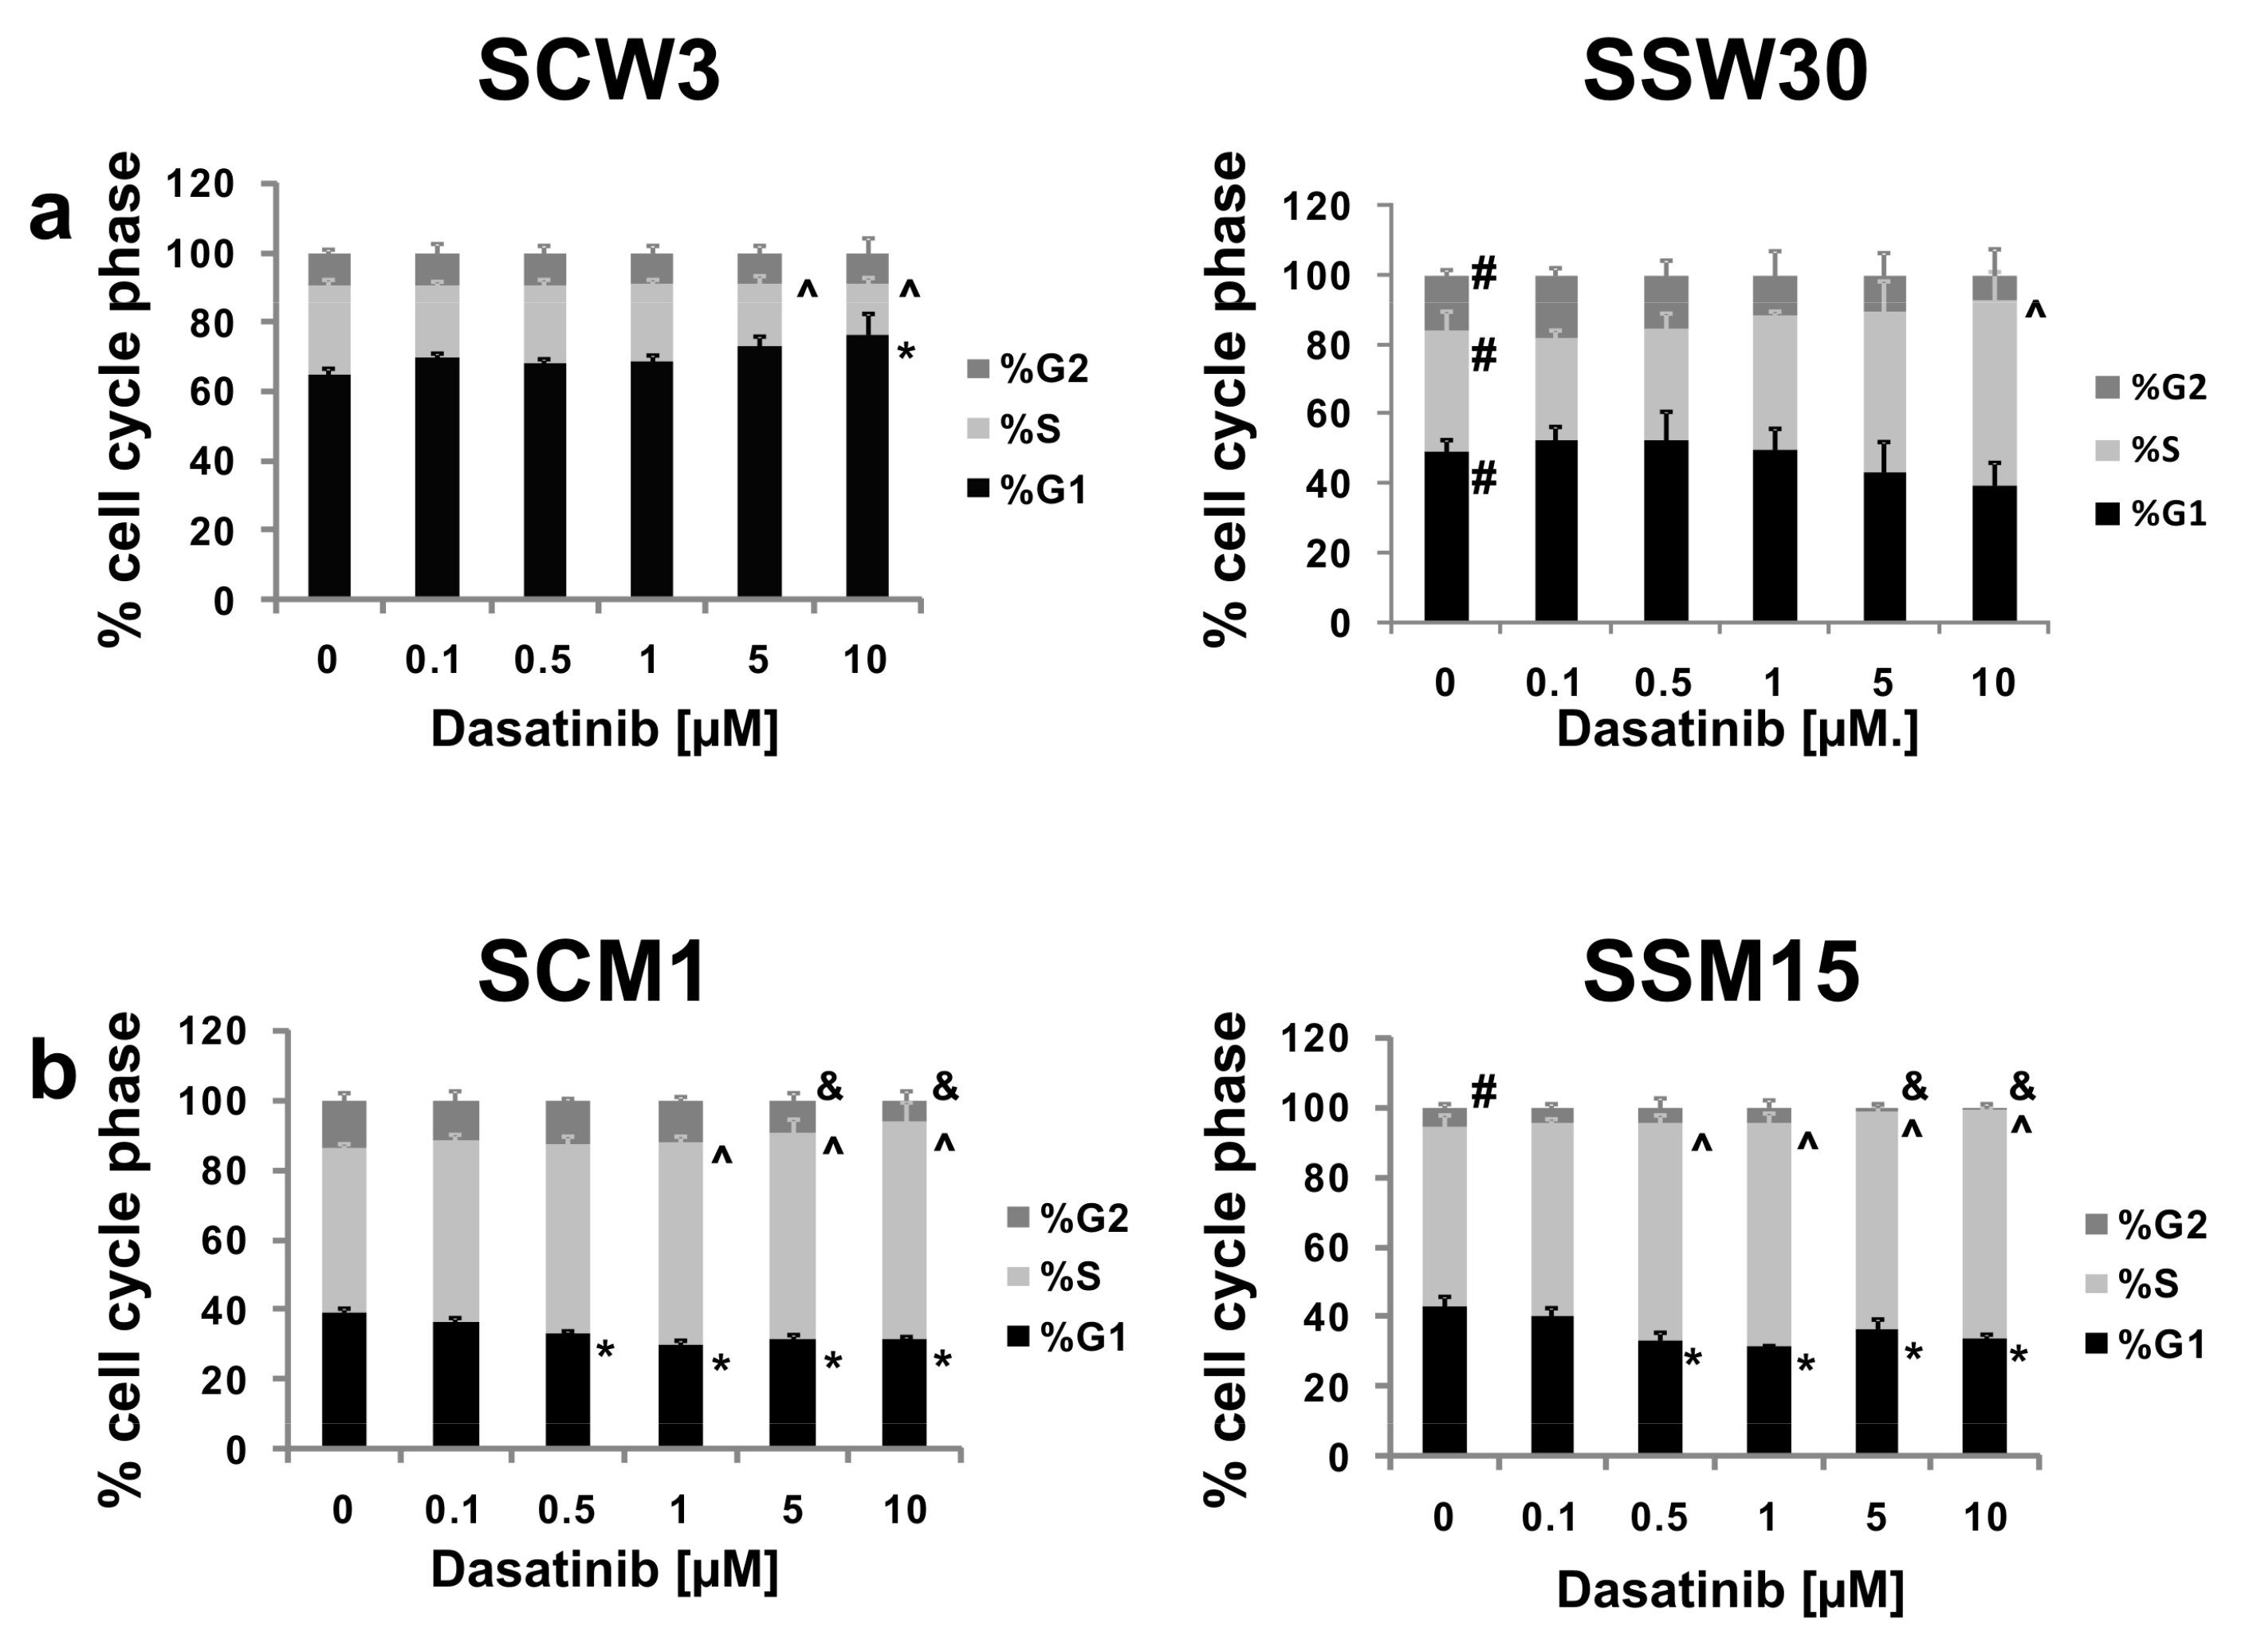
2.3. Effects of SIRT2 Inhibition and Dasatinib on the Cell Cycle Distribution

To determine the effects of SIRT2 knockdown and dasatinib treatment on the cell cycle, quantification of the percentage of cells in different cell cycle phases was determined after 24 h of dasatinib treatment. In control WM853 SCW3 cells, 10 μM dasatinib treatment caused an increase in the percentage of cells in G1 phase and a decrease in the percentages of cells in S phase (for 5 and 10 μM) (Figure 4a). When analyzing the cell cycle distribution in the WM853 SSW30 clones, we noticed that these cells showed a reduced percentage of cells in G1 phase and an increased percentage of cells in S and G2 phases compared to control SCW3 cells. Treatment with dasatinib (especially at high concentrations) led to an increase in the percentage of cells in S phase (10 μM of tested compound) (Figure 4a). For metastatic MDA-MB-435S SCM1 cells, dasatinib decreased the percentage of cells in G1 (0.5–10 μM dasatinib) and G2 phases (5–10 μM dasatinib) and increased those in S phase (1–10 μM dasatinib). MDA-MB435S SSM15 cells showed a reduction in G2 phase cells. Treatment of these cells with dasatinib led to decreases in the percentage of cells in G1 and G2 (0.5–10 μM dasatinib) phases (up to almost complete elimination of cells in G2 phase) and increases in the percentage of cells in S phase (5–10 μM dasatinib) (Figure 4b).

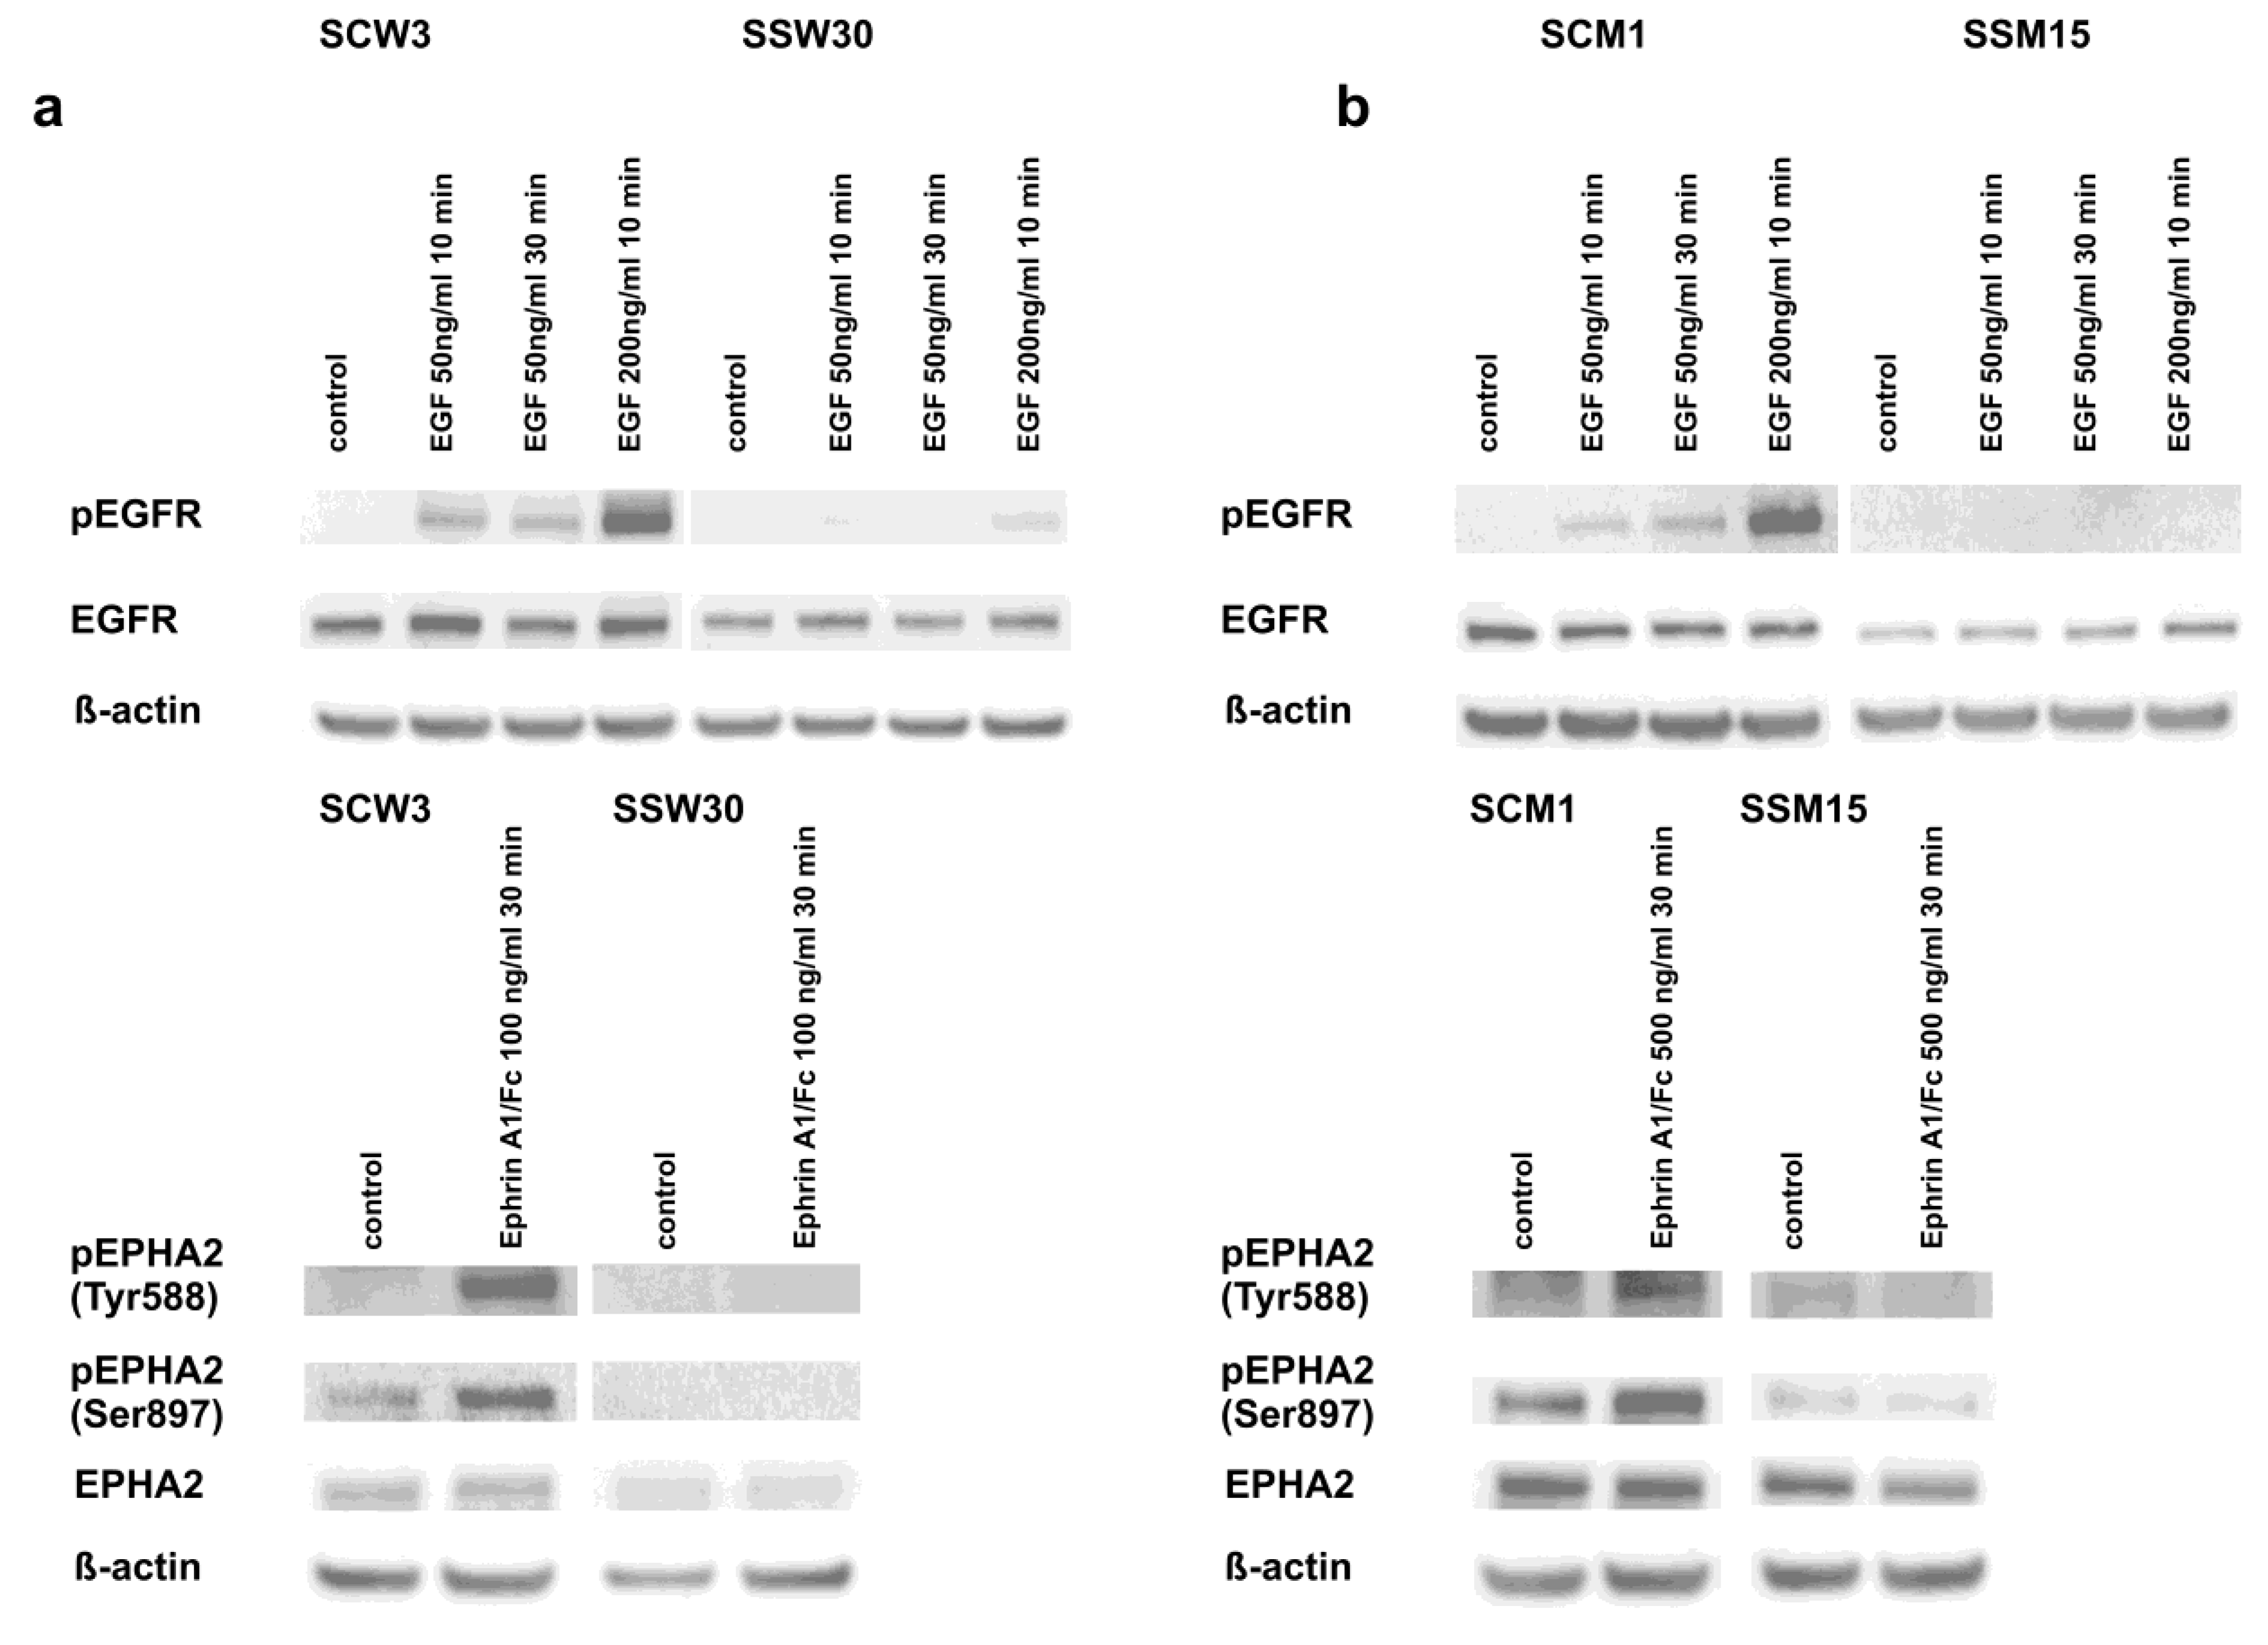
2.4. Modulation of Signaling Pathways by SIRT2 and Dasatinib

Given the significant role of tyrosine kinase receptors [67,68], downstream signaling of the SRC-ERK [23] pathway in the development of melanomas and their resistance to anticancer drugs and the RNA-seq sequencing results supporting the participation of SIRT2 in the regulation of these pathways, we confirmed that EGFR and EPHA2 receptors were downregulated in cells with low SIRT2 expression (Figure 5a,b and Figure 6a,b and Figure S1b). Although we did not observe the intrinsic phosphorylation of EGFR in any cell line, the differences in the response of the melanoma cells with SIRT2-downregulation to EGF was evident (Figure 5a,b). Similarly, the lack of response of SIRT2-deficient cells to Ephrin-A1 indicates that signal transduction through the EPHA2 receptor in these cells is impaired. Furthermore, we decided to examine the mechanism by which SIRT2 downregulation and dasatinib affects the phosphorylation of downstream elements of the EGFR and EPHA2 pathways. The intrinsic phosphorylation of EPHA2 on Tyr588 decreased in SSW30 clones, and treatment with dasatinib further decreased the phosphorylation. However, a different pattern was observed in analyses of Ser897 phosphorylation. In SSW30 cells, slightly higher phosphorylation was detected that increased by dasatinib. In control SCW3 cells, dasatinib led to reduced phosphorylation on Ser897 (Figure 6a). In contrast, in both MDA-MB-435S clones, there were no differences in the intrinsic phosphorylation of EPHA2 on Tyr588, but dasatinib led to phosphorylation inhibition (Figure 6b). SSM15 clones had a lower phosphorylation ratio on Ser897 of EPHA2, and in agreement with our assumptions, the inhibitory effect of dasatinib was stronger in these clones than in the control SCM1 clones (Figure 6b). Next, we analyzed the phosphorylation of the downstream kinases SRC and ERK1/2. We observed that in cells with normal SIRT2 expression, the intrinsic phosphorylation of SRC and ERK1/2 was higher than in cells with SIRT2 knockdown. Treatment with dasatinib increased this effect. We also analyzed the phosphorylation of focal adhesion kinase (FAK), which is crucial for the induction of apoptosis and inhibition of the migratory functions of melanoma cells [69,70]. In both cell lines with low SIRT2 expression, we observed decreased phosphorylation of FAK kinase (Figure 6a,b) that was further decreased by treatment with dasatinib.

3. Discussion

Failures in the treatment of advanced melanoma require new approaches and a search for new therapeutic targets that may increase the effectiveness of therapy, similar to the discovery of the V600E BRAF mutant [25]. NAD(+)-dependent, multifunctional lysine deacylases sirtuins are among such potential molecular targets [36]. Our previous studies using the SIRT2 inhibitor have shown that SIRT2 might be involved in intracellular processes that mediate melanoma proliferation and multidrug resistance [49], prompting us to further investigate the role of this deacetylase in the biology of melanoma cells. Thus, we created melanoma cell lines with silenced SIRT2 expression. We chose the WM853 line, representing the primary/vertical growth stage and MDA-MD-435S representing metastatic melanoma as previous studies indicated that the role of SIRT2 might change with the advancement of cancer development [52]. Transcriptome analysis demonstrated that SIRT2 has important regulatory roles in the expression of multiple genes associated with the molecular signatures of melanoma progression [71]. Among the genes that were downregulated by silencing this deacetylase are those that have been positively correlated with melanoma aggressiveness [71] (e.g., NCAPG, CDKN2C, GINS1, and DHFR are all downregulated in the SSW30 clone, Dataset S1). Among genes that were upregulated by SIRT2 silencing were those that are downregulated in aggressive melanoma cells (e.g., MGST1 is upregulated in the SSW30 and SSM15 clones, Datasets S1 and S2). Similarly, genes related to melanoma invasion were downregulated in SIRT2-deficient melanoma cell lines (e.g., HLA-DRA, IL-6, CD74, and HLA-DRB1 in the SSW30 clone, Dataset S1; PTPRZ1, FST, and NRCAM in the SSM15 clone, Dataset S2). Interestingly, although the two cell lines represented different stages of disease, we obtained similar levels of SIRT2 silencing. In WM853 cells, substantially more genes were differentially regulated than in metastatic MDA-MB-435S cells. This finding might indicate that in the VG phase, SIRT2 plays a more prominent regulatory function associated with the acquisition of metastatic properties and suggests that SIRT2 in tumors in this phase could represent a better therapeutic target compared with those in the metastatic phase. Among the differentially expressed genes, we found numerous genes that are molecular targets for dasatinib [65]. Consistent with this observation, both melanoma cell lines with silenced SIRT2 expression showed greater susceptibility to dasatinib than control cells as evidenced by several experimental approaches, including neutral red uptake, caspase 3/7 activity, and clonogenic assays (Figure 1, Figure 2 and Figure S3). We also showed that SIRT2 loss substantially decreased the migration of melanoma cells, and treatment with dasatinib further increased this inhibition of migration (Figure 3). In analyses of cell percentages in different cell cycle phases, we noticed that inhibition of SIRT2 expression arrested cells in S phase and that dasatinib enhanced this effect (Figure 4). Taken together, these observations are consistent with the hypothesis that SIRT2 regulates some putative elements necessary for activation of the MAPK pathway in the absence of V600E mutated BRAF-mediated activation. This hypothesis is consistent with RNA-seq results showing that SIRT2 regulates the expression of genes coding for tyrosine kinase receptors and MAPK/ERK pathway signaling molecules (Table 1 and Table 2; Datasets S1 and S2). This hypothesis is also consistent with the observations that dasatinib mediates different protein phosphorylation profiles in SIRT2-deficient melanoma cells than in control cells (Figure 5 and Figure 6). Our results are consistent with those of Wilking-Busch et al. [72], who showed that inhibition of SIRT2 expression in the melanoma A375 cell line led to a decrease in cell proliferation and the ability to form colonies, and they contradict the results of Bajpe et al. [50], who showed that inhibition of SIRT2 expression was associated with increased ERK phosphorylation and conferred resistance to cetuximab, AZD6244, and vemurafenib. Previous studies have suggested that SIRT2 may act as both a tumor promoter and suppressor [52], [73]. Our previous study [49], the work of Wilking-Busch et al. [72] and this report demonstrate that SIRT2 in melanomas acts as a tumor promoter at least in the context of the tested drugs and is a promising candidate for new anti-melanoma targeted therapies.
Dasatinib was first identified as a Src/Abl kinase inhibitor [74], and subsequent studies have shown that it also targets other kinases [65,75]. Dasatinib exhibits activity against melanomas in vitro [76], but its clinical use in melanoma monotherapy has been disappointing [77]. The use of dasatinib in combination with dacarbazine has provided slightly better results [78], but they remain far from expectations. Our study provides evidence that SIRT2 is one factor responsible for the resistance of melanoma cells to dasatinib. A possible explanation for SIRT2-mediated regulation of melanoma cell sensitivity to dasatinib is the role of this deacetylase in the regulation of genes encoding tyrosine kinase receptors and other signaling molecules that are responsible for the function of the main signaling pathway targeted by this drug [65,75].
In 50% of patients undergoing treatment with vemurafenib [26] or dabrafenib [27] (V600E BRAF inhibitors), resistance to these drugs develops after 6–8 months, which might be due to reactivation of the MAPK pathway [30,31,32,33,34]. Therefore, combination therapy with BRAF inhibitor and trametinib (MEK1/2 inhibitor) has improved clinical outcomes [79], but has not solved the problem of emerging resistance [80]. Activation of survival signaling through receptor tyrosine kinases (RTKs), e.g., EGFR [81,82], is also involved in the observed acquired resistance to the mentioned drugs. Our transcriptomic analysis showed that loss of SIRT2 in both P/VG and metastatic melanoma cell lines was associated with decreased expression of EGFR and EPHA2, receptors that are important for the development, proliferation and acquisition of multidrug resistance by melanoma cells [68,81,83,84,85,86,87,88,89,90]. Western blotting confirmed that EPHA2 and EGFR expression was reduced in cells without SIRT2 and that dasatinib treatment inhibited the phosphorylation of these receptors and the downstream signaling elements Src, ERK1/2 and FAK.
The practical consequences of the hypothesis that SIRT2 regulates genes encoding tyrosine kinase receptors and other signaling molecules that are critical for the function of the main signaling pathway targeted by dasatinib and V600E inhibitors [65,75] should be considered in light of new combination therapies for the treatment of melanoma. One combination worth exploring would be the use of specific inhibitors of SIRT2 together with dasatinib to increase the clinical potential of the latter. Another potential combination would be the SIRT2 inhibitor combined with the vemurafenib-trametinib regimen to increase the time to appearance of resistance to vemurafenib or to completely eliminate this resistance. Unfortunately, to our knowledge, there are no known SIRT2 or other SIRT inhibitors undergoing clinical evaluation for the treatment of cancer to date. The SIRT1 inhibitor EX-527 was tested in a phase II clinical study in Huntington’s disease patients and was well tolerated [91]. The major problem with known SIRT inhibitors is their selectivity [92]. However, the identification of the novel, SIRT2-specific inhibitor SirReal2 with 1000-fold selectivity over SIRTs 1, 3, 4, 5, and 6 [93] is a promising development that may potentially open new avenues for future clinical applications.

4. Materials and Methods

4.1. Cell Lines, Cell Culture and Reagents

The human melanoma cell lines MDA-MB-435S (stage: metastatic) and A375 (stage: metastatic) were obtained from ATCC (Manassas, VA., USA) and maintained in Dulbecco’s Modified Eagle’s Medium supplemented with 10% fetal bovine serum (PAN-Biotech GmbH, Aidenbach, Germany) at 37 °C in a humidified atmosphere containing 5% CO2. The human melanoma cell line WM853 (stage: primary/vertical growth) was purchased from Rockland (Rockland, Limerick, PA, USA) and was maintained in Tumor Specialized Medium containing 80% MCDB153 (Sigma-Aldrich, St. Louis, MO, USA), 20% Leibovitz’s (Sigma-Aldrich, St. Louis, MO, USA), 2% fetal bovine serum (Pan Biotech GmbH, Aidenbach, Germany), 1.68 mM calcium chloride, and 1.2 g (11.2 mM) sodium bicarbonate at 37 °C in a humidified atmosphere containing 5% CO2. Human EGF and Ephrin-A1/Fc Chimera were purchased from Sigma-Aldrich. Thiomyristoyl was purchased from Cayman Chemical (Ann Arbor, MI, USA).

4.2. Stable SIRT2 Knockdown Melanoma Cell Line Generation

To establish stable SIRT2-silenced cell lines, MDA-MB-435S and WM853 cells were transfected with short hairpin RNA (shRNA) plasmids: scrambled negative control noneffective shRNA (TR30012) or SIRT2 (T301692D) (Origene Tech. Rockville, MD, USA). Transfection was performed with Metafectene PRO (Biontex, München, Germany) following the manufacturer’s instructions. The cells were then cultured by replacing the medium every three days with complete medium containing 1 µg/mL (for MDA-MB-435S) and 0.4 µg/mL (for WM853) puromycin for one month during which the following stable clones were selected: WM853 SCW3, control; WM853 SSW30, downregulated SIRT2; MDA-MB-435S SCM1, control; MDA-MB-435S SSM15, downregulated SIRT2. SIRT2 expression in selected clones was determined by immunoblotting analysis.

4.3. RNA Extraction, Reverse Transcription and Quantitative PCR

Cells were lysed using TRI reagent (Sigma Aldrich, St. Louis, MO, USA). Briefly, 5 μg of total RNA was reverse transcribed using the Maxima First Strand cDNA Synthesis Kit for RT-quantitative PCR (Thermo Fisher Scientific, Waltham, MA, USA). Real-time quantitative PCR was performed using SYBR Green I Master Mix (Basel, Switzerland). The reactions were run on a LightCycler 480 from Roche under the following conditions: 95 °C for 5 min followed by 40 cycles of 95 °C for 10 s, 60 °C for 10 s, and 72 °C for 20 s. The following primers were used: SIRT2, 5′-GAAGGACAAGGGGCTACTCC-3′ (forward) and 5′-GATATCAGGCTTCACCAGGC-3′ (reverse); EGFR, 5′-GTGCAGGAGAGGAGAACTGC-3′ (forward) and 5′-GGCACCAAAGCTGTATTTGC-3′ (reverse); EPHA2, 5′-TACGAGAAGGTGGAGGATGC-3′ (forward) and 5′-ACGGCTGTGAGGTAGTGTGG-3′ (reverse); ITGA1, 5′-TGGGTGCTTATTGGTTCTCC-3′ (forward) and 5′-AAATCCTCCATTTGGGTTGG-3′ (reverse); SDC2, 5′-CTGCTCCAAAAGTGGAAACC-3′ (forward) and 5′-CAGCAATGACAGCTGCTAGG-3′ (reverse); GAK, 5′-TCACCAACCTCAAGGACACC-3′ (forward) and 5′-CTTGGAGTCCAGGAACAACC-3′ (reverse); DDR1, 5′-GGTCAGGAGGTGATCTCAGG-3′ (forward) and 5′-TGGAGTCGTTGAGGTACACG-3′ (reverse); and EPHB1, 5′-CTTTGACCCTCCAGAAGTGG-3′ (forward) and 5′-CTCCACATTGTCGTCACAGC-3′ (reverse). The mRNA levels were normalized to the RPL13A housekeeping gene as described by Vandensompele et al. [94].

4.4. Western Blotting

Whole cell lysates were prepared using ice-cold RIPA buffer (50 mM Tris-HCl pH 8.0, 150 mM NaCl, 0.1% Triton X-100, 0.1% SDS, 0.5% sodium deoxycholate) supplemented with Halt Protease Inhibitor Cocktail (Thermo Fisher Scientific). The samples were centrifuged for 15 min at 10,000× g. The protein concentration in the supernatant was determined using the Pierce BCA Protein Assay kit (Thermo Fisher Scientific). Total protein was separated on a 12% Bis–Tris NuPage precast gel (Thermo Fisher Scientific) and transferred to a Hybond-C membrane (GE Healthcare Life Sciences, Marlborough, MA, USA) using the iBlot dry blotting system (Thermo Fisher Scientific). The membranes were blocked with 5% milk and incubated overnight with the appropriate primary antibodies at 4 °C and subsequently with HRP-conjugated secondary antibody (ab6721, Abcam, Cambridge, UK) for 1 h at RT. The following primary antibodies were used: anti-SIRT2 (EPR1667) (Abcam), anti-beta Actin (Abcam), EphA2 (phospho Tyr588) (GeneTex, Irvine, CA, USA), Phospho-EphA2 (Ser897) (D9A1) (Cell Signaling, Danvers, MA, USA), EphA2 (D4A2) (Cell Signaling), EGF Receptor (Cell Signaling), Phospho-EGF Receptor (Tyr1068) (D7A5) (Cell Signaling), Src (Cell Signaling), Phospho-Src Family (Tyr416) (Cell Signaling), ERK 1/2 Antibody (C-9) (Santa Cruz, Dallas, TX, USA), and Phospho-ERK (E-4) (Santa Cruz). Specific bands were visualized using SuperSignal West Pico Chemiluminescent Substrate (Thermo Fisher Scientific) and the G-Box chemiluminescence imaging station (Syngene, Cambridge, UK). The signal strength in cognate bands corresponding to the assayed proteins was quantified with G-Box station software. Original scans are available in Supplementary Materials (Original scans of Figure 1, Figure 5 and Figure 6).

4.5. Preparation of Libraries, Sequencing and RNA-seq Data Analysis

Global analysis of gene expression in WM853 SCW3, WM853 SSW30, MDA-MBA-435S SCM1 and MDA-MB-435S SSM15 clones was analyzed by high-resolution RNA sequencing (RNA-seq). The procedure applied for the preparation of libraries and sequencing has been described in detail in our previous study [95]. A Venn diagram was used to compare the identified DEGs from the different expression analysis tools and to designate the shared DEGs. An FC cut off value of 1.5-fold was used for the detection of DEGs. RNA-seq results are available under SRA accession: PRJNA530710: https://0-www-ncbi-nlm-nih-gov.brum.beds.ac.uk/sra/PRJNA530710.

4.6. Gene Ontology Analysis

Gene ontology was performed using PANTHER software [96]. The following parameters were used in the analysis: displaying only results for FDR p < 0.05; analysis type: PANTHER overrepresentation test; reference list: Homo sapiens (all genes in database); test type: Fisher’s exact; and correction: false discovery rate.

4.7. Cell Cycle Analysis

Cells were seeded in 6-well plates. After 24 h, cells were treated with dasatinib for an additional 24 h. Then, the cells were harvested, collected, washed twice in ice-cold PBS and fixed in ice-cold 70% ethanol overnight at 4 °C. The cells were then washed twice in ice-cold PBS, and DNA was stained with a solution containing 10 μg/mL propidium iodide, 0.1% Triton X-100 and 100 μg/mL RNase A at RT for 30 min. The cell samples were measured with a LSRFortessa (Becton–Dickinson, Franklin Lakes, USA) flow cytometer. Data acquisition and analysis were performed using FlowJo 7.6.5 software (Treestar Data Analysis Software., Ashland, OR., USA).

4.8. In Vitro Scratch Assay

The migratory potential of the cell lines was assayed using the in vitro scratch assay [97]. Cells were grown on 12-well plates until monolayer formation; then, a scratch was created using a 200-μL pipette tip. The cells were then treated with increasing concentrations of dasatinib. After 24 h and 48 h of incubation, the plates were placed under an Eclipse TE2000 inverted microscope (Nikon, Tokyo, Japan), and images of the scratch were acquired. The data were analyzed using ImageJ (http://imagej.nih.gov/ij/).

4.9. Detection of Early Cellular Membrane Damage

Cells were seeded in 96-well plates at a density of 1 × 10⁴ per well. After 24 h, the cells were treated with dasatinib. Staining solution (0.35 μM YO-PRO-1 in an appropriate cell culture medium) prewarmed to 37 °C was added 24 h after the treatment, and the cells were incubated for 30 min. The medium was then removed, and the cells were washed twice with PBS. Cells were fixed with fixation solution (3.7% formaldehyde in PBS) and incubated with nuclear staining solution (10 µg/mL Hoechst 33,342 in PBS) for 20 min. After 3 washes with PBS, the plates were scanned in the ArrayScan VTi HCS Reader (Thermo Fisher Scientific), and the fluorescence of YO-PRO-1 (a marker of cell membrane damage) was analyzed.

4.10. Cell Viability Measurements

For the determination of cell viability, the neutral red cytotoxicity assay was used [98], as described in our previous study [99].

4.11. Caspase 3/7 Activity Measurements

For the determination of apoptosis, caspase 3 and 7 activities were measured using the Caspase-Glo® 3/7 Assay System from Promega (Madison, WI, USA) according to the manufacturer’s protocol. The luminescence measurements were performed on an Infinite 200 PRO (Tecan, Männedorf, Switzerland) plate reader.

4.12. Colony Formation Assay

Cells were seeded in a 6-well plate at a density 1000 cells per well. After incubation for 24 h, the cells were treated with dasatinib for 14 days. Colonies were fixed with 100% methanol and stained with 0.5% crystal violet solution [100]. Plates were scanned using G-Box (Synoptics, Cambridge, UK), and images were analyzed using ImageJ as described previously by Guzman et al. [101].

4.13. Statistics

Testing for statistical significance was performed by ANOVA followed by the Tukey’s post hoc test. When two means were compared, student’s t-test was used. When p < 0.05, the observed difference was considered statistically significant.

5. Conclusions

In conclusion, our results show for the first time that SIRT2 is an important regulator of the basic functions and genes of melanoma cells, including those involved in cell motility, proliferation and drug resistance. We provide new tools in the form of cell lines lacking SIRT2 expression to study the role of this sirtuin in melanoma cells. Low SIRT2 levels alter the expression of tyrosine kinase receptors and induce melanoma cell susceptibility to the multikinase inhibitor dasatinib. Thus, we explained one of the possible resistance mechanisms to this drug. As a consequence of this finding, to improve therapeutic potential of present regiments against melanoma, inhibition of sirtuin 2 activity should be considered.

Supplementary Materials

The following are available online at https://0-www-mdpi-com.brum.beds.ac.uk/2072-6694/11/5/673/s1, Figure S1: Phenotypes of the SIRT2-deficient melanoma cell lines, Figure S2: Venn diagrams to compare the identified DEGs from the different expression analysis tools and designate the shared DEGs, Figure S3: Individual cytotoxic effects of dasatinib on melanoma cell lines, Figure S4: Computer-generated area lacking values to illustrate the in vitro scratch assay from Figure 3, Table S1: Gene ontology (biological process) term results from the PANTHER overrepresentation test for significantly differentially expressed (DE) genes regulated in both melanoma cells analyzed, Table S2: Expression of selected genes in A375 melanoma cells after treatment with the SIRT2 inhibitor thiomyristoyl, DataSet S1: A complete list of genes that changed expression in WM853 cell line after SIRT2 downregulation determined using RNA-seq, DataSet S2: A complete list of genes that changed expression in MDA-MB-435S cell line after SIRT2 downregulation determined using RNA-seq, DataSet S3: A complete list of gene ontology (biological process) term results from the PANTHER overrepresentation test for significantly differentially expressed (DE) genes regulated in WM853 SCW3/WM853 SSW30 and MDA-MB-435S SCM1/MDA-MB-435S SSM15 cells, Original scans of Figure 1, Figure 5 and Figure 6.

Author Contributions

Conceptualization, M.R.; methodology, M.R. and I.K.; software, M.S.-K. and D.S.; investigation, I.K., A.S., K.K., M.S.-K., A.W.-D. and M.R.; data curation, I.K., M.S.-K., D.S. and M.R.; writing—original draft preparation, J.D. and M.R.; writing—review and editing, I.K. and Ł.P.; visualization, M.R.; supervision, M.R.; project administration, M.R.; funding acquisition, M.R.

Funding

This work was supported by National Science Centre Project no. 2015/17/B/NZ5/00142. D.S. and M.S.-K. were supported by the Polish Ministry of Science and Higher Education grant DIR/WK/2017/01.

Acknowledgments

We would like to thank Marcin Słomka for technical support.

Conflicts of Interest

The authors declare no conflicts of interest.

References

  1. Siegel, R.L.; Miller, K.D.; Jemal, A. Cancer statistics, 2016. CA Cancer J. Clin. 2016, 66, 7–30. [Google Scholar] [CrossRef]
  2. Serrone, L.; Zeuli, M.; Sega, F.M.; Cognetti, F. Dacarbazine-based chemotherapy for metastatic melanoma: Thirty-year experience overview. J. Exp. Clin. Cancer Res. 2000, 19, 21–34. [Google Scholar] [PubMed]
  3. Jilaveanu, L.B.; Aziz, S.A.; Kluger, H.M. Chemotherapy and biologic therapies for melanoma: Do they work? Clin. Dermatol. 2009, 27, 614–625. [Google Scholar] [CrossRef]
  4. Atkins, M.B.; Lotze, M.T.; Dutcher, J.P.; Fisher, R.I.; Weiss, G.; Margolin, K.; Abrams, J.; Sznol, M.; Parkinson, D.; Hawkins, M.; et al. High-dose recombinant interleukin 2 therapy for patients with metastatic melanoma: Analysis of 270 patients treated between 1985 and 1993. J. Clin. Oncol. 1999, 17, 2105–2116. [Google Scholar] [CrossRef]
  5. Robinson, W.A.; Mughal, T.I.; Thomas, M.R.; Johnson, M.; Spiegel, R.J. Treatment of metastatic malignant melanoma with recombinant interferon alpha 2. Immunobiology 1986, 172, 275–282. [Google Scholar] [CrossRef]
  6. Banzi, M.; De Blasio, S.; Lallas, A.; Longo, C.; Moscarella, E.; Alfano, R.; Argenziano, G. Dabrafenib: A new opportunity for the treatment of BRAF v600-positive melanoma. Oncol. Targets Ther. 2016, 9, 2725–2733. [Google Scholar] [PubMed]
  7. Legha, S.S.; Ring, S.; Papadopoulos, N.; Plager, C.; Chawla, S.; Benjamin, R. A prospective evaluation of a triple-drug regimen containing cisplatin, vinblastine, and dacarbazine (CVD) for metastatic melanoma. Cancer 1989, 64, 2024–2029. [Google Scholar] [CrossRef]
  8. Del Prete, S.A.; Maurer, L.H.; O’Donnell, J.; Forcier, R.J.; LeMarbre, P. Combination chemotherapy with cisplatin, carmustine, dacarbazine, and tamoxifen in metastatic melanoma. Cancer Treat. Rep. 1984, 68, 1403–1405. [Google Scholar] [PubMed]
  9. Fierro, M.T.; Bertero, M.; Novelli, M.; Appino, A.; Doveil, G.C.; Colonna, S.; Bernengo, M.G. Therapy for metastatic melanoma: Effective combination of dacarbazine, carmustine, cisplatin and tamoxifen. Melanoma Res. 1993, 3, 127–131. [Google Scholar] [PubMed]
  10. Chen, K.G.; Leapman, R.D.; Zhang, G.; Lai, B.; Valencia, J.C.; Cardarelli, C.O.; Vieira, W.D.; Hearing, V.J.; Gottesman, M.M. Influence of melanosome dynamics on melanoma drug sensitivity. J. Natl. Cancer Inst. 2009, 101, 1259–1271. [Google Scholar] [CrossRef]
  11. Chen, K.G.; Valencia, J.C.; Gillet, J.P.; Hearing, V.J.; Gottesman, M.M. Involvement of ABC transporters in melanogenesis and the development of multidrug resistance of melanoma. Pigment. Cell Melanoma Res. 2009, 22, 740–749. [Google Scholar] [CrossRef] [PubMed]
  12. Jansen, B.; Wacheck, V.; Heere-Ress, E.; Schlagbauer-Wadl, H.; Hoeller, C.; Lucas, T.; Hoermann, M.; Hollenstein, U.; Wolff, K.; Pehamberger, H. Chemosensitisation of malignant melanoma by BCL2 antisense therapy. Lancet 2000, 356, 1728–1733. [Google Scholar] [CrossRef]
  13. Wolter, K.G.; Verhaegen, M.; Fernandez, Y.; Nikolovska-Coleska, Z.; Riblett, M.; de la Vega, C.M.; Wang, S.; Soengas, M.S. Therapeutic window for melanoma treatment provided by selective effects of the proteasome on BCL-2 proteins. Cell Death Differ. 2007, 14, 1605–1616. [Google Scholar] [CrossRef] [PubMed]
  14. Tang, L.; Tron, V.A.; Reed, J.C.; Mah, K.J.; Krajewska, M.; Li, G.; Zhou, X.; Ho, V.C.; Trotter, M.J. Expression of apoptosis regulators in cutaneous malignant melanoma. Clin. Cancer Res. 1998, 4, 1865–1871. [Google Scholar]
  15. Nikolaou, V.A.; Stratigos, A.J.; Flaherty, K.T.; Tsao, H. Melanoma: New insights and new therapies. J. Investig. Dermatol. 2012, 132, 854–863. [Google Scholar] [CrossRef] [PubMed]
  16. Chartrain, M.; Riond, J.; Stennevin, A.; Vandenberghe, I.; Gomes, B.; Lamant, L.; Meyer, N.; Gairin, J.E.; Guilbaud, N.; Annereau, J.P. Melanoma chemotherapy leads to the selection of ABCB5-expressing cells. PLoS ONE 2012, 7, e36762. [Google Scholar] [CrossRef] [PubMed]
  17. Levy, C.; Khaled, M.; Fisher, D.E. Mitf: Master regulator of melanocyte development and melanoma oncogene. Trends Mol. Med. 2006, 12, 406–414. [Google Scholar] [CrossRef]
  18. Hirata, E.; Girotti, M.R.; Viros, A.; Hooper, S.; Spencer-Dene, B.; Matsuda, M.; Larkin, J.; Marais, R.; Sahai, E. Intravital imaging reveals how BRAF inhibition generates drug-tolerant microenvironments with high integrin β1/FAK signaling. Cancer Cell 2015, 27, 574–588. [Google Scholar] [CrossRef]
  19. Kaur, A.; Webster, M.R.; Marchbank, K.; Behera, R.; Ndoye, A.; Kugel, C.H., 3rd; Dang, V.M.; Appleton, J.; O’Connell, M.P.; Cheng, P.; et al. sFRP2 in the aged microenvironment drives melanoma metastasis and therapy resistance. Nature 2016, 532, 250–254. [Google Scholar] [CrossRef] [PubMed]
  20. Ruffell, B.; Coussens, L.M. Macrophages and therapeutic resistance in cancer. Cancer Cell 2015, 27, 462–472. [Google Scholar] [CrossRef] [PubMed]
  21. Winder, M.; Viros, A. Mechanisms of drug resistance in melanoma. Handb. Exp. Pharmacol. 2018, 249, 91–108. [Google Scholar]
  22. Davies, H.; Bignell, G.R.; Cox, C.; Stephens, P.; Edkins, S.; Clegg, S.; Teague, J.; Woffendin, H.; Garnett, M.J.; Bottomley, W.; et al. Mutations of the BRAF gene in human cancer. Nature 2002, 417, 949–954. [Google Scholar] [CrossRef]
  23. Wan, P.T.; Garnett, M.J.; Roe, S.M.; Lee, S.; Niculescu-Duvaz, D.; Good, V.M.; Jones, C.M.; Marshall, C.J.; Springer, C.J.; Barford, D.; et al. Mechanism of activation of the RAF-ERK signaling pathway by oncogenic mutations of B-RAF. Cell 2004, 116, 855–867. [Google Scholar] [CrossRef]
  24. Roberts, P.J.; Der, C.J. Targeting the RAF-MEK-ERK mitogen-activated protein kinase cascade for the treatment of cancer. Oncogene 2007, 26, 3291–3310. [Google Scholar] [CrossRef]
  25. Flaherty, K.T.; Puzanov, I.; Kim, K.B.; Ribas, A.; McArthur, G.A.; Sosman, J.A.; O’Dwyer, P.J.; Lee, R.J.; Grippo, J.F.; Nolop, K.; et al. Inhibition of mutated, activated BRAF in metastatic melanoma. N. Engl. J. Med. 2010, 363, 809–819. [Google Scholar] [CrossRef]
  26. Chapman, P.B.; Hauschild, A.; Robert, C.; Haanen, J.B.; Ascierto, P.; Larkin, J.; Dummer, R.; Garbe, C.; Testori, A.; Maio, M.; et al. Improved survival with vemurafenib in melanoma with BRAF v600e mutation. N Engl. J. Med. 2011, 364, 2507–2516. [Google Scholar] [CrossRef]
  27. Hauschild, A.; Grob, J.J.; Demidov, L.V.; Jouary, T.; Gutzmer, R.; Millward, M.; Rutkowski, P.; Blank, C.U.; Miller, W.H., Jr.; Kaempgen, E.; et al. Dabrafenib in BRAF-mutated metastatic melanoma: A multicentre, open-label, phase 3 randomised controlled trial. Lancet 2012, 380, 358–365. [Google Scholar] [CrossRef]
  28. Ascierto, P.A.; Minor, D.; Ribas, A.; Lebbe, C.; O’Hagan, A.; Arya, N.; Guckert, M.; Schadendorf, D.; Kefford, R.F.; Grob, J.J.; et al. Phase II trial (BREAK-2) of the BRAF inhibitor dabrafenib (GSK2118436) in patients with metastatic melanoma. J. Clin. Oncol 2013, 31, 3205–3211. [Google Scholar] [CrossRef]
  29. Medina, T.M.; Lewis, K.D. The evolution of combined molecular targeted therapies to advance the therapeutic efficacy in melanoma: A highlight of vemurafenib and cobimetinib. Oncol. Targets Ther. 2016, 9, 3739–3752. [Google Scholar]
  30. Nazarian, R.; Shi, H.; Wang, Q.; Kong, X.; Koya, R.C.; Lee, H.; Chen, Z.; Lee, M.K.; Attar, N.; Sazegar, H.; et al. Melanomas acquire resistance to B-RAF(v600e) inhibition by RTK or N-RAS upregulation. Nature 2010, 468, 973–977. [Google Scholar] [CrossRef]
  31. Lito, P.; Rosen, N.; Solit, D.B. Tumor adaptation and resistance to RAF inhibitors. Nat. Med. 2013, 19, 1401–1409. [Google Scholar] [CrossRef]
  32. Maertens, O.; Johnson, B.; Hollstein, P.; Frederick, D.T.; Cooper, Z.A.; Messiaen, L.; Bronson, R.T.; McMahon, M.; Granter, S.; Flaherty, K.; et al. Elucidating distinct roles for nf1 in melanomagenesis. Cancer Discov. 2013, 3, 338–349. [Google Scholar] [CrossRef]
  33. Poulikakos, P.I.; Persaud, Y.; Janakiraman, M.; Kong, X.; Ng, C.; Moriceau, G.; Shi, H.; Atefi, M.; Titz, B.; Gabay, M.T.; et al. RAF inhibitor resistance is mediated by dimerization of aberrantly spliced BRAF(v600e). Nature 2011, 480, 387–390. [Google Scholar] [CrossRef] [PubMed]
  34. Johannessen, C.M.; Boehm, J.S.; Kim, S.Y.; Thomas, S.R.; Wardwell, L.; Johnson, L.A.; Emery, C.M.; Stransky, N.; Cogdill, A.P.; Barretina, J.; et al. COT drives resistance to RAF inhibition through MAP kinase pathway reactivation. Nature 2010, 468, 968–972. [Google Scholar] [CrossRef] [PubMed]
  35. Wilking, M.J.; Singh, C.K.; Nihal, M.; Ndiaye, M.A.; Ahmad, N. Sirtuin deacetylases: A new target for melanoma management. Cell Cycle 2014, 13, 2821–2826. [Google Scholar] [CrossRef]
  36. Garcia-Peterson, L.M.; Wilking-Busch, M.J.; Ndiaye, M.A.; Philippe, C.G.A.; Setaluri, V.; Ahmad, N. Sirtuins in skin and skin cancers. Skin Pharmacol. Physiol. 2017, 30, 216–224. [Google Scholar] [CrossRef] [PubMed]
  37. Brachmann, C.B.; Sherman, J.M.; Devine, S.E.; Cameron, E.E.; Pillus, L.; Boeke, J.D. The SIR2 gene family, conserved from bacteria to humans, functions in silencing, cell cycle progression, and chromosome stability. Genes Dev. 1995, 9, 2888–2902. [Google Scholar] [CrossRef]
  38. Tanny, J.C.; Dowd, G.J.; Huang, J.; Hilz, H.; Moazed, D. An enzymatic activity in the yeast SIR2 protein that is essential for gene silencing. Cell 1999, 99, 735–745. [Google Scholar] [CrossRef]
  39. Frye, R.A. Phylogenetic classification of prokaryotic and eukaryotic SIR2-like proteins. Biochem. Biophys. Res. Commun. 2000, 273, 793–798. [Google Scholar] [CrossRef]
  40. Nakagawa, T.; Guarente, L. Sirtuins at a glance. J. Cell Sci. 2011, 124, 833–838. [Google Scholar] [CrossRef]
  41. Huang, J.Y.; Hirschey, M.D.; Shimazu, T.; Ho, L.; Verdin, E. Mitochondrial sirtuins. Biochim. Biophys. Acta 2010, 1804, 1645–1651. [Google Scholar] [CrossRef]
  42. Haigis, M.C.; Sinclair, D.A. Mammalian sirtuins: Biological insights and disease relevance. Annu. Rev. Pathol. 2010, 5, 253–295. [Google Scholar] [CrossRef] [PubMed]
  43. Mendes, K.L.; Lelis, D.F.; Santos, S.H.S. Nuclear sirtuins and inflammatory signaling pathways. Cytokine Growth Factor Rev. 2017, 38, 98–105. [Google Scholar] [CrossRef]
  44. Tanno, M.; Sakamoto, J.; Miura, T.; Shimamoto, K.; Horio, Y. Nucleocytoplasmic shuttling of the NAD+-dependent histone deacetylase SIRT1. J. Biol. Chem. 2007, 282, 6823–6832. [Google Scholar] [CrossRef]
  45. Li, W.; Zhang, B.; Tang, J.; Cao, Q.; Wu, Y.; Wu, C.; Guo, J.; Ling, E.A.; Liang, F. Sirtuin 2, a mammalian homolog of yeast silent information regulator-2 longevity regulator, is an oligodendroglial protein that decelerates cell differentiation through deacetylating alpha-tubulin. J. Neurosci. 2007, 27, 2606–2616. [Google Scholar] [CrossRef]
  46. Wang, C.; Wang, M.W.; Tashiro, S.; Onodera, S.; Ikejima, T. Roles of SIRT1 and phosphoinositide 3-Oh kinase/protein kinase C pathways in evodiamine-induced human melanoma A375-S2 cell death. J. Pharmacol. Sci. 2005, 97, 494–500. [Google Scholar] [CrossRef]
  47. Kunimoto, R.; Jimbow, K.; Tanimura, A.; Sato, M.; Horimoto, K.; Hayashi, T.; Hisahara, S.; Sugino, T.; Hirobe, T.; Yamashita, T.; et al. SIRT1 regulates lamellipodium extension and migration of melanoma cells. J. Investig. Dermatol. 2017, 134, 1693–1700. [Google Scholar] [CrossRef] [PubMed]
  48. Ohanna, M.; Bonet, C.; Bille, K.; Allegra, M.; Davidson, I.; Bahadoran, P.; Lacour, J.P.; Ballotti, R.; Bertolotto, C. SIRT1 promotes proliferation and inhibits the senescence-like phenotype in human melanoma cells. Oncotarget 2014, 5, 2085–2095. [Google Scholar] [CrossRef] [PubMed]
  49. Karwaciak, I.; Gorzkiewicz, M.; Ryba, K.; Dastych, J.; Pulaski, L.; Ratajewski, M. AC-93253 triggers the downregulation of melanoma progression markers and the inhibition of melanoma cell proliferation. Chem. Biol. Interact. 2015, 236, 9–18. [Google Scholar] [CrossRef]
  50. Bajpe, P.K.; Prahallad, A.; Horlings, H.; Nagtegaal, I.; Beijersbergen, R.; Bernards, R. A chromatin modifier genetic screen identifies SIRT2 as a modulator of response to targeted therapies through the regulation of MEK kinase activity. Oncogene 2015, 34, 531–536. [Google Scholar] [CrossRef]
  51. Lai, Y.H.; Lin, S.Y.; Wu, Y.S.; Chen, H.W.; Chen, J.J.W. Ac-93253 iodide, a novel SRC inhibitor, suppresses NSCLC progression by modulating multiple SRC-related signaling pathways. J. Hematol. Oncol. 2017, 10, 172. [Google Scholar] [CrossRef]
  52. McGlynn, L.M.; Zino, S.; MacDonald, A.I.; Curle, J.; Reilly, J.E.; Mohammed, Z.M.; McMillan, D.C.; Mallon, E.; Payne, A.P.; Edwards, J.; et al. SIRT2: Tumour suppressor or tumour promoter in operable breast cancer? Eur. J. Cancer 2014, 50, 290–301. [Google Scholar] [CrossRef]
  53. Anders, S.; Huber, W. Differential expression analysis for sequence count data. Genome Biol. 2010, 11, R106. [Google Scholar] [CrossRef] [PubMed]
  54. Love, M.I.; Huber, W.; Anders, S. Moderated estimation of fold change and dispersion for RNA-seq data with DEseq2. Genome Biol. 2014, 15, 550. [Google Scholar] [CrossRef]
  55. Robinson, M.D.; McCarthy, D.J.; Smyth, G.K. Edger: A bioconductor package for differential expression analysis of digital gene expression data. Bioinformatics 2010, 26, 139–140. [Google Scholar] [CrossRef] [PubMed]
  56. Huang, R.; Rofstad, E.K. Integrins as therapeutic targets in the organ-specific metastasis of human malignant melanoma. J. Exp. Clin. Cancer Res. 2018, 37, 92. [Google Scholar] [CrossRef] [PubMed]
  57. Ciolczyk-Wierzbicka, D.; Laidler, P. The inhibition of invasion of human melanoma cells through N-cadherin knock-down. Med. Oncol. 2018, 35, 42. [Google Scholar] [CrossRef]
  58. Yamada, M.; Yanaba, K.; Hasegawa, M.; Matsushita, Y.; Horikawa, M.; Komura, K.; Matsushita, T.; Kawasuji, A.; Fujita, T.; Takehara, K.; et al. Regulation of local and metastatic host-mediated anti-tumour mechanisms by l-selectin and intercellular adhesion molecule-1. Clin. Exp. Immunol. 2006, 143, 216–227. [Google Scholar] [CrossRef]
  59. Wang, C.; Tseng, T.; Jhang, Y.; Tseng, J.; Hsieh, C.; Wu, W.G.; Lee, S. Loss of cell invasiveness through PKC-mediated syndecan-1 downregulation in melanoma cells under anchorage independency. Exp. Dermatol. 2014, 23, 843–849. [Google Scholar] [CrossRef]
  60. Sheppard, K.E.; McArthur, G.A. The cell-cycle regulator CDK4: An emerging therapeutic target in melanoma. Clin. Cancer Res. 2013, 19, 5320–5328. [Google Scholar] [CrossRef]
  61. Iida, M.; Omata, Y.; Nakano, C.; Yajima, I.; Tsuzuki, T.; Ishikawa, K.; Hori, M.; Kato, M. Decreased expression levels of cell cycle regulators and matrix metalloproteinases in melanoma from RET-transgenic mice by single irradiation of non-equilibrium atmospheric pressure plasmas. Int. J. Clin. Exp. Pathol. 2015, 8, 9326–9331. [Google Scholar] [PubMed]
  62. Abreu Velez, A.M.; Howard, M.S. Tumor-suppressor Genes, Cell Cycle Regulatory Checkpoints, and the Skin. N. Am. J. Med. Sci. 2015, 7, 176–188. [Google Scholar] [CrossRef] [PubMed]
  63. Jing, H.; Hu, J.; He, B.; Negron Abril, Y.L.; Stupinski, J.; Weiser, K.; Carbonaro, M.; Chiang, Y.L.; Southard, T.; Giannakakou, P.; et al. A SIRT2-selective inhibitor promotes c-MYC oncoprotein degradation and exhibits broad anticancer activity. Cancer Cell 2016, 29, 297–310. [Google Scholar] [CrossRef]
  64. Spiegelman, N.A.; Price, I.R.; Jing, H.; Wang, M.; Yang, M.; Cao, J.; Hong, J.Y.; Zhang, X.; Aramsangtienchai, P.; Sadhukhan, S.; et al. Direct comparison of SIRT2 inhibitors: Potency, specificity, activity-dependent inhibition, and on-target anticancer activities. ChemMedChem 2018, 13, 1890–1894. [Google Scholar] [CrossRef]
  65. Rix, U.; Hantschel, O.; Durnberger, G.; Remsing Rix, L.L.; Planyavsky, M.; Fernbach, N.V.; Kaupe, I.; Bennett, K.L.; Valent, P.; Colinge, J.; et al. Chemical proteomic profiles of the BCR-ABL inhibitors imatinib, nilotinib, and dasatinib reveal novel kinase and nonkinase targets. Blood 2007, 110, 4055–4063. [Google Scholar] [CrossRef]
  66. Li, J.; Rix, U.; Fang, B.; Bai, Y.; Edwards, A.; Colinge, J.; Bennett, K.L.; Gao, J.; Song, L.; Eschrich, S.; et al. A chemical and phosphoproteomic characterization of dasatinib action in lung cancer. Nat. Chem. Biol. 2010, 6, 291–299. [Google Scholar] [CrossRef]
  67. Ivanov, V.N.; Hei, T.K. Combined treatment with EGFR inhibitors and arsenite upregulated apoptosis in human EGFR-positive melanomas: A role of suppression of the PI3K-AKT pathway. Oncogene 2005, 24, 616–626. [Google Scholar] [CrossRef]
  68. Miao, B.; Ji, Z.; Tan, L.; Taylor, M.; Zhang, J.; Choi, H.G.; Frederick, D.T.; Kumar, R.; Wargo, J.A.; Flaherty, K.T.; et al. Eα2 is a mediator of vemurafenib resistance and a novel therapeutic target in melanoma. Cancer Discov. 2015, 5, 274–287. [Google Scholar] [CrossRef]
  69. Fu, Y.M.; Yu, Z.X.; Pelayo, B.A.; Ferrans, V.J.; Meadows, G.G. Focal adhesion kinase-dependent apoptosis of melanoma induced by tyrosine and phenylalanine deficiency. Cancer Res. 1999, 59, 758–765. [Google Scholar]
  70. Liu, J.D.; Chen, S.H.; Lin, C.L.; Tsai, S.H.; Liang, Y.C. Inhibition of melanoma growth and metastasis by combination with (-)-epigallocatechin-3-gallate and dacarbazine in mice. J. Cell. Biochem. 2001, 83, 631–642. [Google Scholar] [CrossRef]
  71. Ryu, B.; Kim, D.S.; Deluca, A.M.; Alani, R.M. Comprehensive expression profiling of tumor cell lines identifies molecular signatures of melanoma progression. PLoS ONE 2007, 2, e594. [Google Scholar] [CrossRef] [PubMed]
  72. Wilking-Busch, M.J.; Ndiaye, M.A.; Liu, X.; Ahmad, N. RNA interference-mediated knockdown of SIRT1 and/or SIRT2 in melanoma: Identification of downstream targets by large-scale proteomics analysis. J. Proteom. 2018, 170, 99–109. [Google Scholar] [CrossRef] [PubMed]
  73. Li, Z.; Xie, Q.R.; Chen, Z.; Lu, S.; Xia, W. Regulation of SIRT2 levels for human non-small cell lung cancer therapy. Lung Cancer 2013, 82, 9–15. [Google Scholar] [CrossRef]
  74. Lombardo, L.J.; Lee, F.Y.; Chen, P.; Norris, D.; Barrish, J.C.; Behnia, K.; Castaneda, S.; Cornelius, L.A.; Das, J.; Doweyko, A.M.; et al. Discovery of n-(2-chloro-6-methyl- phenyl)-2-(6-(4-(2-hydroxyethyl)- piperazin-1-yl)-2-methylpyrimidin-4- ylamino)thiazole-5-carboxamide (BMS-354825), a dual SRC/ABL kinase inhibitor with potent antitumor activity in preclinical assays. J. Med. Chem. 2004, 47, 6658–6661. [Google Scholar] [CrossRef]
  75. Wang, X.D.; Reeves, K.; Luo, F.R.; Xu, L.A.; Lee, F.; Clark, E.; Huang, F. Identification of candidate predictive and surrogate molecular markers for dasatinib in prostate cancer: Rationale for patient selection and efficacy monitoring. Genome Biol. 2007, 8, R255. [Google Scholar] [CrossRef]
  76. Eustace, A.J.; Crown, J.; Clynes, M.; O’Donovan, N. Preclinical evaluation of dasatinib, a potent SRC kinase inhibitor, in melanoma cell lines. J. Transl. Med. 2008, 6, 53. [Google Scholar] [CrossRef]
  77. Kluger, H.M.; Dudek, A.Z.; McCann, C.; Ritacco, J.; Southard, N.; Jilaveanu, L.B.; Molinaro, A.; Sznol, M. A phase 2 trial of dasatinib in advanced melanoma. Cancer 2011, 117, 2202–2208. [Google Scholar] [CrossRef]
  78. Algazi, A.P.; Weber, J.S.; Andrews, S.C.; Urbas, P.; Munster, P.N.; DeConti, R.C.; Hwang, J.; Sondak, V.K.; Messina, J.L.; McCalmont, T.; et al. Phase I clinical trial of the SRC inhibitor dasatinib with dacarbazine in metastatic melanoma. Br. J. Cancer 2012, 106, 85–91. [Google Scholar] [CrossRef]
  79. Flaherty, K.T.; Infante, J.R.; Daud, A.; Gonzalez, R.; Kefford, R.F.; Sosman, J.; Hamid, O.; Schuchter, L.; Cebon, J.; Ibrahim, N.; et al. Combined BRAF and MEK inhibition in melanoma with BRAF v600 mutations. N. Engl. J. Med. 2012, 367, 1694–1703. [Google Scholar] [CrossRef]
  80. Long, G.V.; Fung, C.; Menzies, A.M.; Pupo, G.M.; Carlino, M.S.; Hyman, J.; Shahheydari, H.; Tembe, V.; Thompson, J.F.; Saw, R.P.; et al. Increased MAPK reactivation in early resistance to dabrafenib/trametinib combination therapy of BRAF-mutant metastatic melanoma. Nat. Commun. 2014, 5, 5694. [Google Scholar] [CrossRef]
  81. Corcoran, R.B.; Ebi, H.; Turke, A.B.; Coffee, E.M.; Nishino, M.; Cogdill, A.P.; Brown, R.D.; Della Pelle, P.; Dias-Santagata, D.; Hung, K.E.; et al. EGFR-mediated Re-activation of MAPK signaling contributes to insensitivity of BRAF mutant colorectal cancers to RAF inhibition with vemurafenib. Cancer Discov. 2012, 2, 227–235. [Google Scholar] [CrossRef]
  82. Girotti, M.R.; Pedersen, M.; Sanchez-Laorden, B.; Viros, A.; Turajlic, S.; Niculescu-Duvaz, D.; Zambon, A.; Sinclair, J.; Hayes, A.; Gore, M.; et al. Inhibiting EGF receptor or SRC family kinase signaling overcomes BRAF inhibitor resistance in melanoma. Cancer Discov. 2013, 3, 158–167. [Google Scholar] [CrossRef]
  83. Huang, T.S.; Rauth, S.; Das Gupta, T.K. Overexpression of EGF receptor is associated with spontaneous metastases of a human melanoma cell line in nude mice. Anticancer Res. 1996, 16, 3557–3563. [Google Scholar]
  84. Ma, D.; Niederkorn, J.Y. Role of epidermal growth factor receptor in the metastasis of intraocular melanomas. Invest. Ophthalmol. Vis. Sci. 1998, 39, 1067–1075. [Google Scholar]
  85. Qiu, L.; Wang, Q.; Di, W.; Jiang, Q.; Schefeller, E.; Derby, S.; Wanebo, H.; Yan, B.; Wan, Y. Transient activation of EGFR/AKT cell survival pathway and expression of survivin contribute to reduced sensitivity of human melanoma cells to betulinic acid. Int. J. Oncol. 2005, 27, 823–830. [Google Scholar]
  86. Straume, O.; Akslen, L.A. Importance of vascular phenotype by basic fibroblast growth factor, and influence of the angiogenic factors basic fibroblast growth factor/fibroblast growth factor receptor-1 and ephrin-a1/epha2 on melanoma progression. Am. J. Pathol. 2002, 160, 1009–1019. [Google Scholar] [CrossRef]
  87. Easty, D.J.; Hill, S.P.; Hsu, M.Y.; Fallowfield, M.E.; Florenes, V.A.; Herlyn, M.; Bennett, D.C. Up-regulation of ephrin-a1 during melanoma progression. Int J. Cancer 1999, 84, 494–501. [Google Scholar] [CrossRef]
  88. Margaryan, N.V.; Strizzi, L.; Abbott, D.E.; Seftor, E.A.; Rao, M.S.; Hendrix, M.J.; Hess, A.R. Epha2 as a promoter of melanoma tumorigenicity. Cancer Biol. Ther. 2009, 8, 279–288. [Google Scholar] [CrossRef]
  89. Parri, M.; Taddei, M.L.; Bianchini, F.; Calorini, L.; Chiarugi, P. Epha2 reexpression prompts invasion of melanoma cells shifting from mesenchymal to amoeboid-like motility style. Cancer Res. 2009, 69, 2072–2081. [Google Scholar] [CrossRef]
  90. Udayakumar, D.; Zhang, G.; Ji, Z.; Njauw, C.N.; Mroz, P.; Tsao, H. Epha2 is a critical oncogene in melanoma. Oncogene 2011, 30, 4921–4929. [Google Scholar] [CrossRef]
  91. Sussmuth, S.D.; Haider, S.; Landwehrmeyer, G.B.; Farmer, R.; Frost, C.; Tripepi, G.; Andersen, C.A.; Di Bacco, M.; Lamanna, C.; Diodato, E.; et al. An exploratory double-blind, randomized clinical trial with selisistat, a sirt1 inhibitor, in patients with huntington’s disease. Br. J. Clin. Pharmacol. 2015, 79, 465–476. [Google Scholar] [CrossRef]
  92. Carafa, V.; Rotili, D.; Forgione, M.; Cuomo, F.; Serretiello, E.; Hailu, G.S.; Jarho, E.; Lahtela-Kakkonen, M.; Mai, A.; Altucci, L. Sirtuin functions and modulation: From chemistry to the clinic. Clin. Epigenet. 2016, 8, 61. [Google Scholar] [CrossRef]
  93. Rumpf, T.; Schiedel, M.; Karaman, B.; Roessler, C.; North, B.J.; Lehotzky, A.; Olah, J.; Ladwein, K.I.; Schmidtkunz, K.; Gajer, M.; et al. Selective SIRT2 inhibition by ligand-induced rearrangement of the active site. Nat. Commun. 2015, 6, 6263. [Google Scholar] [CrossRef] [PubMed]
  94. Vandesompele, J.; De Preter, K.; Pattyn, F.; Poppe, B.; Van Roy, N.; De Paepe, A.; Speleman, F. Accurate normalization of real-time quantitative RT-PCR data by geometric averaging of multiple internal control genes. Genome Biol. 2002, 3, RESEARCH0034. [Google Scholar] [CrossRef] [PubMed]
  95. Karas’, K.; Sałkowska, A.; Sobalska-Kwapis, M.; Walczak-Drzewiecka, A.; Strapagiel, D.; Dastych, J.; Bachorz, R.A. and Ratajewski, M. Digoxin, an overlooked agonist of RORγ/RORγT. Front. Pharmacol. 2019, 9, 1460. [Google Scholar] [CrossRef]
  96. Mi, H.; Huang, X.; Muruganujan, A.; Tang, H.; Mills, C.; Kang, D.; Thomas, P.D. Panther version 11: Expanded annotation data from gene ontology and reactome pathways, and data analysis tool enhancements. Nucleic Acids Res. 2017, 45, D183–D189. [Google Scholar] [CrossRef]
  97. Liang, C.C.; Park, A.Y.; Guan, J.L. In vitro scratch assay: A convenient and inexpensive method for analysis of cell migration in vitro. Nat. Protoc. 2007, 2, 329–333. [Google Scholar] [CrossRef]
  98. Repetto, G.; del Peso, A.; Zurita, J.L. Neutral red uptake assay for the estimation of cell viability/cytotoxicity. Nat. Protoc. 2008, 3, 1125–1131. [Google Scholar] [CrossRef]
  99. Ratajewski, M.; Walczak-Drzewiecka, A.; Salkowska, A.; Dastych, J. Aflatoxins upregulate CYP3A4 mRNA expression in a process that involves the pxr transcription factor. Toxicol. Lett. 2011, 205, 146–153. [Google Scholar] [CrossRef] [PubMed]
  100. Crowley, L.C.; Christensen, M.E.; Waterhouse, N.J. Measuring survival of adherent cells with the colony-forming assay. Cold Spring Harb. Protoc. 2016, 2016, 8. [Google Scholar] [CrossRef]
  101. Guzman, C.; Bagga, M.; Kaur, A.; Westermarck, J.; Abankwa, D. Colonyarea: An ImageJ plugin to automatically quantify colony formation in clonogenic assays. PLoS ONE 2014, 9, e92444. [Google Scholar] [CrossRef] [PubMed]
Figure 1. Cellular WM853 and MDA-MB-435S clone characteristics. (a) SIRT2 expression in SCW3 and SSW30 clones of WM853 cells and SCM1 and SSM15 clones of MDA-MB-435S as evidenced by Western blotting. (b) The cytotoxic effects of dasatinib treatment (48 h) on melanoma SCW3 and SSW30 clones of the WM853 cell line, as evidenced using the neutral red assay, mean ± SD, (n = 3, independent experiments) (c) The cytotoxic effects of dasatinib treatment (48 h) on melanoma SCM1 and SSM15 clones of the MDA-MB-435S cell line, as evidenced using the neutral red assay, mean ± SD, (n = 3, independent experiments).
Cancers 11 00673 g001
Figure 2. (a) Effect of dasatinib on the capacity of SCW3 and SSW30 cells to produce progeny as determined using the colony formation assay. Images from a single representative experiment (left panel) and a computer-generated area lacking values to illustrate the colony formation assay (right panel), mean ± SD, (n = 4). * Indicates a statistically significant difference at p < 0.05. (b) Effect of dasatinib on the capacity of SCM1 and SSM15 cells to produce progeny as determined using the colony formation assay. Image from a single representative experiment (left panel) and computer-generated area lacking values to illustrate the colony formation assay (right panel), mean ± SD, (n = 4). * Indicates a statistically significant difference at p < 0.05.
Cancers 11 00673 g002
Figure 3. Treatment with dasatinib impairs the migration of melanoma cells based on the scratch assay. (a) Image from a single representative experiment performed using WM853 SCW3 and SSW30 clones. (b) Image from a single representative experiment performed using MDA-MB-435S SCM1 and SSM15 clones. Quantification of above results is shown in the Figure S4. 10 × 10 magnification.
Cancers 11 00673 g003
Figure 4. (a) Cell cycle phase distribution in SCW3 and SSW30 clones. (b) Cell cycle phase distribution in SCM1 and SSM15 clones. The data are presented as the mean ± SD, (n = 3). * Indicates a statistically significant difference at p < 0.05 in %G1 phase between dasatinib and control treatment. ^ Indicates a statistically significant difference in %S phase between dasatinib and control treatment at p < 0.05. & Indicates a statistically significant difference at p < 0.05 in %G2 phase between dasatinib and control treatment. # Indicates a statistically significant difference at p < 0.05 for a given phase between control cell line and SIRT2-deficient cells.
Cancers 11 00673 g004
Figure 5. SIRT2 downregulation impairs the response of melanoma cells to EGFR and EPHA2 activators. The generated melanoma clones were treated with selected concentrations of EGF (EGFR activator) and ephrin A1 (EPHA2 activator) for 10 min and/or 30 min, respectively. Then, protein lysates were prepared and analyzed by Western blotting. (a) Experiments performed using WM853 SCW3 and SSW30 clones. (b) Experiments performed using MDA-MB-435S SCM1 and SSM15 clones.
Cancers 11 00673 g005
Figure 6. SIRT2 downregulation impairs the expression and phosphorylation of tyrosine kinase receptor-associated pathways. The generated melanoma clones were treated with selected concentrations of dasatinib for 1 h. Then, protein lysates were prepared and analyzed by Western blotting. (b) Experiments performed using WM853 SCW3 and SSW30 clones. (a) Experiments performed using MDA-MB-435S SCM1 and SSM15 clones.
Cancers 11 00673 g006
Table 1. Selected category of genes (based on a literature search) with changes in expression in WM853 cells with SIRT2 downregulation as determined using RNA-seq.
Gene SymbolProteinEffectAverage Fold Change
Integrins
ITGA1integrin subunit alpha 10.462
ITGA3integrin subunit alpha 32.173
ITGA4integrin subunit alpha 40.556
ITGA5integrin subunit alpha 51.588
ITGA6integrin subunit alpha 62.221
ITGA9integrin subunit alpha 92.498
ITGA11integrin subunit alpha 110.551
ITGAEintegrin subunit alpha E0.540
ITGALintegrin subunit alpha L0.540
Cadherins
CDH2cadherin 21.770
CDH19cadherin 194.203
Selectins
SELLSelectin L8.589
Syndecans
SDC1syndecan 10.300
SDC2syndecan 24.304
Immunoglobulin-like Cell Adhesion Molecules
NCAM1neural cell adhesion molecule21.328
Receptor tyrosine kinases
EGFRepidermal growth factor receptor0.456
IGF1Rinsulin like growth factor 1 receptor1.653
IGFLR1IGF like family receptor 10.647
FGFR1fibroblast growth factor receptor 14.052
NGFRnerve growth factor receptor0.579
EPHA2EPH receptor A20.477
EPHA3EPH receptor A31.646
EPHA5EPH receptor A30.421
EPHB3EPH receptor B32.767
AXLAXL receptor tyrosine kinase0.592
ROR1receptor tyrosine kinase like orphan receptor 12.547
MAP/ERK pathway
GRB14growth factor receptor bound protein 143.678
RASAL1RAS protein activator like 17.833
RASD2RASD family member 23.716
RASEFRAS and EF-hand domain containing2.321
RASGEF1CRasGEF domain family member 1C0.195
RASGRP1RAS guanyl releasing protein 16.635
RASGRP3RAS guanyl releasing protein 30.417
RASSF2Ras association domain family member 22.186
RASSF4Ras association domain family member 40.594
RASSF5Ras association domain family member 52.972
MAP2K3mitogen-activated protein kinase kinase 30.593
MAP2K6mitogen-activated protein kinase kinase 62.309
MAP3K4mitogen-activated protein kinase kinase kinase 40.598
MAP3K14mitogen-activated protein kinase kinase kinase 140.585
MAP3K21mitogen-activated protein kinase kinase kinase 213.521
Other protein kinases
BTKtyrosine-protein kinase BTK0.342
GAKcyclin G-assiciated kinase0.583
LYNtyrosine protein kinase LYN0.275
Cell cycle regulators
CDK5R1cyclin dependent kinase 5 regulatory subunit 10.653
CDK6Cyclin-dependent kinase 61.660
CDKL2cyclin dependent kinase like 22.001
CDKN1ACyclin-dependent kinase inhibitor 1A (P21WAF)0.615
CDKN2Bcyclin dependent kinase inhibitor 2B4.107
CDKN2Ccyclin dependent kinase inhibitor 2C0.546
CDKN2Dcyclin dependent kinase inhibitor 2D0.587
Average fold change: the difference in gene expression levels between WM853 SCW3 and WM853 SSW30 clones was counted as the mean fold change in the deseq, deseq2 and edgeR analyses.
Table 2. Selected category of genes (based on a literature search) with changes in expression in MDA-MB-435S cells with SIRT2 downregulation as determined using RNA-seq.
Gene SymbolProteinEffectAverage Fold Change
Integrins
ITGA1integrin subunit alpha 10.051
ITGBL1integrin subunit beta like 10.227
Cadherins
CDH12cadherin 128.313
Syndecans
SDC2syndecan 20.452
Immunoglobulin-like Cell Adhesion Molecules
NCAM1neural cell adhesion molecule0.572
ICAM5intercellular adhesion molecule 50.449
Receptor tyrosine kinases
EGFRepidermal growth factor receptor0.195
FGFR1fibroblast growth factor receptor 12.005
EPHA2EPH receptor A20.423
EPHB1EPH receptor B10.360
AXLAXL receptor tyrosine kinase2.086
DDR1Discoidin domain receptor family, member 10.576
MAP/ERK pathway
GRB14growth factor receptor bound protein 140.234
RASL10BRAS like family 10 member B2.220
MAP3K9mitogen-activated protein kinase kinase kinase 90.638
MAPK8IP1mitogen-activated protein kinase 8 interacting protein 10.342
MAPK8IP2mitogen-activated protein kinase 8 interacting protein 20.587
Cell cycle regulators
CDK14Cyclin-dependent kinase 140.207
CDK18Cyclin-dependent kinase 181.536
CDK20Cyclin-dependent kinase 200.073
CDKN2Dcyclin dependent kinase inhibitor 2D0.643
Average fold change: the difference in gene expression levels between MDA-MB-435S SCM1 and MDA-MB-435S SSM15 clones was counted as the mean fold change in the deseq, deseq2 and edgeR analyses.

