Article

Evolution of Mutational Landscape and Tumor Immune-Microenvironment in Liver Oligo-Metastatic Colorectal Cancer

by
Alessandro Ottaiano
1,*,†,
Michele Caraglia
2,3,†,
Annabella Di Mauro
4,
Gerardo Botti
4,
Angela Lombardi
2,3,
Jerome Galon
5,
Amalia Luce
2,3,
Luigi D’Amore
6,
Francesco Perri
7,
Mariachiara Santorsola
1,
Fabienne Hermitte
8,
Giovanni Savarese
6,
Fabiana Tatangelo
4,
Vincenza Granata
9,
Francesco Izzo
10,
Andrea Belli
10,
Stefania Scala
11,
Paolo Delrio
12,
Luisa Circelli
6,‡ and
Guglielmo Nasti
1,‡
1
Department of Abdominal Oncology, SSD-Innovative Therapies for Abdominal Cancers, Istituto Nazionale Tumori di Napoli, IRCCS “G. Pascale”, Via M. Semmola, 80131 Naples, Italy
2
Department of Precision Medicine, University of Campania “L. Vanvitelli”, Via L. De Crecchio 7, 80138 Naples, Italy
3
Biogem Scarl, Institute of Genetic Research, Laboratory of Precision and Molecular Oncology, 83031 Ariano Irpino, Italy
4
Department of Pathology, Istituto Nazionale Tumori di Napoli, IRCCS “G. Pascale”, Via M. Semmola, 80131 Naples, Italy
5
INSERM, Laboratory of Integrative Cancer Immunology, Equipe Labellisée Ligue Contre le Cancer, Sorbonne Université, Université Sorbonne Paris Cité, Université Paris Descartes, Université Paris Diderot, Centre de Recherche des Cordeliers, F-75006 Paris, France
6
AMES-Centro Polidiagnostico Strumentale, Srl, 80013 Naples, Italy
7
Head and Neck Cancer Medical Oncology Unit, Istituto Nazionale Tumori di Napoli, IRCCS “G. Pascale”, Via M. Semmola, 80131 Naples, Italy
8
HalioDx, 13288 Marseille, France
9
Department of Radiology, Istituto Nazionale Tumori di Napoli, IRCCS “G. Pascale”, Via M. Semmola, 80131 Naples, Italy
10
Hepatic Surgery Unit, Istituto Nazionale Tumori di Napoli, IRCCS “G. Pascale”, Via M. Semmola, 80131 Naples, Italy
11
Functional Genomics, Istituto Nazionale Tumori, IRCCS “G. Pascale”, Via M. Semmola, 80131 Naples, Italy
12
Colorectal Abdominal Surgery Division, Istituto Nazionale Tumori, IRCCS “G. Pascale”, Via M. Semmola, 80131 Naples, Italy
*
Author to whom correspondence should be addressed.
Co-first authors.
Co-last authors.
Submission received: 29 September 2020 / Revised: 14 October 2020 / Accepted: 18 October 2020 / Published: 21 October 2020
(This article belongs to the Section Cancer Biomarkers)

Abstract

:

Simple Summary

About 10% of colorectal cancer patients presents with oligo-metastatic disease. The aim of our study was to assess genetic and immunologic dynamics underlying the oligo-metastatic status, evaluating genotype-phenotype correlations in a clean and homogeneous clinical model of liver-limited metastatic colorectal cancer. We show that loss of KRAS and SMAD4 mutations characterizes the oligo-metastatic disease while a progressive mutational evolution (gain in KRAS, PI3KCA, BRAF and SMAD4) is observed in poly-metastatic evolving disease. Furthermore, high granzyme-B+ T-cells infiltration is found in oligo-metastatic lesions. This study can support innovative strategies to monitor clinical evolution and to induce regressive genetic trajectories in cancer.

Abstract

Genetic dynamics underlying cancer progression are largely unknown and several genes involved in highly prevalent illnesses (e.g., hypertension, obesity, and diabetes) strongly concur to cancer phenotype heterogeneity. To study genotype-phenotype relationships contributing to the mutational evolution of colorectal cancer (CRC) with a focus on liver metastases, we performed genome profiling on tumor tissues of CRC patients with liver metastatic disease and no co-morbidities. We studied 523 cancer-related genes and tumor-immune microenvironment characteristics in primary and matched metastatic tissues. We observed a loss of KRAS and SMAD4 alterations and a high granzyme-B+ T-cell infiltration when the disease did not progress. Conversely, gain in KRAS, PIK3CA and SMAD4 alterations and scarce granzyme-B+ T-cells infiltration were observed when the tumor evolved towards a poly-metastatic spread. These findings provide novel insights into the identification of tumor oligo-metastatic status, indicating that some genes are on a boundary line between these two clinical settings (oligo- vs. poly-metastatic CRC). We speculate that the identification of these genes and modification of their evolution could be a new approach for anti-cancer therapeutic strategies.

Graphical Abstract

1. Introduction

Colorectal cancer (CRC) is the second most occurring neoplasia in men and the third in women, and the second leading cause of cancer-related deaths worldwide. Solid epidemiologic data show that in 2018 there were over 1.8 million new cases [1], raising a significant scientific interest [2,3,4,5,6]. Unfortunately, about 30–40% of patients have at diagnosis a metastatic CRC (mCRC), and an additional 30% will develop it later. Liver is the most typical site of distant spread (about 50% of patients), followed by non-regional lymph nodes, lungs, and peritoneum. Bone, brain, and other sites are infrequent targets of metastatic spread [7,8].
Beside typical poly-metastatic CRC (pmCRC), in clinical practice, many advanced patients (about 5–10%) have an oligo-metastatic CRC (omCRC) associated to an indolent and long-term survival course of the disease. Some authors identified oligo-metastases as cancer involving one to three lesions per organ with a maximum tumor diameter smaller than 7 cm [9,10]. Therefore, beside the tumor burden, it has been also considered the “rate of metastases development,” which is low in the oligo-metastatic phenotype [11,12,13]. However, to date, neither the biologic dynamics underlying the oligo-metastatic status nor eventual specific features of poly-metastatic disease are known. The study of gene evolutions during cancer progression is fundamental to generate hypotheses on their role in om- and pmCRC and find phenotype-genotype correlations. However, the eventual presence of co-morbidities can induce changes in cancer genetics, molecular, and clinical outcomes, complicating both epidemiologic and mechanistic studies. In fact, several genes and related products involved in highly prevalent illnesses strongly concur to cancer heterogeneity, i.e., hypertension [14,15,16], diabetes [17], allergies [18,19,20,21] and inflammatory chronic diseases [22,23,24].
OmCRC represents an intriguing model to investigate the mutational evolution of cancer. We have previously reported that CRC developing in a single nodule lung spread, had atypical genomic trajectories (KRAS back mutations), scarce T-cell infiltration into primary tumor, and specific gene mutations (common ERBB2 point mutations and very low incidence of SMAD4 alterations) [25].
The present study was conducted in a well-defined omCRC model (Figure S1) of primary CRC with synchronous single liver metastasis. We performed a comprehensive mutational and immunologic analysis of tumor and its micro-environment among patients without recurrence at 3 years follow-up and patients who rapidly developed poly-metastatic disease (Figure S2) in order to explore and generate hypotheses on the genetic trajectories and immunologic dynamics characterizing oligo-metastatic CRC evolution.

2. Results

2.1. Characteristics of Patients

From 2013 to 2018, 98 patients subjected to concomitant surgical removal of primary CRC and synchronous liver oligo-metastases (≤3 lesions) were screened for inclusion in the present study (Figure S1). At the end of the selection process, six patients (6.1% of our initially screened series) were identified and divided into (A) patients without recurrence at 3-year follow-up (PAT1, PAT2 and PAT3), and (B) patients whose CRC recurred within 1 year (PAT4, PAT5 and PAT6) (Figure S2). Clinico-pathological and personal characteristics of patients are reported in Table 1 and Table 2. At the time of manuscript presentation, all patients belonging to group A were alive without diseases (AWD). These patients represented a clean model of CRC evolving towards oligo-metastatic liver-limited spread.

2.2. Mutational Concordance, Tumor Mutation Burden (TMB), Microsatellite (MSI) Status and Mutational Signatures

A genomic analysis of primary and matched metastatic tissues was performed in order to depict any relevant group-specific genetic trajectory. A descriptive analysis of the overall genetic concordance was done with Venn diagrams; TMB and MSI were also evaluated given their role in the genetic layout of cancer as well as in the neo-antigenic cancer-related load. Figure 1 reports Venn diagrams, TMB, and MSI of enrolled patients.
The genetic sharing between primary tumors (PTs) and matched liver metastases (Metastatic Tumors: MTs) was high in all cases (from 84.3% in PAT2 to 97.2% in PAT1, mean: 91.7%). Overall, TMB ranged from 2.1 mutations/Mb (PT of PAT5, group B) to 45.1 mutations/Mb (PT of PAT2, group A). TMB variation {[(TMB of MT-TMB of PT)/TMB of PT] × 100} was calculated being a marker of tumor mutational evolution. It ranged from −28.8% to +19.1% in group A vs. +24.7% to +123.8% in group B (p = 0.0435). The MSI status was more frequently unstable (three out of six samples) in group A compared to group B (only one sample out of six). The set of somatic mutations observed in a specific cancer, with its distinct patterns of base-pair substitutions (C:G > A:T, T:A > G:C, etc.) found in each trinucleotide context, reflects the mutational processes active during its life history. This represents a fingerprint documenting an aspect of heterogeneity and mutational evolution of cancer. Interestingly, none of the patients had significant PT/MT differences in terms of mutational profiles (>10% of the 96 combinations with delta-frequencies (MT-PT) of specific base-pair mutation types >25%) (Figure 2).

2.3. Overall Genes Evolution

The overall gene evolution of groups A and B was also collectively analyzed to find any genotype/phenotype correlations. Venn diagrams were depicted in order to show the extent of shared and private events among PTs and MTs (Figure 3A,C). Interestingly, in group A, 86 genes were shared among PTs, and MTs. Conversely, in group B, only one gene was shared and it was the same in PTs and MTs (Figure 3D) (RP11-145E5.5, 9: g.21975017C>T leading to a NMD transcript variant, Tier 2 according to according to AMP/ACMG prioritization of variants). Genetic results of group A were submitted to Phenolyzer to identify any relationships between “seed” genetic variants and “secondary” ones (see Methods). The most dominant and interrelated genes were APC, EP300 and TP53 (Figure 3B).

2.4. Key Driver Genes Evolution

The association between mutations of specific genes and CRC development has been demonstrated by several studies. The landscape of these “driver mutations”, in a case-matched manner (PT vs. MT), is reported in Table 3. At this regard, group A and group B present divergent mutational directions towards the metastatic tumor development. PAT1 appears genetically stable, PAT2 loses alterations of KRAS and SMAD4, and PAT3 loses a pathogenic mutation of KRAS. By contrast, in group B, PAT4 gains mutations in KRAS and PIK3CA, PAT5 gains mutations in PIK3CA and SMAD4, and PAT6 progresses in PIK3CA and BRAF alterations (non-canonical mutation). A complete list of genes’ alterations gained by liver metastases in each patient, along with their role in cancer, AMP/ACMG prioritization and ClinVar ID, is reported in Table S1.

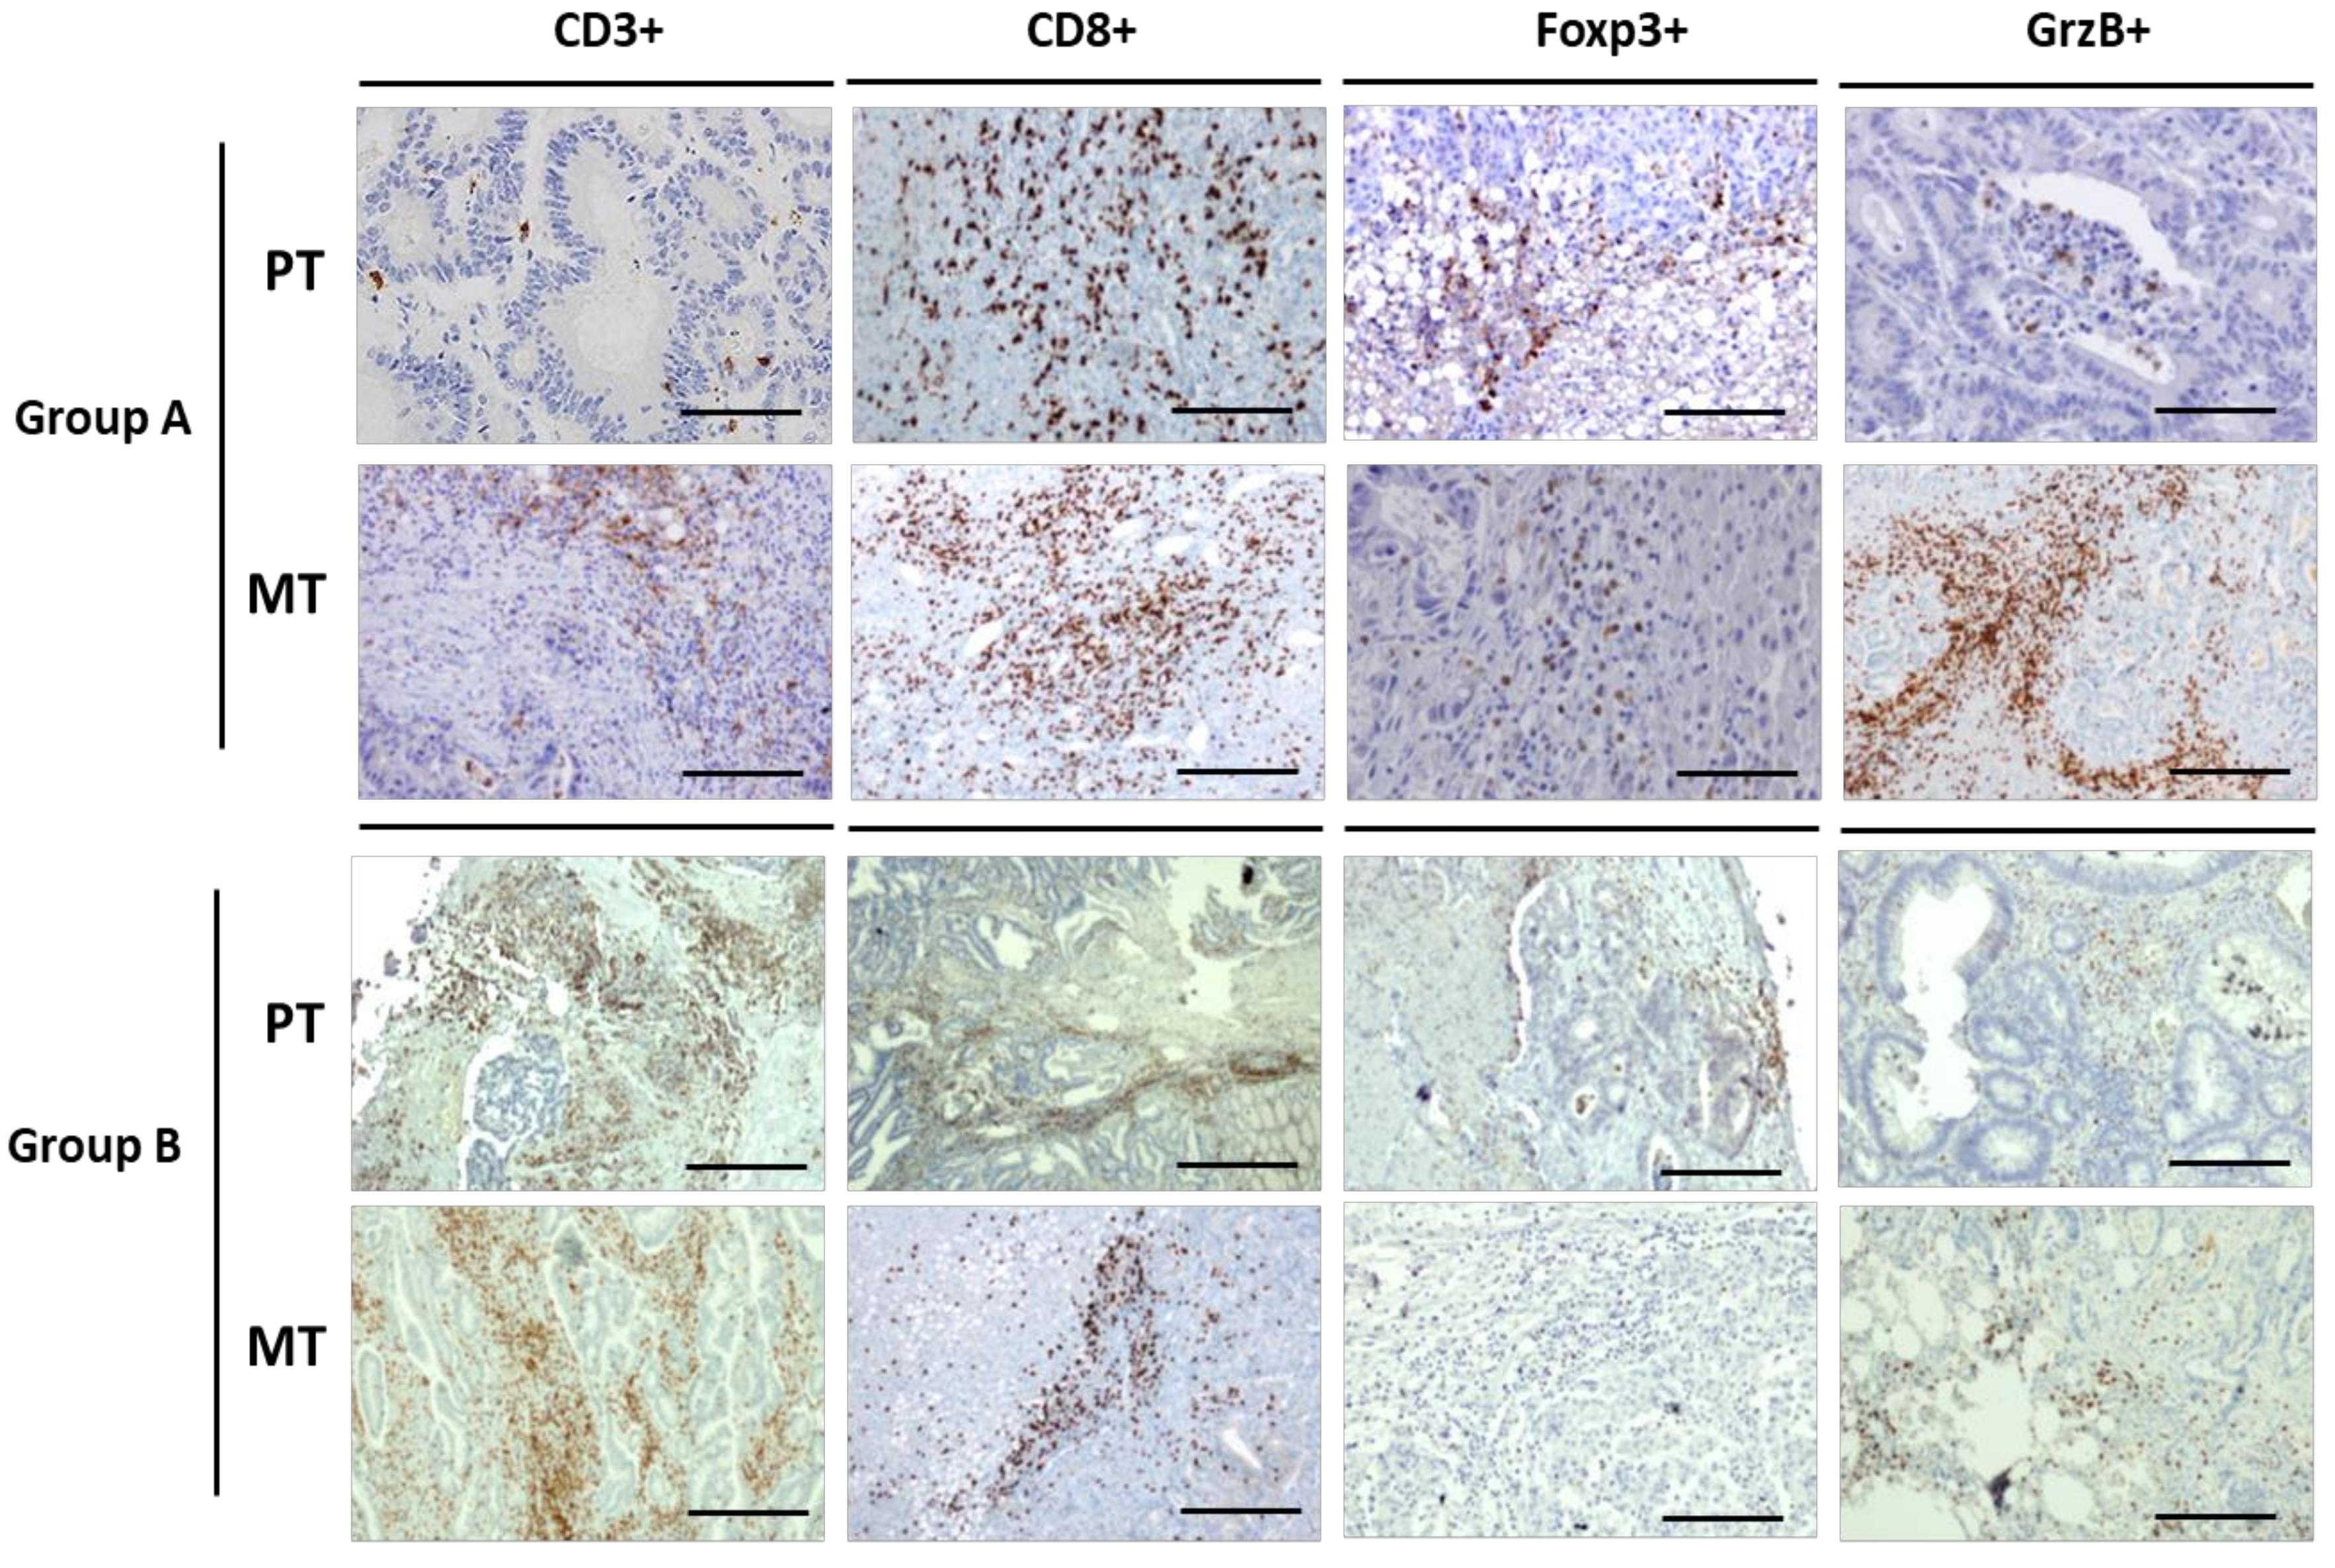
2.5. Tumor Microenvironment Evolution

It is increasingly clear that tumor immune microenvironment has strong influence on tumor initiation and progression in CRC. Therefore, to analyze the dynamics of the immunological microenvironment, CD3+, CD8+, FoxP3+, and GrzB+ cells were quantified in matched PT and MT tissues by IHC. The density of each cell subset (means ± 2SD) is reported in Table 4. Three random cases were also submitted to immunoscore assessment. Immunoscore represents the most objective and complex evaluation of tumor immunological microenvironment integrating digital pathology and a dedicated image-analysis software. Our results were concordant with immunoscore assessments. Densities of T-cell subsets in primary tumors were much more variable than those in the metastatic ones. Significant differences between groups were registered only in CD8+ at invasive margins (IM) of PTs (group A vs. group B: 166.7 ± 16.6 vs. 533.3 ± 88.1; p = 0.0150) and in GrzB+ cells into tumor cores (TC) of MTs (group A vs. group B: 58.6 + 8.6 vs. 27.6 + 2.7; p = 0.0270). Considering the high biologic relevance of GrzB+ lymphocytes that are the fully differentiated and activated anti-tumor lytic cells, representative immunohistochemical stainings of group A and group B TCs’ microenvironment for CD3+, CD8+, FoxP3+ and GrzB+ cells is reported in Figure 4.

3. Discussion

In the present study we show, for the first time in a well-defined model of CRC, that oligo-metastatic disease follows mutational directions divergent from those of poly-metastatic disease. Differently from our previous report [25] where two out four patients received chemotherapy before surgical metastasis removal, in the present one there was no interference of systemic treatments because patients were subjected at the same time to primary and metastatic tumor surgical removal. The latter condition determined the clear definition of our clinical and pathological model and it could be responsible for the high concordance observed in both mutational signatures and genetic features between PTs and MTs.
Metastases in group A patients slip along a milder phenotypic trajectory characterized by “back” mutations of key driver genes. In fact, in two patients we observed that phenomenon in KRAS and SMAD4, two conserved genes in previous high-throughput analyses of matched primary-pmCRCs (Table S2). These data were repeated and confirmed through PEPP re-sampling and KRAS mutation PCR-based testing. In another good prognosis patient (PAT1) the mutational evolution was stable. Moreover, group A patients presented a high GrzB+ T cell-subsets in tumor core of MTs microenvironment revealing enhanced activation of tumor-infiltrating lymphocytes (TILs) in those lesions (where two out of three were MSI unstable).
Conversely, in group B, the mutational directions were characterized by “forward” mutations in key driver genes in all cases (KRAS and PIK3CA in PAT4, PI3KCA and SMAD4 in PAT5, and PIK3CA and BRAF in PAT6) and tumor immune microenvironment was infiltrated by a significantly low density of GrzB+ CD8+ cells. Therefore, despite a similar clinical presentation, the cancer population in group B evolved along both progressive oncogenic mutations in CRC development and immunological escape.
The evolution of some specific genes deserves discussion given their known or putative role in CRC. In fact, PIK3CA mutations were gained in all MTs of patients with poor prognosis. Phosphatidylinositol 3-kinases (PI3Ks) are lipid kinases that phosphorylate phosphoinositidies at the D3 position of the inositol and produce intracellular messengers regulating proliferation, adhesion, and migration. Mutations in the p110alpha subunit (PIK3CA) are associated with anti-cancer drug resistance, aggressive histologic features, and poor overall survival [26,27]. Similar effects, as already described above, (forward mutations) were observed for KRAS (PAT4), NRAS and SMAD4 (PAT5) and BRAF (PAT6).
In total, 86 genes were shared among PTs and MTs in group A. Phenolyzer tool was applied in order to evidence the most dominant and interrelated genes. Interestingly, along APC and TP53, which have a defined role in CRC [28], we found EP300 gene among the first three dominant ones. EP300 gene encodes a histone acetyl-transferase (HAT p300) involved in the epigenetic regulation of chromatin activity [29]. This transcript can influence important cell processes such as proliferation and differentiation. EP300 mutations have been found in many cancers including CRC; however, its precise role in tumorigenesis is debated and contradictory, since some studies showed a tumor suppressor function, while others showed oncogenic co-activation properties [30,31]. Our results indicate that additional studies are needed to define the role of EP300 and its relationships with the oligo-metastatic behavior. Interestingly, beside genes involved in proliferation, apoptosis, differentiation, and neoangiogenesis (ERBB2, PIK3R2 and 3, CDKN1B, CASP8, HSP90AA1, FLT3, KDR, AURKA and B, FGFR4, BCL2L2, NOTCH3, BCR), a significant number of other genes evidenced with Phenolyzer tool in group A were involved in DNA repair mechanisms (MSH3, BRCA1, ATM, POLE, BRCA2, CHEK1, GLI1). The latter, together with the increased MSI and TMB, could account for high immunogenicity of group A metastases characterized by high density of GrzB+ CD8+ T-cells into tumor cores.
Conversely, in group B patients, we observed a more marked mutational divergence with only shared one gene: RP11-145E5.5. Its product is a S-methyl-5’-thioadenosine phosphorylase (MTAP) involved in polyamine biosynthesis. Loss of MTAP activity has been hypothesized to play a role in malignant melanoma [32,33]. Unfortunately, very little is known in CRC where it appears overexpressed compared to normal mucosa and positively related to aggressiveness of CRC cells [34,35]. Another important ancillary observation of our study is the alterations of some genes correlated to the homing of metastases to the liver. In details, the following genes were frequently altered in PTs and MTs of our series: HSP90AA1, NR4A2, KDR, FLT3 and RPS6KB2 [36,37]. Notably, they can act directly by promoting cell migration, EMT promotion and proliferation (KDR, FLT3) or indirectly through pleiotropic actions (HSP90AA1: protein stabilization; NR4A3: epigenetic modifications; RPS6KB2: protein synthesis). Even though such aspects are beyond the scope of this work, additional studies are needed to verify the effects of these genes (HSP90AA1, NR4A3, RPS6KB2) on the expression of proteins involved in CRC metastatization (chemokine receptors, adhesion molecules, growth factors, etc.).
The strength of our work resides on the rigorous effort we made to select patients having cancer as the only illness. In fact, as previously discussed, many prevalent diseases may have a profound impact on cancer heterogeneity and interfere through common genetic mediators. Previous published analyses, even if larger than the present one, suffered from extreme heterogeneity (different stages, heterogeneous and sequential treatments, different comorbidities, etc.) and this certainly affects results’ interpretation. Therefore, although on a smaller series of patients, this work contains a strong hypothesis-generating power on the different mutational directions of om- vs. pm-CRC.
Liquid biopsy, whose dissertation is beyond the scope of this work, although still not a standard procedure, could represent a very useful tool to monitor tumor mutational evolution in CRC [37]. Interestingly, we have observed disappearance of KRAS mutations through liquid biopsies in pmCRC (manuscript in preparation). This phenomenon was much more frequent in specific pathogenic mutations (p.G12D, p.G12V, p.G13D) and it was associated with a better prognosis. Furthermore, we have recently shown, in a very clean model of oligo-metastatic CRC, that regressive trajectories of specific “backbone” mutations (as SMAD4 and KRAS) can associate with a better clinical course [25].
Some limits deserve to be evidenced and discussed. First, we cannot rule out the hypothesis that back mutations occurred spontaneously, lacking direct evidences that group A neoplastic mutated clones were specifically recognized and eliminated by GrzB/CD8+ T-cells (immune mediated sub-clonal selection). Second, the size of our work was necessarily limited by the very high selection we made. In fact, considering all patients submitted to hepatic surgery for mCRC in the analyzed period (2013–2018) in our institute, only 1.3% (6/444) had the clinical characteristics to be included in this study. Third, we did not analyze tumor tissues from group B patients at progression because of unavailability of subsequent tissues (further surgery or solid/liquid biopsies). This was a “missed opportunity” in those patients to record mutational and immunologic dynamics of poly-metastatic spread. We have also to discuss that the negative prognosis of group B could be influenced by, at least, two clinico-pathological factors of primary tumors: (i) the lymph node involvement (all patients were N+) and (ii) the sidedness (two patients had right-sided tumors). However, only PAT5 had N2b involvement, while PAT4 and 6 had only two positive lymph-nodes, and the 5-year survival of these patients is quite similar to stage II (about 60%). Moreover, the right-sided CRC prognosis is related to the biology and initial stage of disease rather than to the tumor site itself. On the other hand, all cases of our series presented with stage IV disease due to the presence of single liver metastases. In this clinical setting, oncologists are always called up to plan the same therapeutic strategy, often based on adjuvant-like administration of chemotherapy.

4. Materials and Methods

4.1. Tumor Specimens and Sequencing

Matched Formalin-Fixed and Paraffin-Embedded (FFPE) tissue specimens of primary colorectal cancer and single-nodule liver metastases were collected following a strict selection (Figure S1). The study was approved by the Scientific Director of our Institute (Prof.Gerardo Botti, Scientific Director of the Istituto Nazionale Tumori di Napoli, IRCCS “G. Pascale”, via M. Semmola, 80131, Naples, Italy). All patients admitted in our Institution sign an informed consent to allow any biologic studies on their peripheral blood cells and/or fresh or FFPE tissues. Ten μM serial sections were cut from each tissue specimen for microdissection of tumor cells under morphological control. DNA isolation was performed through the MGF03-Genomic DNA FFPE One-Step Kit, according to the manufacturer’s protocol (MagCoreDiatech, RBCBioscience, Ln. 235, Baoqiao Rd., Xindian Dist., New Taipei City 23145, Taiwan). DNA quality was established in triplicate using the FFPE QC Kit according to the manifacturer’s protocol (Illumina, San Diego, CA, USA). Libraries were prepared with TruSigtTMOncology 500 kit, based on target enrichment that analyzes 523 cancer-relevant genes. The assay detects small nucleotide variants (SNVs), indels, splice variants, and immunotherapy biomarkers such as tumor mutational burden (TMB) and microsatellite instability (MSI) (see below). Sequencing was performed on an Illumina NovaSeq 6000 (San Diego, CA, USA) platform.

4.2. Tumor Mutational Burden (TMB), Microsatellite Instability (MSI) and Mutational Profiles

TMB was measured by exome sequencing [38], counting all coding, somatic base substitutions and indels in the targeted regions, including synonymous alterations. The size of the targeted (coding) genomic region was 1.9 Mb. MSI as result of impaired DNA mismatch repair represents a phenotype of clinical significance in colorectal cancers. A highly accurate exome-based predictive model for the MSI phenotype was used, it resides on a statistical MSI classifier from somatic mutation profiles that separates MSI-H (MSI-high) from MSS (MS stable) tumors [39]. The MSI classifier was trained using 999 exome-sequenced TCGA tumor samples with known MSI status (i.e., assayed from mononucleotide markers), and obtained a positive predictive value of 98.9% and a negative predictive value of 98.8% on an independent test set of 427 samples.
The set of somatic mutations observed in a cancer and distinct patterns of substitution types reflect the specific mutational processes that have been active during its life history. Here, with a descriptive aim, we reported the matched mutational profiles of primary and metastatic lesions displaying the fraction of mutations found in each trinucleotide context. A mutational signature is the combination of the frequencies of all base-pair mutation types (C:G  >  A:T, T:A  >  G:C, etc.) and their flanking nucleotides; the convention is to annotate mutations from the pyrimidine (C  >  A, T  >  A, etc.). The figures plot all 96 possible combinations of mutation types and neighboring bases.

4.3. Tumor-Infiltrating Lymphocytes Analysis

Analysis of T cell subsets in tumor microenvironment was conducted through immunohistochemistry (IHC). Formalin-fixed, paraffin-embedded 4-μm tissue sections of primary CRC and liver metastases were immunostained according to a biotin-streptavidin-peroxidase method (YLEM kit, Rome, Italy). Before incubation with primary antibodies, sections were subjected to (i) routine deparaffinization, (ii) rehydration, (iii) treatment with Dako target retrieval solution, (iv) incubated for 10 min on a hot plate (95–99 °C), (v) allowed to cool for 20 min, (vi) incubated for 10 min in 3% hydrogen peroxide in distilled water, (vii) washed in PBS thrice for 5 min, (viii) incubated with 10% normal horse serum in PBS for 30 min, and (ix) washed with PBS buffer. Treatment with primary antibodies (anti-human CD3, anti-human CD8, anti-human FoxP3, and anti-human Granzyme B [40]) was done for 2 h at room temperature. The antigens were then revealed through a biotin-labeled secondary antibody/streptavidin-peroxidase/diaminobenzidinetetrahydrochloride method: sections were incubated with biotin-labeled secondary antibody (1:30), streptavidin-peroxidase (1:30) for 20 min each, and stained for 5 min with 0.05% 3,3′-diaminobenzidine tetrahydrochloride freshly prepared in 0.05 mol/L Tris-HCl buffer (pH 7.6) containing 0.024% hydrogen peroxidase. Finally, slides were counterstained with hematoxylin, dehydrated, and mounted in Diatex. Negative controls were obtained by substituting the primary antibody with a mouse myeloma protein of the same subclass at the same concentration as the monoclonal antibody. Slides were scanned through an automated scanning microscope and image analysis system (Genetix, San Jose, CA, USA). Cell density was expressed as cells/mm2. All qualitative and quantitative analyses of T-cell subsets were reviewed by two pathologists blinded to all clinical information. The tumor microenvironment was morphologically divided into tumor core (TC) and invasive margins (IM) as previously described [41].

4.4. Biostatistical Analysis and Data Presentation

Illumina TruSigth Oncology 500 bioinformatics pipeline was applied to analyze sequencing results. A median of 92 million reads were generated for each sample and the coverage in the target region was above manufacturer’s suggested threshold of 150×. Sequence data were aligned to the human reference genome GRCh37 (http://0-www-ncbi-nlm-nih-gov.brum.beds.ac.uk/projects/genome/assembly/grc/human/index.shtml) using the Burrows-Wheeler Aligner with default parameters [42]. Both population- and cancer-specific variants were intersected with GENCODE, dbNSFP, ICGC-PCAWG, COSMIC, 1000Genomes, ClinVar, CancerMine, OncoScore, CIViC, and CBMDB databases to assess the clinical significance of the found mutations. Variants were filtered with unmatched normal datasets and removed if the global minor allele frequency was <1%. The prioritization of variants was done according to a four-tiered structure, adopting the joint consensus recommendation by AMP/ACMG [43]. Variants of strong clinical significance in cancer were defined considering items with the strongest evidence levels in the database for (i) clinical interpretations of variants in cancer (CIViC, civicdb.org), and (ii) Cancer Biomarkers (cancergenomeinterpreter.org/biomarkers). Results about variants shared between PTs and metastatic tumors (MTs) are shown with ID according to ClinVar; however, variants were also manually curated to exclude residual false positives. The scenario in which interpretation for the clinical consequence of a variant was “benign”, but the review status quality was scored <2/4 or reporting conflicting results, was defined as “probably benign”. The TP53 p.Pro72Arg variant was reported in this study as potentially relevant for CRC. In fact, while the codon 72 SNPs have limited impact on cancer risk for WT P53, many different research groups showed independently that this SNP markedly influences the activity of tumor-derived mutant forms of p53 (TP53) both in vitro and in vivo [44,45,46,47,48,49]. Complete mutational results can be accessed upon a signed justified request sent to [email protected].
The genetic sharing was indicated as the percent of mutational concordance in matched PTs and derivative MTs in all coding variations. Venn Diagrams were depicted in order to plot intersections among genetic results in selected subgroups, and Phenolyzer was used to evidence relevance and relationships between any “seed” genetic variants and “secondary” ones.
Phenolyzer is a computational tool that prioritizes genes on the basis on updated existing knowledge (protein–protein interactions, sharing of biological pathways or gene family, gene–gene transcriptional regulation, etc.). It integrates OMIM, Orphanet, ClinVar, Gene Reviews and GWAS Catalog as gene-disease databases. However, for a complete methodology description see Yang et al. [50]. Results are expressed through a score system and a network visualization tool that integrates gene-gene and gene-cancer relationships providing readers with a panoramic view of the interactional context.
The Disease-Free Interval (DFI) was measured in months and it represented the time elapsed from the surgical removal of PTs to the occurrence of poly-metastatic disease.
Densities of T-cell subsets were expressed as cells/mm2 and results represented with the arithmetic averages +2 standard deviations (SD). Cells were also manually counted by two Pathologists six times each. Independent sample t-test was applied to compare means of TMB and T-cell densities between group A and group B assuming samples’ independence. The hypothesis tested was that the difference between the means of groups A and B were equal to 0 (null hypothesis). With a two-tailed probability (p) value less than 0.05, the conclusion was that the two means do indeed differ significantly.

5. Conclusions

A speculative and hypothesis-generating model, integrated with host/tumor immunologic interaction, about the divergence between om- and pmCRC is reported in Figure S3. Specific progressive oncogenic mutations could represent an evolutionary gain for primary tumors allowing them to develop and to spread towards to new organs. These mutations could represent the boundary line between om- and pm-CRC.
Our findings could open new scenarios on both diagnostic and therapeutic point of views. In fact, we have defined the molecular and genetic bases to define the “true” omCRC setting and planning adjuvant treatments only when the disease shows progressive mutational evolution. Moreover, new studies are needed to understand the molecular bases of the evolution of metastatic clones and its interaction with microenvironment (including immune system and vascular compartment). In fact, the data arising from the present manuscript suggest that a negative immunologic selection of clones with poly-metastatic potential, rather than a spontaneous genetic regression, could account for the clinical oligo-metastatic behavior. Based on these, we are now working to identify these tumor reactive clones in long-surviving patients. The present results suggest also the design of novel strategies for the triggering of regressive trajectories in cancer cells based on the use of adoptive cellular immunotherapy or transcriptional and post-transcriptional gene engineering.

Supplementary Materials

The following are available online at https://0-www-mdpi-com.brum.beds.ac.uk/2072-6694/12/10/3073/s1, Figure S1: Inclusion and exclusion criteria flow-chart for patients’ selection, Figure S2: Clinical courses of group A and group B patients, Figure S3: Representative model showing divergent mutational and immunologic dynamics between oligo- and poly-metastatic colorectal cancer; Table S1: List of genes mutations gained by liver metastases (all coding variants), Table S2: Results of studies reporting mutational evolution of matched primary/secondary lesions in poly-metastatic CRC.

Author Contributions

Conceptualization, A.O., A.D.M. and M.C.; methodology, A.O., G.S., L.C.; software, G.S., L.D.; validation, G.B., A.B. and G.S.; formal analysis, A.O., G.N. and F.P.; investigation, J.G., F.H., L.C., F.T., A.D.M., F.I., V.G., A.L. (Amalia Luce); resources, G.N.; data curation, A.O.; writing—original draft preparation, A.O.; writing—review and editing, F.P., A.L. (Angela Lombardi), S.S. and M.S.; visualization, P.D.; supervision, G.N. All authors have read and agreed to the published version of the manuscript.

Funding

This work was funded by Antonietta Nacca.

Acknowledgments

We acknowledge the LILT (Lega Italiana per la Lotta contro i Tumori—sezione di Napoli) for the precious collaboration.

Conflicts of Interest

The authors declare no conflict of interest.

References

  1. Ferlay, J.; Colombet, M.; Soerjomataram, I.; Mathers, C.; Parkin, D.; Piñeros, M.; Znaor, A.; Bray, F. Estimating the global cancer incidence and mortality in 2018: GLOBOCAN sources and methods. Int. J. Cancer 2019, 144, 1941–1953. [Google Scholar] [CrossRef] [PubMed] [Green Version]
  2. Lu, L.; Xie, R.; Wei, R.; Cai, C.; Bi, D.; Yin, D.; Liu, H.; Zheng, J.; Zhang, Y.; Song, F.; et al. Integrin α5 subunit is required for the tumor supportive role of fibroblasts in colorectal adenocarcinoma and serves as a potential stroma prognostic marker. Mol. Oncol. 2019, 13, 2697–2714. [Google Scholar] [CrossRef] [PubMed]
  3. Steinmann, S.; Kunze, P.; Hampel, C.; Eckstein, M.; Bramsen, J.B.; Muenzner, J.K.; Carlé, B.; Ndreshkjana, B.; Kemenes, S.; Gasparini, P.; et al. DAPK1 loss triggers tumor invasion in colorectal tumor cells. Cell Death Dis. 2019, 10, 895. [Google Scholar] [CrossRef] [PubMed]
  4. Shen, Z.; Feng, X.; Fang, Y.; Li, Y.; Li, Z.; Zhan, Y.; Li, M.; Li, G.; Ding, Y.; Deng, H. POTEE drives colorectal cancer development via regulating SPHK1/p65 signaling. Cell Death Dis. 2019, 10, 863. [Google Scholar] [CrossRef] [PubMed] [Green Version]
  5. Nordgaard, C.; Doll, S.; Matos, A.L.D.S.A.; Høeberg, M.; Kazi, J.U.; Friis, S.; Stenvang, J.; Rönnstrand, L.; Mann, M.; Moreira, J.M.A. inhibitor 1 (TIMP-1) promotes receptor tyrosine kinase c-Kit signaling in colorectal cancer. Mol. Oncol. 2019, 13, 2646–2662. [Google Scholar] [CrossRef] [PubMed]
  6. DiPrima, M.; Wang, D.; Tröster, A.; Maric, A.; Terrades-Garcia, N.; Ha, T.; Kwak, H.; Sánchez-Martín, D.; Kudlinzki, D.; Schwalbe, H.; et al. Identification of Eph receptor signaling as a regulator of autophagy and a therapeutic target in colorectal carcinoma. Mol. Oncol. 2019, 13, 2441–2459. [Google Scholar] [CrossRef]
  7. Vatandoust, S.; Price, T.J.; Karapetis, C.S. Colorectal cancer: Metastases to a single organ. World J. Gastroenterol. 2015, 21, 11767–11776. [Google Scholar] [CrossRef]
  8. Chan, H.T.; Nagayama, S.; Chin, Y.M.; Otaki, M.; Hayashi, R.; Kiyotani, K.; Fukunaga, Y.; Ueno, M.; Nakamura, Y.; Low, S.-K. Clinical significance of clonal hematopoiesis in the interpretation of blood liquid biopsy. Mol. Oncol. 2020, 14, 1719–1730. [Google Scholar] [CrossRef]
  9. Rusthoven, K.E.; Kavanagh, B.D.; Burri, S.H.; Chen, C.; Cardenes, H.; Chidel, M.A.; Pugh, T.J.; Kane, M.; Gaspar, L.E.; Schefter, T.E. Multi -Institutional Phase I/II Trial of Stereotactic Body Radiation Therapy for Lung Metastases. J. Clin. Oncol. 2009, 27, 1579–1584. [Google Scholar] [CrossRef]
  10. Hellman, S.; Weichselbaum, R.R. Oligometastases. J. Clin. Oncol. 1995, 13, 8–10. [Google Scholar] [CrossRef]
  11. Niibe, Y.; Chang, J.Y.; Onishi, H.; Salama, J.; Hiraki, T.; Yamashita, H. Oligometastases/oligo-recurrence of lung cancer. J. Clin. Oncol. 2014, 13, 8–10. [Google Scholar] [CrossRef] [PubMed] [Green Version]
  12. Withers, H.R.; Lee, S.P. Modeling growth kinetics and statistical distribution of oligometastases. Semin. Radiat. Oncol. 2016, 16, 111–119. [Google Scholar] [CrossRef] [PubMed]
  13. Lussier, Y.A.; Khodarev, N.N.; Regan, K.; Corbin, K.; Li, H.; Ganai, S.; Khan, S.A.; Gnerlich, J.; Darga, T.E.; Fan, H.; et al. Oligo -and polymetastatic progression in lungmetastasis(es) patients is associated with specific MicroRNAs. PLoS ONE 2012, 7, e50141. [Google Scholar] [CrossRef] [PubMed] [Green Version]
  14. Bastos, P.; Gomes, T.; Ribeiro, L. Catechol-O-Methyltransferase (COMT): An Updateon Its Role in Cancer, Neurological and Cardiovascular Diseases. Rev. Physiol. Biochem. Pharmacol. 2017, 173, 1–39. [Google Scholar] [PubMed]
  15. Balzan, S.; Lubrano, V. LOX-1 receptor: A potential link in atherosclerosis and cancer. Life Sci. 2018, 198, 79–86. [Google Scholar] [CrossRef]
  16. Ouyang, L.; Zhang, K.; Chen, J.; Wang, J.; Huang, H. Roles of platelet derived growth factor in vascular calcification. J. Cell. Physiol. 2018, 233, 2804–2814. [Google Scholar] [CrossRef]
  17. Ottaiano, A.; De Divitiis, C.; Capozzi, M.; Guetz, G.D.; Pisano, C.; Pignata, S.; Tafuto, S. Obesity and Cancer: Biological Links and Treatment Implications. Curr. Cancer Drug Targets 2018, 18, 231–238. [Google Scholar] [CrossRef]
  18. Nechama, M.; Kwon, J.; Wei, S.; Kyi, A.T.; Welner, R.S.; Ben-Dov, I.Z. The IL-33-PIN1-IRAK-M axis is critical for type 2 immunity inIL-33-induced allergic airway inflammation. Nat. Commun. 2018, 9, 1603. [Google Scholar] [CrossRef] [Green Version]
  19. Marenholz, I.; Esparza-Gordillo, J.; Rüschendorf, F.; Bauerfeind, A.; Strachan, D.P.; Spycher, B.D.; Ege, M. Meta-analysis identifies seven susceptibility loci involved in the atopic march. Nat. Commun. 2015, 6, 8804. [Google Scholar] [CrossRef] [Green Version]
  20. Kozłowska, R.; Bożek, A.; Jarząb, J. Association between cancer and allergies. Allergy Asthma Clin. Immunol. 2016, 12, 39. [Google Scholar] [CrossRef] [Green Version]
  21. Chou, W.-Y.; Lai, P.-Y.; Hu, J.-M.; Hsu, C.-H.; Chen, Y.-C.; Tian, Y.-F.; You, S.-L.; Hsiao, C.-W.; Chou, Y.-C.; Sun, C.-A. Association between atopic dermatitis and colorectal cancer risk: A nationwide cohort study. Medicine (Baltimore) 2020, 99, e18530. [Google Scholar] [CrossRef] [PubMed]
  22. Allavena, P.; Garlanda, C.; Borrello, M.G.; Sica, A.; Mantovani, A. Pathways connecting inflammation and cancer. Curr. Opin. Genet. Dev. 2008, 18, 3–10. [Google Scholar] [CrossRef]
  23. Borrello, M.G.; Degl’Innocenti, D.; Pierotti, M.A. Inflammation and cancer: The oncogene-driven connection. Cancer Lett. 2008, 267, 262–270. [Google Scholar] [CrossRef] [PubMed]
  24. Marazzi, I.; Greenbaum, B.D.; Low, D.H.P.; Guccione, E. Chromatin dependencies in cancer and inflammation. Nat. Rev. Mol. Cell Biol. 2008, 19, 245–261. [Google Scholar] [CrossRef] [PubMed]
  25. Scala, S.; Circelli, L.; Lombardi, A.; Scala, S.; Martucci, N.; Galon, J.; Buonanno, M.; Scognamiglio, G.; Botti, G.; Hermitte, F.; et al. Genetic trajectory and immune microenvironment of lung-specific oligometastatic colorectal cancer. Cell Death Dis. 2020, 11, 275. [Google Scholar]
  26. Wang, Q.; Shi, Y.-L.; Zhou, K.; Wang, L.-L.; Yan, Z.-X.; Liu, Y.-L.; Xu, L.-L.; Zhao, S.-W.; Chu, H.-L.; Shi, T.-T.; et al. PIK3CA mutations confer resistance to first-line chemotherapy in colorectal cancer. Cell Death Dis. 2018, 9, 739. [Google Scholar] [CrossRef]
  27. Jang, S.; Hong, M.; Shin, M.K.; Kim, B.C.; Shin, H.-S.; Jang, S.J.; Hong, S.-M.; Kim, J.; Chun, S.-M.; Kim, T.-I.; et al. KRAS and PIK3CA mutations in colorectal adenocarcinomas correlate with aggressive histological features and behavior. Hum. Pathol. 2017, 65, 21–30. [Google Scholar] [CrossRef]
  28. Cancer Genome Atlas Network. Comprehensive molecular characterization of human colon and rectal cancer. Nature 2012, 487, 330–337. [Google Scholar] [CrossRef] [Green Version]
  29. Yang, H.; Salz, T.; Zajac-Kaye, M.; Liao, D.; Huang, S.; Qiu, Y. Overexpression of histone deacetylases in cancer cells is controlled by interplay of transcription factors and epigenetic modulators. FASEB J. 2014, 4, 4265–4279. [Google Scholar] [CrossRef] [Green Version]
  30. Iyer, N.G.; Ozdag, H. Caldas C p300/CBP and cancer. Oncogene 2004, 23, 4225–4231. [Google Scholar] [CrossRef] [Green Version]
  31. Bishop, D.T.; Demenais, F.; Iles, M.M.; Harland, M.; Taylor, J.C.; Corda, E.; Randerson-Moor, J.; Aitken, J.F.; Avril, M.-F.; Azizi, E.; et al. Genome-wide association study identifies three loci associated with melanoma risk. Nat. Genet. 2009, 8, 920–925. [Google Scholar] [CrossRef] [PubMed]
  32. Stevens, A.P.; Spangler, B.; Wallner, S.; Kreutz, M.; Dettmer, K.; Oefner, P.J.; Bosserhoff, A.-K. Direct and tumor microenvironment mediated influences of 5′-deoxy-5′-(methylthio)adenosine on tumor progression of malignant melanoma. J. Cell. Biochem. 2009, 106, 210–219. [Google Scholar] [CrossRef] [PubMed]
  33. Zhong, Y.; Lu, K.; Zhu, S.; Li, W.; Sun, S. Characterization of methylthioadenosin phosphorylase (MTAP) expression in colorectal cancer. Artif. Cells Nanomed. Biotechnol. 2018, 46, 2082–2087. [Google Scholar] [CrossRef] [PubMed] [Green Version]
  34. Snezhkina, A.V.; Krasnov, G.S.; Lipatova, A.V.; Sadritdinova, A.F.; Kardymon, O.L.; Fedorova, M.S.; Melnikova, N.V.; Stepanov, O.A.; Zaretsky, A.R.; Kaprin, A.D.; et al. The Dysregulation of Polyamine Metabolism in Colorectal Cancer Is Associated with Overexpression of c-Myc and C/EBPβ rather than Enterotoxigenic Bacteroides fragilis Infection. Oxid. Med. Cell Longev. 2016, 2016, 353560. [Google Scholar] [CrossRef] [Green Version]
  35. Ishaque, N.; Abba, M.L.; Hauser, C.; Patil, N.; Paramasivam, N.; Huebschmann, D.; Leupold, J.H.; Balasubramanian, G.P.; Kleinheinz, K.; Toprak, U.H.; et al. Whole genome sequencing puts forward hypotheses on metastasis evolution and therapy in colorectal cancer. Nat. Commun. 2018, 9, 4782. [Google Scholar] [CrossRef] [Green Version]
  36. Braxton, D.R.; Zhang, R.; Morrissette, J.D.; Aiza-Bonilla, A.L.; Furth, E.E. Clinicopathogenomic analysis of mismatch repair proficient colorectal adenocarcinoma uncovers novel prognostic subgroups with differing patterns of genetic evolution. Int. J. Cancer 2016, 139, 1546–1556. [Google Scholar] [CrossRef]
  37. Van Helden, E.J.; Angus, L.; van der Houven van Oordt, W.M.; Heideman, D.A.M.; Boon, E.; Van Es, S.C.; Radema, S.A.; Van Herpen, C.M.L.; De Groot, D.J.A.; De Vries, E.G.E.; et al. RAS and BRAF mutations in cell-free DNA are predictive for outcome of cetuximab monotherapy in patients with tissue-tested RAS wild-type advanced colorectal cancer. Mol. Oncol. 2019, 13, 2361–2374. [Google Scholar] [CrossRef] [Green Version]
  38. Elez, E.; Chianese, C.; Sanz-García, E.; Martinelli, E.; Noguerido, A.; Mancuso, F.M.; Caratù, G.; Matito, J.; Grasselli, J.; Cardone, C.; et al. Impact of circulating tumor DNA mutant allele fraction on prognosis in RAS-mutant metastatic colorectal cancer. Mol. Oncol. 2019, 13, 1827–1835. [Google Scholar] [CrossRef] [Green Version]
  39. Elez, E.; Chianese, C.; Sanz-García, E.; Martinelli, E.; Noguerido, A.; Mancuso, F.M.; Caratù, G.; Matito, J.; Grasselli, J.; Cardone, C.; et al. Analysis of 100,000 human cancer genomes reveals the landscape of tumor mutational burden. Genome Med. 2017, 9, 34. [Google Scholar]
  40. Cortes-Ciriano, I.; Lee, S.; Park, W.Y.; Kim, T.M.; Park, P.J. A molecular portrait of microsatellite instability across multiple cancers. Nat. Commun. 2017, 8, 15180. [Google Scholar] [CrossRef] [Green Version]
  41. Mazzaschi, G.; Madeddu, D.; Falco, A.; Bocchialini, G.; Goldoni, M.; Sogni, F.; Armani, G.; Lagrasta, C.A.; Lorusso, B.; Mangiaracina, C.; et al. Low PD-1 Expression in Cytotoxic CD8(+) Tumor-Infiltrating Lymphocytes Confers an Immune-Privileged Tissue Microenvironment in NSCLC with a Prognostic and Predictive Value. Clin. Cancer Res. 2018, 24, 407–419. [Google Scholar] [CrossRef] [PubMed] [Green Version]
  42. Pagès, F.; Mlecnik, B.; Marliot, F.; Bindea, G.; Ou, F.-S.; Bifulco, C.; Lugli, A.; Zlobec, I.; Rau, T.T.; Berger, M.D.; et al. International validation of the consensus Immunoscore for the classification of colon cancer: A prognostic and accuracy study. Lancet 2018, 391, 2128–2139. [Google Scholar] [CrossRef]
  43. Li, H.; Durbin, R. Fast and accurate short read alignment with Burrows-Wheeler transorfm. Bioinformatics 2009, 25, 1754–1760. [Google Scholar] [CrossRef] [PubMed] [Green Version]
  44. Li, M.M. Standards and Guidelines for the Interpretation and Reporting of Sequence Variants in Cancer: A Joint Consensus Recommendation of the Association for Molecular Pathology, American Society of Clinical Oncology, and College of American Pathologists. J. Mol. Diagn. 2017, 19, 4–23. [Google Scholar] [CrossRef] [Green Version]
  45. Dumont, P.; Leu, J.I.; Della Pietra, A.C.; George, D.L.; Murphy, M. The codon 72 polymorphic variants of p53 have markedly different apoptotic potential. Nat. Genet. 2003, 33, 357–365. [Google Scholar] [CrossRef]
  46. Jeong, B.S.; Hu, W.; Belyi, V.; Rabadan, R.; Levine, A.J. Differential levels of transcription of p53-regulated genes by the arginine/proline polymorphism: p53 with arginine at codon 72 favors apoptosis. FASEB J. 2010, 24, 1347–1353. [Google Scholar] [CrossRef]
  47. Bank, L. p53 polymorphic variants at codon 72 exert different effects on cell cycle progression. Int. J. Cancer 2004, 108, 196–199. [Google Scholar]
  48. Furihata, M.; Takeuchi, T.; Matsumoto, M.; Kurabayashi, A.; Ohtsuki, Y.; Terao, N.; Kuwahara, M.; Shuin, T. p53 mutation arising in Arg72 allele in the tumorigenesis and development of carcinoma of the urinary tract. Clin. Cancer Res. 2002, 8, 1192–1195. [Google Scholar]
  49. Basu, S.; Gnanapradeepan, K.; Barnoud, T.; Kung, C.-P.; Tavecchio, M.; Scott, J.; Watters, A.; Chen, Q.; Kossenkov, A.V.; Murphy, M.E. Mutant p53 controls tumor metabolism and metastasis by regulating PGC-1α. Genes Dev. 2018, 32, 230–243. [Google Scholar] [CrossRef]
  50. Yang, H.; Robinson, P.N.; Wang, K. Phenolyzer: Phenotype-based prioritization of candidate genes for human diseases. Nat. Methods 2015, 12, 841–843. [Google Scholar] [CrossRef]
Figure 1. Venn Diagrams with genetic concordance, tumor mutation burden (TMB) and microsatellite instability (MSI) status with percent variation of group A (PAT1, 2 and 3) and group B (PAT4, 5 and 6) patients. Mb: Mega-bas; MT: Metastatic Tumor; PAT: Patient; PT: Primary Tumor. Blue circles represent PT genes’ mutations versus red circles MT genes’ mutations.
Cancers 12 03073 g001
Figure 2. Mutational signatures (see Methods) in group A (PAT1, 2 and 3) and group B (PAT4, 5 and 6) patients. PAT: Patient. The upper panels refer to the primary tumors, the lower panels to the matched metastatic tumors.
Cancers 12 03073 g002
Figure 3. Venn Diagrams of variants shared by primary tumors and metastatic tumors according to group A (A) (PAT1, 2 and 3) and group B patients (C) (PAT4, 5 and 6). The circles blue refer to genes’ mutations’ of PAT1, the circle red of PAT2 and the circle green of PAT3. Phenolyzer genetic variants prioritization according to genes shared in group A patients (see Methods) (B). Only one gene (indicated by the discontinuous arrow is shared in group B and it is emphasized in on the right side (D).
Cancers 12 03073 g003
Figure 4. Representative immunohistochemistry of CD3, CD8, Foxp3 and GrzB+ cells (bar = 200 µm).
Cancers 12 03073 g004
Table 1. Clinico-pathological characteristics of the enrolled patients (I).
Patient IDYear of DiagnosisAgeGeBMI (Kg/m2)Histology, Pathologic Stage at Diagnosis *; Grading (G) in PT and MTTumor Side, and Type of SurgeryAd CTSites of Metastases PresentationTTM (m)
Group A
PAT12014 April76F19.5Adenocarcinoma, pT3pN1aM1a
pV0pR0; G2, G2
Left, combined left hemicolectomy and segment 3 pR0 metastasectomy.NoNoneNR
PAT22017 March60M19.8Adenocarcinoma, pT3pN0M1a
pV1pR0; G2, G3
Right, combined right hemicolectomy and segment 5 pR0 metastasectomy.CapoxNoneNR
PAT32017 January81M21.0Adenocarcinoma, pT2pN1bM1apV0pR0; G2, G3Left, combined left hemicolectomy and segment 6 pR0 metastasectomy.CapeNoneNR
Group B
PAT42014 October81M18.2Adenocarcinoma, pT3pN1bM1a
pV1pR0; G2, G3
Right, combined right hemicolectomy and segment 5 pR0 metastasectomy.CapeLiver, peritoneum6.0
PAT52018 March61F19.0Adenocarcinoma, pT2pN2bM1a
pV1pR0; G2, G2
Right, combined right hemicolectomy and segment 8 pR0 metastasectomy.CapoxLiver, lungs, peritoneum3.5
PAT62013 March27M18.9Adenocarcinoma, pT3pN1bM1a
pV1pR0; G2, G3
Left, combined left hemicolectomy and segment 8 pR0 metastasectomy.CapoxLiver7.5
Ad: Adjuvant; BMI: Body Mass Index; CAPOX: Capecitabine day 1 to 14 every 21 days, and Oxaliplatin day 1 every 21 days; Cape: Capecitabine day 1 to 14 every 21 days; Ge: gender; G: grading; m: months; MT: Metastatic Tumor; NR: Not Reached; pR0: no residual disease at microscopic examination after surgery; pV0/pV1: absence or presence of vascular invasion in tumor specimen; PAT: Patient; PT: Primary Tumor; TTM: Time-To-Metastatization. * according to AJCC (American Joint Committee on Cancer) 8th edition.
Table 2. Clinico-pathological characteristics of the enrolled patients (II).
Patient IDFirst-Line CTPFS1 (m)No. of Cycles; Duration of CT (Months)Second-Line CTPFS2 (m)No. of Cycles; Duration of CT (Months)Third-Line CTPFS3 (m)No. of Cycles; Duration of CT (m)Vital StatusSurvival Time from Diagnosis (m)
Group A
PAT1None0.00; 0.0None0.00; 0.0None0.00; 0.0AWDNR
PAT2None0.00; 0.0None0.00; 0.0None0.00; 0.0AWDNR
PAT3None0.00; 0.0None0.00; 0.0None0.00; 0.0AWDNR
Group B
PAT4FU/Beva11.020; 10.5Rego5.55; 5.0None0.00; 0.0D18.0
PAT5Folfox/Beva3.06; 3.0Folfiri2.04; 2.0None0.00; 0.0D5.5
PAT6Folfiri/Pani9.517; 9.0Folfox/Beva9.016; 8.0Folfiri Rech2.02; 4.0D21.0
AWD: Alive Without Disease; Beva: Bevacizumab day 1 every 14 days; D: dead; FU: FloroUracil; Folfiri: Fluorouracil plus Irinotecan day 1 every 14 days; Folfox: Fluouracil plus oxaliplatin day 1 every 14 days; NR: Not Reached; Pani: Panitumumab day 1 every 14 days; PAT: Patient; PFS: Progression-Free Survival; Rech: PT: Primary Tumor; Rechallenge.
Table 3. Summary of patient-by-patient CRC key driver mutated genes (Tier1/2/3 according to four-tiered structure of AMP/ACMG consensus).
GroupsPatientPT Mutated GenesMT Mutated Genes
Group APAT1APC (p.R554TER), TP53 (p.R273H, p.P72R*), BRCA2 (p.Y1655TER).APC (p.R554TER), TP53 (p.P72R, p.R273H), BRCA2 (p.Y1655TER).
PAT2APC (p.1450TER), TP53 (p.K382TER, p.P72R), KRAS (p.A146T), SMAD4 (p.R361H).APC (p.1450TER), TP53 (p.K382TER, p.P72R).
PAT3APC (p.S587TER), TP53 (p.V197E, p.V173A, p.P72R), KRAS (p.G13D), KRAS (p.G12D).APC (p.S587TER), TP53 (p.V197E, p.V173A, p.P72R), KRAS (p.G13D).
Group BPAT4APC (p.Q236TER), TP53 (p.C135F, p.P72R).APC (p.Q236TER), TP53 (p.C135F, p.P72R), KRAS (p.G12C), PIK3CA (p.E545K).
PAT5APC (p.R876TER, p.M1413TER), TP53 (p.R273H, p.P72R), NRAS (p.Q61K)APC (p.R876TER, p.M1413TER), TP53 (p.R273H, p.P72R), NRAS (p.Q61K), PIK3CA (p.M1043I), SMAD4 (p.Q256TER).
PAT6APC (p.H298TER, p.K581TER), TP53 (p.P72R).APC (p.H298TER, p.K581TER), TP53 (p.P72R), PIK3CA (p.R88Q), BRAF (p.P403L).
MT: Metastatic Tumor; PAT: Patient; PT: Primary Tumor. * See methods for TP53 p.P72R.
Table 4. Distribution of T-cell subsets densities (cells/mm2) in primary and metastatic tumors.
PatientsPrimary TumorsMetastatic Tumors
CD3+CD8+Foxp3GrzBCD3+CD8+Foxp3GrzB
TCIMTCIMTCIMTCIMTCIMTCIMTCIMTCIM
PAT1600 ± 15.52000 ± 21.250 ± 5.5150 ± 11.167 ± 5.440 ± 4.232 ± 2.745 ± 3.3200 ± 9.91500 ± 24.950 ± 2.3120 ± 8.720 ± 2.140 ± 3.674 ± 6.830 ± 2.2
PAT2589 ± 13.2305 ± 14.550 ± 10.6150 ± 12.248 ± 4.8.9 ± 0.830 ± 2.240 ± 3.2200 ± 11.6500 ± 21.470 ± 5.8100 ± 12.750 ± 5.145 ± 2.944 ± 3.325 ± 3.2
PAT3400 ± 9.5500 ± 23.280 ± 6.2200 ± 8.440 ± 3.340 ± 3.925 ± 2.130 ± 2.6530 ± 19.22015 ± 23.878 ± 6.8100 ± 8.810 ± 0.710 ± 1.458 ± 3.645 ± 4.8
PAT4800 ± 17.4500 ± 20.160 ± 5.4700 ± 22.555 ± 4.222 ± 4.122 ± 1.627 ± 1.9200 ± 12.12014 ± 20.7154 ± 10.2110 ± 11.610 ± 0.835 ± 2.633 ± 2.250 ± 3.7
PAT5820 ± 19.71500 ± 17.2600 ± 26.2500 ± 18.430 ± 3.320 ± 2.9120 ± 13.3110 ± 13.9130 ± 8.21610 ± 19.830 ± 2.860 ± 6.311 ± 0.715 ± 1.424 ± 2.635 ± 2.7
PAT62000 ± 23.41040 ± 16.1100 ± 7.4400 ± 12.330 ± 4.230 ± 3.325 ± 1.642 ± 2.9310 ± 12.13000 ± 20.7100 ± 10.3530 ± 21.628 ± 1.730 ± 2.626 ± 2.442 ± 3.3
Foxp3: forkhead box P3; GrzB: Granzyme B; IM: Invasive Margins; PAT: Patient; TC: Tumor Core.
Publisher’s Note: MDPI stays neutral with regard to jurisdictional claims in published maps and institutional affiliations.

