Modulation of Immune Infiltration of Ovarian Cancer Tumor Microenvironment by Specific Subpopulations of Fibroblasts

 , , , ,
Abstract
:Simple Summary
Abstract
1. Introduction
2. Results
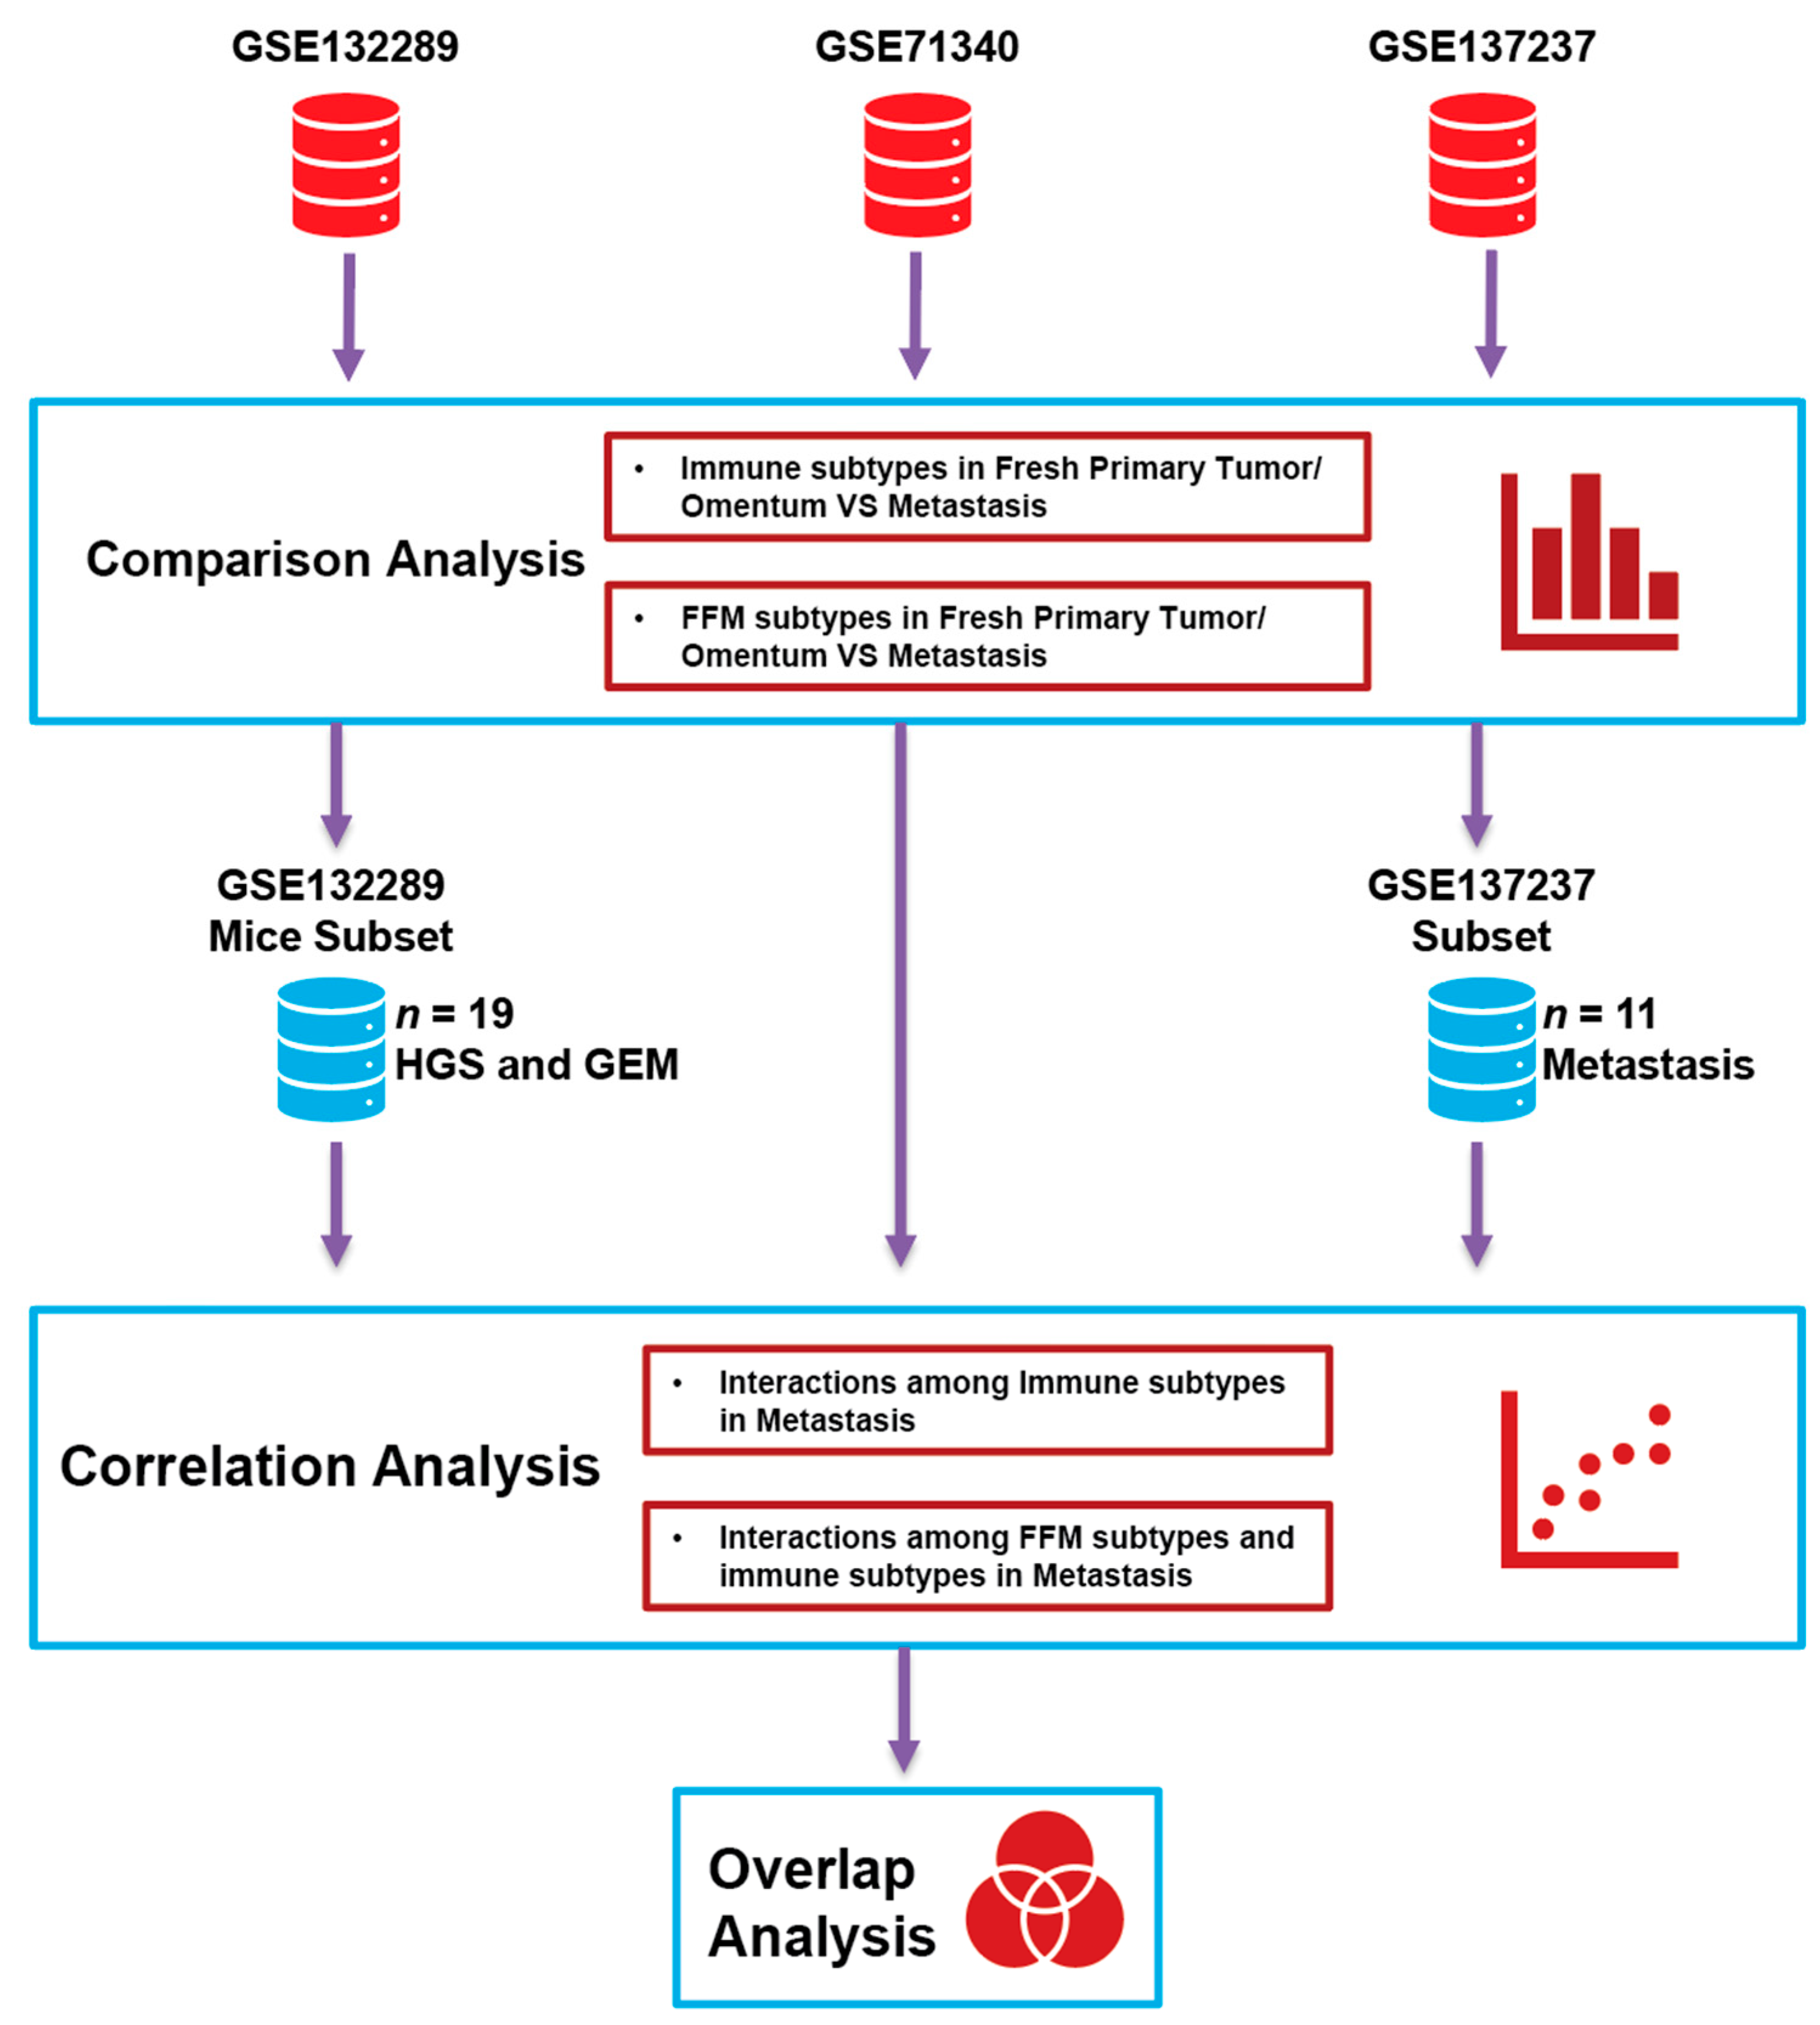
2.1. Study Design
2.2. Fibroblasts and Immune Profiles of OC Metastasis Compared with Matched Primary Tumors
2.3. Comparison of the Microenvironments of the Normal Omentum and Omental Metastasis
2.4. Immune Gene Signatures of OC Metastasis
3. Discussion
4. Materials and Methods
4.1. Data Analyzed in This Study
4.2. Quantification of Cell Types and Cell Type-Specific Functions
4.3. Differential Expression, Correlation and Pathway Enrichment Analysis
4.4. Single Cell RNA-Seq Analysis
5. Conclusions
Supplementary Materials
Author Contributions
Funding
Conflicts of Interest
References
- Siegel, R.L.; Miller, K.D.; Jemal, A. Cancer statistics, 2016. CA Cancer J. Clin. 2016, 66, 7–30. [Google Scholar] [CrossRef] [PubMed] [Green Version]
- Ozols, R.F.; Bookman, M.A.; Connolly, D.C.; Daly, M.B.; Godwin, A.K.; Schilder, R.J.; Xu, X.; Hamilton, T.C. Focus on epithelial ovarian cancer. Cancer Cell 2004, 5, 19–24. [Google Scholar] [CrossRef] [Green Version]
- Tchagang, A.B.; Tewfik, A.H.; DeRycke, M.S.; Skubitz, K.M.; Skubitz, A.P. Early detection of ovarian cancer using group biomarkers. Mol. Cancer 2008, 7, 27–37. [Google Scholar] [CrossRef] [PubMed] [Green Version]
- Schuler, S.; Ponnath, M.; Engel, J.; Ortmann, O. Ovarian epithelial tumors and reproductive factors: A systematic review. Arch. Gynecol. Obs. 2013, 287, 1187–1204. [Google Scholar] [CrossRef] [PubMed]
- Du Bois, A.; Reuss, A.; Pujade-Lauraine, E.; Harter, P.; Ray-Coquard, I.; Pfisterer, J. Role of surgical outcome as prognostic factor in advanced epithelial ovarian cancer: A combined exploratory analysis of 3 prospectively randomized phase 3 multicenter trials: By the Arbeitsgemeinschaft Gynaekologische Onkologie Studiengruppe Ovarialkarzinom (AGO-OVAR) and the Groupe d’Investigateurs Nationaux Pour les Etudes des Cancers de l’Ovaire (GINECO). Cancer 2009, 115, 1234–1244. [Google Scholar] [CrossRef]
- Vaddepally, R.K.; Kharel, P.; Pandey, R.; Garje, R.; Chandra, A.B. Review of Indications of FDA-Approved Immune Checkpoint Inhibitors per NCCN Guidelines with the Level of Evidence. Cancers (Basel) 2020, 12, 738. [Google Scholar] [CrossRef] [Green Version]
- Doo, D.W.; Norian, L.A.; Arend, R.C. Checkpoint inhibitors in ovarian cancer: A review of preclinical data. Gynecol. Oncol. Rep. 2019, 29, 48–54. [Google Scholar] [CrossRef]
- Arnold, K.M.; Opdenaker, L.M.; Flynn, D.; Sims-Mourtada, J. Wound healing and cancer stem cells: Inflammation as a driver of treatment resistance in breast cancer. Cancer Growth Metastasis 2015, 8, 1–13. [Google Scholar] [CrossRef] [Green Version]
- Stuelten, C.H.; Barbul, A.; Busch, J.I.; Sutton, E.; Katz, R.; Sato, M.; Wakefield, L.M.; Roberts, A.B.; Niederhuber, J.E. Acute wounds accelerate tumorigenesis by a T cell-dependent mechanism. Cancer Res. 2008, 68, 7278–7282. [Google Scholar] [CrossRef] [Green Version]
- Hobson, J.; Gummadidala, P.; Silverstrim, B.; Grier, D.; Bunn, J.; James, T.; Rincon, M. Acute inflammation induced by the biopsy of mouse mammary tumors promotes the development of metastasis. Breast Cancer Res. Treat. 2013, 139, 391–401. [Google Scholar] [CrossRef] [Green Version]
- Ruffell, B.; Affara, N.I.; Coussens, L.M. Differential macrophage programming in the tumor microenvironment. Trends Immunol. 2012, 33, 119–126. [Google Scholar] [CrossRef] [PubMed] [Green Version]
- Vannella, K.M.; Wynn, T.A. Mechanisms of Organ Injury and Repair by Macrophages. Annu. Rev. Physiol. 2017, 79, 593–617. [Google Scholar] [CrossRef] [PubMed]
- Varney, M.L.; Johansson, S.L.; Singh, R.K. Tumour-associated macrophage infiltration, neovascularization and aggressiveness in malignant melanoma: Role of monocyte chemotactic protein-1 and vascular endothelial growth factor-A. Melanoma Res. 2005, 15, 417–425. [Google Scholar] [CrossRef]
- Chen, R.; Alvero, A.B.; Silasi, D.A.; Steffensen, K.D.; Mor, G. Cancers take their Toll--the function and regulation of Toll-like receptors in cancer cells. Oncogene 2008, 27, 225–233. [Google Scholar] [CrossRef] [PubMed] [Green Version]
- Yang, L. TGFbeta and cancer metastasis: An inflammation link. Cancer Metastasis Rev. 2010, 29, 263–271. [Google Scholar] [CrossRef] [PubMed]
- Hanna, J.; Goldman-Wohl, D.; Hamani, Y.; Avraham, I.; Greenfield, C.; Natanson-Yaron, S.; Prus, D.; Cohen-Daniel, L.; Arnon, T.I.; Manaster, I.; et al. Decidual NK cells regulate key developmental processes at the human fetal-maternal interface. Nat. Med. 2006, 12, 1065–1074. [Google Scholar] [CrossRef]
- Noonan, D.M.; De Lerma Barbaro, A.; Vannini, N.; Mortara, L.; Albini, A. Inflammation, inflammatory cells and angiogenesis: Decisions and indecisions. Cancer Metastasis Rev. 2008, 27, 31–40. [Google Scholar] [CrossRef]
- Terabe, M.; Matsui, S.; Noben-Trauth, N.; Chen, H.; Watson, C.; Donaldson, D.D.; Carbone, D.P.; Paul, W.E.; Berzofsky, J.A. NKT cell-mediated repression of tumor immunosurveillance by IL-13 and the IL-4R-STAT6 pathway. Nat. Immunol. 2000, 1, 515–520. [Google Scholar] [CrossRef]
- Terabe, M.; Matsui, S.; Park, J.M.; Mamura, M.; Noben-Trauth, N.; Donaldson, D.D.; Chen, W.; Wahl, S.M.; Ledbetter, S.; Pratt, B.; et al. Transforming growth factor-beta production and myeloid cells are an effector mechanism through which CD1d-restricted T cells block cytotoxic T lymphocyte-mediated tumor immunosurveillance: Abrogation prevents tumor recurrence. J. Exp. Med. 2003, 198, 1741–1752. [Google Scholar] [CrossRef] [Green Version]
- Terabe, M.; Berzofsky, J.A. NKT cells in immunoregulation of tumor immunity: A new immunoregulatory axis. Trends Immunol. 2007, 28, 491–496. [Google Scholar] [CrossRef]
- Yang, F.; Wei, Y.; Cai, Z.; Yu, L.; Jiang, L.; Zhang, C.; Yan, H.; Wang, Q.; Cao, X.; Liang, T.; et al. Activated cytotoxic lymphocytes promote tumor progression by increasing the ability of 3LL tumor cells to mediate MDSC chemoattraction via Fas signaling. Cell Mol. Immunol. 2015, 12, 66–76. [Google Scholar] [CrossRef] [PubMed] [Green Version]
- Beck, A.H.; Espinosa, I.; Edris, B.; Li, R.; Montgomery, K.; Zhu, S.; Varma, S.; Marinelli, R.J.; van de Rijn, M.; West, R.B. The macrophage colony-stimulating factor 1 response signature in breast carcinoma. Clin. Cancer Res. 2009, 15, 778–787. [Google Scholar] [CrossRef] [PubMed] [Green Version]
- Bailey, C.; Negus, R.; Morris, A.; Ziprin, P.; Goldin, R.; Allavena, P.; Peck, D.; Darzi, A. Chemokine expression is associated with the accumulation of tumour associated macrophages (TAMs) and progression in human colorectal cancer. Clin. Exp. Metastasis 2007, 24, 121–130. [Google Scholar] [CrossRef]
- Kawamura, K.; Komohara, Y.; Takaishi, K.; Katabuchi, H.; Takeya, M. Detection of M2 macrophages and colony-stimulating factor 1 expression in serous and mucinous ovarian epithelial tumors. Pathol. Int. 2009, 59, 300–305. [Google Scholar] [CrossRef] [PubMed]
- Quaranta, V.; Schmid, M.C. Macrophage-Mediated Subversion of Anti-Tumour Immunity. Cells 2019, 8, 747. [Google Scholar] [CrossRef] [PubMed] [Green Version]
- Sahai, E.; Astsaturov, I.; Cukierman, E.; DeNardo, D.G.; Egeblad, M.; Evans, R.M.; Fearon, D.; Greten, F.R.; Hingorani, S.R.; Hunter, T.; et al. A framework for advancing our understanding of cancer-associated fibroblasts. Nat. Rev. Cancer 2020, 20, 174–186. [Google Scholar] [CrossRef] [PubMed] [Green Version]
- Mitra, A.K.; Zillhardt, M.; Hua, Y.; Tiwari, P.; Murmann, A.E.; Peter, M.E.; Lengyel, E. MicroRNAs reprogram normal fibroblasts into cancer-associated fibroblasts in ovarian cancer. Cancer Discov. 2012, 2, 1100–1108. [Google Scholar] [CrossRef] [Green Version]
- Kalluri, R. The biology and function of fibroblasts in cancer. Nat. Rev. Cancer 2016, 16, 582–598. [Google Scholar] [CrossRef]
- Kalluri, R. Basement membranes: Structure, assembly and role in tumour angiogenesis. Nat. Rev. Cancer 2003, 3, 422–433. [Google Scholar] [CrossRef]
- Quail, D.F.; Joyce, J.A. Microenvironmental regulation of tumor progression and metastasis. Nat. Med. 2013, 19, 1423–1437. [Google Scholar] [CrossRef]
- Hussain, A.; Voisin, V.; Poon, S.; Karamboulas, C.; Bui, N.H.B.; Meens, J.; Dmytryshyn, J.; Ho, V.W.; Tang, K.H.; Paterson, J.; et al. Distinct fibroblast functional states drive clinical outcomes in ovarian cancer and are regulated by TCF21. J. Exp. Med. 2020, 217. [Google Scholar] [CrossRef]
- Chen, X.; Song, E. Turning foes to friends: Targeting cancer-associated fibroblasts. Nat. Rev. Drug Discov. 2019, 18, 99–115. [Google Scholar] [CrossRef]
- Bu, L.; Baba, H.; Yoshida, N.; Miyake, K.; Yasuda, T.; Uchihara, T.; Tan, P.; Ishimoto, T. Biological heterogeneity and versatility of cancer-associated fibroblasts in the tumor microenvironment. Oncogene 2019, 38, 4887–4901. [Google Scholar] [CrossRef] [PubMed]
- Mace, T.A.; Ameen, Z.; Collins, A.; Wojcik, S.; Mair, M.; Young, G.S.; Fuchs, J.R.; Eubank, T.D.; Frankel, W.L.; Bekaii-Saab, T.; et al. Pancreatic cancer-associated stellate cells promote differentiation of myeloid-derived suppressor cells in a STAT3-dependent manner. Cancer Res. 2013, 73, 3007–3018. [Google Scholar] [CrossRef] [PubMed] [Green Version]
- Liao, D.; Luo, Y.; Markowitz, D.; Xiang, R.; Reisfeld, R.A. Cancer associated fibroblasts promote tumor growth and metastasis by modulating the tumor immune microenvironment in a 4T1 murine breast cancer model. PLoS ONE 2009, 4, e7965. [Google Scholar] [CrossRef] [PubMed] [Green Version]
- Dasari, S.; Fang, Y.; Mitra, A.K. Cancer Associated Fibroblasts: Naughty Neighbors That Drive Ovarian Cancer Progression. Cancers (Basel) 2018, 10, 406. [Google Scholar] [CrossRef] [Green Version]
- Liu, T.; Han, C.; Wang, S.; Fang, P.; Ma, Z.; Xu, L.; Yin, R. Cancer-associated fibroblasts: An emerging target of anti-cancer immunotherapy. J. Hematol. Oncol. 2019, 12, 86. [Google Scholar] [CrossRef]
- Yang, X.; Lin, Y.; Shi, Y.; Li, B.; Liu, W.; Yin, W.; Dang, Y.; Chu, Y.; Fan, J.; He, R. FAP Promotes Immunosuppression by Cancer-Associated Fibroblasts in the Tumor Microenvironment via STAT3-CCL2 Signaling. Cancer Res. 2016, 76, 4124–4135. [Google Scholar] [CrossRef] [Green Version]
- Ford, K.; Hanley, C.J.; Mellone, M.; Szyndralewiez, C.; Heitz, F.; Wiesel, P.; Wood, O.; Machado, M.; Lopez, M.A.; Ganesan, A.P.; et al. NOX4 Inhibition Potentiates Immunotherapy by Overcoming Cancer-Associated Fibroblast-Mediated CD8 T-cell Exclusion from Tumors. Cancer Res. 2020, 80, 1846–1860. [Google Scholar] [CrossRef] [Green Version]
- Feig, C.; Jones, J.O.; Kraman, M.; Wells, R.J.; Deonarine, A.; Chan, D.S.; Connell, C.M.; Roberts, E.W.; Zhao, Q.; Caballero, O.L.; et al. Targeting CXCL12 from FAP-expressing carcinoma-associated fibroblasts synergizes with anti-PD-L1 immunotherapy in pancreatic cancer. Proc. Natl. Acad. Sci. USA 2013, 110, 20212–20217. [Google Scholar] [CrossRef] [Green Version]
- Mitra, S.; Tiwari, K.; Podicheti, R.; Pandhiri, T.; Rusch, D.B.; Bonetto, A.; Zhang, C.; Mitra, A.K. Transcriptome Profiling Reveals Matrisome Alteration as a Key Feature of Ovarian Cancer Progression. Cancers (Basel) 2019, 11, 1513. [Google Scholar] [CrossRef] [Green Version]
- Pearce, O.M.T.; Delaine-Smith, R.M.; Maniati, E.; Nichols, S.; Wang, J.; Bohm, S.; Rajeeve, V.; Ullah, D.; Chakravarty, P.; Jones, R.R.; et al. Deconstruction of a Metastatic Tumor Microenvironment Reveals a Common Matrix Response in Human Cancers. Cancer Discov. 2018, 8, 304–319. [Google Scholar] [CrossRef] [Green Version]
- Maniati, E.; Berlato, C.; Gopinathan, G.; Heath, O.; Kotantaki, P.; Lakhani, A.; McDermott, J.; Pegrum, C.; Delaine-Smith, R.M.; Pearce, O.M.T.; et al. Mouse Ovarian Cancer Models Recapitulate the Human Tumor Microenvironment and Patient Response to Treatment. Cell Rep. 2020, 30, 525–540. [Google Scholar] [CrossRef] [Green Version]
- Chang, W.; Wan, C.; Lu, X.; Tu, S.-W.; Sun, Y.; Zhang, X.; Zang, Y.; Zhang, A.; Huang, K.; Liu, Y.; et al. ICTD: A semi-supervised cell type identification and deconvolution method for multi-omics data. bioRxiv. Available online: https://www.biorxiv.org/content/10.1101/426593v2 (accessed on 1 January 2020).
- Wang, C.; Armasu, S.M.; Kalli, K.R.; Maurer, M.J.; Heinzen, E.P.; Keeney, G.L.; Cliby, W.A.; Oberg, A.L.; Kaufmann, S.H.; Goode, E.L. Pooled Clustering of High-Grade Serous Ovarian Cancer Gene Expression Leads to Novel Consensus Subtypes Associated with Survival and Surgical Outcomes. Clin. Cancer Res. 2017, 23, 4077–4085. [Google Scholar] [CrossRef] [PubMed] [Green Version]
- Qian, J.; Olbrecht, S.; Boeckx, B.; Vos, H.; Laoui, D.; Etlioglu, E.; Wauters, E.; Pomella, V.; Verbandt, S.; Busschaert, P.; et al. A pan-cancer blueprint of the heterogeneous tumor microenvironment revealed by single-cell profiling. Cell Res. 2020, 30, 745–762. [Google Scholar] [CrossRef] [PubMed]
- Lee, S.; Zhao, L.; Rojas, C.; Bateman, N.W.; Yao, H.; Lara, O.D.; Celestino, J.; Morgan, M.B.; Nguyen, T.V.; Conrads, K.A.; et al. Molecular Analysis of Clinically Defined Subsets of High-Grade Serous Ovarian Cancer. Cell Rep. 2020, 31, 107502. [Google Scholar] [CrossRef] [PubMed]
- Hart, P.C.; Kenny, H.A.; Grassl, N.; Watters, K.M.; Litchfield, L.M.; Coscia, F.; Blazenovic, I.; Ploetzky, L.; Fiehn, O.; Mann, M.; et al. Mesothelial Cell HIF1alpha Expression Is Metabolically Downregulated by Metformin to Prevent Oncogenic Tumor-Stromal Crosstalk. Cell Rep. 2019, 29, 4086–4098. [Google Scholar] [CrossRef] [Green Version]
- Lau, T.S.; Chan, L.K.; Wong, E.C.; Hui, C.W.; Sneddon, K.; Cheung, T.H.; Yim, S.F.; Lee, J.H.; Yeung, C.S.; Chung, T.K.; et al. A loop of cancer-stroma-cancer interaction promotes peritoneal metastasis of ovarian cancer via TNFalpha-TGFalpha-EGFR. Oncogene 2017, 36, 3576–3587. [Google Scholar] [CrossRef]
- Perets, R.; Wyant, G.A.; Muto, K.W.; Bijron, J.G.; Poole, B.B.; Chin, K.T.; Chen, J.Y.; Ohman, A.W.; Stepule, C.D.; Kwak, S.; et al. Transformation of the fallopian tube secretory epithelium leads to high-grade serous ovarian cancer in Brca;Tp53;Pten models. Cancer Cell 2013, 24, 751–765. [Google Scholar] [CrossRef] [Green Version]
- Szabova, L.; Bupp, S.; Kamal, M.; Householder, D.B.; Hernandez, L.; Schlomer, J.J.; Baran, M.L.; Yi, M.; Stephens, R.M.; Annunziata, C.M.; et al. Pathway-specific engineered mouse allograft models functionally recapitulate human serous epithelial ovarian cancer. PLoS ONE 2014, 9, e95649. [Google Scholar] [CrossRef]
- Nieman, K.M.; Kenny, H.A.; Penicka, C.V.; Ladanyi, A.; Buell-Gutbrod, R.; Zillhardt, M.R.; Romero, I.L.; Carey, M.S.; Mills, G.B.; Hotamisligil, G.S.; et al. Adipocytes promote ovarian cancer metastasis and provide energy for rapid tumor growth. Nat. Med. 2011, 17, 1498–1503. [Google Scholar] [CrossRef] [Green Version]
- Curtis, M.; Kenny, H.A.; Ashcroft, B.; Mukherjee, A.; Johnson, A.; Zhang, Y.; Helou, Y.; Batlle, R.; Liu, X.; Gutierrez, N.; et al. Fibroblasts Mobilize Tumor Cell Glycogen to Promote Proliferation and Metastasis. Cell Metab. 2019, 29, 141–155. [Google Scholar] [CrossRef] [PubMed] [Green Version]
- Yang, Y. Cancer immunotherapy: Harnessing the immune system to battle cancer. J. Clin. Investig. 2015, 125, 3335–3337. [Google Scholar] [CrossRef] [Green Version]
- Stanczak, M.A.; Siddiqui, S.S.; Trefny, M.P.; Thommen, D.S.; Boligan, K.F.; von Gunten, S.; Tzankov, A.; Tietze, L.; Lardinois, D.; Heinzelmann-Schwarz, V.; et al. Self-associated molecular patterns mediate cancer immune evasion by engaging Siglecs on T cells. J. Clin. Investig. 2018, 128, 4912–4923. [Google Scholar] [CrossRef] [PubMed] [Green Version]
- Matulonis, U.A.; Shapira-Frommer, R.; Santin, A.D.; Lisyanskaya, A.S.; Pignata, S.; Vergote, I.; Raspagliesi, F.; Sonke, G.S.; Birrer, M.; Provencher, D.M.; et al. Antitumor activity and safety of pembrolizumab in patients with advanced recurrent ovarian cancer: Results from the phase II KEYNOTE-100 study. Ann. Oncol. 2019, 30, 1080–1087. [Google Scholar] [CrossRef]
- Kandalaft, L.E.; Odunsi, K.; Coukos, G. Immune Therapy Opportunities in Ovarian Cancer. Am. Soc. Clin. Oncol. Educ. Book 2020, 40, 1–13. [Google Scholar] [CrossRef]
- Havel, J.J.; Chowell, D.; Chan, T.A. The evolving landscape of biomarkers for checkpoint inhibitor immunotherapy. Nat. Rev. Cancer 2019, 19, 133–150. [Google Scholar] [CrossRef] [PubMed]
- Tesone, A.J.; Rutkowski, M.R.; Brencicova, E.; Svoronos, N.; Perales-Puchalt, A.; Stephen, T.L.; Allegrezza, M.J.; Payne, K.K.; Nguyen, J.M.; Wickramasinghe, J.; et al. Satb1 Overexpression Drives Tumor-Promoting Activities in Cancer-Associated Dendritic Cells. Cell Rep. 2016, 14, 1774–1786. [Google Scholar] [CrossRef] [Green Version]
- Obermajer, N.; Muthuswamy, R.; Lesnock, J.; Edwards, R.P.; Kalinski, P. Positive feedback between PGE2 and COX2 redirects the differentiation of human dendritic cells toward stable myeloid-derived suppressor cells. Blood 2011, 118, 5498–5505. [Google Scholar] [CrossRef]
- Deng, X.; Zhang, P.; Liang, T.; Deng, S.; Chen, X.; Zhu, L. Ovarian cancer stem cells induce the M2 polarization of macrophages through the PPARgamma and NF-kappaB pathways. Int. J. Mol. Med. 2015, 36, 449–454. [Google Scholar] [CrossRef] [Green Version]
- Sebastian, A.; Hum, N.R.; Martin, K.A.; Gilmore, S.F.; Peran, I.; Byers, S.W.; Wheeler, E.K.; Coleman, M.A.; Loots, G.G. Single-Cell Transcriptomic Analysis of Tumor-Derived Fibroblasts and Normal Tissue-Resident Fibroblasts Reveals Fibroblast Heterogeneity in Breast Cancer. Cancers (Basel) 2020, 12, 1307. [Google Scholar] [CrossRef]
- Kieffer, Y.; Hocine, H.R.; Gentric, G.; Pelon, F.; Bernard, C.; Bourachot, B.; Lameiras, S.; Albergante, L.; Bonneau, C.; Guyard, A.; et al. Single-cell analysis reveals fibroblast clusters linked to immunotherapy resistance in cancer. Cancer Discov. 2020, 10, 1330–1351. [Google Scholar] [CrossRef]
- Yamauchi, M.; Gibbons, D.L.; Zong, C.; Fradette, J.J.; Bota-Rabassedas, N.; Kurie, J.M. Fibroblast heterogeneity and its impact on extracellular matrix and immune landscape remodeling in cancer. Matrix Biol. 2020, 91–92, 8–18. [Google Scholar] [CrossRef]
- Barrett, R.; Pure, E. Cancer-associated fibroblasts: Key determinants of tumor immunity and immunotherapy. Curr. Opin. Immunol. 2020, 64, 80–87. [Google Scholar] [CrossRef] [PubMed]
- Diakos, C.I.; Charles, K.A.; McMillan, D.C.; Clarke, S.J. Cancer-related inflammation and treatment effectiveness. Lancet Oncol. 2014, 15, e493–e503. [Google Scholar] [CrossRef]
- Dangaj, D.; Bruand, M.; Grimm, A.J.; Ronet, C.; Barras, D.; Duttagupta, P.A.; Lanitis, E.; Duraiswamy, J.; Tanyi, J.L.; Benencia, F.; et al. Cooperation between Constitutive and Inducible Chemokines Enables T Cell Engraftment and Immune Attack in Solid Tumors. Cancer Cell 2019, 35, 885–900. [Google Scholar] [CrossRef]
- Balkwill, F.; Mantovani, A. Cancer and inflammation: Implications for pharmacology and therapeutics. Clin. Pharm. 2010, 87, 401–406. [Google Scholar] [CrossRef] [PubMed]
- Coussens, L.M.; Werb, Z. Inflammation and cancer. Nature 2002, 420, 860–867. [Google Scholar] [CrossRef] [PubMed]
- Hoesel, B.; Schmid, J.A. The complexity of NF-kappaB signaling in inflammation and cancer. Mol. Cancer 2013, 12, 86. [Google Scholar] [CrossRef] [Green Version]
- Lee, J.H.; Lee, G.T.; Woo, S.H.; Ha, Y.S.; Kwon, S.J.; Kim, W.J.; Kim, I.Y. BMP-6 in renal cell carcinoma promotes tumor proliferation through IL-10-dependent M2 polarization of tumor-associated macrophages. Cancer Res. 2013, 73, 3604–3614. [Google Scholar] [CrossRef] [PubMed] [Green Version]
- Zhao, C.C.; Jiao, Y.; Zhang, Y.Y.; Ning, J.; Zhang, Y.R.; Xu, J.; Wei, W.; Kang-Sheng, G. Lnc SMAD5-AS1 as ceRNA inhibit proliferation of diffuse large B cell lymphoma via Wnt/beta-catenin pathway by sponging miR-135b-5p to elevate expression of APC. Cell Death Dis. 2019, 10, 252. [Google Scholar] [CrossRef] [PubMed]
- Zhang, W.; Chen, L.; Wu, J.; Li, J.; Zhang, X.; Xiang, Y.; Li, F.; Wu, C.; Xiang, L.; Ran, Q.; et al. Long noncoding RNA TUG1 inhibits osteogenesis of bone marrow mesenchymal stem cells via Smad5 after irradiation. Theranostics 2019, 9, 2198–2208. [Google Scholar] [CrossRef]
- Veldhoen, M.; Hirota, K.; Westendorf, A.M.; Buer, J.; Dumoutier, L.; Renauld, J.C.; Stockinger, B. The aryl hydrocarbon receptor links TH17-cell-mediated autoimmunity to environmental toxins. Nature 2008, 453, 106–109. [Google Scholar] [CrossRef]
- Zhu, J.; Luo, L.; Tian, L.; Yin, S.; Ma, X.; Cheng, S.; Tang, W.; Yu, J.; Ma, W.; Zhou, X.; et al. Aryl Hydrocarbon Receptor Promotes IL-10 Expression in Inflammatory Macrophages Through Src-STAT3 Signaling Pathway. Front. Immunol. 2018, 9, 2033. [Google Scholar] [CrossRef] [Green Version]
- Thatcher, T.H.; Williams, M.A.; Phipps, R.P.; Sime, P.J. The Aryl Hydrocarbon Receptor (AhR) Is a Novel Regulator of Dendritic Cell Function: AhR-Deficient DCs Promote a Th2 Phenotype in Naive Wild-Type T Cells. Am. J. Respir. Crit. Care Med. 2009, 179, A6081. [Google Scholar] [CrossRef]
- Wagage, S.; John, B.; Krock, B.L.; Hall, A.O.; Randall, L.M.; Karp, C.L.; Simon, M.C.; Hunter, C.A. The aryl hydrocarbon receptor promotes IL-10 production by NK cells. J. Immunol. 2014, 192, 1661–1670. [Google Scholar] [CrossRef] [Green Version]
- Gabriely, G.; Wheeler, M.A.; Takenaka, M.C.; Quintana, F.J. Role of AHR and HIF-1alpha in Glioblastoma Metabolism. Trends Endocrinol. Metab. 2017, 28, 428–436. [Google Scholar] [CrossRef]
- Leone, R.D.; Emens, L.A. Targeting adenosine for cancer immunotherapy. J. Immunother. Cancer 2018, 6, 57. [Google Scholar] [CrossRef] [Green Version]
- Wang, Y.; Chu, J.; Yi, P.; Dong, W.; Saultz, J.; Wang, Y.; Wang, H.; Scoville, S.; Zhang, J.; Wu, L.C.; et al. SMAD4 promotes TGF-beta-independent NK cell homeostasis and maturation and antitumor immunity. J. Clin. Investig. 2018, 128, 5123–5136. [Google Scholar] [CrossRef] [Green Version]
- Oh, S.A.; Li, M.O. TGF-beta: Guardian of T cell function. J. Immunol. 2013, 191, 3973–3979. [Google Scholar] [CrossRef]
- Cancer Genome Atlas Research Network. Integrated genomic and molecular characterization of cervical cancer. Nature 2017, 543, 378–384. [Google Scholar] [CrossRef] [PubMed]
- Bollard, C.M.; Tripic, T.; Cruz, C.R.; Dotti, G.; Gottschalk, S.; Torrano, V.; Dakhova, O.; Carrum, G.; Ramos, C.A.; Liu, H.; et al. Tumor-Specific T-Cells Engineered to Overcome Tumor Immune Evasion Induce Clinical Responses in Patients With Relapsed Hodgkin Lymphoma. J. Clin. Oncol. 2018, 36, 1128–1139. [Google Scholar] [CrossRef]
- Zhang, S.Z.; Wang, Q.Q.; Yang, Q.Q.; Gu, H.Y.; Yin, Y.Q.; Li, Y.D.; Hou, J.C.; Chen, R.; Sun, Q.Q.; Sun, Y.F.; et al. NG2 glia regulate brain innate immunity via TGF-beta2/TGFBR2 axis. BMC Med. 2019, 17, 204. [Google Scholar] [CrossRef] [PubMed]
- Wang, Z.; Yang, Y.; Cui, Y.; Wang, C.; Lai, Z.; Li, Y.; Zhang, W.; Mustonen, H.; Puolakkainen, P.; Ye, Y.; et al. Tumor-associated macrophages regulate gastric cancer cell invasion and metastasis through TGFbeta2/NF-kappaB/Kindlin-2 axis. Chin. J. Cancer Res. 2020, 32, 72–88. [Google Scholar] [CrossRef]
- De Feo, D.; Merlini, A.; Brambilla, E.; Ottoboni, L.; Laterza, C.; Menon, R.; Srinivasan, S.; Farina, C.; Garcia Manteiga, J.M.; Butti, E.; et al. Neural precursor cell-secreted TGF-beta2 redirects inflammatory monocyte-derived cells in CNS autoimmunity. J. Clin. Investig. 2017, 127, 3937–3953. [Google Scholar] [CrossRef] [PubMed]
- Maheshwari, A.; Kelly, D.R.; Nicola, T.; Ambalavanan, N.; Jain, S.K.; Murphy-Ullrich, J.; Athar, M.; Shimamura, M.; Bhandari, V.; Aprahamian, C.; et al. TGF-beta2 suppresses macrophage cytokine production and mucosal inflammatory responses in the developing intestine. Gastroenterology 2011, 140, 242–253. [Google Scholar] [CrossRef] [Green Version]
- Okamura, T.; Sumitomo, S.; Morita, K.; Iwasaki, Y.; Inoue, M.; Nakachi, S.; Komai, T.; Shoda, H.; Miyazaki, J.; Fujio, K.; et al. TGF-beta3-expressing CD4+CD25(-)LAG3+ regulatory T cells control humoral immune responses. Nat. Commun. 2015, 6, 6329. [Google Scholar] [CrossRef]
- Lee, Y.; Awasthi, A.; Yosef, N.; Quintana, F.J.; Xiao, S.; Peters, A.; Wu, C.; Kleinewietfeld, M.; Kunder, S.; Hafler, D.A.; et al. Induction and molecular signature of pathogenic TH17 cells. Nat. Immunol. 2012, 13, 991–999. [Google Scholar] [CrossRef] [Green Version]
- Schmidt, A.; Oberle, N.; Krammer, P.H. Molecular mechanisms of treg-mediated T cell suppression. Front. Immunol. 2012, 3, 51. [Google Scholar] [CrossRef] [Green Version]
- Groves, C.J.; Carrell, J.; Grady, R.; Rajan, B.; Morehouse, C.A.; Halpin, R.; Wang, J.; Wu, J.; Shrestha, Y.; Rayanki, R.; et al. CD19-positive antibody-secreting cells provide immune memory. Blood Adv. 2018, 2, 3163–3176. [Google Scholar] [CrossRef] [PubMed] [Green Version]
- Buchan, S.L.; Rogel, A.; Al-Shamkhani, A. The immunobiology of CD27 and OX40 and their potential as targets for cancer immunotherapy. Blood 2018, 131, 39–48. [Google Scholar] [CrossRef] [PubMed] [Green Version]
- De Rie, M.A.; Schumacher, T.N.; van Schijndel, G.M.; van Lier, R.A.; Miedema, F. Regulatory role of CD19 molecules in B-cell activation and differentiation. Cell Immunol. 1989, 118, 368–381. [Google Scholar] [CrossRef]
- Inaoki, M.; Sato, S.; Weintraub, B.C.; Goodnow, C.C.; Tedder, T.F. CD19-regulated signaling thresholds control peripheral tolerance and autoantibody production in B lymphocytes. J. Exp. Med. 1997, 186, 1923–1931. [Google Scholar] [CrossRef] [Green Version]
- Davis, M.R.; Zhu, Z.; Hansen, D.M.; Bai, Q.; Fang, Y. The role of IL-21 in immunity and cancer. Cancer Lett. 2015, 358, 107–114. [Google Scholar] [CrossRef]
- Sugiura, D.; Maruhashi, T.; Okazaki, I.M.; Shimizu, K.; Maeda, T.K.; Takemoto, T.; Okazaki, T. Restriction of PD-1 function by cis-PD-L1/CD80 interactions is required for optimal T cell responses. Science 2019, 364, 558–566. [Google Scholar] [CrossRef]
- Pinto, M.L.; Rios, E.; Duraes, C.; Ribeiro, R.; Machado, J.C.; Mantovani, A.; Barbosa, M.A.; Carneiro, F.; Oliveira, M.J. The Two Faces of Tumor-Associated Macrophages and Their Clinical Significance in Colorectal Cancer. Front. Immunol. 2019, 10, 1875. [Google Scholar] [CrossRef] [Green Version]
- Yang, R.; Cai, Z.; Zhang, Y.; Yutzy, W.H.t.; Roby, K.F.; Roden, R.B. CD80 in immune suppression by mouse ovarian carcinoma-associated Gr-1+CD11b+ myeloid cells. Cancer Res. 2006, 66, 6807–6815. [Google Scholar] [CrossRef] [Green Version]
- Robado de Lope, L.; Alcibar, O.L.; Amor Lopez, A.; Hergueta-Redondo, M.; Peinado, H. Tumour-adipose tissue crosstalk: Fuelling tumour metastasis by extracellular vesicles. Philos. Trans. R. Soc. Lond. B Biol. Sci. 2018, 373. [Google Scholar] [CrossRef]
- Hansen, J.M.; Coleman, R.L.; Sood, A.K. Targeting the tumour microenvironment in ovarian cancer. Eur. J. Cancer 2016, 56, 131–143. [Google Scholar] [CrossRef] [Green Version]
- Tang, S.; Xiang, T.; Huang, S.; Zhou, J.; Wang, Z.; Xie, R.; Long, H.; Zhu, B. Ovarian cancer stem-like cells differentiate into endothelial cells and participate in tumor angiogenesis through autocrine CCL5 signaling. Cancer Lett. 2016, 376, 137–147. [Google Scholar] [CrossRef] [PubMed]
- Tokunaga, R.; Naseem, M.; Lo, J.H.; Battaglin, F.; Soni, S.; Puccini, A.; Berger, M.D.; Zhang, W.; Baba, H.; Lenz, H.J. B cell and B cell-related pathways for novel cancer treatments. Cancer Treat. Rev. 2019, 73, 10–19. [Google Scholar] [CrossRef]


Publisher’s Note: MDPI stays neutral with regard to jurisdictional claims in published maps and institutional affiliations. |
© 2020 by the authors. Licensee MDPI, Basel, Switzerland. This article is an open access article distributed under the terms and conditions of the Creative Commons Attribution (CC BY) license (http://creativecommons.org/licenses/by/4.0/).
Share and Cite
Wang, J.; Cheng, F.H.C.; Tedrow, J.; Chang, W.; Zhang, C.; Mitra, A.K. Modulation of Immune Infiltration of Ovarian Cancer Tumor Microenvironment by Specific Subpopulations of Fibroblasts. Cancers 2020, 12, 3184. https://0-doi-org.brum.beds.ac.uk/10.3390/cancers12113184
Wang J, Cheng FHC, Tedrow J, Chang W, Zhang C, Mitra AK. Modulation of Immune Infiltration of Ovarian Cancer Tumor Microenvironment by Specific Subpopulations of Fibroblasts. Cancers. 2020; 12(11):3184. https://0-doi-org.brum.beds.ac.uk/10.3390/cancers12113184
Chicago/Turabian StyleWang, Ji, Frank H. C. Cheng, Jessica Tedrow, Wennan Chang, Chi Zhang, and Anirban K. Mitra. 2020. "Modulation of Immune Infiltration of Ovarian Cancer Tumor Microenvironment by Specific Subpopulations of Fibroblasts" Cancers 12, no. 11: 3184. https://0-doi-org.brum.beds.ac.uk/10.3390/cancers12113184