EGFR and αvβ6 as Promising Targets for Molecular Imaging of Cutaneous and Mucosal Squamous Cell Carcinoma of the Head and Neck Region

 , , and
Abstract
: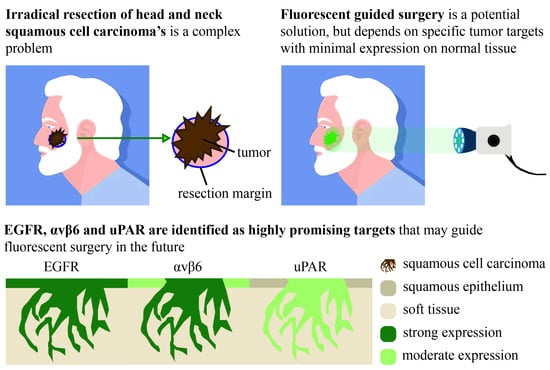
1. Introduction
2. Results
2.1. Patient Characteristics
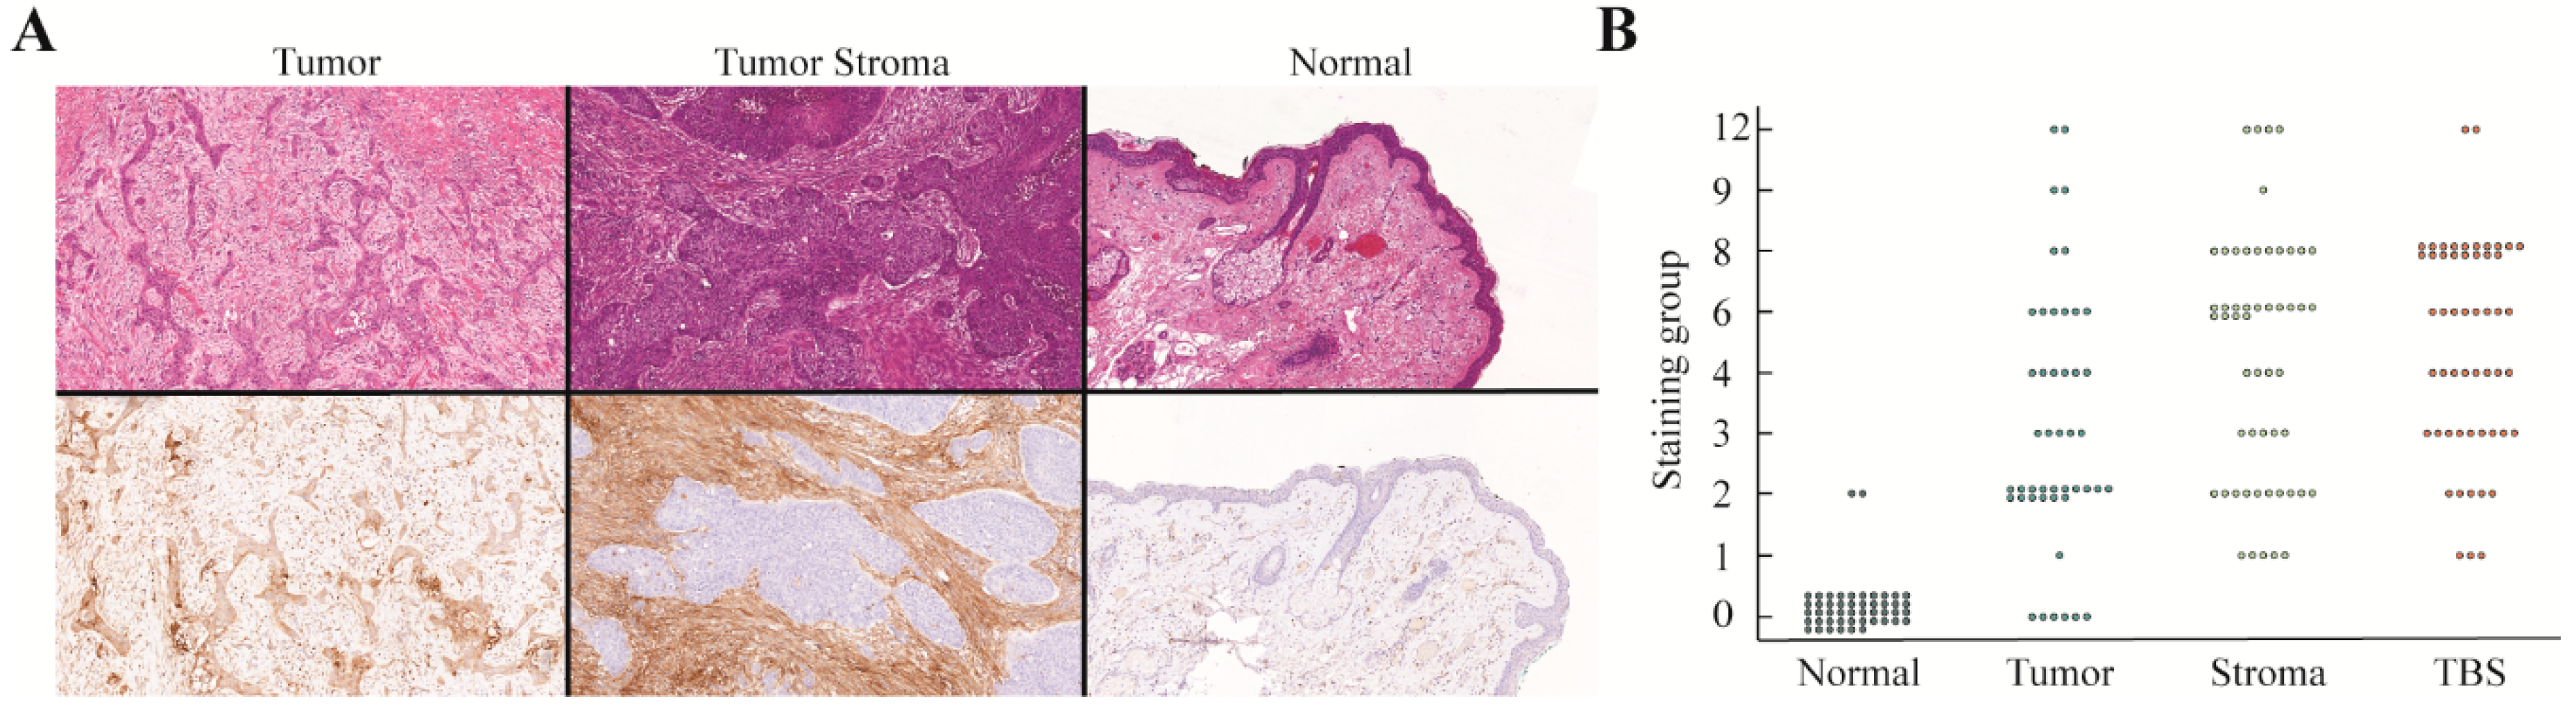
2.2. Immunohistochemical Stainings
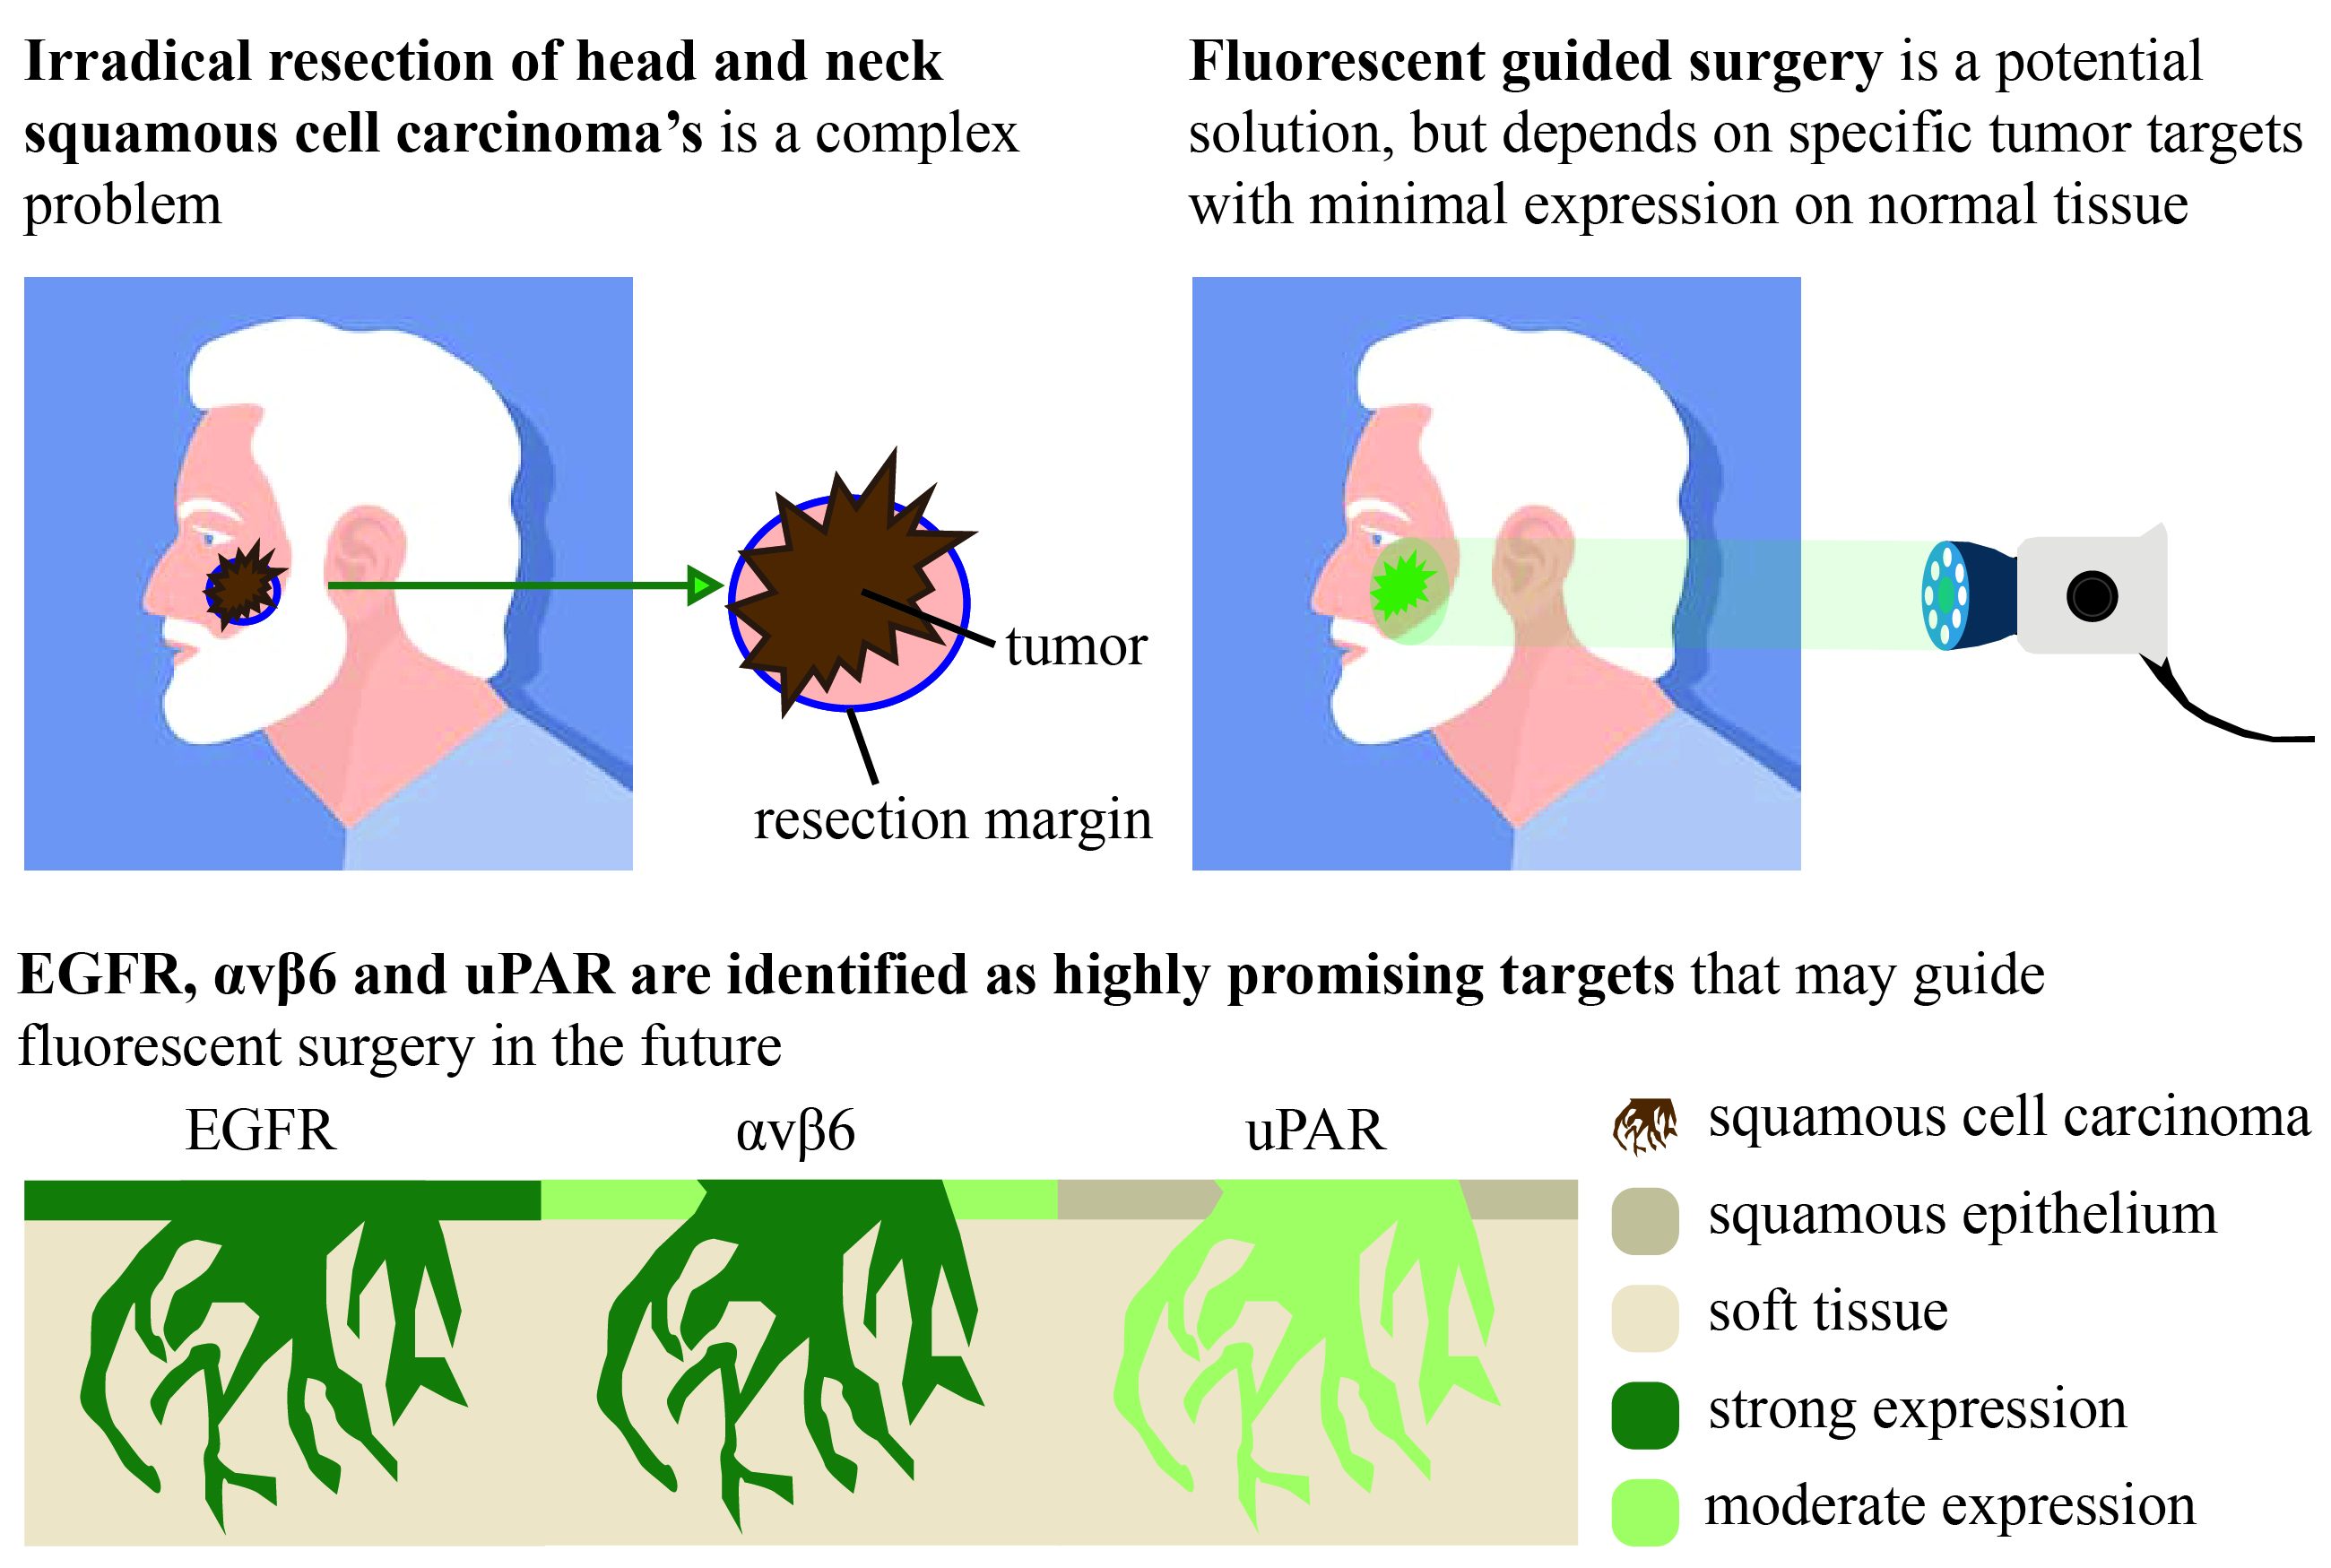
2.2.1. EGFR
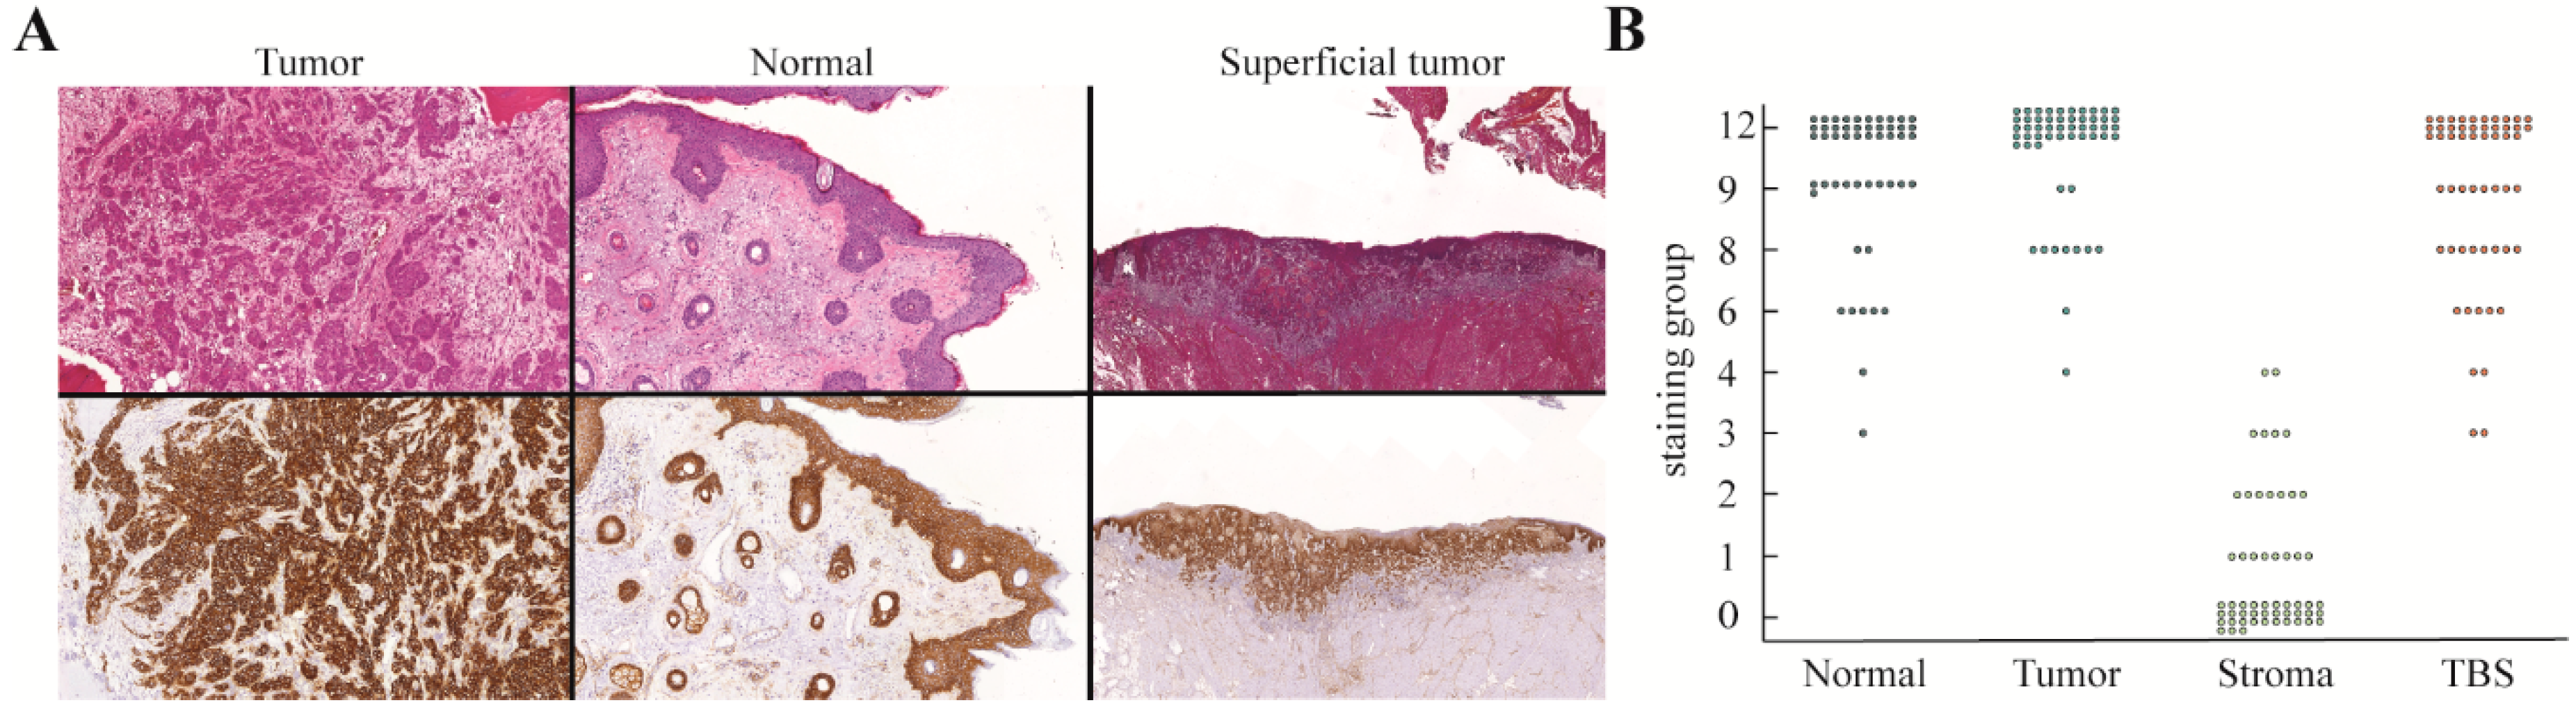
2.2.2. αvβ6 Integrin
2.2.3. uPAR
2.2.4. VEGF-A
2.2.5. β3 Integrin
2.2.6. EpCAM and CEA
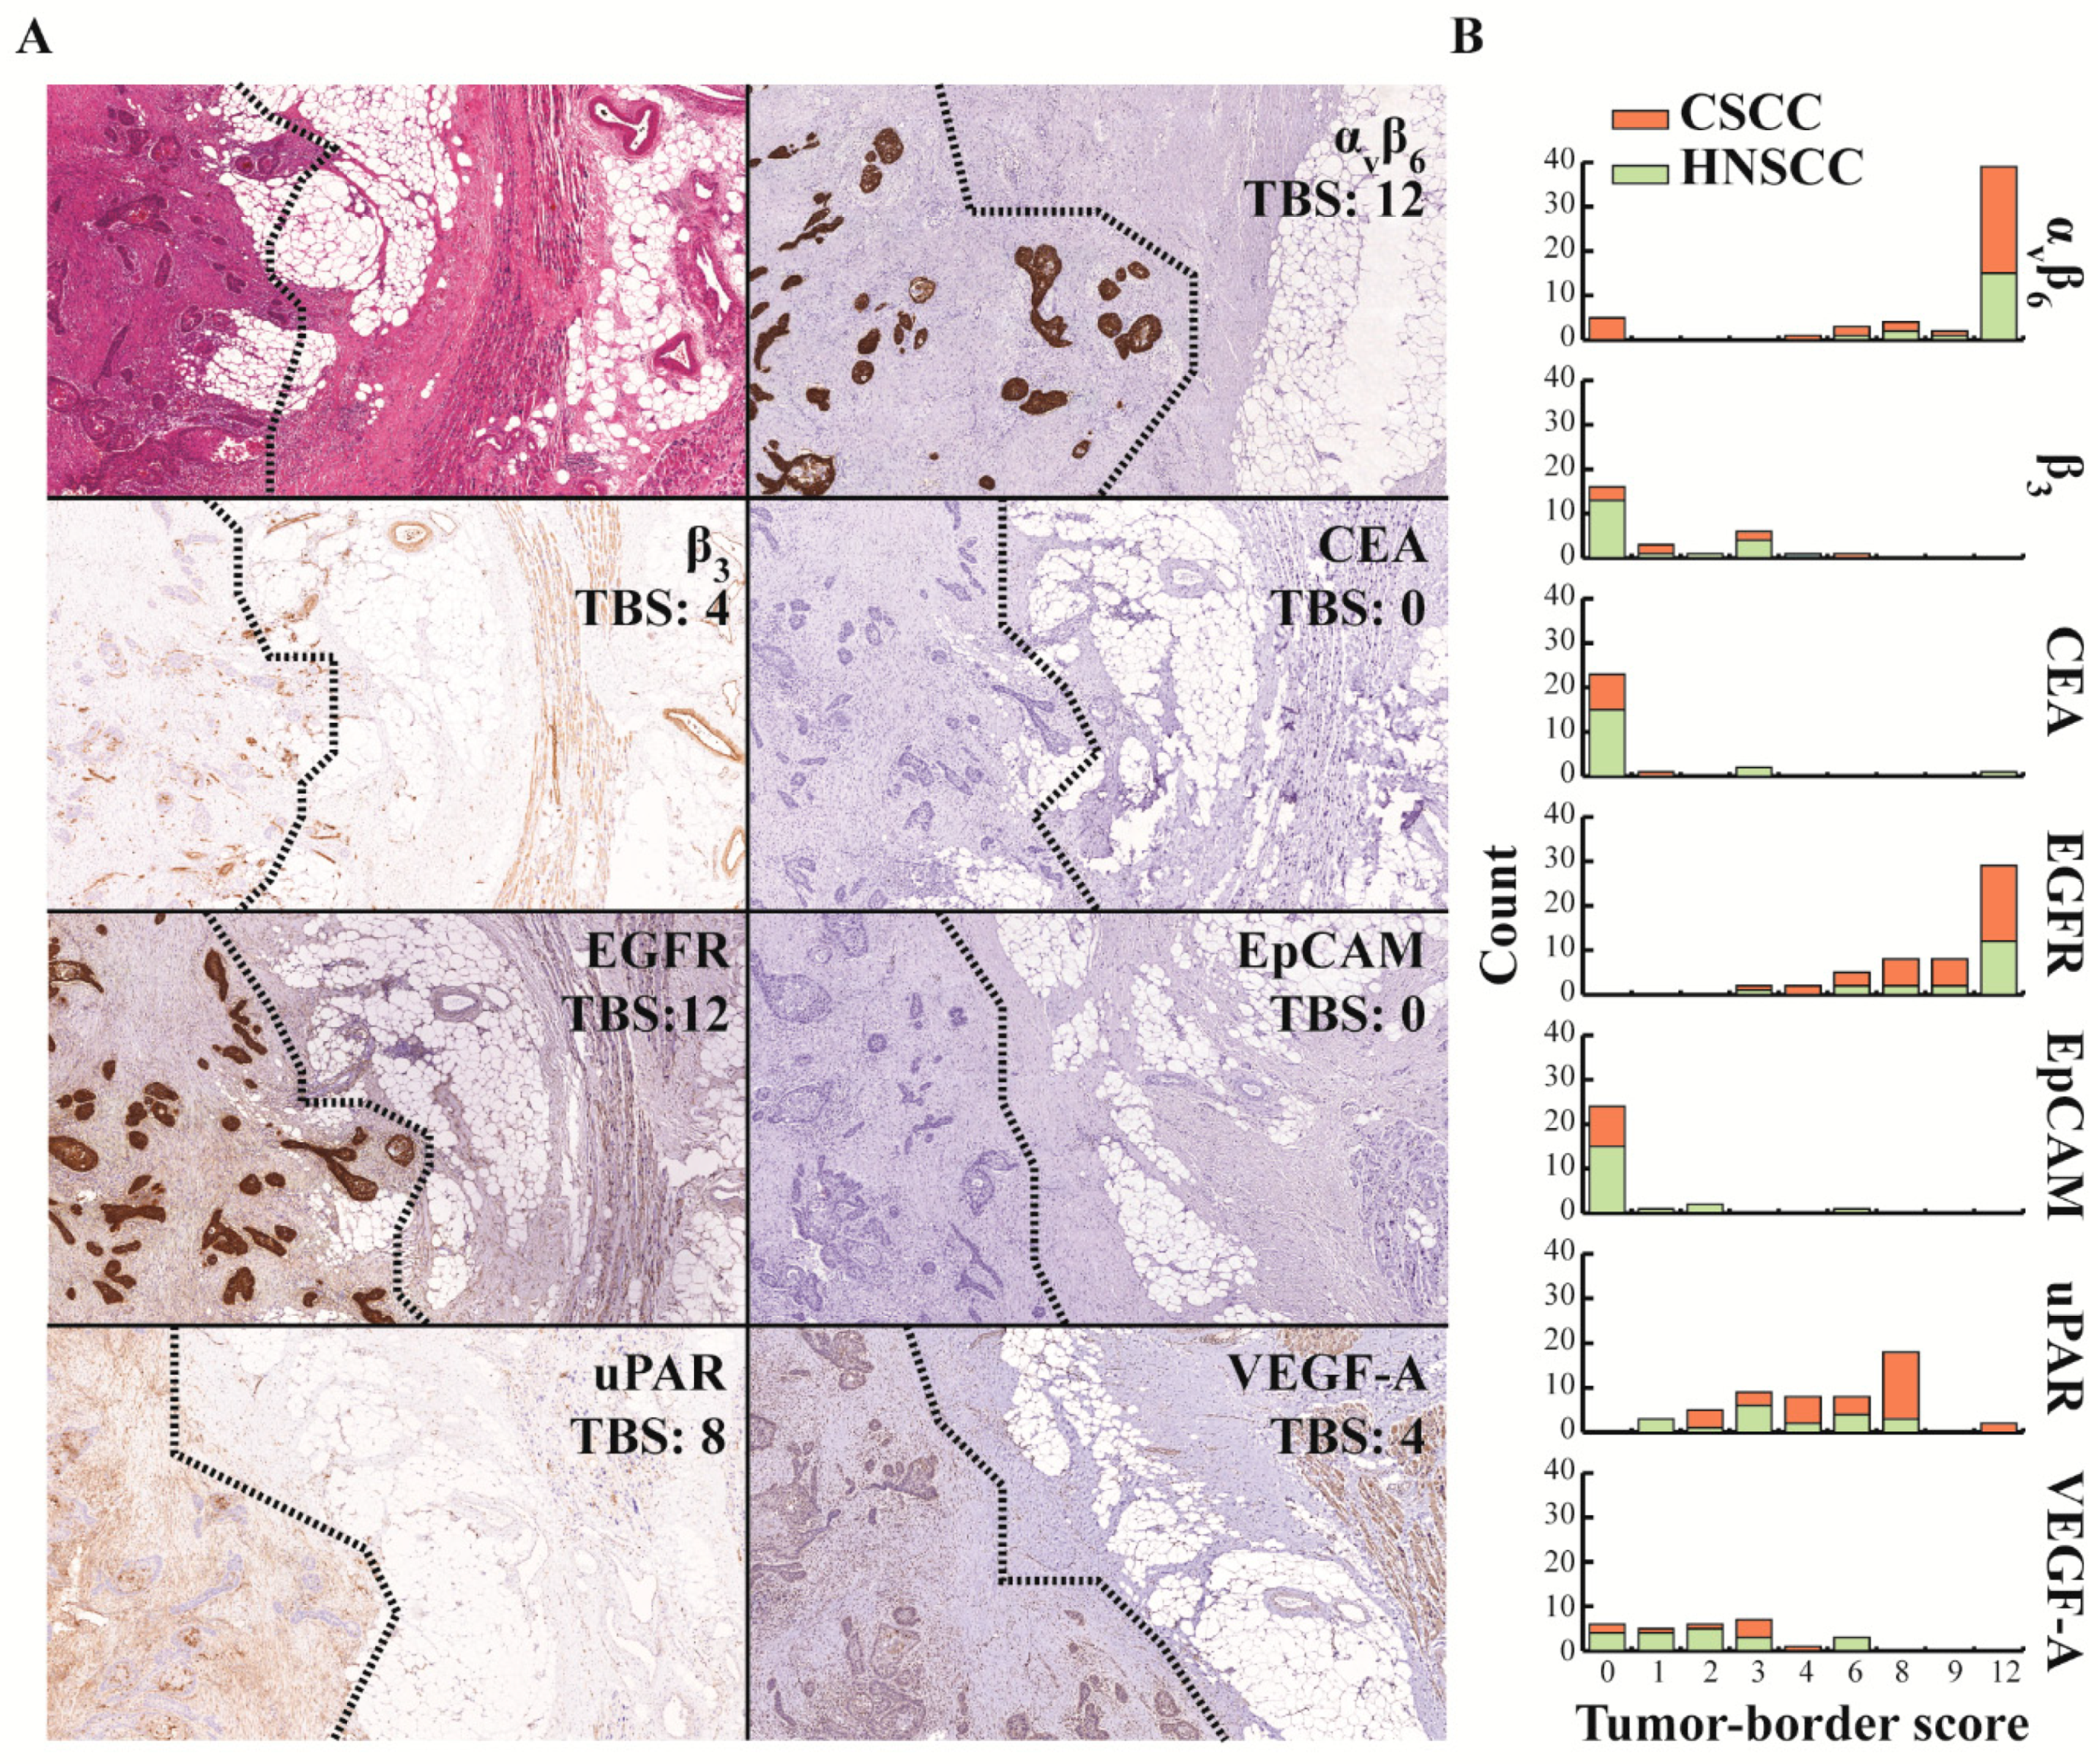
2.3. Introducing the Tumor-Border Score (TBS) for the Evaluation of EGFR as a Target for FGS
2.4. TBS of the Other Molecular Targets
2.5. Target Expression in Immune-Compromised Patients
3. Discussion
4. Materials and Methods
4.1. Patient and Tissue Selection
4.2. Antibodies and Reagents
4.3. Immunohistochemistry
4.4. Immunohistochemistry Analysis
4.5. Statistical Analysis
5. Conclusions
Supplementary Materials
Author Contributions
Funding
Acknowledgments
Conflicts of Interest
References
- Orosco, R.K.; Tapia, V.J.; Califano, J.A.; Clary, B.; Cohen, E.E.W.; Kane, C.; Lippman, S.M.; Messer, K.; Molinolo, A.; Murphy, J.D.; et al. Positive Surgical Margins in the 10 Most Common Solid Cancers. Sci. Rep. 2018, 8, 5686. [Google Scholar] [CrossRef] [Green Version]
- Tan, P.Y.; Ek, E.; Su, S.; Giorlando, F.; Dieu, T. Incomplete excision of squamous cell carcinoma of the skin: A prospective observational study. Plast. Reconstr. Surg. 2007, 120, 910–916. [Google Scholar] [CrossRef]
- Rowe, D.E.; Carroll, R.J.; Day, C.L., Jr. Prognostic factors for local recurrence, metastasis, and survival rates in squamous cell carcinoma of the skin, ear, and lip. Implications for treatment modality selection. J. Am. Acad. Dermatol. 1992, 26, 976–990. [Google Scholar] [CrossRef]
- Alam, M.; Ratner, D. Cutaneous squamous-cell carcinoma. N. Engl. J. Med. 2001, 344, 975–983. [Google Scholar] [CrossRef]
- Brantsch, K.D.; Meisner, C.; Schonfisch, B.; Trilling, B.; Wehner-Caroli, J.; Rocken, M.; Breuninger, H. Analysis of risk factors determining prognosis of cutaneous squamous-cell carcinoma: A prospective study. Lancet Oncol. 2008, 9, 713–720. [Google Scholar] [CrossRef]
- Lansbury, L.; Bath-Hextall, F.; Perkins, W.; Stanton, W.; Leonardi-Bee, J. Interventions for non-metastatic squamous cell carcinoma of the skin: Systematic review and pooled analysis of observational studies. BMJ Clin. Res. Ed. 2013, 347, f6153. [Google Scholar] [CrossRef] [Green Version]
- O’Reilly Zwald, F.; Brown, M. Skin cancer in solid organ transplant recipients: Advances in therapy and management: Part I. Epidemiology of skin cancer in solid organ transplant recipients. J. Am. Acad. Dermatol. 2011, 65, 253–261. [Google Scholar] [CrossRef] [PubMed]
- Weinberg, A.S.; Ogle, C.A.; Shim, E.K. Metastatic cutaneous squamous cell carcinoma: An update. Dermatol. Surg. Off. Publ. Am. Soc. Dermatol. Surg. 2007, 33, 885–899. [Google Scholar] [CrossRef]
- Kang, H.; Kiess, A.; Chung, C.H. Emerging biomarkers in head and neck cancer in the era of genomics. Nat. Rev. Clin. Oncol. 2015, 12, 11–26. [Google Scholar] [CrossRef]
- Bray, F.; Ferlay, J.; Soerjomataram, I.; Siegel, R.L.; Torre, L.A.; Jemal, A. Global cancer statistics 2018: GLOBOCAN estimates of incidence and mortality worldwide for 36 cancers in 185 countries. CA Cancer J. Clin. 2018, 68, 394–424. [Google Scholar] [CrossRef] [Green Version]
- Svahn, M.F.; Munk, C.; Nielsen, T.S.; von Buchwald, C.; Frederiksen, K.; Kjaer, S.K. Trends in all-cause five-year mortality after head and neck cancers diagnosed over a period of 33 years. Focus on estimated degree of association with human papillomavirus. Acta Oncol. 2016, 55, 1084–1090. [Google Scholar] [CrossRef] [PubMed] [Green Version]
- Eldeeb, H.; Macmillan, C.; Elwell, C.; Hammod, A. The effect of the surgical margins on the outcome of patients with head and neck squamous cell carcinoma: Single institution experience. Cancer Biol. Med. 2012, 9, 29–33. [Google Scholar] [CrossRef] [PubMed]
- Ettl, T.; El-Gindi, A.; Hautmann, M.; Gosau, M.; Weber, F.; Rohrmeier, C.; Gerken, M.; Muller, S.; Reichert, T.; Klingelhoffer, C. Positive frozen section margins predict local recurrence in R0-resected squamous cell carcinoma of the head and neck. Oral Oncol. 2016, 55, 17–23. [Google Scholar] [CrossRef] [PubMed]
- McMahon, J.; O’Brien, C.J.; Pathak, I.; Hamill, R.; McNeil, E.; Hammersley, N.; Gardiner, S.; Junor, E. Influence of condition of surgical margins on local recurrence and disease-specific survival in oral and oropharyngeal cancer. Br. J. Oral Maxillofac. Surg. 2003, 41, 224–231. [Google Scholar] [CrossRef]
- Vahrmeijer, A.L.; Hutteman, M.; van der Vorst, J.R.; van de Velde, C.J.; Frangioni, J.V. Image-guided cancer surgery using near-infrared fluorescence. Nat. Rev. Clin. Oncol. 2013, 10, 507–518. [Google Scholar] [CrossRef] [Green Version]
- Tummers, W.S.; Miller, S.E.; Teraphongphom, N.T.; van den Berg, N.S.; Hasan, A.; Longacre, T.A.; Fisher, G.A.; Bonsing, B.A.; Vahrmeijer, A.L.; Gambhir, S.S.; et al. Detection of visually occult metastatic lymph nodes using molecularly targeted fluorescent imaging during surgical resection of pancreatic cancer. HPB Off. J. Int. Hepato Pancreato Biliary Assoc. 2019. [Google Scholar] [CrossRef]
- van Dam, G.M.; Themelis, G.; Crane, L.M.; Harlaar, N.J.; Pleijhuis, R.G.; Kelder, W.; Sarantopoulos, A.; de Jong, J.S.; Arts, H.J.; van der Zee, A.G.; et al. Intraoperative tumor-specific fluorescence imaging in ovarian cancer by folate receptor-alpha targeting: First in-human results. Nat. Med. 2011, 17, 1315–1319. [Google Scholar] [CrossRef]
- Gao, R.W.; Teraphongphom, N.; de Boer, E.; van den Berg, N.S.; Divi, V.; Kaplan, M.J.; Oberhelman, N.J.; Hong, S.S.; Capes, E.; Colevas, A.D.; et al. Safety of panitumumab-IRDye800CW and cetuximab-IRDye800CW for fluorescence-guided surgical navigation in head and neck cancers. Theranostics 2018, 8, 2488–2495. [Google Scholar] [CrossRef] [Green Version]
- Pola, R.; Böhmová, E.; Filipová, M.; Pechar, M.; Pankrác, J.; Větvička, D.; Olejár, T.; Kabešová, M.; Poučková, P.; Šefc, L.; et al. Targeted Polymer-Based Probes for Fluorescence Guided Visualization and Potential Surgery of EGFR-Positive Head-and-Neck Tumors. Pharmaceutics 2020, 12, 31. [Google Scholar] [CrossRef] [Green Version]
- Jensen, P.; Hansen, S.; Moller, B.; Leivestad, T.; Pfeffer, P.; Geiran, O.; Fauchald, P.; Simonsen, S. Skin cancer in kidney and heart transplant recipients and different long-term immunosuppressive therapy regimens. J. Am. Acad. Dermatol. 1999, 40, 177–186. [Google Scholar] [CrossRef]
- Hartevelt, M.M.; Bavinck, J.N.; Kootte, A.M.; Vermeer, B.J.; Vandenbroucke, J.P. Incidence of skin cancer after renal transplantation in The Netherlands. Transplantation 1990, 49, 506–509. [Google Scholar] [CrossRef]
- Manyam, B.V.; Gastman, B.; Zhang, A.Y.; Reddy, C.A.; Burkey, B.B.; Scharpf, J.; Alam, D.S.; Fritz, M.A.; Vidimos, A.T.; Koyfman, S.A. Inferior outcomes in immunosuppressed patients with high-risk cutaneous squamous cell carcinoma of the head and neck treated with surgery and radiation therapy. J. Am. Acad. Dermatol. 2015, 73, 221–227. [Google Scholar] [CrossRef]
- Boonstra, M.C.; Verspaget, H.W.; Ganesh, S.; Kubben, F.J.; Vahrmeijer, A.L.; van de Velde, C.J.; Kuppen, P.J.; Quax, P.H.; Sier, C.F. Clinical applications of the urokinase receptor (uPAR) for cancer patients. Curr. Pharm. Des. 2011, 17, 1890–1910. [Google Scholar] [CrossRef]
- Gaffney, D.C.; Soyer, H.P.; Simpson, F. The epidermal growth factor receptor in squamous cell carcinoma: An emerging drug target. Australas. J. Dermatol. 2014, 55, 24–34. [Google Scholar] [CrossRef] [PubMed]
- Canueto, J.; Cardenoso, E.; Garcia, J.L.; Santos-Briz, A.; Castellanos-Martin, A.; Fernandez-Lopez, E.; Blanco Gomez, A.; Perez-Losada, J.; Roman-Curto, C. Epidermal growth factor receptor expression is associated with poor outcome in cutaneous squamous cell carcinoma. Br. J. Dermatol. 2017, 176, 1279–1287. [Google Scholar] [CrossRef] [PubMed]
- Jones, J.; Watt, F.M.; Speight, P.M. Changes in the expression of alpha v integrins in oral squamous cell carcinomas. J. Oral Pathol. Med. Off. Publ. Int. Assoc. Oral Pathol. Am. Acad. Oral Pathol. 1997, 26, 63–68. [Google Scholar]
- Hamidi, S.; Salo, T.; Kainulainen, T.; Epstein, J.; Lerner, K.; Larjava, H. Expression of alpha(v)beta6 integrin in oral leukoplakia. Br. J. Cancer 2000, 82, 1433–1440. [Google Scholar] [CrossRef] [Green Version]
- Impola, U.; Uitto, V.J.; Hietanen, J.; Hakkinen, L.; Zhang, L.; Larjava, H.; Isaka, K.; Saarialho-Kere, U. Differential expression of matrilysin-1 (MMP-7), 92 kD gelatinase (MMP-9), and metalloelastase (MMP-12) in oral verrucous and squamous cell cancer. J. Pathol. 2004, 202, 14–22. [Google Scholar] [CrossRef]
- Van Aarsen, L.A.; Leone, D.R.; Ho, S.; Dolinski, B.M.; McCoon, P.E.; LePage, D.J.; Kelly, R.; Heaney, G.; Rayhorn, P.; Reid, C.; et al. Antibody-mediated blockade of integrin alpha v beta 6 inhibits tumor progression in vivo by a transforming growth factor-beta-regulated mechanism. Cancer Res. 2008, 68, 561–570. [Google Scholar] [CrossRef] [Green Version]
- Christensen, A.; Kiss, K.; Lelkaitis, G.; Juhl, K.; Persson, M.; Charabi, B.W.; Mortensen, J.; Forman, J.L.; Sorensen, A.L.; Jensen, D.H.; et al. Urokinase-type plasminogen activator receptor (uPAR), tissue factor (TF) and epidermal growth factor receptor (EGFR): Tumor expression patterns and prognostic value in oral cancer. BMC Cancer 2017, 17, 572. [Google Scholar] [CrossRef] [Green Version]
- Boonstra, M.C.; Van Driel, P.B.; Keereweer, S.; Prevoo, H.A.; Stammes, M.A.; Baart, V.M.; Lowik, C.W.; Mazar, A.P.; van de Velde, C.J.; Vahrmeijer, A.L.; et al. Preclinical uPAR-targeted multimodal imaging of locoregional oral cancer. Oral Oncol. 2017, 66, 1–8. [Google Scholar] [CrossRef] [PubMed]
- Magnussen, S.; Rikardsen, O.G.; Hadler-Olsen, E.; Uhlin-Hansen, L.; Steigen, S.E.; Svineng, G. Urokinase plasminogen activator receptor (uPAR) and plasminogen activator inhibitor-1 (PAI-1) are potential predictive biomarkers in early stage oral squamous cell carcinomas (OSCC). PLoS ONE 2014, 9, e101895. [Google Scholar] [CrossRef] [PubMed]
- Rosenthal, E.L.; Warram, J.M.; de Boer, E.; Chung, T.K.; Korb, M.L.; Brandwein-Gensler, M.; Strong, T.V.; Schmalbach, C.E.; Morlandt, A.B.; Agarwal, G.; et al. Safety and Tumor Specificity of Cetuximab-IRDye800 for Surgical Navigation in Head and Neck Cancer. Clin. Cancer Res. 2015, 21, 3658–3666. [Google Scholar] [CrossRef] [PubMed] [Green Version]
- Moore, L.S.; Rosenthal, E.L.; de Boer, E.; Prince, A.C.; Patel, N.; Richman, J.M.; Morlandt, A.B.; Carroll, W.R.; Zinn, K.R.; Warram, J.M. Effects of an Unlabeled Loading Dose on Tumor-Specific Uptake of a Fluorescently Labeled Antibody for Optical Surgical Navigation. Mol. Imaging Biol. MIB Off. Publ. Acad. Mol. Imaging 2017, 19, 610–616. [Google Scholar] [CrossRef] [PubMed]
- Nishio, N.; van den Berg, N.S.; van Keulen, S.; Martin, B.A.; Fakurnejad, S.; Zhou, Q.; Lu, G.; Chirita, S.U.; Kaplan, M.J.; Divi, V.; et al. Optimal Dosing Strategy for Fluorescence-Guided Surgery with Panitumumab-IRDye800CW in Head and Neck Cancer. Mol. Imaging Biol. MIB Off. Publ. Acad. Mol. Imaging 2019. [Google Scholar] [CrossRef] [PubMed]
- de Boer, E.; Warram, J.M.; Tucker, M.D.; Hartman, Y.E.; Moore, L.S.; de Jong, J.S.; Chung, T.K.; Korb, M.L.; Zinn, K.R.; van Dam, G.M.; et al. In Vivo Fluorescence Immunohistochemistry: Localization of Fluorescently Labeled Cetuximab in Squamous Cell Carcinomas. Sci. Rep. 2015, 5, 10169. [Google Scholar] [CrossRef] [Green Version]
- Bandyopadhyay, A.; Raghavan, S. Defining the role of integrin alphavbeta6 in cancer. Curr. Drug Targets 2009, 10, 645–652. [Google Scholar] [CrossRef]
- Yang, S.B.; Du, Y.; Wu, B.Y.; Xu, S.P.; Wen, J.B.; Zhu, M.; Cai, C.H.; Yang, P.C. Integrin alphavbeta6 promotes tumor tolerance in colorectal cancer. Cancer Immunol. Immunother. 2012, 61, 335–342. [Google Scholar] [CrossRef]
- Hausner, S.H.; Bold, R.J.; Cheuy, L.Y.; Chew, H.K.; Daly, M.E.; Davis, R.A.; Foster, C.C.; Kim, E.J.; Sutcliffe, J.L. Preclinical Development and First-in-Human Imaging of the Integrin alphavbeta6 with [(18)F]alphavbeta6-Binding Peptide in Metastatic Carcinoma. Clin. Cancer Res. 2019, 25, 1206–1215. [Google Scholar] [CrossRef] [Green Version]
- Boonstra, M.C.; van Driel, P.B.; van Willigen, D.M.; Stammes, M.A.; Prevoo, H.A.; Tummers, Q.R.; Mazar, A.P.; Beekman, F.J.; Kuppen, P.J.; van de Velde, C.J.; et al. uPAR-targeted multimodal tracer for pre- and intraoperative imaging in cancer surgery. Oncotarget 2015, 6, 14260–14273. [Google Scholar] [CrossRef]
- Skovgaard, D.; Persson, M.; Brandt-Larsen, M.; Christensen, C.; Madsen, J.; Klausen, T.L.; Holm, S.; Andersen, F.L.; Loft, A.; Berthelsen, A.K.; et al. Safety, Dosimetry, and Tumor Detection Ability of 68Ga-NOTA-AE105: First-in-Human Study of a Novel Radioligand for uPAR PET Imaging. J. Nucl. Med. 2017, 58, 379–386. [Google Scholar] [CrossRef] [PubMed] [Green Version]
- Persson, M.; Skovgaard, D.; Brandt-Larsen, M.; Christensen, C.; Madsen, J.; Nielsen, C.H.; Thurison, T.; Klausen, T.L.; Holm, S.; Loft, A.; et al. First-in-human uPAR PET: Imaging of Cancer Aggressiveness. Theranostics 2015, 5, 1303–1316. [Google Scholar] [CrossRef] [PubMed] [Green Version]
- Christensen, A.; Juhl, K.; Persson, M.; Charabi, B.W.; Mortensen, J.; Kiss, K.; Lelkaitis, G.; Rubek, N.; von Buchwald, C.; Kjaer, A. uPAR-targeted optical near-infrared (NIR) fluorescence imaging and PET for image-guided surgery in head and neck cancer: Proof-of-concept in orthotopic xenograft model. Oncotarget 2017, 8, 15407–15419. [Google Scholar] [CrossRef] [PubMed] [Green Version]
- True, L.D. Methodological requirements for valid tissue-based biomarker studies that can be used in clinical practice. Virchows Arch. 2014, 464, 257–263. [Google Scholar] [CrossRef] [PubMed] [Green Version]
- Serpa, M.S.; Mafra, R.P.; Queiroz, S.; Silva, L.P.D.; Souza, L.B.; Pinto, L.P. Expression of urokinase-type plasminogen activator and its receptor in squamous cell carcinoma of the oral tongue. Braz. Oral Res. 2018, 32, e93. [Google Scholar] [CrossRef]
- Shah, A.K. Postoperative pathologic assessment of surgical margins in oral cancer: A contemporary review. J. Oral Maxillofac. Pathol. 2018, 22, 78–85. [Google Scholar] [CrossRef]
- van Oosten, M.; Crane, L.M.; Bart, J.; van Leeuwen, F.W.; van Dam, G.M. Selecting Potential Targetable Biomarkers for Imaging Purposes in Colorectal Cancer Using TArget Selection Criteria (TASC): A Novel Target Identification Tool. Transl. Oncol. 2011, 4, 71–82. [Google Scholar] [CrossRef] [Green Version]


| Characteristics | Total Population (n = 56) | CSCC (n = 37) | HNSCC (n = 19) |
|---|---|---|---|
| Age, mean (SD) | 70 (11) | 72 (10) | 67 (11) |
| Male gender, n (%) | 49 (87.5%) | 34 (91.9%) | 15 (78.9%) |
| Tumor differentiation, n (%) | |||
| Well differentiated | 4 (7.1%) | 3 (8.1%) | 1 (5.3%) |
| Moderately differentiated | 18 (32.1%) | 8 (21.6%) | 10 (52.6%) |
| Poorly differentiated | 10 (17.9%) | 8 (21.6%) | 2 (10.5%) |
| Missing | 24 (42.9%) | 18 (48.6%) | 6 (31.6%) |
| Primary tumor, n (%) | |||
| pT1 | 31 (55.3%) | 22 (59.5%) | 9 (47.4) |
| pT2 | 11 (19.6%) | 10 (27.0%) | 1 (5.3%) |
| pT3 | 4 (7.1%) | 2 (5.4%) | 2 (10.5%) |
| pT4 | 10 (17.9%) | 3 (8.1%) | 7 (36.8%) |
| Regional lymph nodes, n (%) | |||
| cN0, pN not assessed | 41 (73.2%) | 32 (86.5%) | 9 (47.4%) |
| pN0 | 8 (14.3%) | 1 (2.7%) | 7 (36.8%) |
| pN1 | 2 (3.6%) | 1 (2.7%) | 1 (5.3%) |
| pN2 | 5 (9.0%) | 3 (8.1%) | 2 (10.5%) |
| Surgical margin status, n (%) | |||
| R0 | 30 (53.6%) | 19 (51.4%) | 11 (57.9%) |
| Narrow | 12 (21.4%) | 7 (18.9%) | 5 (26.3%) |
| R1 | 14 (25.0%) | 11 (29.7%) | 3 (15.8%) |
| Immune Status, n (%) | |||
| Compromised | n.a. | 14 (37.8%) | n.a. |
| Potentially compromised | n.a. | 7 (18.9%) | n.a. |
| Not compromised | n.a. | 16 (43.2%) | n.a. |
© 2020 by the authors. Licensee MDPI, Basel, Switzerland. This article is an open access article distributed under the terms and conditions of the Creative Commons Attribution (CC BY) license (http://creativecommons.org/licenses/by/4.0/).
Share and Cite
Baart, V.M.; van Duijn, C.; van Egmond, S.L.; Dijckmeester, W.A.; Jansen, J.C.; Vahrmeijer, A.L.; Sier, C.F.M.; Cohen, D. EGFR and αvβ6 as Promising Targets for Molecular Imaging of Cutaneous and Mucosal Squamous Cell Carcinoma of the Head and Neck Region. Cancers 2020, 12, 1474. https://0-doi-org.brum.beds.ac.uk/10.3390/cancers12061474
Baart VM, van Duijn C, van Egmond SL, Dijckmeester WA, Jansen JC, Vahrmeijer AL, Sier CFM, Cohen D. EGFR and αvβ6 as Promising Targets for Molecular Imaging of Cutaneous and Mucosal Squamous Cell Carcinoma of the Head and Neck Region. Cancers. 2020; 12(6):1474. https://0-doi-org.brum.beds.ac.uk/10.3390/cancers12061474
Chicago/Turabian StyleBaart, Victor M., Chayenne van Duijn, Sylvia L. van Egmond, Willem A. Dijckmeester, Jeroen C. Jansen, Alexander L. Vahrmeijer, Cornelis F. M. Sier, and Danielle Cohen. 2020. "EGFR and αvβ6 as Promising Targets for Molecular Imaging of Cutaneous and Mucosal Squamous Cell Carcinoma of the Head and Neck Region" Cancers 12, no. 6: 1474. https://0-doi-org.brum.beds.ac.uk/10.3390/cancers12061474