
Current Trends in Non-Invasive Imaging of Interactions in the Liver Tumor Microenvironment Mediated by Tumor Metabolism


1
Department of Radiology, Charité-Universitätsmedizin Berlin, Corporate Member of Freie Universität Berlin, Humboldt-Universität zu Berlin, and Berlin Institute of Health, 10117 Berlin, Germany
2
Berlin Institute of Health, 10178 Berlin, Germany
*
Author to whom correspondence should be addressed.
Cancers 2021, 13(15), 3645; https://0-doi-org.brum.beds.ac.uk/10.3390/cancers13153645
Submission received: 14 June 2021
/
Revised: 12 July 2021
/
Accepted: 16 July 2021
/
Published: 21 July 2021
(This article belongs to the Special Issue Imaging Cancer Metabolism)
Abstract
:Simple Summary
Deregulated tumor metabolism is known to shape the tumor microenvironment and directly affect the local immune response, promoting tumor growth, metastasis, and resistance to treatment. However, the metabolic profile or tumor cells, and therefore, the composition of their microenvironment, are highly variable among patients and even within the same tumor, resulting in heterogeneous response rates to oncologic therapies, making patient selection a key issue. This review article focuses on non-invasive imaging techniques that aim to visualize the crosstalk between tumor cells and their microenvironment in liver cancer mediated by tumor metabolism. In addition to improved tumor detection, such imaging tools may be able to provide a more accurate characterization of the individual tumor and ultimately improve understanding, as well as guide personalized treatment regimens for patients with liver cancer.
Abstract
With the increasing understanding of resistance mechanisms mediated by the metabolic reprogramming in cancer cells, there is a growing clinical interest in imaging technologies that allow for the non-invasive characterization of tumor metabolism and the interactions of cancer cells with the tumor microenvironment (TME) mediated through tumor metabolism. Specifically, tumor glycolysis and subsequent tissue acidosis in the realms of the Warburg effect may promote an immunosuppressive TME, causing a substantial barrier to the clinical efficacy of numerous immuno-oncologic treatments. Thus, imaging the varying individual compositions of the TME may provide a more accurate characterization of the individual tumor. This approach can help to identify the most suitable therapy for each individual patient and design new targeted treatment strategies that disable resistance mechanisms in liver cancer. This review article focuses on non-invasive positron-emission tomography (PET)- and MR-based imaging techniques that aim to visualize the crosstalk between tumor cells and their microenvironment in liver cancer mediated by tumor metabolism.
1. Introduction
Hepatocellular carcinoma (HCC) is the most common primary liver malignancy, and primary liver cancer is the third most common cause of cancer-related death worldwide [1]. Incidence rates continue to increase, and the majority of HCC patients present at intermediate to advanced disease stages [2]. HCC mostly develops in cirrhotic, chronically inflamed liver parenchyma, with the main risk factors being chronic hepatitis B and C infection or alcoholic or non-alcoholic fatty liver disease (NAFLD) [2]. The outcome of patients largely depends on early detection and diagnosis, as well as on determining the most appropriate individual treatment and monitoring the response.
In routine clinical settings, anatomical imaging, such as contrast-enhanced computed tomography (CT) or magnetic resonance imaging (MRI), are used as standards of care for the detection and diagnosis, staging, and response assessments of HCC after treatment [3]. The characteristic radiological enhancement pattern of HCC is the pronounced contrast-uptake in the hepatic arterial phase and the subsequent wash-out in the portal venous and delayed phases, which is due to the pathophysiologic hypervascularization and the predominance of arterial over portal venous blood supply [4].
In terms of imaging quality, multiphasic MRI provides better soft tissue contrast than CT, allowing for a more detailed evaluation of nodules and background liver tissue characteristics [3]. The vast majority of MRI contrast agents are based on gadolinium, which shortens the T1 and T2 relaxation times of tissues in which it accumulates. In contrast to extracellular gadolinium-based contrast agents, MRI with hepatocyte-specific contrast agents is generally more sensitive in detection, but at the cost of a decreased specificity when diagnosing small HCC (<2 cm) [3]. Moreover, MRI is currently acquired clinically solely for qualitative diagnosis, but is not optimized for quantification, limiting its reproducibility and accuracy [3,4].
Alterations in metabolic tumor characteristics may become detectable earlier after treatment than changes in hypervascularization. Therefore, more comprehensive approaches to characterize and monitor the tumors metabolism are urgently needed [5].
In this context, the individual physiological and biological variations of the tumor microenvironment (TME) are proposed to play an important role over the dynamic course of carcinogenesis and reflect the aggressiveness of cancer cells by their changing composition [6,7]. Overall, these microenvironmental characteristics are associated with chemoresistance to multiple commonly used, systemically applicable, anticancer agents, as well as poor clinical outcomes [6,7].
Specifically, key functions of tumor metabolism resulting in the acidification of the TME significantly contribute to the building and preservation of a pro-tumorigenic niche [6]. The most frequently studied metabolic characteristic of cancer was first described by Otto Warburg as aerobic glycolysis, and comprises an increased glucose uptake and glycolytic metabolization even in the presence of sufficient oxygen instead of oxidative phosphorylation [8]. High glucose uptake and increased glycolytic activity have also been reported for HCC [9]. The aerobic glycolysis is faster but less energy efficient; thus, the cancer cell is required to perform glycolysis at a higher rate. The so-called “Warburg effect” leads to an accumulation of glycolysis by-products, such as lactate, with concomitant acidification of the TME, which, in turn, impairs the anti-tumoral immune response and promotes neo-angiogenesis and metastasis, all of which support tumor growth [10,11,12,13].
In addition to the dysregulated glucose metabolism, numerous other deranged metabolic pathways have been discovered in HCC as well as in other tumors, including the metabolism of amino acids and lipids [6,14]. However, the metabolic profile of tumor cells and the composition of the TME are highly variable among patients and even within the same tumor; therefore, they are unpredictable, resulting in heterogeneous response rates to oncologic therapies, making patient selection a key issue [12,15,16].
Thus, there is an unmet clinical need for novel imaging biomarkers that visualize the tumor and its microenvironmental characteristics, and thereby better reflect the true biochemical and pathological disease profile. In this regard, metabolic pathways have gained increased interest as targets for imaging and therapies [7]. This review article focuses on non-invasive positron emission tomography (PET)- and MR-based imaging techniques that aim to visualize the crosstalk between tumor cells and their microenvironment in liver cancer mediated by tumor metabolism (Table 1).
2. I Imaging of Metabolic Substrates and Flux
2.1. Glycolysis
2.1.1. Glucose
The most widely applied metabolic imaging in clinical routine is 18F-fluorodeoxyglucose positron emission computed tomography (18F-FDG PET), visualizing the uptake of the glucose analogue as an indicator of (upregulated) glycolysis in tumor cells (Figure 1). In clinical practice, PET is performed as hybrid imaging, combined with either CT or MRI, in order to be able to fuse the functional image information to the anatomical image. The 18F-FDG-signal can be quantified as a standard uptake value (SUV). However, besides the glucose uptake and tumor perfusion, there are also some HCC-specific factors resulting in the varying sensitivity of SUV [35,36].
HCCs mostly display a hyperglycolytic phenotype, and in order to maintain high rates of glycolysis, the glucose transporters GLUT-1 and -2 are upregulated, allowing for an increased uptake of glucose. Increased GLUT-1 expression has been correlated with worse prognosis in patients with HCC [9]. Inside the cell, glycolysis starts with the phosphorylation of glucose to glucose-6-phosphate with the enzyme hexokinase (HK). The most common isoform in HCC is HK2, which is also upregulated in hypoxia, for example, a common phenomenon in growing tumors [38]. In an HCC mouse model, HK2 knockdown inhibited glycolysis and thus glucose flux to pyruvate and lactate, and simultaneously increased oxidative phosphorylation, which could be diminished by metformin, contributing to further cell death and the inhibition of tumor growth [39]. Additionally, HK2 silencing also synergized with sorafenib, a multi-tyrosine kinase and angiogenesis inhibitor, to inhibit tumor growth [39].
In contrast to the overexpression of HK-2 in HCC, normal liver parenchyma expresses HK-4 most abundantly [6]. FDG follows the first steps of the metabolic pathway of glucose and is trapped inside the cell by phosphorylation; therefore, the retention of FDG inside the cell and the increased SUVs require the high expression of HK and low expression of glucose-6-phosphatase (G6P). As opposed to HCC, liver parenchyma has high levels of G6P and low HK. However, depending on the differentiation of HCC, expression levels of HK and G6P differ, leading to varying sensitivity of FDG-PET in HCC between 50% and 65% [40,41]. In highly differentiated, low-grade HCC, the enzymatic activity resembles that of normal hepatocytes, HK levels are usually low and G6P are levels high; thus, FDG retention is low and the sensitivity of 18F-FDG-PET/CT for the detection of HCC is therefore decreased. Additionally, signal quantification is limited by a decreased signal-to-noise ratio due to the FDG-uptake of liver parenchyma and the resulting background signal. These obstacles have so far prevented FDG-PET applications from being included in the routine management of HCC, although it may offer an opportunity to investigate HCC differentiation and distant metastases, which are most likely of poorly differentiated tumors [17].
2.1.2. Pyruvate, Lactate, and Alanine
Pyruvate kinase mediates the last step of glycolysis, generating pyruvate and adenosine diphosphate. Pyruvate, in turn, can be further converted to lactate (by lactic dehydrogenase, LDH) or alanine (by alanine transaminase, ALT), or it can enter the tricarboxylic acid cycle (Figure 1).
In human HCC, LDH activity is up-regulated and serum LDH levels have shown a prognostic value in predicting overall and progression-free survival in HCC [42,43]. Another study reported that high serum levels of LDH correlated with worse median progression-free survival (PFS) in patients with HCC treated with sorafenib [44]. Thus, the non-invasive monitoring of glycolysis, and particularly the alternative conversion of pyruvate into lactate, could serve as a prognostic biomarker or tool for the monitoring of treatment responses.
Imaging of pyruvate and its predominant downstream metabolites can be used to differentiate tissues. In contrast to PET visualizing only tracer uptake, dynamic nuclear polarization magnetic resonance spectroscopic imaging (DNP-MRSI) enables the real-time visualization of the enzymatic conversion of the parent substrate to its downstream metabolites. DNP-MRSI utilizes hyperpolarized 13C-labeled substrates, which increases the sensitivity of conventional MRS. Using sequential scanning, this technique thus enables the quantitative assessment of metabolic flux (Figure 1) [45].
However, pyruvate DNP-MRSI requires higher doses of the infused hyperpolarized substrates, potentially interfering with metabolic flux and thus making the interpretation of the imaging findings more complicated as compared to PET imaging, which requires lower amounts of radiotracer.
Aerobic glycolysis and tissue acidosis are common phenomena in the TME; however, glycolytic rates and consecutive lactate accumulation can increase further in cases of tumoral hypoxia, which occurs in a majority of growing malignancies whose size exceeds the oxygen provided by tumor-supplying vessels. Additionally, tissue hypoxia may be severely exacerbated following embolotherapies, including transarterial (chemo)embolization (TAE, TACE), which constitutes a guideline-approved treatment for intermediate-stage HCC [46,47]. TAE is considered to be an intra-arterial embolization therapy that causes tissue infarction and ischemic insults within the treated lesions. One preclinical study showed that after TAE-induced ischemia, latent HCC cells demonstrated reduced metabolism and developed a dependence on glycolytic flux to lactate, which could be imaged by DNP-MRSI of 1-13C-pyruvate and its downstream metabolites, 1-13C-lactate and 1-13C-alanine, which, in turn, predict the histological viability of treatment-refractory HCC cells after TAE [20].
In a recent study using a rat model of HCC, DNP-MRSI after 1-13C-pyruvate injection revealed a higher peak lactate-to-alanine signal ratio in HCC compared to non-tumorous tissue. Dynamic DNP-MRS revealed higher pyruvate-to-lactate conversion rates and lactate signals in tumors derived from more hyperglycolytic cells, validated by ex vivo measurements of higher lactate dehydrogenase levels [19]. Investigations in an orthotopic rat model of HCC demonstrated that the conversion of 1-13C-pyruvate to 1-13C-alanine was significantly higher than the conversion of 1-13C-pyruvate to 1-13C-lactate [48].
A study from Düwel et al. investigated a more comprehensive multiparametric DNP-MRSI approach in HCC-bearing rats before and after TAE. Measurements included hyperpolarized urea, revealing information about tumor perfusion (measured as tumor-to-muscle and tumor-to-liver ratios of urea), pyruvate and its metabolic conversion, as well as fumarate conversion to malate, providing insight into the levels of necrosis [49]. However, due to the cellular export and re-circulation of lactate, systemic lactate levels should be taken into account when modelling local conversion rates [50].
2.2. Lipid Metabolism
The liver metabolizes lipids and lipoproteins and is of key importance in the synthesis, storage, and degradation of lipids. Additionally, cancer metabolism displays dysregulated de novo lipogenesis, a pathway that controls the biosynthesis of fatty acids [51]. In cases of glucose depletion, fatty acid oxidation can be used to provide additional energy for cell survival and proliferation [52]. Dysbalanced lipid metabolism, as in patients with obesity, diabetes and hepatic steatosis, is associated with an increased risk of developing HCC. Type 2 diabetes mellitus increases the risk of HCC development; thus, metformin treatment substantially decreases the risk of HCC development and progression in a dose-dependent manner [53]. Consequently, there is currently a phase III clinical trial investigating metformin treatment in patients with HCC (NCT03184493). Additionally, statins (β-Hydroxy β-methylglutaryl-CoA (HMG-CoA) reductase inhibitors), which are used to lower cholesterol levels, can attenuate the risk of HCC development in patients with or without diabetes and HCC [54].
2.2.1. Choline
Only very limited data regarding the imaging of lipid metabolism in HCC exist. The most frequently investigated technique is PET imaging using choline as a radiotracer. Choline is needed for cell membrane phospholipids. Increased proliferation rates in cancer require the increased metabolism of cell membrane components, leading to enhanced choline uptake and utilization [55,56]. A meta-analysis demonstrated an average detection rate of 11C-choline PET of 84% for HCC across five studies [57]. However, particularly for a subset of HCCs, which were moderately differentiated, these showed relatively high choline uptakes and thus a better detection rate with 11C-choline PET (75% detection sensitivity) as compared to poorly differentiated HCC with markedly lower choline uptake (25% detection sensitivity) [21]. This uptake behavior is inverse to the FDG-uptake; therefore, another study prospectively investigated the benefit of combining 11C-choline with 18F-FDG PET and showed a markedly increased sensitivity for detecting HCC of 93% (vs. choline PET alone 75% and FDG PET alone 36%) [22].
2.2.2. Acetate
Acetate can be used by tumors as a substrate in de novo fatty acid synthesis. The method of 11C-acetate PET imaging showed an encouraging sensitivity of 75% for detecting HCC, but decreased to 32% in HCCs smaller than 2 cm [24]. Similar to 11C-choline, well-differentiated HCC tumors were detected by 11C-acetate, demonstrating a benefit of the complementary use of acetate together with FDG PET imaging as well. Additionally, non-HCC malignant liver lesions did not show increased 11C-acetate uptake and of the benign liver lesions that have been investigated only FNH showed mildly increased 11C-acetate uptake, suggesting a high specificity [58]. Dual tracer (11C-acetate and 18F-FDG) PET/CT was superior to contrast-enhanced CT in detecting HCC in cirrhotic liver parenchyma [23].
2.2.3. Amino Acids
When compared to hepatocytes, HCC cells exhibit an increased uptake and metabolism of glutamine, which has been shown to correlate with tumor progression [59]. Thus, glutamine may serve as another interesting target for metabolic cancer imaging. Among other preclinical approaches, the conversion of glutamine to glutamate was demonstrated with hyperpolarized 5-13C(1) glutamine MRS measurements in human HCC cells and in a rat model of HCC [25,60].
2.3. II Tumor Microenvironment
2.3.1. Extracellular pH
The mostly hyperglycolytic tumor phenotype of HCC leads to an accumulation of lactate and protons, which need to be excreted in the extracellular milieu in order to maintain the intracellular pH and dependent cellular functions. In cancer cells, intracellular pH (pHi) is increased as compared to normal cells (7.2–7.5), whereas extracellular pH (pHe) is usually more acidic (6.5–6.9) [61]. Extracellular tumor acidosis is associated with more aggressive tumor growth and invasion, neoangiogenesis and metastasis, and chemoresistance to, e.g., doxorubicin [61,62,63,64,65,66]. The increased expression of carbonic anhydrases, monocarboxylate transporter 1 and 4, and Na+-H+ exchanger 1, facilitate the efflux of protons and lactate into the extracellular milieu [67,68,69,70]. The subsequent acidic pHe in the TME can serve as a biomarker for oncologic imaging to visualize the result of enhanced glycolysis as well as a therapeutic target in order to mitigate the resistance mechanisms to chemotherapy or radiation (Figure 1).
Currently, various pH probes exist that generally use the physical properties of acidic protons for MRS and MRI. Chemical exchange saturation transfer (CEST) saturates exchangeable protons which are transferred to bulk water signals and can be used to measure pHe. Ioversol CEST MRI has been successfully used for pHe mapping of the liver cancer microenvironment in a rat hepatoma model [26]. Radiofrequency (RF) power-based ratiometric CEST (dual-power CEST) MRI using ioversol has been shown to be able to differentiate human HCC from benign hemangioma based on measurements of the pHe on a 3T MR scanner [27]. In a model of mammary cancer, CEST-fast imaging with a steady-state free precession technique (CEST-FISP) MRI method was applied to detect the CEST of two amide protons of iopromide, a clinically used CT contrast agent. This adapted CEST method was then used as a non-invasive and relatively fast imaging technique to detect the change in tumor environmental pHe after bicarbonate treatment (Figure 1) [71].
Another MR-based approach is based on the MRSI of the pH-dependent chemical shifts of 1H or 31P. Biosensor imaging of redundant deviation in shifts (BIRDS) is a relatively fast voxel-based MRSI technique measuring 1H signals, which detects paramagnetically shifted non-exchangeable protons from lanthanide Ln3+ complexes that are independent of contrast agent concentration in the investigated tissue. This technique has been validated in translational organotypic 3D culture models of liver cancer in vitro as well as in vivo using the orthotopic VX2 rabbit liver tumor model. Specifically, untreated VX2 tumors showed significantly lower pHe than the surrounding liver parenchyma. Within two weeks after TACE, tumor pHe gradually increased towards normal liver parenchyma pHe, suggesting that tumor pHe can serve as a functional biomarker for tumor responses to non-surgical therapies of liver cancer (Figure 1 and Figure 2) [5,28].
In addition to pHe mapping, there are theranostic approaches based on selective targeting of the acidic tumor pHe, such as the acidic pH-triggered drug-release of sorafenib and superparamagnetic iron oxide nanocomposites. These nanocomposites showed good iron-mediated MRI contrast, while simultaneously significantly inhibiting tumor growth in a rat model of HCC [29]. In another study, pH-responsive lactosylated nanoparticles containing sorafenib and curcumin were injected i.v. in an HCC xenograft model and showed a reduction in tumor growth [72].
More recently, a new PET-based method for selective pH imaging was introduced. 18F-FDG amine, an acid labile prodrug 18F-FDG derivative, is selectively degraded to the parent compound upon exposure to acidic pH and can be taken up by adjacent cells, as with conventional 18F-FDG, and subsequently be imaged by PET [30]. This approach aims to reduce the problem of background signals in FDG-PET, potentially making it more applicable, e.g., in the brain, kidneys or the liver.
2.3.2. Hypoxia
Tumor hypoxia drives the hyperglycolytic phenotype of cancer cells and the consecutive accumulation of lactate and protons, exacerbating the low pHe [73]. Additionally, hypoxia results in the upregulation of various growth factors, e.g., hypoxia-inducible factor (HIF)-1α, which promotes angiogenesis, endothelial-to-mesenchymal transition, and thus, metastasis in cancer [74,75,76,77]. It further propagates the expression of immune checkpoints, facilitates regulatory T cell activation, and promotes macrophage polarization towards an anti-inflammatory, pro-tumorigenic M2 phenotype, all of which contribute to immune evasion of the tumor, resistance to radiation and systemic therapies, and ultimately, a poor prognosis (Figure 1) [76,78].
Imaging hypoxia in the TME may allow for the identification, spatial mapping and quantification of tumor hypoxia prior to treatment as well as the monitoring of treatment-induced alterations, e.g., following embolotherapies. However, no hypoxia imaging methods are currently being used in clinical practice.
Several PET-based imaging techniques exist, but have been mostly studied in tumor entities other than HCC, i.e., head and neck cancer. Head and neck cancers are often treated with radiotherapeutic approaches; therefore, the non-invasive localization of foci of tumor hypoxia with hypoxia-specific PET tracers, such as 18F-fluoromisonidazole (18F-FMISO), could be useful to guide the targeted therapy of radioresistant hypoxic tumors [79].
In addition to PET-based techniques, several MRI-based approaches for the imaging of hypoxia have been studied in HCC. Those techniques either measure the changes in longitudinal relaxation (R(1)), the tumor oxygenation level-dependent (TOLD) MRI, the changes in effective transverse relaxation (R(2)*), or the blood-oxygen-level-dependent (BOLD) MRI induced by inhalation of either oxygen or carbogen [80]. A study investigating these techniques in 34 human HCCs found a decrease in R2* and an increase in R1 after the inhalation of oxygen as expected with increased tissue and blood oxygenation [81]. In a rabbit VX2 liver tumor model, BOLD-fMRI detected a decrease in T2* after TACE, consistent with the therapeutic tumor hypoxia induced after embolization [82]. Another study investigated the BOLD response following oxygen inhalation in cirrhotic liver parenchyma, which has abnormal vascular autoregulatory mechanisms and therefore shows an elevated BOLD response [31].
2.3.3. Extracellular Matrix
In addition to energy generation, glucose plays a pivotal role in shaping the extracellular matrix (ECM), which provides structural and biochemical support to tumor cells as well as the surrounding cells of the TME [83,84]. In addition to collagen and elastin, proteoglycans, a subclass of glycoproteins, are a major component of the ECM. They contain at least one glycosaminoglycan chain which is attached to the core. They are located in the ECM, on the cell surface, and in the cytoplasm.
Glypican-3 (GPC3), a cell surface-linked heparan sulfate proteoglycan, is physiologically present only in the fetal liver but not in adult liver parenchyma [85]. However, GPC3 is upregulated in a variety of tumor entities including HCC, and its expression is reportedly associated with poor prognosis. Its main functions in cancer progression are the GPC3-induced stimulation of Wnt signaling for tumor progression, the interaction of GPC3 with various growth factors, the stimulation of epithelial–mesenchymal transition (EMT), and the recruitment and polarization of macrophages towards a tumor-promoting M2-phenotype (Figure 1) [86,87,88,89,90,91,92,93,94,95].
Given its high tumor-to-liver ratio, GPC3 is supposedly suitable for targeted imaging approaches in HCC. For PET imaging, GPC3-labeled 89Zr was able to detect HCC in liver parenchyma in an orthotopic xenograft mouse model. To reduce the long circulation time and therefore the background signal of the monoclonal antibody, an αGPC3-F(ab′)2 fragment conjugated to 89Zr was developed and yielded significantly accelerated blood clearance and increased signal-to-noise ratios [32].
Regarding GPC3-specific MRI probes, an anti-GPC3-ultrasuperparamagnetic iron oxide probe for early HCC detection was developed and exhibited specific uptake behavior of HepG2 cells and decreased signal intensity in T2-weighted images in vitro [96]. In a clinical study, a multifunctional nanoparticle specifically binding GPC3 was used in pretreatment MRI for HCC detection, and additionally visualized HCC during operation through near-infrared fluorescence [97].
Although broad clinical applications remain warranted, GPC3-targeted imaging may have the potential to complement the staging of HCC, the identification of the tumor margin during surgery, as well as the monitoring after treatment.
2.4. III Inflammation
2.4.1. Immune Evasion
Chronic liver diseases not only display altered metabolism, but also generate a chronic proinflammatory milieu, allowing for hepatic tumor formation and progression [98]. In HCCs, the TME consists of stromal cells, hepatic stellate cells, and endothelial and local immune cells. The crosstalk between tumor cells and their surrounding microenvironment is required for sustaining HCC development and progression by promoting (neo-)angiogenesis and EMT [98].
The TME constitutes a harsh environment for infiltrating immune cells due to the competition for nutrients and metabolic by-products of accelerated tumor growth requiring the immune cells to adapt. Cancer cells mostly rely on aerobic glycolysis; proinflammatory M1 macrophages and activated T cells also shift their metabolism towards an activated state with increased nutrient uptake, glutaminolysis, and aerobic glycolysis (over oxidative phosphorylation), which is needed to fuel their effector functions [99,100]. M1 macrophages rely on aerobic glycolysis as well [101]. This results in competition for substrates between cancer cells and immune cells, where cancer cells usually outpace the local immune cells in the TME. Moreover, the metabolic tumor by-products, such as lactate, and tumor hypoxia, further contribute to the immunosuppressive, pro-tumorigenic niche, in which immune cells need to adapt in order to survive [102,103].
Active inflammatory stimuli promote the polarization of macrophages towards an M1-like phenotype, which, in turn, produces inflammatory cytokines. In contrast, anti-inflammatory stimuli induce the polarization towards an M2-like phenotype with immunosuppressive functions. During chronic inflammation, e.g., in viral hepatitis, the immunosuppressive M2-like macrophage phenotype becomes more prevalent [104,105]. The interplay between M2-like tumor-associated macrophages (TAM) and HCC is complex. Tumor-derived lactate enhances M2 polarization and the expression of vascular endothelial growth factor (VEGF) of TAMs [106]. Moreover, the accumulation of lactate and acidification of the TME reduces the interferon-gamma expression of cytotoxic T cells and natural killer cells [73].
Additionally, it has been shown that M2-like TAMs promote EMT and chemoresistance in HCC and are associated with poor overall survival in HCC [107,108]. This highlights the importance of targeting the immune microenvironment with tailored imaging techniques and therapeutic approaches.
One study with six patients, one of them with HCC, investigated a non-invasive PET/CT-based technique with radiolabeled minibodies against CD8+ T cells, and found this approach to be safe and suitable for early imaging. The biodistribution was highest in spleen and bone marrow, but PET/CT showed accumulations in tumors as well [33].
Moreover, quantitative T2-weighted magnetic resonance imaging, using superparamagnetic iron oxide nanoparticles (SPIONs), has been used for the non-invasive imaging of TAMs in animal models and in human trials [34]. The SPIONs are slowly phagocyted by macrophages and decrease T2 MR relaxation times in inflamed tissue or tumors several hours after the injection of SPIONs. Imaging of TAMs using SPION is a promising method for the assessment of the inflammatory response to the tumor and tumoral immune cell infiltration, and may be used for the evaluation of the susceptibility to treatment and monitoring of treatment response (Figure 2) [109].
Initial evidence from in vitro models exists, indicating that SPIONs are not simply endocytosed by macrophages, but internalized depending on their interaction with proteoglycans expressed on the cellular membrane of macrophages, also referred to as glycocalyx. Specifically, Poller et al. demonstrated the binding of very small SPIONs to proteoglycans in the glycocalyx of monocytes and the occurrence of particle clusters reflecting their interaction prior to internalization. This finding highlights the importance of proteoglycans as components of the TME when developing new molecular imaging tools, because they potentially interfere with the imaging probes and affect their sensitivity and specificity [110].
In addition to capturing the immune landscape, there are theranostic applications of SPIONs as well, such as the intraarterial locoregional infusion of SPIO-labeled NK cells, which can be visualized with MRI and limit tumor progression [111]. SPIONs can also be incorporated into a complex with small interfering RNA, for targeted PD-L1-knockdown therapy combined with MRI diagnosis [112].
2.4.2. Immunometabolic Crosstalk
Another MR application has recently been developed, which explores the concept of compound labeling commonly known from nuclear medicine tracers. Antibodies targeting surface receptors on antigen-presenting immune cells, such as human leukocyte antigens (HLA)-DR, were conjugated to gadolinium, and the conjugate was injected into liver tumor-bearing rabbits. The animals underwent 3T MRI, where select binding of the conjugate to peritumoral immune cells could be visualized as peritumoral ring enhancement in T1-weighted Dixon sequences. The imaging findings were validated by imaging mass cytometry on paraffin-embedded tumor tissue, which confirmed the gadolinium deposition in the peritumoral zone. Using the same approach combined with the previously explained pH-specific BIRDS MRSI, low tumor pHe was correlated with an immunosuppressive microenvironment on imaging. Accordingly, increased tumor pHe induced by TACE combined with sodium bicarbonate injection in vivo achieved better peri- and intratumoral immune cell infiltration, indicative of an immune permissive TME, that may potentially be more susceptible to immuno-oncologic therapies (Figure 2) [34].
3. Conclusions and Future Prospects
Altered cellular metabolism is a key feature of HCC that has a major impact on the tumor cells, tumor stroma, and local immune cells, and can be targeted by imaging and therapeutic approaches. Overall, there is an urgent clinical need for non-invasive characterization of the individual tumor and its TME, making the tumor metabolism and flux of metabolic substrates in the TME a promising target. The integration of molecular imaging of the tumor metabolism and its interaction with the various components of the TME in the clinical workup will ultimately help in applying and optimizing various targeted systemic, surgical or locoregional therapeutic approaches that have been already developed and will guide the development of new targeted therapies. A variety of functional imaging techniques exist, ranging from PET with traditional or new radiotracers to MR-based methods, and which complement anatomical imaging for the detection, diagnosis, staging, prediction, and monitoring of treatment responses in HCC. MR-based imaging modalities, which overcome some of the limitations of PET imaging, have been studied mostly in the preclinical setting (Table 1). However, the majority of approaches currently under investigation demonstrate limited sensitivity as well as low cost-efficiency, preventing their broad application in the management of HCC patients. Moreover, studies are absent that investigate the sensitivity and specificity of quantitative imaging biomarkers in the context of the histopathological and genomic tumor profile, despite the high number of identified driver genes and known inter- and intratumoral heterogeneity in HCC. Additionally, despite the targeted approach, many PET- and MR-based techniques alone do not sufficiently capture the complexity of the metabolic phenotype in HCC or its interaction with the stromal components and infiltrating immune cells in the TME, requiring combinations of several imaging modalities and targets to achieve higher diagnostic accuracy in a multiparametric approach. Therefore, future research endeavors in the molecular imaging of HCC should focus on the non-invasive monitoring of the crosstalk between the tumor cells and their TME mediated through tumor metabolism. In addition to improved tumor detection, such imaging tools may be able to provide a more accurate characterization of the individual tumor, and ultimately improve the understanding and facilitate the design of personalized treatment regimens for patients with liver cancer.
Author Contributions
Conceptualization, L.J.S. and I.T.S.; Literature research, I.T.S. and L.J.S.; Writing—original draft preparation, I.T.S. and L.J.S.; Writing—review and editing, I.T.S. and L.J.S.; Visualization, I.T.S. and L.J.S. All authors have read and agreed to the published version of the manuscript.
Funding
This review article received no external funding.
Acknowledgments
The authors gratefully acknowledge the scientific input provided by Julius Chapiro. L.J.S. is a fellow of the BIH Charité Junior Clinician Scientist Program funded by the Charité—Universitätsmedizin Berlin and the Berlin Institute of Health. The authors further acknowledge support from the German Research Foundation (DFG) and the Open Access Publication Fund of Charité—Universitätsmedizin Berlin.
Conflicts of Interest
The authors declare no conflict of interest.
References
- Sung, H.; Ferlay, J.; Siegel, R.L.; Laversanne, M.; Soerjomataram, I.; Jemal, A.; Bray, F. Global cancer statistics 2020: GLOBOCAN estimates of incidence and mortality worldwide for 36 cancers in 185 countries. CA Cancer J. Clin. 2021, 71, 209–249. [Google Scholar] [CrossRef]
- Yang, J.D.; Hainaut, P.; Gores, G.J.; Amadou, A.; Plymoth, A.; Roberts, L.R. A global view of hepatocellular carcinoma: Trends, risk, prevention and management. Nat. Rev. Gastroenterol. Hepatol. 2019, 16, 589–604. [Google Scholar] [CrossRef]
- Roberts, L.R.; Sirlin, C.B.; Zaiem, F.; Almasri, J.; Prokop, L.J.; Heimbach, J.K.; Murad, M.H.; Mohammed, K. Imaging for the diagnosis of hepatocellular carcinoma: A systematic review and meta-analysis. Hepatology 2018, 67, 401–421. [Google Scholar] [CrossRef] [PubMed] [Green Version]
- Choi, J.-Y.; Lee, J.M.; Sirlin, C.B. CT and MR Imaging Diagnosis and Staging of Hepatocellular Carcinoma: Part I. Development, Growth, and Spread: Key Pathologic and Imaging Aspects. Radiology 2014, 272, 635–654. [Google Scholar] [CrossRef] [PubMed] [Green Version]
- Savic, L.J.; Schobert, I.T.; Peters, D.; Walsh, J.J.; Laage-Gaupp, F.M.; Hamm, C.A.; Tritz, N.; Doemel, L.A.; Lin, M.; Sinusas, A.; et al. Molecular Imaging of Extracellular Tumor pH to Reveal Effects of Locoregional Therapy on Liver Cancer Microenvironment. Clin. Cancer Res. 2019, 26, 428–438. [Google Scholar] [CrossRef] [PubMed] [Green Version]
- Satriano, L.; Lewinska, M.; Rodrigues, P.M.; Banales, J.M.; Andersen, J.B. Metabolic rearrangements in primary liver cancers: Cause and consequences. Nat. Rev. Gastroenterol. Hepatol. 2019, 16, 748–766. [Google Scholar] [CrossRef]
- De Matteis, S.; Ragusa, A.; Marisi, G.; De Domenico, S.; Gardini, A.C.; Bonafè, M.; Giudetti, A.M. Aberrant Metabolism in Hepatocellular Carcinoma Provides Diagnostic and Therapeutic Opportunities. Oxidative Med. Cell. Longev. 2018, 2018, 1–13. [Google Scholar] [CrossRef] [Green Version]
- Warburg, O. On respiratory impairment in cancer cells. Science 1956, 124, 269–270. [Google Scholar]
- Amann, T.; Maegdefrau, U.; Hartmann, A.; Agaimy, A.; Marienhagen, J.; Weiss, T.; Stoeltzing, O.; Warnecke, C.; Schölmerich, J.; Oefner, P.J.; et al. GLUT1 Expression Is Increased in Hepatocellular Carcinoma and Promotes Tumorigenesis. Am. J. Pathol. 2009, 174, 1544–1552. [Google Scholar] [CrossRef] [Green Version]
- Fiume, L.; Manerba, M.; Vettraino, M.; DI Stefano, G. Impairment of Aerobic Glycolysis by Inhibitors of Lactic Dehydrogenase Hinders the Growth of Human Hepatocellular Carcinoma Cell Lines. Pharmacology 2010, 86, 157–162. [Google Scholar] [CrossRef]
- Fischer, K.; Hoffmann, P.; Völkl, S.; Meidenbauer, N.; Ammer, J.; Edinger, M.; Gottfried, E.; Schwarz, S.; Rothe, G.; Hoves, S.; et al. Inhibitory effect of tumor cell–derived lactic acid on human T cells. Blood 2007, 109, 3812–3819. [Google Scholar] [CrossRef] [PubMed]
- Damaghi, M.; Gillies, R. Phenotypic changes of acid-adapted cancer cells push them toward aggressiveness in their evolution in the tumor microenvironment. Cell Cycle 2017, 16, 1739–1743. [Google Scholar] [CrossRef] [Green Version]
- Buck, M.; Sowell, R.T.; Kaech, S.M.; Pearce, E.L. Metabolic Instruction of Immunity. Cell 2017, 169, 570–586. [Google Scholar] [CrossRef] [PubMed]
- DeBerardinis, R.J.; Chandel, N.S. Fundamentals of cancer metabolism. Sci. Adv. 2016, 2, e1600200. [Google Scholar] [CrossRef] [Green Version]
- Roth, G.S.; Decaens, T. Liver immunotolerance and hepatocellular carcinoma: Patho-physiological mechanisms and therapeutic perspectives. Eur. J. Cancer 2017, 87, 101–112. [Google Scholar] [CrossRef] [PubMed]
- Schobert, I.T.; Savic, L.J.; Chapiro, J.; Bousabarah, K.; Chen, E.; Laage-Gaupp, F.; Tefera, J.; Nezami, N.; Lin, M.; Pollak, J.; et al. Neutrophil-to-lymphocyte and platelet-to-lymphocyte ratios as predictors of tumor response in hepatocellular carcinoma after DEB-TACE. Eur. Radiol. 2020, 30, 5663–5673. [Google Scholar] [CrossRef] [PubMed]
- Iwata, Y.; Shiomi, S.; Sasaki, N.; Jomura, H.; Nishiguchi, S.; Seki, S.; Kawabe, J.; Ochi, H. Clinical usefulness of positron emission tomography with fluorine-18-fluorodeoxyglucose in the diagnosis of liver tumors. Ann. Nucl. Med. 2000, 14, 121–126. [Google Scholar] [CrossRef]
- Cho, K.J.; Choi, N.K.; Shin, M.H.; Chong, A.R. Clinical usefulness of FDG-PET in patients with hepatocellular carcinoma undergoing surgical resection. Ann. Hepato-Biliary-Pancreat. Surg. 2017, 21, 194–198. [Google Scholar] [CrossRef] [Green Version]
- Bliemsrieder, E.; Kaissis, G.; Grashei, M.; Topping, G.; Altomonte, J.; Hundshammer, C.; Lohöfer, F.; Heid, I.; Keim, D.; Gebrekidan, S.; et al. Author Correction: Hyperpolarized 13C pyruvate magnetic resonance spectroscopy for in vivo metabolic phenotyping of rat HCC. Sci. Rep. 2021, 11, 1. [Google Scholar] [CrossRef]
- Perkons, N.R.; Kiefer, R.M.; Noji, M.C.; Pourfathi, M.; Ackerman, D.; Siddiqui, S.; Tischfield, D.; Profka, E.; Johnson, O.; Pickup, S.; et al. Hyperpolarized Metabolic Imaging Detects Latent Hepatocellular Carcinoma Domains Surviving Locoregional Therapy. Hepatology 2020, 72, 140–154. [Google Scholar] [CrossRef]
- Yamamoto, Y.; Nishiyama, Y.; Kameyama, R.; Okano, K.; Kashiwagi, H.; Deguchi, A.; Kaji, M.; Ohkawa, M. Detection of Hepatocellular Carcinoma Using 11C-Choline PET: Comparison with 18F-FDG PET. J. Nucl. Med. 2008, 49, 1245–1248. [Google Scholar] [CrossRef] [PubMed] [Green Version]
- Castilla-Lièvre, M.A.; Franco, D.; Gervais, P.; Kuhnast, B.; Agostini, H.; Marthey, L.; Désarnaud, S.; Helal, B.O. Diagnostic value of combining ¹¹C-choline and ¹⁸F-FDG PET/CT in hepatocellular carcinoma. Eur. J. Nucl. Med. Mol. Imaging 2016, 43, 852–859. [Google Scholar] [CrossRef]
- Cheung, T.T.; Ho, C.L.; Lo, C.M.; Chen, S.; Chan, S.C.; Chok, K.S.; Fung, J.Y.; Chan, A.C.Y.; Sharr, W.; Yau, T.; et al. 11C-acetate and 18F-FDG PET/CT for clinical staging and selection of patients with hepatocellular carcinoma for liver transplantation on the basis of Milan criteria: Surgeon’s perspective. J. Nucl. Med. 2013, 54, 192–200. [Google Scholar] [CrossRef] [Green Version]
- Park, J.-W.; Kim, J.H.; Kim, S.K.; Kang, K.W.; Park, K.W.; Choi, J.-I.; Lee, W.J.; Kim, C.-M.; Nam, B.H. A Prospective Evaluation of 18F-FDG and 11C-Acetate PET/CT for Detection of Primary and Metastatic Hepatocellular Carcinoma. J. Nucl. Med. 2008, 49, 1912–1921. [Google Scholar] [CrossRef] [Green Version]
- Cabella, C.; Karlsson, M.; Canapè, C.; Catanzaro, G.; Serra, S.C.; Miragoli, L.; Poggi, L.; Uggeri, F.; Venturi, L.; Jensen, P.R.; et al. In vivo and in vitro liver cancer metabolism observed with hyperpolarized [5-13C]glutamine. J. Magn. Reson. 2013, 232, 45–52. [Google Scholar] [CrossRef]
- Chen, M.; Chen, C.; Shen, Z.; Zhang, X.; Chen, Y.; Lin, F.; Ma, X.; Zhuang, C.; Mao, Y.; Gan, H.; et al. Extracellular pH is a biomarker enabling detection of breast cancer and liver cancer using CEST MRI. Oncotarget 2017, 8, 45759–45767. [Google Scholar] [CrossRef] [PubMed] [Green Version]
- Tang, Y.; Xiao, G.; Shen, Z.; Zhuang, C.; Xie, Y.; Zhang, X.; Yang, Z.; Guan, J.; Shen, Y.; Chen, Y.; et al. Noninvasive Detection of Extracellular pH in Human Benign and Malignant Liver Tumors Using CEST MRI. Front. Oncol. 2020, 10, 578985. [Google Scholar] [CrossRef] [PubMed]
- Savic, L.J.; Schobert, I.T.; Hamm, C.A.; Adam, L.C.; Hyder, F.; Coman, D. A high-throughput imaging platform to characterize extracellular pH in organotypic three-dimensional in vitro models of liver cancer. NMR Biomed. 2021, 34, e4465. [Google Scholar] [CrossRef] [PubMed]
- Park, W.; Chen, J.; Cho, S.; Park, S.J.; Larson, A.C.; Na, K.; Kim, D.H. Acidic pH-Triggered Drug-Eluting Nanocomposites for Magnetic Resonance Imaging-Monitored Intra-arterial Drug Delivery to Hepatocellular Carcinoma. ACS Appl. Mater. Interfaces 2016, 8, 12711–12719. [Google Scholar] [CrossRef] [Green Version]
- Flavell, R.R.; Truillet, C.; Regan, M.K.; Ganguly, T.; Blecha, J.E.; Kurhanewicz, J.; VanBrocklin, H.F.; Keshari, K.R.; Chang, C.J.; Evans, M.J.; et al. Caged [(18)F]FDG Glycosylamines for Imaging Acidic Tumor Microenvironments Using Positron Emission Tomography. Bioconj. Chem. 2016, 27, 170–178. [Google Scholar] [CrossRef] [PubMed]
- Patterson, A.; Priest, A.; Bowden, D.J.; Wallace, T.E.; Patterson, I.; Graves, M.; Lomas, D. Quantitative BOLD imaging at 3T: Temporal changes in hepatocellular carcinoma and fibrosis following oxygen challenge. J. Magn. Reson. Imaging 2016, 44, 739–744. [Google Scholar] [CrossRef] [Green Version]
- Sham, J.G.; Kievit, F.; Grierson, J.R.; Miyaoka, R.S.; Yeh, M.M.; Zhang, M.; Yeung, R.S.; Minoshima, S.; Park, J.O. Glypican-3-Targeted 89Zr PET Imaging of Hepatocellular Carcinoma. J. Nucl. Med. 2014, 55, 799–804. [Google Scholar] [CrossRef] [Green Version]
- Pandit-Taskar, N.; Postow, M.A.; Hellmann, M.D.; Harding, J.J.; Barker, C.A.; O’Donoghue, J.A.; Ziolkowska, M.; Ruan, S.; Lyashchenko, S.K.; Tsai, F.; et al. First-in-Humans Imaging with 89Zr-Df-IAB22M2C Anti-CD8 Minibody in Patients with Solid Malignancies: Preliminary Pharmacokinetics, Biodistribution, and Lesion Targeting. J. Nucl. Med. 2020, 61, 512–519. [Google Scholar] [CrossRef]
- Savic, L.J.; Doemel, L.A.; Schobert, I.T.; Montgomery, R.R.; Joshi, N.; Walsh, J.J.; Santana, J.; Pekurovsky, V.; Zhang, X.; Lin, M.; et al. Molecular MRI of the Immuno-Metabolic Interplay in a Rabbit Liver Tumor Model: A Biomarker for Resistance Mechanisms in Tumor-targeted Therapy? Radiology 2020, 296, 575–583. [Google Scholar] [CrossRef] [PubMed]
- Ronot, M.; Clift, A.K.; Vilgrain, V.; Frilling, A. Functional imaging in liver tumours. J. Hepatol. 2016, 65, 1017–1030. [Google Scholar] [CrossRef] [Green Version]
- Hoogenboom, T.C.; Thursz, M.; Aboagye, E.; Sharma, R. Functional imaging of hepatocellular carcinoma. Hepatic Oncol. 2016, 3, 137–153. [Google Scholar] [CrossRef] [PubMed]
- Momcilovic, M.; Shackelford, D.B. Imaging Cancer Metabolism. Biomol. Ther. 2018, 26, 81–92. [Google Scholar] [CrossRef] [PubMed] [Green Version]
- Gwak, G.-Y.; Yoon, J.-H.; Kim, K.M.; Lee, H.-S.; Chung, J.W.; Gores, G.J. Hypoxia stimulates proliferation of human hepatoma cells through the induction of hexokinase II expression. J. Hepatol. 2005, 42, 358–364. [Google Scholar] [CrossRef] [PubMed]
- DeWaal, D.; Nogueira, V.; Terry, A.R.; Patra, K.C.; Jeon, S.M.; Guzman, G.; Au, J.; Long, C.P.; Antoniewicz, M.R.; Hay, N. Hexokinase-2 depletion inhibits glycolysis and induces oxidative phosphorylation in hepatocellular carcinoma and sensitizes to metformin. Nat. Commun. 2018, 9, 446. [Google Scholar] [CrossRef] [PubMed]
- Khan, M.; Combs, C.S.; Brunt, E.M.; Lowe, V.J.; Wolverson, M.K.; Solomon, H.; Collins, B.T.; Bisceglie, A.M. Positron emission tomography scanning in the evaluation of hepatocellular carcinoma. J. Hepatol. 2000, 32, 792–797. [Google Scholar] [CrossRef]
- Wudel, L.J.; Delbeke, D.; Morris, D.; Rice, M.; Washington, M.K.; Shyr, Y.; Pinson, C.W.; Chapman, W.C. The role of [18F]fluorodeoxyglucose positron emission tomography imaging in the evaluation of hepatocellular carcinoma. Am. Surg. 2003, 69, 117–124. [Google Scholar]
- Sheng, S.L.; Liu, J.J.; Dai, Y.H.; Sun, X.G.; Xiong, X.P.; Huang, G. Knockdown of lactate dehydrogenase A suppresses tumor growth and metastasis of human hepatocellular carcinoma. FEBS J. 2012, 279, 3898–3910. [Google Scholar] [CrossRef]
- Faloppi, L.; Bianconi, M.; Memeo, R.; Gardini, A.C.; Giampieri, R.; Bittoni, A.; Andrikou, K.; Del Prete, M.; Cascinu, S.; Scartozzi, M. Lactate Dehydrogenase in Hepatocellular Carcinoma: Something Old, Something New. BioMed Res. Int. 2016, 2016, 1–7. [Google Scholar] [CrossRef] [PubMed]
- Faloppi, L.; Scartozzi, M.; Bianconi, M.; Baroni, G.S.; Toniutto, P.; Giampieri, R.; Del Prete, M.; De Minicis, S.; Bitetto, D.; Loretelli, C.; et al. The role of LDH serum levels in predicting global outcome in HCC patients treated with sorafenib: Implications for clinical management. BMC Cancer 2014, 14, 110. [Google Scholar] [CrossRef] [PubMed] [Green Version]
- Dutta, P.; Martinez, G.V.; Gillies, R.J. A new horizon of DNP technology: Application to in-vivo 13C magnetic resonance spectroscopy and imaging. Biophys. Rev. 2013, 5, 271–281. [Google Scholar] [CrossRef]
- Forner, A.; Reig, M.; Bruix, J. Hepatocellular carcinoma. Lancet 2018, 391, 1301–1314. [Google Scholar] [CrossRef]
- Liu, K.; Min, X.-L.; Peng, J.; Yang, K.; Yang, L.; Zhang, X.-M. The Changes of HIF-1α and VEGF Expression After TACE in Patients With Hepatocellular Carcinoma. J. Clin. Med. Res. 2016, 8, 297–302. [Google Scholar] [CrossRef] [Green Version]
- Darpolor, M.M.; Yen, Y.-F.; Chua, M.-S.; Xing, L.; Clarke-Katzenberg, R.H.; Shi, W.; Mayer, D.; Josan, S.; Hurd, R.E.; Pfefferbaum, A.; et al. In vivo MRSI of hyperpolarized [1-13 C]pyruvate metabolism in rat hepatocellular carcinoma. NMR Biomed. 2010, 24, 506–513. [Google Scholar] [CrossRef] [Green Version]
- Düwel, S.; Durst, M.; Gringeri, C.V.; Kosanke, Y.; Gross, C.; Janich, M.A.; Haase, A.; Glaser, S.J.; Schwaiger, M.; Schulte, R.F.; et al. Multiparametric human hepatocellular carcinoma characterization and therapy response evaluation by hyperpolarized13C MRSI. NMR Biomed. 2016, 29, 952–960. [Google Scholar] [CrossRef]
- Serrao, E.; Kettunen, M.; Rodrigues, T.; Lewis, D.; Gallagher, F.; Hu, D.; Brindle, K. Analysis of 13 C and 14 C labeling in pyruvate and lactate in tumor and blood of lymphoma-bearing mice injected with 13 C- and 14 C-labeled pyruvate. NMR Biomed. 2018, 31, e3901. [Google Scholar] [CrossRef] [PubMed] [Green Version]
- Zaidi, N.; Lupien, L.; Kuemmerle, N.B.; Kinlaw, W.B.; Swinnen, J.V.; Smans, K. Lipogenesis and lipolysis: The pathways exploited by the cancer cells to acquire fatty acids. Prog. Lipid Res. 2013, 52, 585–589. [Google Scholar] [CrossRef] [PubMed] [Green Version]
- Wang, M.; Han, J.; Xing, H.; Zhang, H.; Li, Z.; Liang, L.; Li, C.; Dai, S.; Wu, M.; Shen, F.; et al. Dysregulated fatty acid metabolism in hepatocellular carcinoma. Hepatic Oncol. 2016, 3, 241–251. [Google Scholar] [CrossRef] [PubMed]
- Chen, H.-P.; Shieh, J.-J.; Chang, C.-C.; Chen, T.-T.; Lin, J.-T.; Wu, M.-S.; Lin, J.-H.; Wu, C.-Y. Metformin decreases hepatocellular carcinoma risk in a dose-dependent manner: Population-based and in vitro studies. Gut 2013, 62, 606–615. [Google Scholar] [CrossRef] [PubMed]
- Kim, G.; Jang, S.-Y.; Nam, C.M.; Kang, E.S. Statin use and the risk of hepatocellular carcinoma in patients at high risk: A nationwide nested case-control study. J. Hepatol. 2018, 68, 476–484. [Google Scholar] [CrossRef] [PubMed] [Green Version]
- Podo, F. Tumour phospholipid metabolism. NMR Biomed. 1999, 12, 413–439. [Google Scholar] [CrossRef]
- Roivainen, A.; Forsback, S.; Grönroos, T.; Lehikoinen, P.; Kähkönen, M.; Sutinen, E.; Minn, H. Blood metabolism of [methyl-11C]choline; implications for in vivo imaging with positron emission tomography. Eur. J. Nucl. Med. Mol. Imaging 2000, 27, 25–32. [Google Scholar] [CrossRef]
- Bertagna, F.; Bertoli, M.; Bosio, G.; Biasiotto, G.; Sadeghi, R.; Giubbini, R.; Treglia, G. Diagnostic role of radiolabelled choline PET or PET/CT in hepatocellular carcinoma: A systematic review and meta-analysis. Hepatol. Int. 2014, 8, 493–500. [Google Scholar] [CrossRef]
- Ho, C.L.; Simon, C.H.; Yeung, D.W. 11C-Acetate PET Imaging in Hepatocellular Carcinoma and Other Liver Masses. J. Nucl. Med. 2003, 44, 213–221. [Google Scholar]
- Bode, B.P.; Souba, W.W. Modulation of Cellular Proliferation Alters Glutamine Transport and Metabolism in Human Hepatoma Cells. Ann. Surg. 1994, 220, 411–424. [Google Scholar] [CrossRef]
- Gallagher, F.A.; Kettunen, M.; Day, S.E.; Lerche, M.H.; Brindle, K.M. 13C MR spectroscopy measurements of glutaminase activity in human hepatocellular carcinoma cells using hyperpolarized13C-labeled glutamine. Magn. Reson. Med. 2008, 60, 253–257. [Google Scholar] [CrossRef]
- Gatenby, R.A.; Gawlinski, E.T.; Gmitro, A.F.; Kaylor, B.; Gillies, R. Acid-Mediated Tumor Invasion: A Multidisciplinary Study. Cancer Res. 2006, 66, 5216–5223. [Google Scholar] [CrossRef] [Green Version]
- Estrella, V.; Chen, T.; Lloyd, M.; Wojtkowiak, J.; Cornnell, H.H.; Ibrahim-Hashim, A.; Bailey, K.; Balagurunathan, Y.; Rothberg, J.M.; Sloane, B.F.; et al. Acidity Generated by the Tumor Microenvironment Drives Local Invasion. Cancer Res. 2013, 73, 1524–1535. [Google Scholar] [CrossRef] [Green Version]
- Shi, Q.; Le, X.; Wang, B.; Abbruzzese, J.L.; Xiong, Q.; He, Y.; Xie, K. Regulation of vascular endothelial growth factor expression by acidosis in human cancer cells. Oncogene 2001, 20, 3751–3756. [Google Scholar] [CrossRef] [Green Version]
- Robey, I.F.; Baggett, B.K.; Kirkpatrick, N.D.; Roe, D.J.; Dosescu, J.; Sloane, B.F.; Hashim, A.I.; Morse, D.L.; Raghunand, N.; Gatenby, R.A.; et al. Bicarbonate Increases Tumor pH and Inhibits Spontaneous Metastases. Cancer Res. 2009, 69, 2260–2268. [Google Scholar] [CrossRef] [PubMed] [Green Version]
- Gerweck, L.E.; Kozin, S.V.; Stocks, S.J. The pH partition theory predicts the accumulation and toxicity of doxorubicin in normal and low-pH-adapted cells. Br. J. Cancer 1999, 79, 838–842. [Google Scholar] [CrossRef] [Green Version]
- Raghunand, N.; He, X.; Van Sluis, R.; Mahoney, B.; Baggett, B.; Taylor, C.W.; Paine-Murrieta, G.; Roe, D.; Bhujwalla, Z.M.; Gillies, R. Enhancement of chemotherapy by manipulation of tumour pH. Br. J. Cancer 1999, 80, 1005–1011. [Google Scholar] [CrossRef] [Green Version]
- Zheng, G.; Peng, C.; Jia, X.; Guopei, Z.; Zhang, Z.; Deng, Y.; Wang, C.; Hailin, T.; Yingen, D.; Liu, X.; et al. ZEB1 transcriptionally regulated carbonic anhydrase 9 mediates the chemoresistance of tongue cancer via maintaining intracellular pH. Mol. Cancer 2015, 14, 1–12. [Google Scholar] [CrossRef] [PubMed] [Green Version]
- Pastorekova, S.; Zatovicova, M. Cancer-Associated Carbonic Anhydrases and Their Inhibition. Curr. Pharm. Des. 2008, 14, 685–698. [Google Scholar] [CrossRef]
- Counillon, L.; Bouret, Y.; Marchiq, I.; Pouyssegur, J. Na(+)/H(+) antiporter (NHE1) and lactate/H(+) symporters (MCTs) in pH homeostasis and cancer metabolism. Biochim. Biophys. Acta (BBA) Mol. Cell Res. 2016, 1863, 2465–2480. [Google Scholar] [CrossRef] [PubMed]
- Cong, D.; Zhu, W.; Shi, Y.; Pointer, K.B.; Clark, P.A.; Shen, H.; Kuo, J.S.; Hu, S.; Sun, D. Upregulation of NHE1 protein expression enables glioblastoma cells to escape TMZ-mediated toxicity via increased H⁺ extrusion, cell migration and survival. Carcinogenesis 2014, 35, 2014–2024. [Google Scholar] [CrossRef] [PubMed] [Green Version]
- Chen, L.Q.; Howison, C.M.; Jeffery, J.J.; Robey, I.F.; Kuo, P.H.; Pagel, M.D. Evaluations of extracellular pH within in vivo tumors using acidoCEST MRI. Magn. Reson. Med. 2014, 72, 1408–1417. [Google Scholar] [CrossRef] [Green Version]
- Bian, Y.; Guo, D. Targeted Therapy for Hepatocellular Carcinoma: Co-Delivery of Sorafenib and Curcumin Using Lactosylated pH-Responsive Nanoparticles. Drug Des. Dev. Ther. 2020, 14, 647–659. [Google Scholar] [CrossRef] [PubMed] [Green Version]
- Huber, V.; Camisaschi, C.; Berzi, A.; Ferro, S.; Lugini, L.; Triulzi, T.; Tuccitto, A.; Tagliabue, E.; Castelli, C.; Rivoltini, L. Cancer acidity: An ultimate frontier of tumor immune escape and a novel target of immunomodulation. Semin. Cancer Biol. 2017, 43, 74–89. [Google Scholar] [CrossRef] [PubMed]
- Chiu, D.K.-C.; Tse, A.P.-W.; Law, C.-T.; Xu, I.M.-J.; Lee, D.; Chen, M.; Lai, R.K.-H.; Yuen, V.W.-H.; Cheu, J.W.-S.; Ho, D.W.H.; et al. Hypoxia regulates the mitochondrial activity of hepatocellular carcinoma cells through HIF/HEY1/PINK1 pathway. Cell Death Dis. 2019, 10, 1–16. [Google Scholar] [CrossRef]
- Chen, C.; Lou, T. Hypoxia inducible factors in hepatocellular carcinoma. Oncotarget 2017, 8, 46691–46703. [Google Scholar] [CrossRef] [PubMed] [Green Version]
- Luo, D.; Wang, Z.; Wu, J.; Jiang, C.; Wu, J. The Role of Hypoxia Inducible Factor-1 in Hepatocellular Carcinoma. BioMed Res. Int. 2014, 2014, 1–11. [Google Scholar] [CrossRef] [PubMed]
- Semenza, G.L. Cancer–stromal cell interactions mediated by hypoxia-inducible factors promote angiogenesis, lymphangiogenesis, and metastasis. Oncogene 2012, 32, 4057–4063. [Google Scholar] [CrossRef] [PubMed] [Green Version]
- Muz, B.; de la Puente, P.; Azab, F.; Azab, A.K. The role of hypoxia in cancer progression, angiogenesis, metastasis, and resistance to therapy. Hypoxia 2015, 3, 83–92. [Google Scholar] [CrossRef] [Green Version]
- Marcus, C.; Subramaniam, R.M. Role of Non-FDG-PET/CT in Head and Neck Cancer. Semin. Nucl. Med. 2020, 51, 68–78. [Google Scholar] [CrossRef]
- O’Connor, J.P.B.; Robinson, S.P.; Waterton, J.C. Imaging tumour hypoxia with oxygen-enhanced MRI and BOLD MRI. Br. J. Radiol. 2019, 92, 20180642. [Google Scholar] [CrossRef] [PubMed]
- Bane, O.; Besa, C.; Wagner, M.; Oesingmann, N.; Zhu, H.; Fiel, M.I.; Taouli, B. Feasibility and reproducibility of BOLD and TOLD measurements in the liver with oxygen and carbogen gas challenge in healthy volunteers and patients with hepatocellular carcinoma. J. Magn. Reson. Imaging 2016, 43, 866–876. [Google Scholar] [CrossRef] [Green Version]
- Rhee, T.K.; Larson, A.C.; Prasad, P.V.; Santos, E.; Sato, K.T.; Salem, R.; Deng, J.; Paunesku, T.; Woloschak, G.E.; Mulcahy, M.F.; et al. Feasibility of Blood Oxygenation Level–dependent MR Imaging to Monitor Hepatic Transcatheter Arterial Embolization in Rabbits. J. Vasc. Interv. Radiol. 2005, 16, 1523–1528. [Google Scholar] [CrossRef]
- Rojas, A.; Anazco, C.; González, I.; Araya, P. Extracellular matrix glycation and receptor for advanced glycation end-products activation: A missing piece in the puzzle of the association between diabetes and cancer. Carcinogenesis 2018, 39, 515–521. [Google Scholar] [CrossRef]
- Winkler, J.; Abisoye-Ogunniyan, A.; Metcalf, K.J.; Werb, Z. Concepts of extracellular matrix remodelling in tumour progression and metastasis. Nat. Commun. 2020, 11, 5120. [Google Scholar] [CrossRef]
- Haruyama, Y.; Kataoka, H. Glypican-3 is a prognostic factor and an immunotherapeutic target in hepatocellular carcinoma. World J. Gastroenterol. 2016, 22, 275–283. [Google Scholar] [CrossRef] [PubMed]
- Baumhoer, D.; Tornillo, L.; Stadlmann, S.; Roncalli, M.; Diamantis, E.K.; Terracciano, L.M. Glypican 3 expression in human nonneoplastic, preneoplastic, and neoplastic tissues: A tissue microarray analysis of 4387 tissue samples. Am. J. Clin. Pathol. 2008, 129, 899–906. [Google Scholar] [CrossRef] [PubMed] [Green Version]
- Zhou, F.; Shang, W.; Yu, X.; Tian, J. Glypican-3: A promising biomarker for hepatocellular carcinoma diagnosis and treatment. Med. Res. Rev. 2018, 38, 741–767. [Google Scholar] [CrossRef] [PubMed]
- Kolluri, A.; Ho, M. The Role of Glypican-3 in Regulating Wnt, YAP, and Hedgehog in Liver Cancer. Front. Oncol. 2019, 9, 708. [Google Scholar] [CrossRef] [PubMed]
- Capurro, M.; Xiang, Y.-Y.; Lobe, C.; Filmus, J. Glypican-3 Promotes the Growth of Hepatocellular Carcinoma by Stimulating Canonical Wnt Signaling. Cancer Res. 2005, 65, 6245–6254. [Google Scholar] [CrossRef] [Green Version]
- Akutsu, N.; Yamamoto, H.; Sasaki, S.; Taniguchi, H.; Arimura, Y.; Imai, K.; Shinomura, Y. Association of glypican-3 expression with growth signaling molecules in hepatocellular carcinoma. World J. Gastroenterol. 2010, 16, 3521–3528. [Google Scholar] [CrossRef]
- Midorikawa, Y.; Ishikawa, S.; Iwanari, H.; Imamura, T.; Sakamoto, H.; Miyazono, K.; Kodama, T.; Makuuchi, M.; Aburatani, H. Glypican-3, overexpressed in hepatocellular carcinoma, modulates FGF2 and BMP-7 signaling. Int. J. Cancer 2003, 103, 455–465. [Google Scholar] [CrossRef] [PubMed]
- Takai, H.; Kato, A.; Kato, C.; Watanabe, T.; Matsubara, K.; Suzuki, M.; Kataoka, H. The expression profile of glypican-3 and its relation to macrophage population in human hepatocellular carcinoma. Liver Int. 2009, 29, 1056–1064. [Google Scholar] [CrossRef] [PubMed]
- Takai, H.; Ashihara, M.; Ishiguro, T.; Terashima, H.; Watanabe, T.; Kato, A.; Suzuki, M. Involvement of glypican-3 in the recruitment of M2-polarized tumor-associated macrophages in hepatocellular carcinoma. Cancer Biol. Ther. 2009, 8, 2329–2338. [Google Scholar] [CrossRef] [Green Version]
- Qi, X.-H.; Wu, D.; Cui, H.-X.; Ma, N.; Su, J.; Wang, Y.-T.; Jiang, Y.-H. Silencing of the glypican-3 gene affects the biological behavior of human hepatocellular carcinoma cells. Mol. Med. Rep. 2014, 10, 3177–3184. [Google Scholar] [CrossRef] [PubMed]
- Wu, Y.; Liu, H.; Weng, H.; Zhang, X.; Li, P.; Fan, C.-L.; Li, B.; Dong, P.-L.; Li, L.; Dooley, S.; et al. Glypican-3 promotes epithelial-mesenchymal transition of hepatocellular carcinoma cells through ERK signaling pathway. Int. J. Oncol. 2015, 46, 1275–1285. [Google Scholar] [CrossRef] [Green Version]
- Zhang, Z.; Li, Y.; Chen, Z.; Li, F.; Wang, J. Preparation and in vitro studies of MRI-specific superparamagnetic iron oxide antiGPC3 probe for hepatocellular carcinoma. Int. J. Nanomed. 2012, 7, 4593–4611. [Google Scholar] [CrossRef] [Green Version]
- Park, J.O.; Stephen, Z.; Sun, C.; Veiseh, O.; Kievit, F.M.; Fang, C.; Leung, M.; Mok, H.; Zhang, M. Glypican-3 Targeting of Liver Cancer Cells Using Multifunctional Nanoparticles. Mol. Imaging 2011, 10, 69–77. [Google Scholar] [CrossRef] [PubMed]
- Yu, L.-X.; Ling, Y.; Wang, H.-Y. Role of nonresolving inflammation in hepatocellular carcinoma development and progression. NPJ Precis. Oncol. 2018, 2, 1–10. [Google Scholar] [CrossRef] [Green Version]
- Buck, M.; O’Sullivan, D.; Pearce, E.L. T cell metabolism drives immunity. J. Exp. Med. 2015, 212, 1345–1360. [Google Scholar] [CrossRef] [Green Version]
- Pearce, E.L.; Poffenberger, M.C.; Chang, C.-H.; Jones, R.G. Fueling Immunity: Insights into Metabolism and Lymphocyte Function. Science 2013, 342, 1242454. [Google Scholar] [CrossRef] [PubMed] [Green Version]
- O’Neill, L.A.; Pearce, E.J. Immunometabolism governs dendritic cell and macrophage function. J. Exp. Med. 2016, 213, 15–23. [Google Scholar] [CrossRef] [PubMed]
- Lardner, A. The effects of extracellular pH on immune function. J. Leukoc. Biol. 2001, 69, 522–530. [Google Scholar]
- Noman, M.Z.; Hasmim, M.; Messai, Y.; Terry, S.; Kieda, C.; Janji, B.; Chouaib, S. Hypoxia: A key player in antitumor immune response. A Review in the Theme: Cellular Responses to Hypoxia. American journal of physiology. Cell Physiol. 2015, 309, C569–C579. [Google Scholar] [CrossRef] [Green Version]
- Mantovani, A.; Allavena, P.; Sica, A.; Balkwill, F. Cancer-related inflammation. Nat. Cell Biol. 2008, 454, 436–444. [Google Scholar] [CrossRef] [PubMed]
- Ruffell, B.; Coussens, L.M. Macrophages and Therapeutic Resistance in Cancer. Cancer Cell 2015, 27, 462–472. [Google Scholar] [CrossRef] [PubMed] [Green Version]
- Colegio, O.R.; Chu, N.-Q.; Szabo, A.L.; Chu, T.; Rhebergen, A.M.; Jairam, V.; Cyrus, N.; Brokowski, C.E.; Eisenbarth, S.C.; Phillips, G.M.; et al. Functional polarization of tumour-associated macrophages by tumour-derived lactic acid. Nature 2014, 513, 559–563. [Google Scholar] [CrossRef] [PubMed]
- Shirabe, K.; Mano, Y.; Muto, J.; Matono, R.; Motomura, T.; Toshima, T.; Takeishi, K.; Uchiyama, H.; Yoshizumi, T.; Taketomi, A.; et al. Role of tumor-associated macrophages in the progression of hepatocellular carcinoma. Surg. Today 2011, 42, 1–7. [Google Scholar] [CrossRef] [PubMed]
- Ding, W.; Tan, Y.; Qian, Y.; Xue, W.; Wang, Y.; Jiang, P.; Xu, X. Clinicopathologic and prognostic significance of tumor-associated macrophages in patients with hepatocellular carcinoma: A meta-analysis. PLoS ONE 2019, 14, e0223971. [Google Scholar] [CrossRef]
- Serkova, N.J. Nanoparticle-Based Magnetic Resonance Imaging on Tumor-Associated Macrophages and Inflammation. Front. Immunol. 2017, 8, 590. [Google Scholar] [CrossRef]
- Poller, W.C.; Löwa, N.; Schleicher, M.; Münster-Wandowski, A.; Taupitz, M.; Stangl, V.; Ludwig, A.; Wiekhorst, F. Initial interaction of citrate-coated iron oxide nanoparticles with the glycocalyx of THP-1 monocytes assessed by real-time magnetic particle spectroscopy and electron microscopy. Sci. Rep. 2020, 10, 1–9. [Google Scholar] [CrossRef] [Green Version]
- Sheu, A.Y.; Zhang, Z.; Omary, R.A.; Larson, A.C. MRI-monitored transcatheter intra-arterial delivery of SPIO-labeled natural killer cells to hepatocellular carcinoma: Preclinical studies in a rodent model. Investig. Radiol. 2013, 48, 492–499. [Google Scholar] [CrossRef] [PubMed]
- Luo, X.; Peng, X.; Hou, J.; Wu, S.; Shen, J.; Wang, L. Folic acid-functionalized polyethylenimine superparamagnetic iron oxide nanoparticles as theranostic agents for magnetic resonance imaging and PD-L1 siRNA delivery for gastric cancer. Int. J. Nanomed. 2017, 12, 5331–5343. [Google Scholar] [CrossRef] [Green Version]
Figure 1.
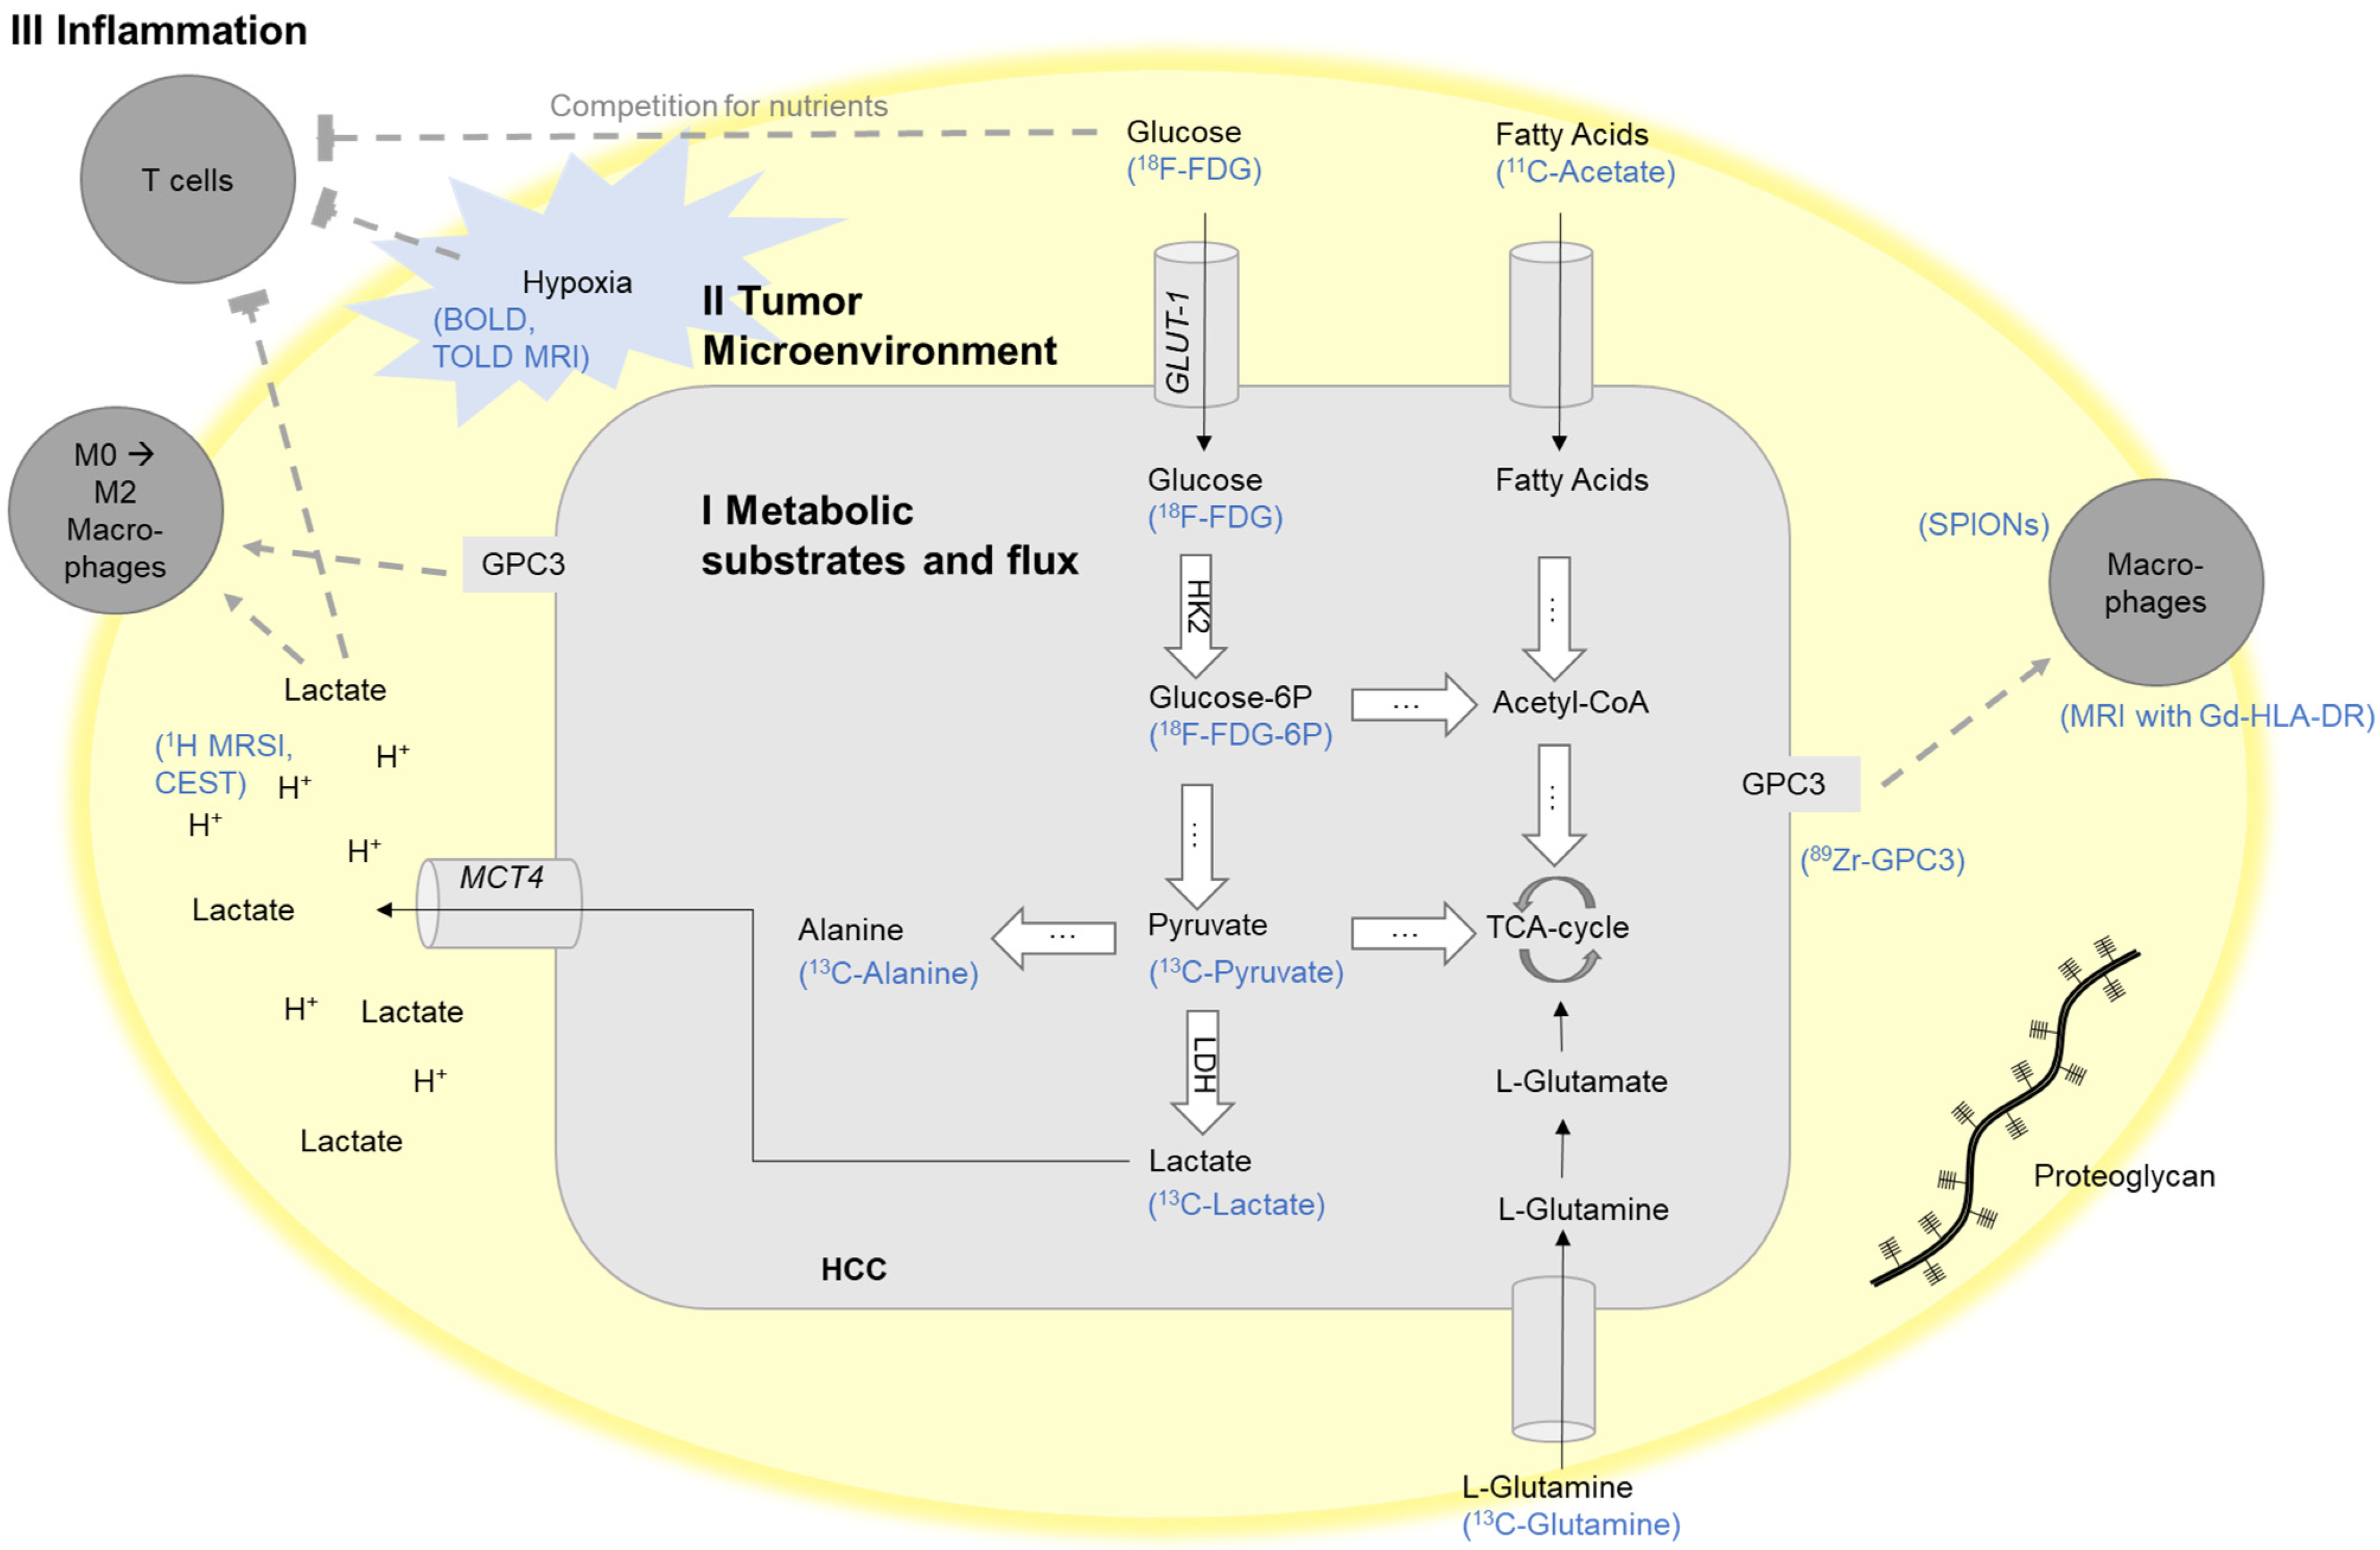
Schematic illustration of exemplary targets for the imaging of the crosstalk between the tumor cells and their tumor microenvironment mediated through tumor metabolism. BOLD, blood-oxygen-level-dependent MRI; CEST, chemical exchange saturation transfer; FDG, fluorodeoxyglucose; Gd-HLA-DR, gadolinium-conjugated antibodies against HLA-DR; HK-2, hexokinase-2; GAG, glycosaminoglycan; Glucose-6P, Glucose-6-phosphate; GLUT1, glucose transporter 1; GPC3, glypican-3; HCC, hepatocellular carcinoma; LDH, lactate dehydrogenase; MCT4, monocarboxylate transporter 4; MRI, magnetic resonance imaging; MRSI, magnetic resonance spectroscopic imaging; SPIONs, superparamagnetic iron oxide nanoparticles; TCA-cycle, tricarboxylic acid cycle; TOLD, tissue oxygenation level-dependent MRI. Adapted and modified from [37].
Figure 1.
Schematic illustration of exemplary targets for the imaging of the crosstalk between the tumor cells and their tumor microenvironment mediated through tumor metabolism. BOLD, blood-oxygen-level-dependent MRI; CEST, chemical exchange saturation transfer; FDG, fluorodeoxyglucose; Gd-HLA-DR, gadolinium-conjugated antibodies against HLA-DR; HK-2, hexokinase-2; GAG, glycosaminoglycan; Glucose-6P, Glucose-6-phosphate; GLUT1, glucose transporter 1; GPC3, glypican-3; HCC, hepatocellular carcinoma; LDH, lactate dehydrogenase; MCT4, monocarboxylate transporter 4; MRI, magnetic resonance imaging; MRSI, magnetic resonance spectroscopic imaging; SPIONs, superparamagnetic iron oxide nanoparticles; TCA-cycle, tricarboxylic acid cycle; TOLD, tissue oxygenation level-dependent MRI. Adapted and modified from [37].

Figure 2.
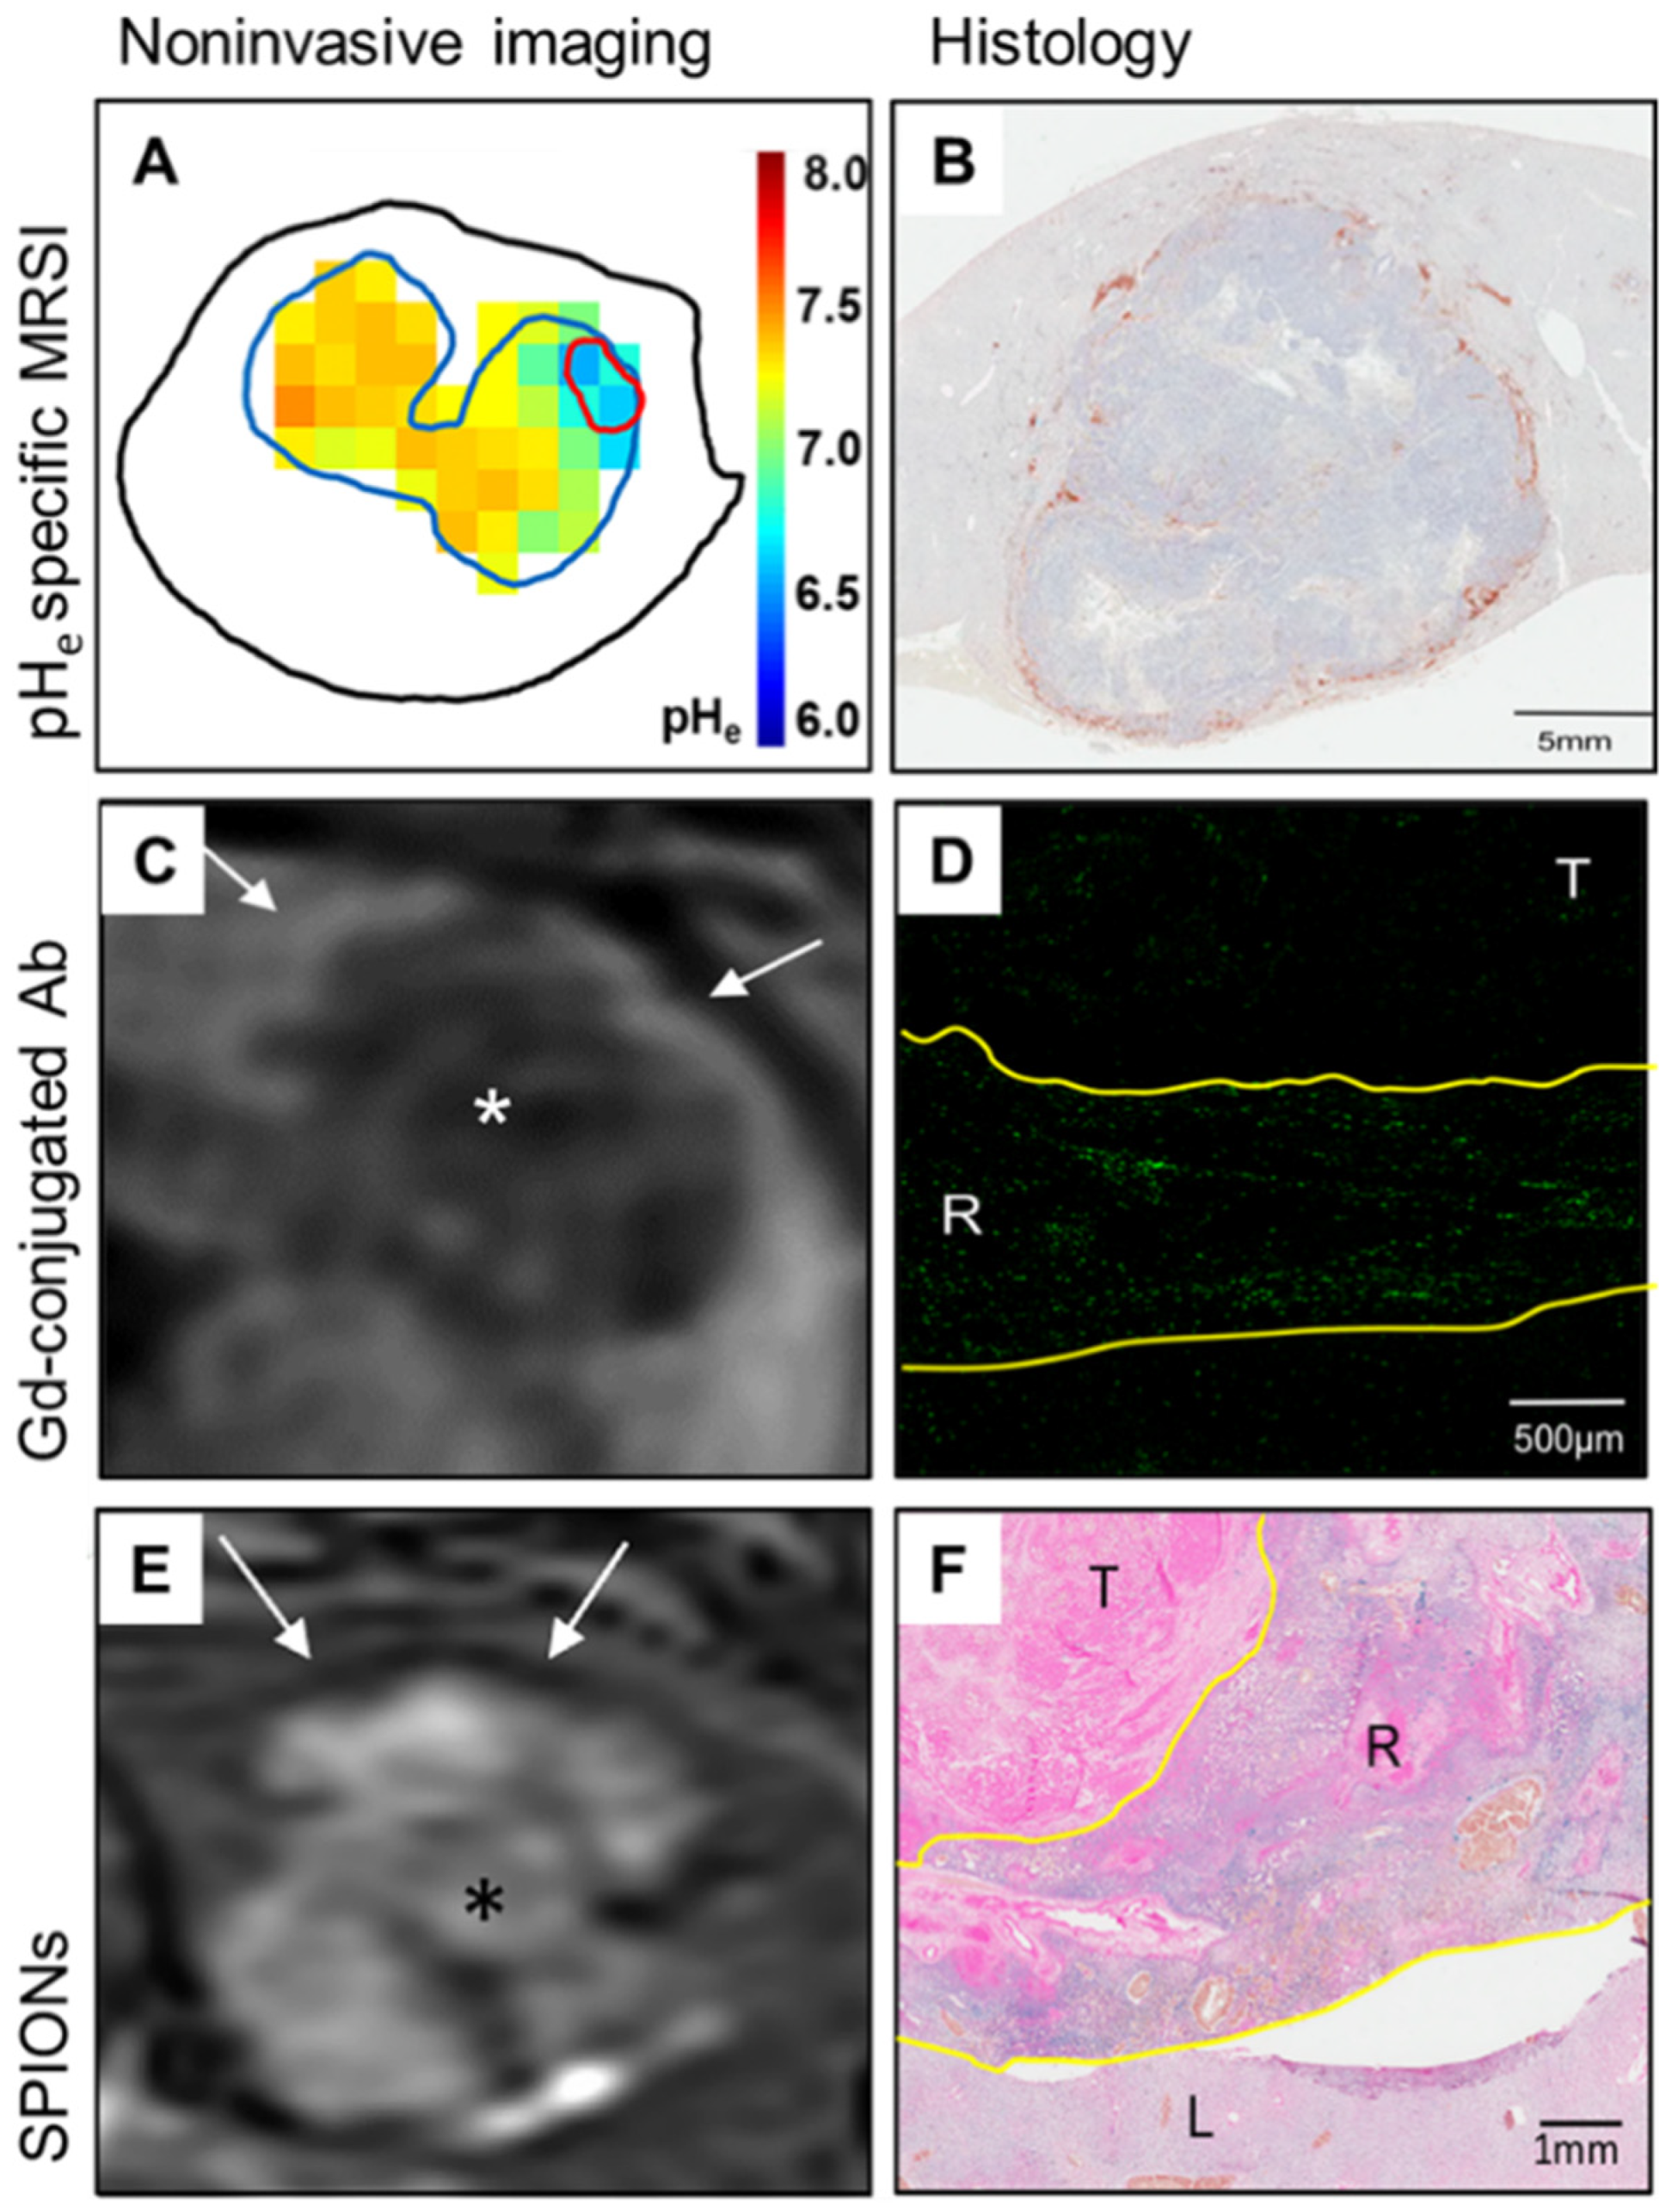
Imaging of the immuno-metabolic crosstalk in a translational rabbit liver tumor model. (A) Non-invasive quantitative mapping of the extracellular pH (pHe) using pHe-specific magnetic resonance spectroscopy imaging (MRSI) reveals significantly lower tumor pHe as compared to the liver parenchyma. (B) Immunohistochemistry staining of HLA-DR on antigen-presenting cells demonstrates peritumoral immune cell clusters and lacking intratumoral infiltration. (C) T1-weighted MR imaging (MRI) after the injection of gadolinium (Gd)-conjugated HLA-DR antibodies (Ab) shows corresponding peritumoral rim enhancement in vivo. (D) Ex vivo imaging mass cytometry confirms localization of the labeled immune cells in the peritumoral rim in green, (E) T2-weighted MRI with superparamagnetic iron oxide nanoparticles (SPIONs) demonstrates hypointense signal indicative of macrophage infiltration in the peritumoral rim. (F) Ex vivo Prussian blue staining confirms corresponding iron deposition in the peritumoral rim. T, tumor; R, tumoral rim; L, liver parenchyma; white arrows, signal alterations at the tumoral rim; *, tumor. Adapted and modified from [34].
Figure 2.
Imaging of the immuno-metabolic crosstalk in a translational rabbit liver tumor model. (A) Non-invasive quantitative mapping of the extracellular pH (pHe) using pHe-specific magnetic resonance spectroscopy imaging (MRSI) reveals significantly lower tumor pHe as compared to the liver parenchyma. (B) Immunohistochemistry staining of HLA-DR on antigen-presenting cells demonstrates peritumoral immune cell clusters and lacking intratumoral infiltration. (C) T1-weighted MR imaging (MRI) after the injection of gadolinium (Gd)-conjugated HLA-DR antibodies (Ab) shows corresponding peritumoral rim enhancement in vivo. (D) Ex vivo imaging mass cytometry confirms localization of the labeled immune cells in the peritumoral rim in green, (E) T2-weighted MRI with superparamagnetic iron oxide nanoparticles (SPIONs) demonstrates hypointense signal indicative of macrophage infiltration in the peritumoral rim. (F) Ex vivo Prussian blue staining confirms corresponding iron deposition in the peritumoral rim. T, tumor; R, tumoral rim; L, liver parenchyma; white arrows, signal alterations at the tumoral rim; *, tumor. Adapted and modified from [34].


Table 1.
Overview of imaging techniques targeting the crosstalk between the tumor cells and their tumor microenvironment mediated through tumor metabolism and their level of evidence and clinical translation in HCC. BOLD, blood-oxygen-level-dependent MRI; CEST, chemical exchange saturation transfer; ECM, extracellular matrix; FDG, fluorodeoxyglucose; Gd-HLA-DR, gadolinium-conjugated antibodies against HLA-DR; GPC3, glypican-3; HCC, hepatocellular carcinoma; MRI, magnetic resonance imaging; MRSI, magnetic resonance spectroscopic imaging; PET, positron emission computed tomography; SPIONs, superparamagnetic iron oxide nanoparticles; TOLD, tissue oxygenation level-dependent MRI.
| Superordinate Imaging Target | Imaging Technique | Imaging Target | Level of Evidence/Clinical Translation | References | |
|---|---|---|---|---|---|
| I Imaging of metabolic substrates and flux | Glycolysis | 18F-FDG-PET | Glucose |
| [17,18] |
| 1-13C- pyruvate MRSI | Pyruvate → Lactate/Alanine |
| [19,20] | ||
| Lipid Metabolism | 11C-choline PET | Choline |
| [21,22] | |
| 11C-acetate PET | Acetate |
| [23,24] | ||
| Amino Acid Metabolism | 5-13C(1)-glutamine MRSI | Glutamine |
| [25] | |
| II Tumor microen- vironment | Extracellular pH | CEST | pH |
| [26,27] |
| BIRDS (MRSI) | pH |
| [5,28] | ||
| acidic pH-triggered drug-release of sorafenib and superparamagnetic iron oxide nanocomposites | Low pH |
| [29] | ||
| 18F-FDG amine PET | pH |
| [30] | ||
| Hypoxia | TOLD / BOLD MRI | Hypoxia |
| [31] | |
| ECM | GPC3- labeled 89Zr PET | ECM/GPC3 |
| [32] | |
| III Inflammation | Immune evasion | SPIONs | Macrophages NK-cells |
| |
| CD8-minibodies PET | CD8 positive T cells |
| [33] | ||
| Immuno-metabolic crosstalk | MRI with Gd-HLA-DR | Antigen-presenting cells |
| [34] | |
Publisher’s Note: MDPI stays neutral with regard to jurisdictional claims in published maps and institutional affiliations. |
© 2021 by the authors. Licensee MDPI, Basel, Switzerland. This article is an open access article distributed under the terms and conditions of the Creative Commons Attribution (CC BY) license (https://creativecommons.org/licenses/by/4.0/).
Share and Cite
MDPI and ACS Style
Schobert, I.T.; Savic, L.J. Current Trends in Non-Invasive Imaging of Interactions in the Liver Tumor Microenvironment Mediated by Tumor Metabolism. Cancers 2021, 13, 3645. https://0-doi-org.brum.beds.ac.uk/10.3390/cancers13153645
AMA Style
Schobert IT, Savic LJ. Current Trends in Non-Invasive Imaging of Interactions in the Liver Tumor Microenvironment Mediated by Tumor Metabolism. Cancers. 2021; 13(15):3645. https://0-doi-org.brum.beds.ac.uk/10.3390/cancers13153645
Chicago/Turabian StyleSchobert, Isabel Theresa, and Lynn Jeanette Savic. 2021. "Current Trends in Non-Invasive Imaging of Interactions in the Liver Tumor Microenvironment Mediated by Tumor Metabolism" Cancers 13, no. 15: 3645. https://0-doi-org.brum.beds.ac.uk/10.3390/cancers13153645
Note that from the first issue of 2016, this journal uses article numbers instead of page numbers. See further details here.