
Ruxolitinib as a Novel Therapeutic Option for Poor Prognosis T-LBL Pediatric Patients

 ,
,  and
and 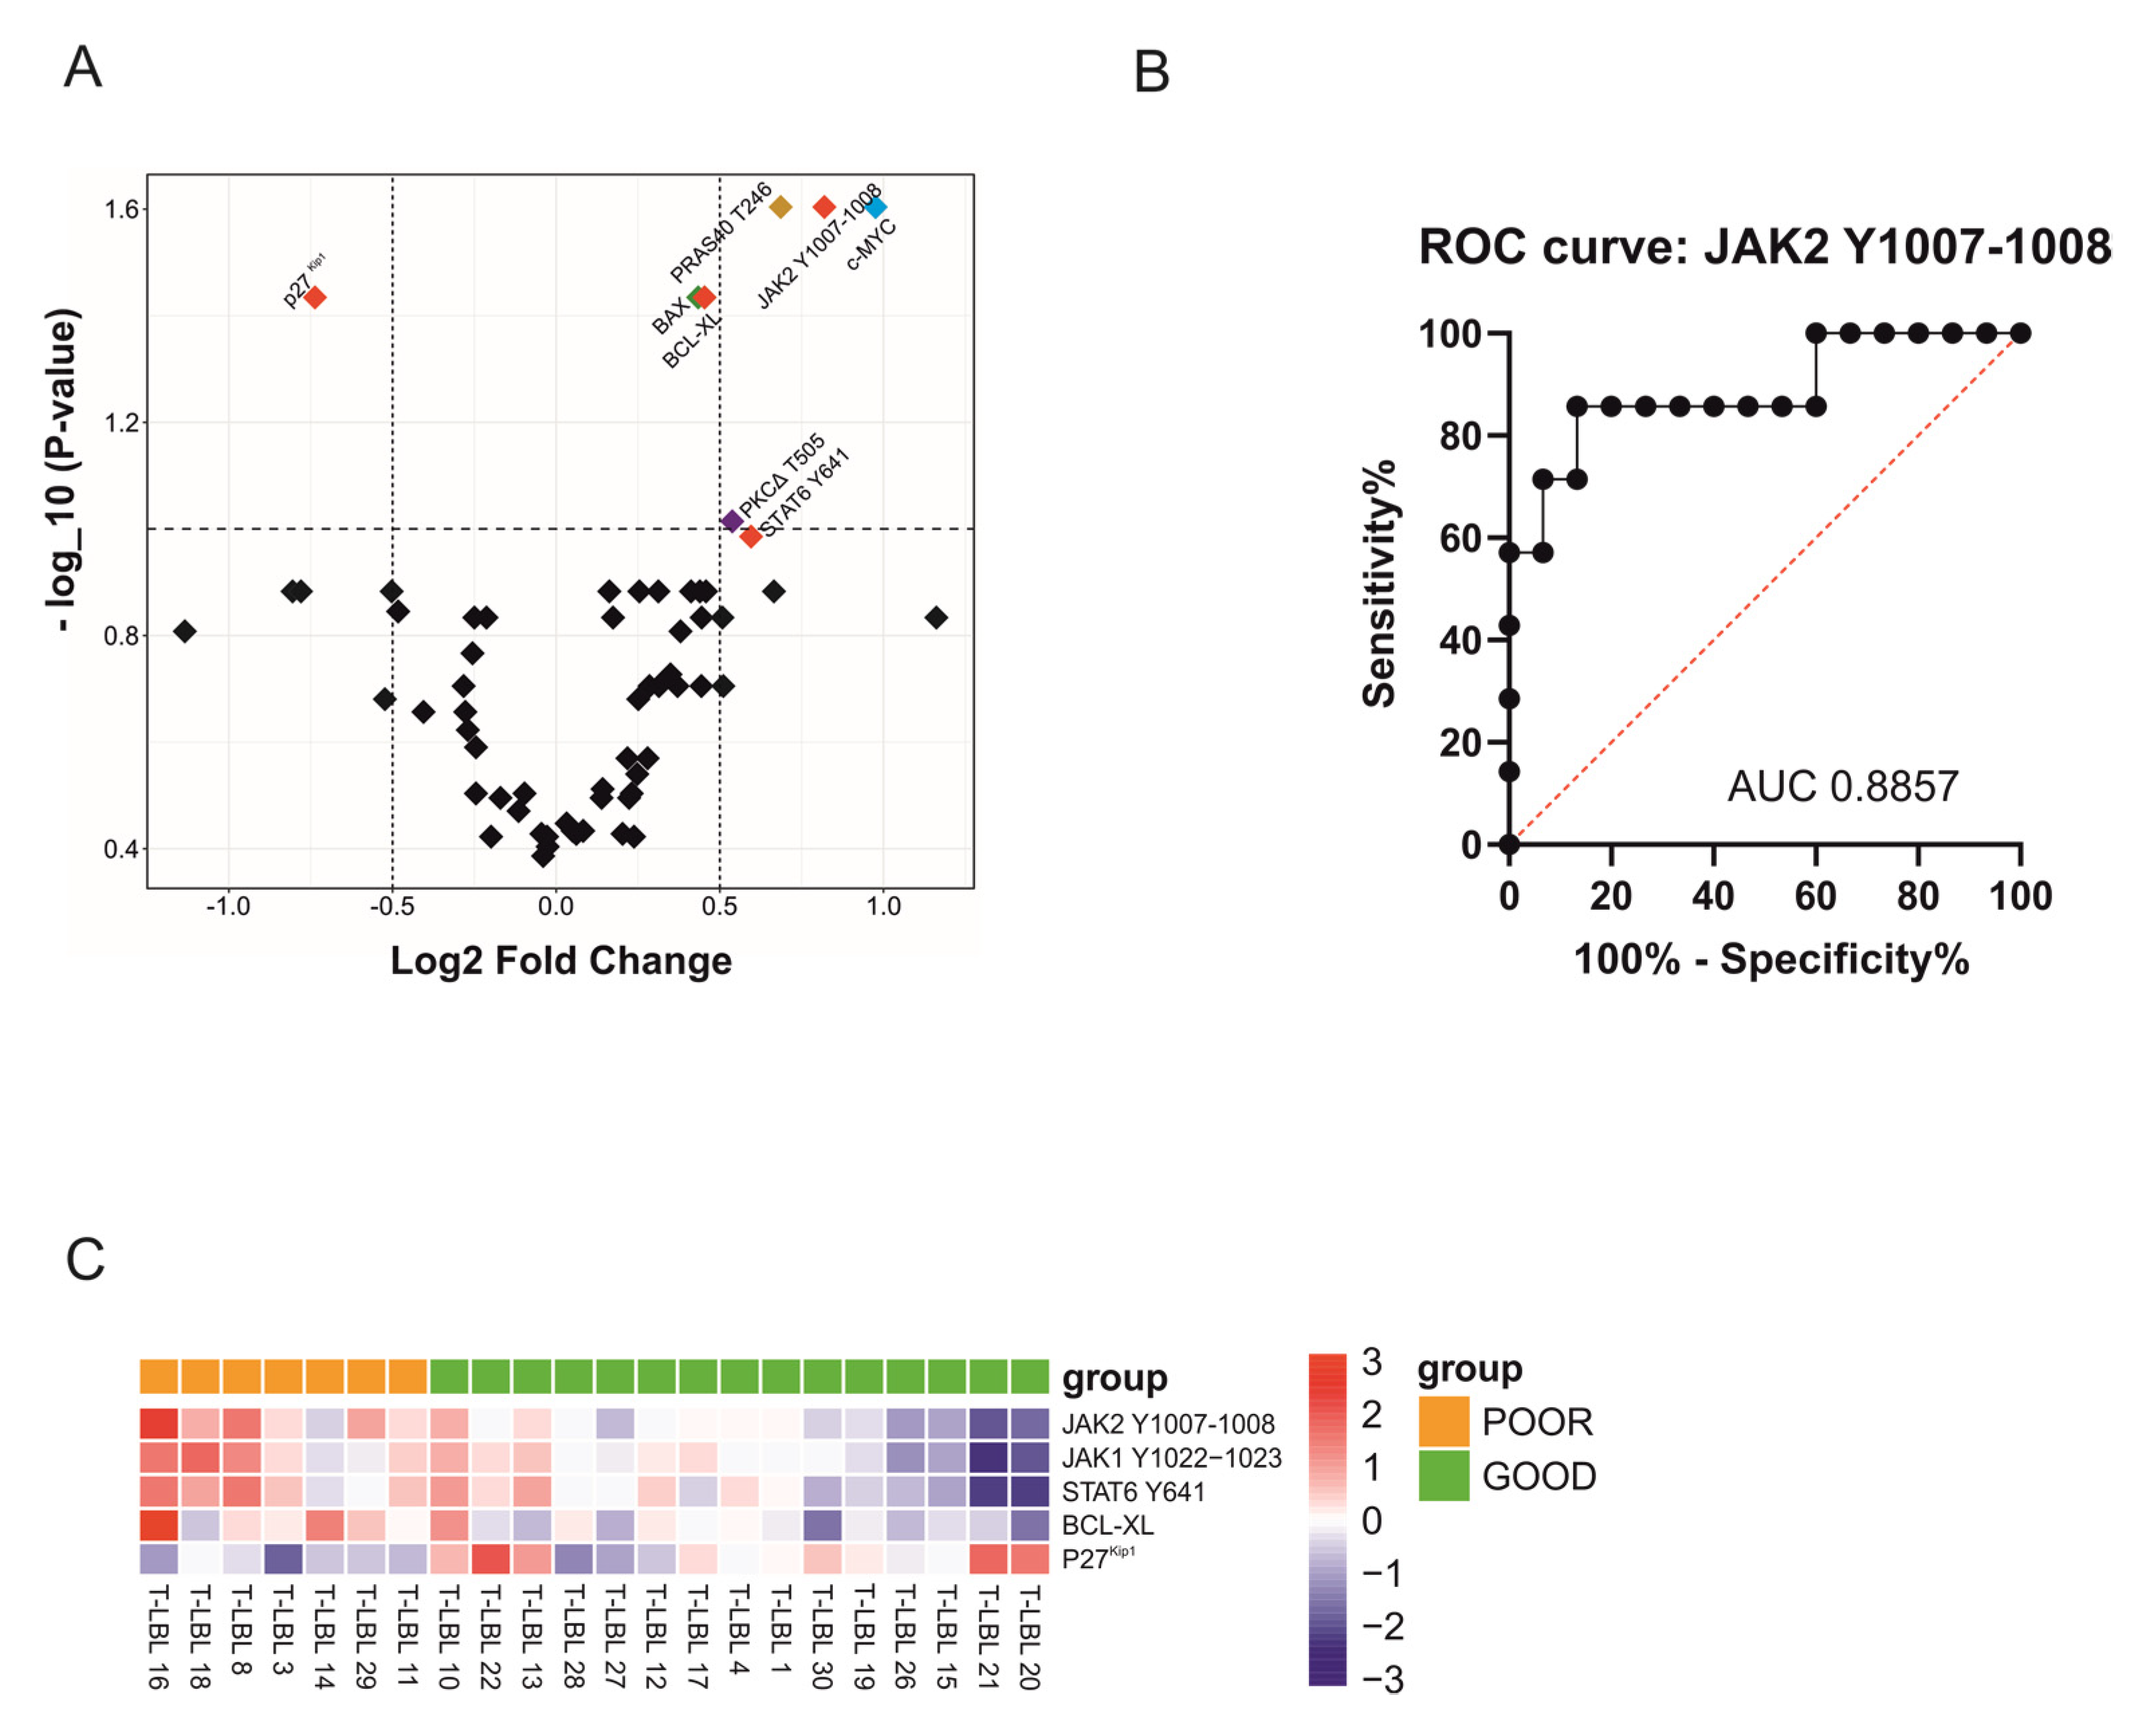
Abstract
:Simple Summary
Abstract
1. Introduction
2. Results
2.1. RPPA Analysis Reveals JAK2 Y1007-1008 as a Potential Biomarker of Poor Prognosis for T-LBL Patients at Diagnosis
2.2. Hyperactivation of JAK1/2-STAT6 Pathway Characterizes T-LBL Pediatric Patients with Poor Prognosis
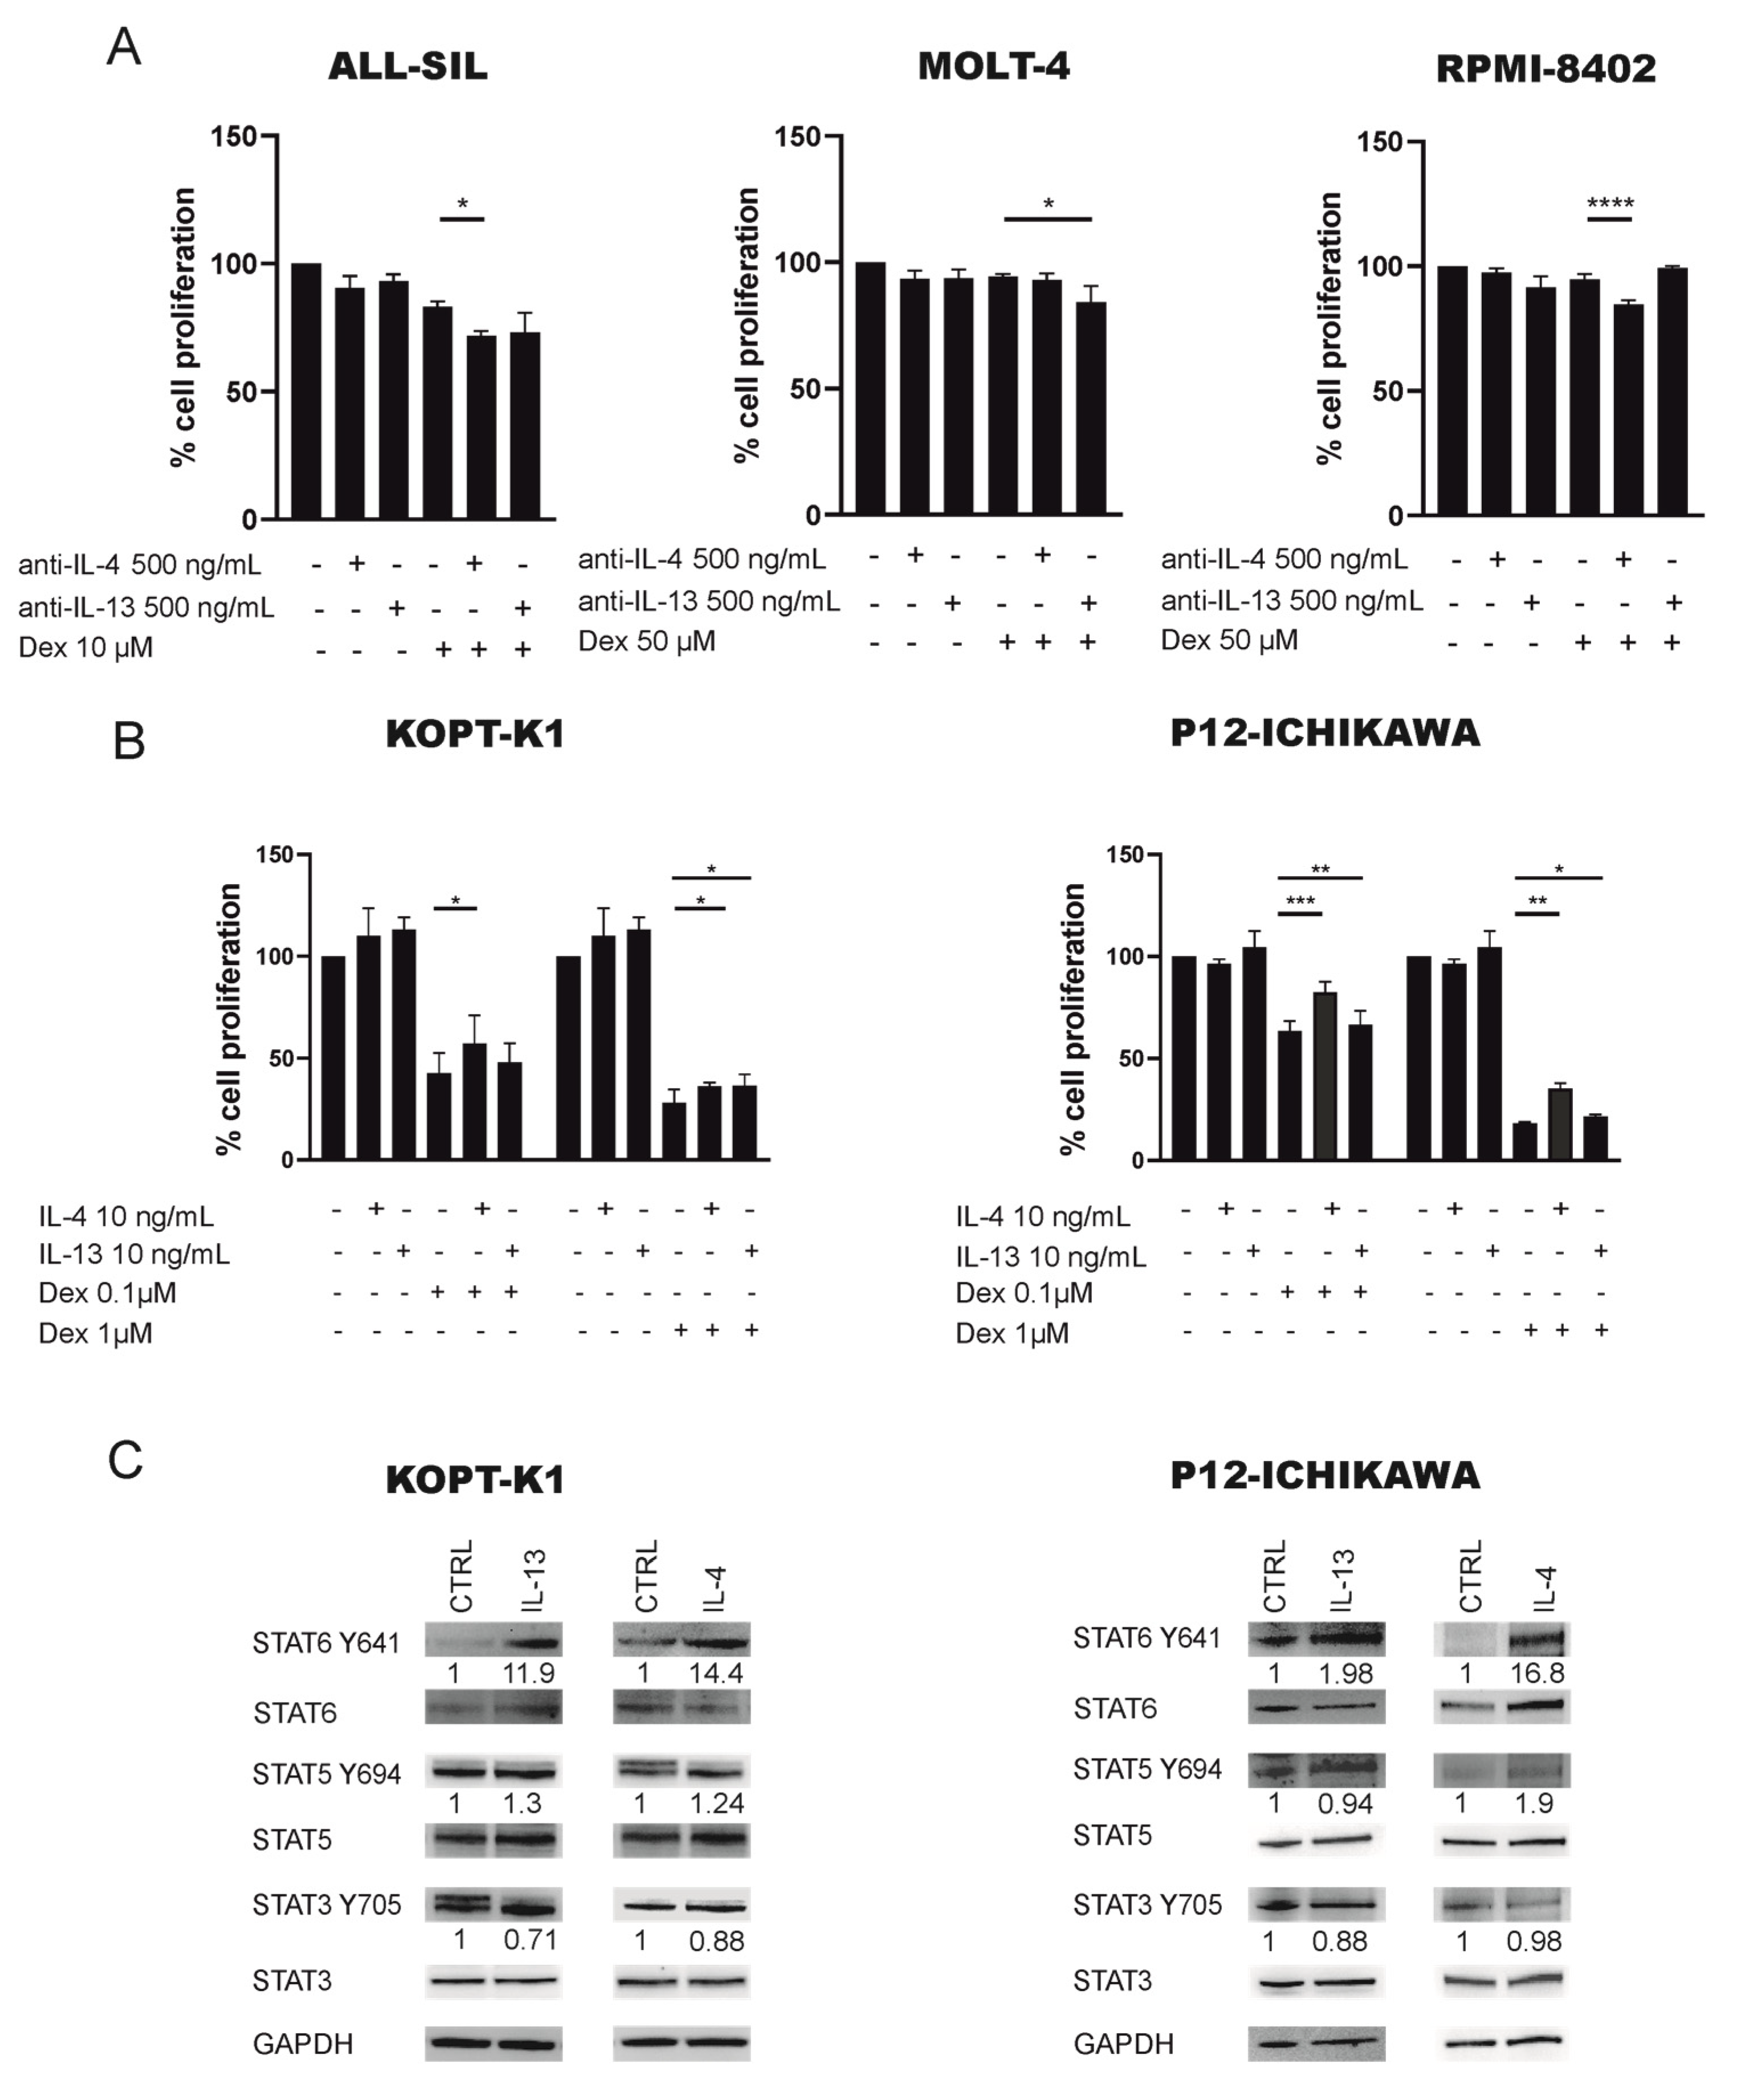
2.3. JAK1/2-STAT6 Pathway Activation by IL-4 Treatment Influences Dexamethasone Response via STAT6
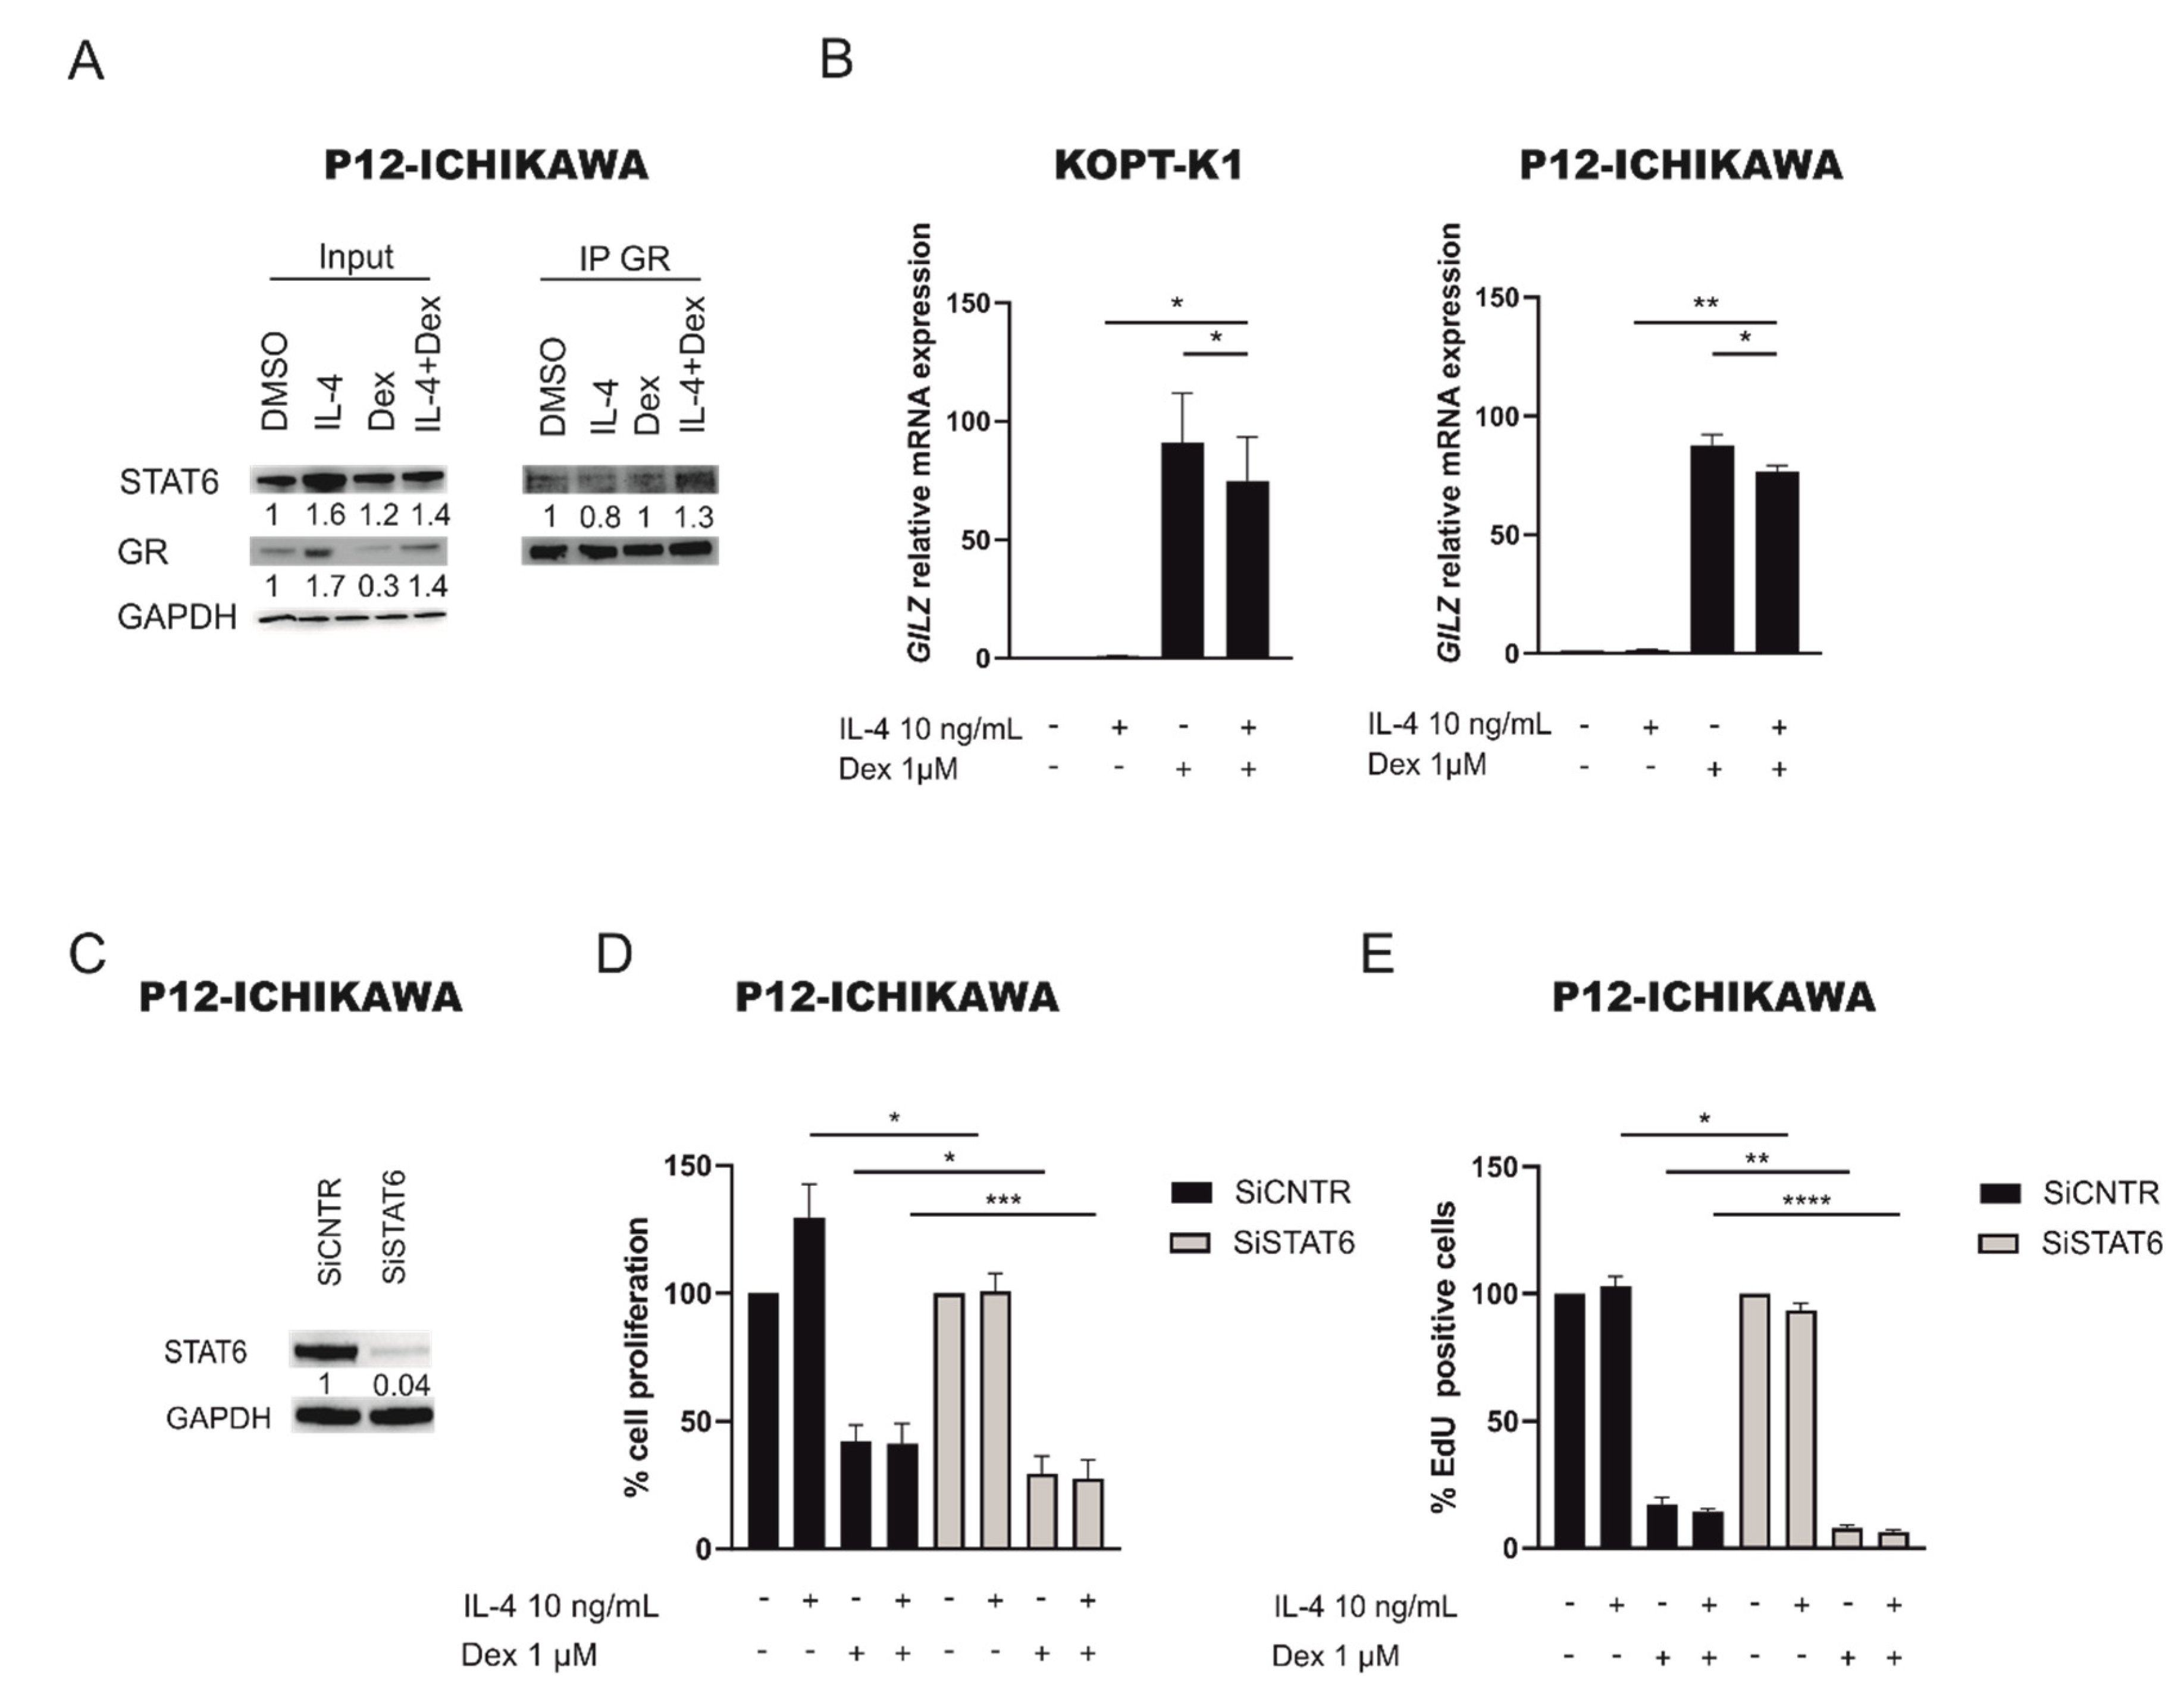
2.4. STAT6 Mediates GC Resistance by Binding GR and Inhibiting Its Transcriptional Activity
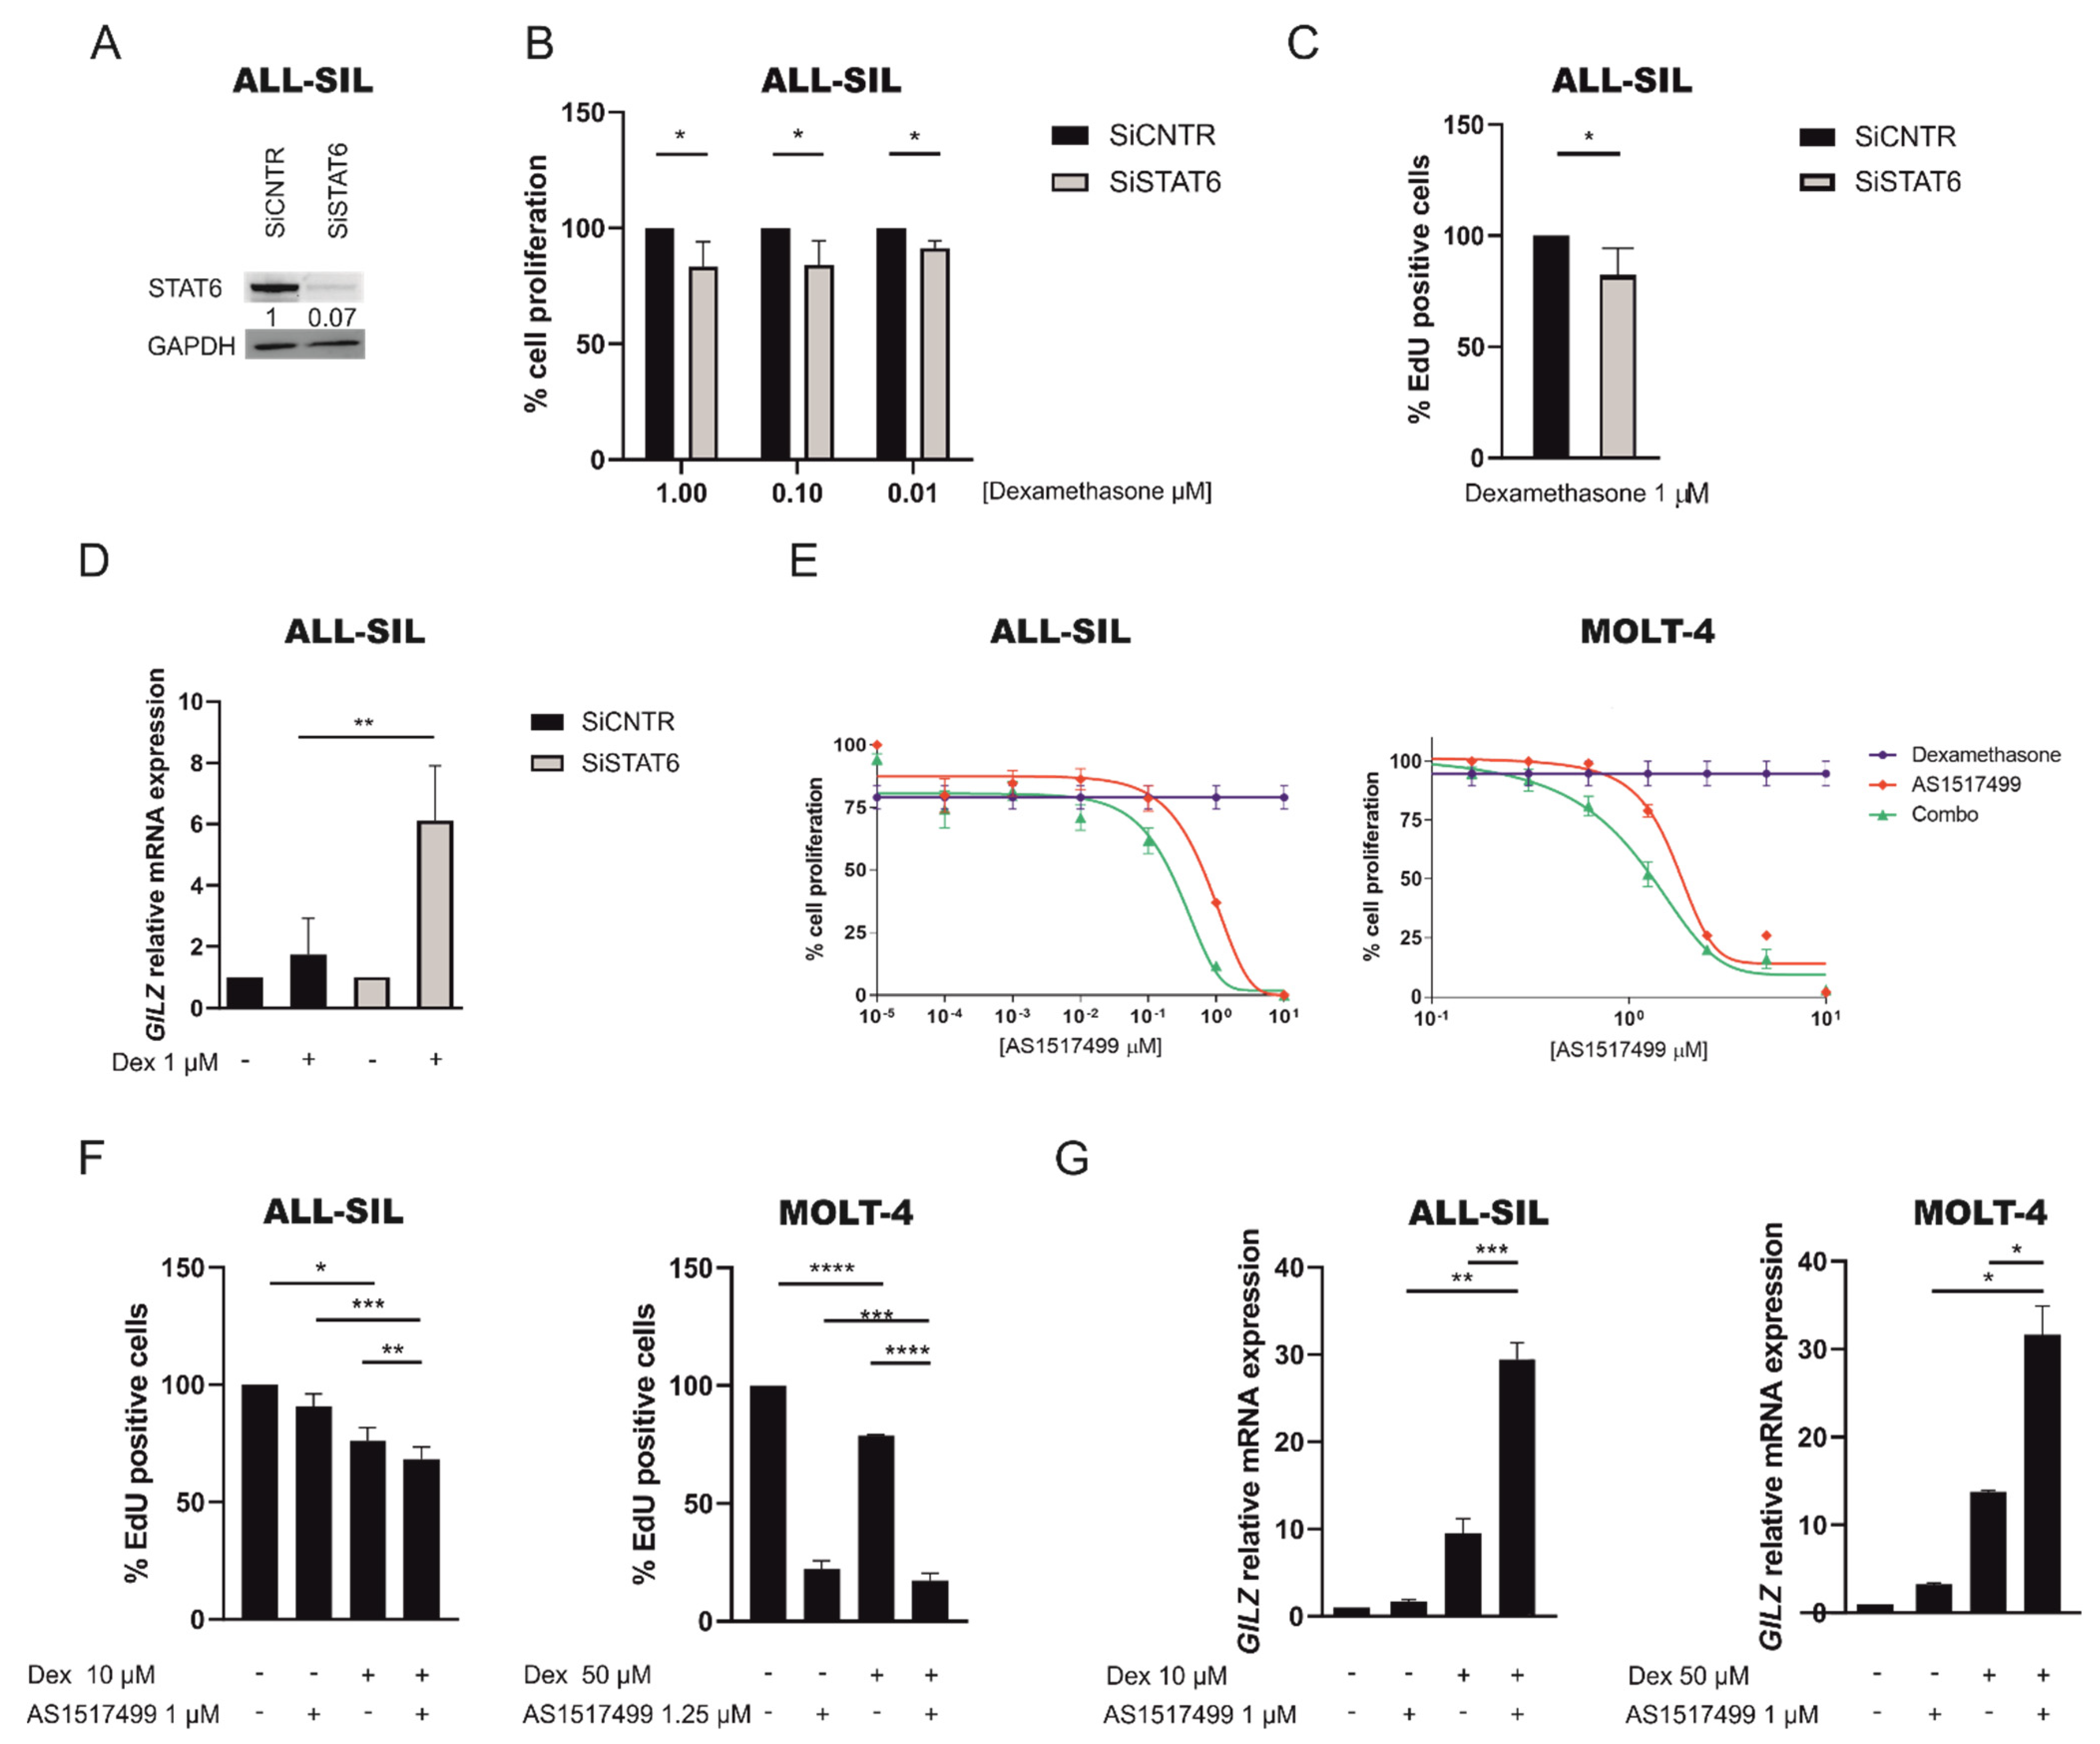
2.5. Inhibition of JAK1/2 by Ruxolitinib Sensitize GC Resistant Cells to Dexamethasone
3. Discussion
4. Material and Methods
4.1. Patients
4.2. Statistics
4.3. Cell Lines
4.4. In Vitro Treatments
4.5. RPPA
4.6. Western Blotting
4.7. RNA Extraction and Quantitative Real Time-PCR
4.8. QRT-PCR for miRNA Detection
4.9. Co-Immunoprecipitation Assay
4.10. STAT6 Specific Gene Silencing
4.11. (3-(4,5-Dimethylthiazol-2-yl)-2,5-diphenyl Tetrazolium Bromide) MTT Assay
4.12. EdU Staining
4.13. Apoptotic Assay
5. Conclusions
Supplementary Materials
Author Contributions
Funding
Institutional Review Board Statement
Informed Consent Statement
Data Availability Statement
Acknowledgments
Conflicts of Interest
References
- Burkhardt, B.; Zimmermann, M.; Oschlies, I.; Niggli, F.; Mann, G.; Parwaresch, R.; Riehm, H.; Schrappe, M.; Reiter, A.; BFM Group. The impact of age and gender on biology, clinical features and treatment outcome of non-Hodgkin lymphoma in childhood and adolescence. Br. J. Haematol. 2005, 131, 39–49. [Google Scholar] [CrossRef] [PubMed]
- Patel, J.L.; Smith, L.M.; Anderson, J.; Abromowitch, M.; Campana, D.; Jacobsen, J.; Lones, M.A.; Gross, T.G.; Cairo, M.S.; Perkins, S.L. The immunophenotype of T-lymphoblastic lymphoma in children and adolescents: A Children’s Oncology Group report. Br. J. Haematol. 2012, 159, 454–461. [Google Scholar] [CrossRef] [PubMed]
- Reiter, A.; Schrappe, M.; Parwaresch, R.; Henze, G.; Müller-Weihrich, S.; Sauter, S.; Sykora, K.W.; Ludwig, W.D.; Gadner, H.; Riehm, H. Non-Hodgkin’s lymphomas of childhood and adolescence: Results of a treatment stratified for biologic subtypes and stage--a report of the Berlin-Frankfurt-Münster Group. J. Clin. Oncol. 1995, 13, 359–372. [Google Scholar] [CrossRef]
- Asselin, B.L.; Devidas, M.; Wang, C.; Pullen, J.; Borowitz, M.J.; Hutchison, R.; Lipshultz, S.E.; Camitta, B.M. Effectiveness of high-dose methotrexate in T-cell lymphoblastic leukemia and advanced-stage lymphoblastic lymphoma: A randomized study by the Children’s Oncology Group (POG 9404). Blood 2011, 118, 874–883. [Google Scholar] [CrossRef] [PubMed]
- Pillon, M.; Piglione, M.; Garaventa, A.; Conter, V.; Giuliano, M.; Arcamone, G.; Mura, R.; Cellini, M.; D’Amore, E.S.; Varotto, S.; et al. Long-term results of AIEO P LNH–92 protocol for the treatment of pediatric lymphoblastic lymphoma: A report of the Italian Association of Pediatric Hematology and Oncology. Pediatr. Blood Cancer 2009, 53, 953–959. [Google Scholar] [CrossRef]
- Burkhardt, B.; Reiter, A.; Landmann, E.; Lang, P.; Lassay, L.; Dickerhoff, R.; Lakomek, M.; Henze, G.; von Stackelberg, A. Poor outcome for children and adolescents with progressive disease or relapse of lymphoblastic lymphoma: A report from the berlin-frankfurt-muenster group. J. Clin. Oncol. 2009, 27, 3363–3369. [Google Scholar] [CrossRef]
- Cimmino, F.; Pezone, L.; Avitabile, M.; Persano, L.; Vitale, M.; Sassi, M.; Bresolin, S.; Serafin, V.; Zambrano, N.; Scaloni, A.; et al. Proteomic Alterations in Response to Hypoxia Inducible Factor 2α in Normoxic Neuroblastoma Cells. J. Proteome Res. 2016, 15, 3643–3655. [Google Scholar] [CrossRef]
- Trentin, L.; Bresolin, S.; Giarin, E.; Bardini, M.; Serafin, V.; Accordi, B.; Fais, F.; Tenca, C.; De Lorenzo, P.; Valsecchi, M.G.; et al. Deciphering KRAS and NRAS mutated clone dynamics in MLL-AF4 paediatric leukaemia by ultra deep sequencing analysis. Sci. Rep. 2016, 6, 34449. [Google Scholar] [CrossRef] [Green Version]
- Kiu, H.; Nicholson, S.E. Biology and significance of the JAK/STAT signalling pathways. Growth Factors 2012, 30, 88–106. [Google Scholar] [CrossRef] [Green Version]
- Skinnider, B.F.; Elia, A.J.; Gascoyne, R.D.; Patterson, B.; Trumper, L.; Kapp, U.; Mak, T.W. Signal transducer andactivator of transcription 6 is frequently activated in Hodgkin and Reed–Sternberg cells of Hodgkin lymphoma. Blood 2002, 99, 618–626. [Google Scholar] [CrossRef] [Green Version]
- Guiter, C.; Dusanter-Fourt, I.; Copie-Bergman, C.; Boull, M.L.; Le Gouvello, S.; Gaulard, P.; Leroy, K.; Castellano, F. Constitutive STAT6 activation in primary mediastinal large B-cell lymphoma. Blood 2004, 104, 543–549. [Google Scholar] [CrossRef] [Green Version]
- Qin, J.Z.; Kamarashev, J.; Zhang, C.L.; Dummer, R.; Burg, G.; Döbbeling, U. Constitutive and interleukin-7- and interleukin-15-stimulated DNA binding of STAT and novel factors in cutaneous T cell lymphoma cells. J. Invest. Dermatol. 2001, 117, 583–589. [Google Scholar] [CrossRef] [Green Version]
- Takemoto, S.; Mulloy, J.C.; Cereseto, A.; Migone, T.S.; Patel, B.K.; Matsuoka, M.; Yamaguchi, K.; Takatsuki, K.; Kamihira, S.; White, J.D.; et al. Proliferation of adult T cell leukemia/lymphoma cells is associated with the constitutive activation of JAK/STAT proteins. Proc. Natl. Acad. Sci. USA 1997, 94, 13897–13902. [Google Scholar] [CrossRef] [Green Version]
- Melzner, I.; Bucur, A.J.; Brüderlein, S.; Dorsch, K.; Hasel, C.; Barth, T.F.; Leithäuser, F.; Möller, P. Biallelic mutation of SOCS-1 impairs JAK2 degradation and sustains phopho-JAK2 action in the MedB-1 mediastinal lymphoma line. Blood 2005, 105, 2535–2542. [Google Scholar] [CrossRef] [PubMed]
- Mascarenhas, J.; Hoffman, R. Ruxolitinib: The first FDA approved therapy for the treatment of myelofibrosis. Clin Cancer Res. 2012, 18, 3008–3014. [Google Scholar] [CrossRef] [PubMed] [Green Version]
- Shapira, M.Y.; Klimov, A.; Vipul, S.; Grisariu, S.; Avni, B.R.; Or, R.; Bloom, A.I. Regional intra-arterial steroid treatment in 120 patients with steroid-resistant or -dependent GvHD. Bone Marrow Transplant. 2017, 52, 1416–1422. [Google Scholar] [CrossRef] [Green Version]
- Ding, Y.Y.; Stern, J.W.; Jubelirer, T.F.; Wertheim, G.B.; Lin, F.; Chang, F.; Gu, Z.; Mullighan, C.G.; Li, Y.; Harvey, R.C.; et al. Clinical efficacy of ruxolitinib and chemotherapy in a child with Philadelphia chromosome-like acute lymphoblastic leukemia with GOLGA5-JAK2 fusion and induction failure. Haematologica 2018, 103, e427–e431. [Google Scholar] [CrossRef] [PubMed] [Green Version]
- Goeman, J.J.; van de Geer, S.A.; de Kort, F.; van Houwelingen, H.C. A global test for groups of genes: Testing association with a clinical outcome. Bioinformatics 2004, 20, 93–99. [Google Scholar] [CrossRef] [PubMed] [Green Version]
- Kaplan, M.H.; Daniel, C.; Schindler, U.; Grusby, M.J. Stat proteins control lymphocyte proliferation by regulating p27Kip1 expression. Mol. Cell Biol. 1998, 18, 1996–2003. [Google Scholar] [CrossRef] [PubMed] [Green Version]
- Mussolin, L.; Holmes, A.B.; Romualdi, C.; Sales, G.; D’Amore, E.S.; Ghisi, M.; Pillon, M.; Rosolen, A.; Basso, K. An aberrant microRNA signature in childhood T-cell lymphoblastic lymphoma affecting CDKN1B expression, NOTCH1 and growth factor signaling pathways. Leukemia 2014, 28, 1909–1912. [Google Scholar] [CrossRef]
- Nelms, K.; Keegan, A.D.; Zamorano, J.; Ryan, J.J.; Paul, W.E. The IL-4 receptor: Signaling mechanisms and biologic functions. Ann. Rev. Immunol. 1999, 17, 701–738. [Google Scholar] [CrossRef] [Green Version]
- Serafin, V.; Capuzzo, G.; Milani, G.; Minuzzo, S.A.; Pinazza, M.; Bortolozzi, R.; Bresolin, S.; Porcù, E.; Frasson, C.; Indraccolo, S.; et al. Glucocorticoid resistance is reverted by LCK inhibition in pediatric T-cell acute lymphoblastic leukemia. Blood 2017, 130, 2750–2761. [Google Scholar] [CrossRef] [Green Version]
- Biola, A.; Andréau, K.; David, M.; Sturm, M.; Haake, M.; Bertoglio, J.; Pallardy, M. The glucocorticoid receptor and STAT6 physically and functionally interact in T-lymphocytes. FEBS Lett. 2000, 487, 229–233. [Google Scholar] [CrossRef] [Green Version]
- D’Adamio, F.; Zollo, O.; Moraca, R.; Ayroldi, E.; Bruscoli, S.; Bartoli, A.; Cannarile, L.; Migliorati, G.; Riccardi, C. A new dexamethasone-induced gene of the leucine zipper family protects T lymphocytes from TCR/CD3-activated cell death. Immunity 1997, 7, 803–812. [Google Scholar] [CrossRef] [Green Version]
- Nagashima, S.; Yokota, M.; Nakai, E.; Kuromitsu, S.; Ohga, K.; Takeuchi, M.; Tsukamoto, S.; Ohta, M. Synthesis and evaluation of 2-{[2-(4-hydroxyphenyl)-ethyl]amino}pyrimidine-5-carboxamide derivatives as novel STAT6 inhibitors. Bioorganic Med. Chem. 2007, 15, 1044–1055. [Google Scholar] [CrossRef] [PubMed]
- Burkhardt, B.; Hermiston, M.L. Lymphoblastic lymphoma in children and adolescents: Review of current challenges and future opportunities. Br. J. Haematol. 2019, 185, 1158–1170. [Google Scholar] [CrossRef] [PubMed]
- Coustan-Smith, E.; Sandlund, J.T.; Perkins, S.L.; Chen, H.; Chang, M.; Abromowitch, M.; Campana, D. Minimal disseminated disease in childhood T-cell lymphoblastic lymphoma: A report from the children’s oncology group. J. Clin. Oncol. 2009, 27, 3533–3539. [Google Scholar] [CrossRef] [Green Version]
- Mussolin, L.; Buldini, B.; Lovisa, F.; Carraro, E.; Disarò, S.; Lo Nigro, L.; d’Amore, E.S.; Pillon, M.; Basso, G. Detection and role of minimal disseminated disease in children with lymphoblastic lymphoma: The AIEOP experience. Pediatr. Blood Cancer. 2015, 62, 1906–1913. [Google Scholar] [CrossRef]
- Callens, C.; Baleydier, F.; Lengline, E.; Abdelali, R.B.; Petit, A.; Villarese, P.; Cieslak, A.; Minard-Colin, V.; Rullier, A.; Moreau, A.; et al. Clinical impact of NOTCH1 and/or FBXW7 mutations, FLASH deletion, and TCR status in pediatric T-cell lymphoblastic lymphoma. J. Clin. Oncol. 2012, 30, 1966–1973. [Google Scholar] [CrossRef] [PubMed]
- Pomari, E.; Lovisa, F.; Carraro, E.; Primerano, S.; D’Amore, E.S.G.; Bonvini, P.; Nigro, L.L.; Vito, R.; Vinti, L.; Farruggia, P.; et al. Clinical impact of miR-223 expression in pediatric T-Cell lymphoblastic lymphoma. Oncotarget 2017, 8, 107886–107898. [Google Scholar] [CrossRef]
- Suzuki, M.; Muroi, A.; Nojima, M.; Numata, A.; Takasaki, H.; Sakai, R.; Yokose, T.; Miyagi, Y.; Koshikawa, N. Utility of a Reverse Phase Protein Array to Evaluate Multiple Biomarkers in Diffuse Large B-Cell Lymphoma. Proteom. Clin. Appl. 2020, 14, e1900091. [Google Scholar] [CrossRef] [PubMed]
- De Smedt, R.; Peirs, S.; Morscio, J.; Matthijssens, F.; Roels, J.; Reunes, L.; Lintermans, B.; Goossens, S.; Lammens, T.; Van Roy, N.; et al. Pre-clinical evaluation of second generation PIM inhibitors for the treatment of T-cell acute lymphoblastic leukemia and lymphoma. Haematologica 2019, 104, e17–e20. [Google Scholar] [CrossRef] [PubMed]
- De Smedt, R.; Morscio, J.; Reunes, L.; Roels, J.; Bardelli, V.; Lintermans, B.; Van Loocke, W.; Almeida, A.; Cheung, L.C.; Kotecha, R.S.; et al. Targeting cytokine- and therapy-induced PIM1 activation in preclinical models of T-cell acute lymphoblastic leukemia and lymphoma. Blood 2020, 135, 1685–1695. [Google Scholar] [CrossRef]
- Salguero-Ar, A.C.; Sancho-Mensat, D.; Canals-Lorente, B.; Sultan, S.; Reginald, A.; Chapman, L. STAT6 knockdown using multiple siRNA sequences inhibits proliferation and induces apoptosis of human colorectal and breast cancer cell lines. PLoS ONE 2019, 14, e0207558. [Google Scholar]
- Wäldele, K.; Schneider, G.; Ruckes, T.; Grassmann, R. Interleukin-13 overexpression by tax transactivation: A potential autocrine stimulus in human T-cell leukemia virus-infected lymphocytes. J. Virol. 2004, 78, 6081–6090. [Google Scholar] [CrossRef] [PubMed] [Green Version]
- Mori, N.; Shirakawa, F.; Murakami, S.; Oda, S.; Eto, S. Characterization and regulation of interleukin-4 receptor in adult T-cell leukemia cells. Eur. J. Haematol. 1996, 56, 241–247. [Google Scholar] [CrossRef]
- Manson, M.L.; Säfholm, J.; James, A.; Johnsson, A.K.; Bergman, P.; Al-Ameri, M.; Orre, A.C.; Kärrman-Mårdh, C.; Dahlén, S.E.; Adner, M. IL-13 and IL-4, but not IL-5 nor IL-17A, induce hyperresponsiveness in isolated human small airways. J. Allergy Clin. Immunol. 2020, 145, 808–817.e2. [Google Scholar] [CrossRef] [PubMed] [Green Version]
- Serafin, V.; Lissandron, V.; Buldini, B.; Bresolin, S.; Paganin, M.; Grillo, F.; Andriano, N.; Palmi, C.; Cazzaniga, G.; Marmiroli, S.; et al. Phosphoproteomic analysis reveals hyperactivation of mTOR/STAT3 and LCK/Calcineurin axes in pediatric early T-cell precursor ALL. Leukemia 2017, 31, 1007–1011. [Google Scholar] [CrossRef]
- Maude, S.L.; Dolai, S.; Delgado-Martin, C.; Vincent, T.; Robbins, A.; Selvanathan, A.; Ryan, T.; Hall, J.; Wood, A.C.; Tasian, S.K.; et al. Efficacy of JAK/STAT pathway inhibition in murine xenograft models of early T-cell precursor (ETP) acute lymphoblastic leukemia. Blood 2015, 125, 1759–1767. [Google Scholar] [CrossRef] [PubMed] [Green Version]
- Verbeke, D.; Gielen, O.; Jacobs, K.; Boeckx, N.; De Keersmaecker, K.; Maertens, J.; Uyttebroeck, A.; Segers, H.; Cools, J. Ruxolitinib Synergizes with Dexamethasone for the Treatment of T-cell Acute Lymphoblastic Leukemia. Hemasphere 2019, 3, e310. [Google Scholar] [CrossRef]
- Zhang, M.; Griner, L.A.M.; Ju, W.; Duveau, D.Y.; Guha, R.; Petrus, M.N.; Wen, B.; Maeda, M.; Shinn, P.; Ferrer, M.; et al. Selective targeting of JAK/STAT signaling is potentiated by Bcl-xL blockade in IL-2-dependent adult T-cell leukemia. Proc. Natl. Acad. Sci. USA 2015, 112, 12480–12485. [Google Scholar] [CrossRef] [Green Version]
- Zeiser, R.; von Bubnoff, N.; Butler, J.; Mohty, M.; Niederwieser, D.; Or, R.; Szer, J.; Wagner, E.M.; Zuckerman, T.; Mahuzier, B.; et al. Ruxolitinib for Glucocorticoid-Refractory Acute Graft-versus-Host Disease. N. Engl. J. Med. 2020, 382, 1800–1810. [Google Scholar] [CrossRef]
- Zeiser, R.; Socié, G. The development of ruxolitinib for glucocorticoid-refractory acute graft-versus-host disease. Blood Adv. 2020, 4, 3789–3794. [Google Scholar] [CrossRef]
- La Rosée, F.; Bremer, H.C.; Gehrke, I.; Kehr, A.; Hochhaus, A.; Birndt, S.; Fellhauer, M.; Henkes, M.; Kumle, B.; Russo, S.G.; et al. The Janus kinase 1/2 inhibitor ruxolitinib in COVID-19 with severe systemic hyperinflammation. Leukemia 2020, 34, 1805–1815. [Google Scholar] [CrossRef] [PubMed]
- Arber, D.A.; Orazi, A.; Hasserjian, R.; Thiele, J.; Borowitz, M.J.; Le Beau, M.M.; Bloomfield, C.D.; Cazzola, M.; Vardiman, J.W. The 2016 revision to the World Health Organization classification of myeloid neoplasms and acute leukemia. Blood 2016, 127, 2391–2406. [Google Scholar] [CrossRef]
- Pillon, M.; Aricò, M.; Mussolin, L.; Carraro, E.; Conter, V.; Sala, A.; Buffardi, S.; Garaventa, A.; D’Angelo, P.; Lo Nigro, L.; et al. Long-term results of the AIEOP LNH-97 protocol for childhood lymphoblastic lymphoma. Pediatr. Blood Cancer 2015, 62, 1388–1394. [Google Scholar] [CrossRef]
- Landmann, E.; Burkhardt, B.; Zimmermann, M.; Meyer, U.; Woessmann, W.; Klapper, W.; Wrobel, G.; Rosolen, A.; Pillon, M.; Escherich, G.; et al. Results and conclusions of the European Intergroup EURO-LB02 trial in children and adolescents with lymphoblastic lymphoma. Haematologica 2017, 102, 2086–2096. [Google Scholar]
- Murphy, S.B. Classification, staging and end results of treatment of childhood non-Hodgkin’s lymphomas: Dissimilarities from lymphomas in adults. Semin. Oncol. 1980, 7, 332–339. [Google Scholar] [PubMed]
- Storey, J.D.; Tibshirani, R. Statistical significance for genome-wide experiments. Proc. Natl. Acad. Sci. USA 2003, 100, 9440–9445. [Google Scholar] [CrossRef] [PubMed] [Green Version]
- Foucquier, J.; Guedj, M. Analysis of drug combinations: Current methodological landscape. Pharmacol. Res. Perspect. 2015, 3, e00149. [Google Scholar] [CrossRef] [PubMed]


Publisher’s Note: MDPI stays neutral with regard to jurisdictional claims in published maps and institutional affiliations. |
© 2021 by the authors. Licensee MDPI, Basel, Switzerland. This article is an open access article distributed under the terms and conditions of the Creative Commons Attribution (CC BY) license (https://creativecommons.org/licenses/by/4.0/).
Share and Cite
Veltri, G.; Silvestri, C.; Gallingani, I.; Sandei, M.; Vencato, S.; Lovisa, F.; Cortese, G.; Pillon, M.; Carraro, E.; Bresolin, S.; et al. Ruxolitinib as a Novel Therapeutic Option for Poor Prognosis T-LBL Pediatric Patients. Cancers 2021, 13, 3724. https://0-doi-org.brum.beds.ac.uk/10.3390/cancers13153724
Veltri G, Silvestri C, Gallingani I, Sandei M, Vencato S, Lovisa F, Cortese G, Pillon M, Carraro E, Bresolin S, et al. Ruxolitinib as a Novel Therapeutic Option for Poor Prognosis T-LBL Pediatric Patients. Cancers. 2021; 13(15):3724. https://0-doi-org.brum.beds.ac.uk/10.3390/cancers13153724
Chicago/Turabian StyleVeltri, Giulia, Chiara Silvestri, Ilaria Gallingani, Max Sandei, Sara Vencato, Federica Lovisa, Giuliana Cortese, Marta Pillon, Elisa Carraro, Silvia Bresolin, and et al. 2021. "Ruxolitinib as a Novel Therapeutic Option for Poor Prognosis T-LBL Pediatric Patients" Cancers 13, no. 15: 3724. https://0-doi-org.brum.beds.ac.uk/10.3390/cancers13153724