
Comparing Characteristics of Endometrial Cancer in Women of South Asian and White Ethnicity in England

 , , and
Abstract
:Simple Summary
Abstract
1. Introduction
2. Methods
Statistical Analysis
3. Results
4. Discussion
Limitations
5. Conclusions
Supplementary Materials
Author Contributions
Funding
Institutional Review Board Statement
Informed Consent Statement
Data Availability Statement
Conflicts of Interest
References
- Cancer Research UK. Uterine Cancer Statistics. Available online: https://www.cancerresearchuk.org/health-professional/cancer-statistics/statistics-by-cancer-type/uterine-cancer/incidence (accessed on 25 September 2021).
- Evans, T.R.; Sany, O.; Pearmain, P.; Ganesan, R.; Blann, A.D.; Sundar, S. Differential trends in the rising incidence of endometrial cancer by type: Data from a UK population-based registry from 1994 to 2006. Br. J. Cancer 2011, 104, 1505–1510. [Google Scholar] [CrossRef] [PubMed] [Green Version]
- National Institute for Health and Care Excellence. Referral for Suspected Endometrial Cancer; Available online: https://cks.nice.org.uk/topics/gynaecological-cancers-recognition-referral (accessed on 22 November 2021).
- Mahdi, H.; Schlick, C.J.; Kowk, L.-L.; Moslemi-Kebria, M.; Michener, C. Endometrial cancer in Asian and American Indian/Alaskan Native women: Tumor characteristics, treatment and outcome compared to non-Hispanic white women. Gynecol. Oncol. 2014, 132, 443–449. [Google Scholar] [CrossRef]
- Wright, J.D.; Fiorelli, J.; Schiff, P.B.; Burke, W.M.; Kansler, A.L.; Cohen, C.J.; Herzog, T.J. Racial disparities for uterine corpus tumors. Cancer 2009, 115, 1276–1285. [Google Scholar] [CrossRef]
- Sherman, M.E.; Devesa, S.S. Analysis of racial differences in incidence, survival, and mortality for malignant tumors of the uterine corpus. Cancer 2003, 98, 176–186. [Google Scholar] [CrossRef] [PubMed]
- Fader, A.N.; Habermann, E.; Hanson, K.T.; Lin, J.F.; Grendys, E.C.; Dowdy, S.C. Disparities in treatment and survival for women with endometrial cancer: A contemporary national cancer database registry analysis. Gynecol. Oncol. 2016, 143, 98–104. [Google Scholar] [CrossRef]
- Guttery, D.; Blighe, K.; Polymeros, K.; Symonds, R.P.; Macip, S.; Moss, E. Racial differences in endometrial cancer molecular portraits in The Cancer Genome Atlas. Oncotarget 2018, 9, 17093–17103. [Google Scholar] [CrossRef]
- NCIN. Outline of Uterine Cancer in the United Kingdom: Incidence, Mortality and Survival; PHE Knowledge and Intelligence Team: East Midlands, UK, 2013.
- Office for National Statistics. 2011 Census. Available online: https://www.ons.gov.uk/peoplepopulationandcommunity/culturalidentity/ethnicity/articles/ethnicityandnationalidentityinenglandandwales/2012-12-11#animated-youtube-video (accessed on 25 October 2021).
- Lord, K.; Ibrahim, K.; Kumar, S.; Rudd, N.; Mitchell, A.; Symonds, P. Measuring Trust in Healthcare Professionals—A Study of Ethnically Diverse UK Cancer Patients. Clin. Oncol. 2012, 24, 13–21. [Google Scholar] [CrossRef]
- National Cancer Intelligence Network and Cancer Research UK. Cancer Incidence and Survival by Major Ethnic Group, England 2002–2006. 2009. Available online: http://ncin.org.uk/search/cancer+and+incidence+by+major+ethnic+group+england+2002+2006 (accessed on 22 November 2021).
- Shirley, M.H.; Barnes, I.; Sayeed, S.; Finlayson, A.; Ali, R. Incidence of breast and gynaecological cancers by ethnic group in England, 2001–2007: A descriptive study. BMC Cancer 2014, 14, 979. [Google Scholar] [CrossRef] [Green Version]
- Yudell, M.; Roberts, D.; DeSalle, R.; Tishkoff, S. Taking race out of human genetics. Science 2016, 351, 564–565. [Google Scholar] [CrossRef] [PubMed]
- Sankar, P.; Cho, M.K. Toward a New Vocabulary of Human Genetic Variation. Science 2002, 298, 1337–1338. [Google Scholar] [CrossRef] [Green Version]
- Gomez, S.L.; Noone, A.-M.; Lichtensztajn, D.Y.; Scoppa, S.; Gibson, J.T.; Liu, L.; Morris, C.; Kwong, S.; Fish, K.; Wilkens, L.R.; et al. Cancer Incidence Trends Among Asian American Populations in the United States, 1990–2008. J. Natl. Cancer Inst. 2013, 105, 1096–1110. [Google Scholar] [CrossRef] [Green Version]
- Park, S.L.; Goodman, M.T.; Zhang, Z.-F.; Kolonel, L.N.; Henderson, B.E.; Setiawan, V. Body size, adult BMI gain and endometrial cancer risk: The multiethnic cohort. Int. J. Cancer 2009, 126, 490–499. [Google Scholar] [CrossRef] [Green Version]
- Gray, L.; Yates, T.; Davies, M.; Brady, E.; Webb, D.R.; Sattar, N.; Khunti, K. Defining Obesity Cut-Off Points for Migrant South Asians. PLoS ONE 2011, 6, e26464. [Google Scholar] [CrossRef] [Green Version]
- NICE. Available online: https://www.nice.org.uk/News/Article/consider-lower-bmi-risk-thresholds-for-people-from-black-asian-and-minority-groups (accessed on 25 October 2021).
- Colombo, N.; Creutzberg, C.; Amant, F.; Bosse, T.; Martín, A.G.; Ledermann, J.; Marth, C.; Nout, R.A.; Querleu, D.; Mirza, M.R.; et al. ESMO-ESGO-ESTRO Consensus Conference on Endometrial Cancer: Diagnosis, Treatment and Follow-up. Int. J. Gynecol. Cancer 2016, 26, 2–30. [Google Scholar] [CrossRef] [PubMed] [Green Version]
- Zhang, M.M.; Cheung, M.K.; Osann, K.; Lee, M.M.; Gomez, S.S.L.; Whittemore, A.S.; Husain, A.; Teng, N.N.; Chan, J.K. Improved Survival of Asians With Corpus Cancer Compared With Whites. Obstet. Gynecol. 2006, 107, 329–335. [Google Scholar] [CrossRef] [PubMed]
- Chim, H.; Tan, B.H.I.; Ang, C.C.; Chew, E.M.D.; Chong, Y.S.; Saw, S.M. The prevalence of menopausal symptoms in a community in Singapore. Maturitas 2002, 41, 275–282. [Google Scholar] [CrossRef]
- Boulet, M.; Oddens, B.; Lehert, P.; Vemer, H.; Visser, A. Climacteric and menopause in seven south-east Asian countries. Maturitas 1994, 19, 157–176. [Google Scholar] [CrossRef]
- Broaddus, R.R.; Lynch, H.T.; Chen, L.-M.; Daniels, M.; Conrad, P.; Munsell, M.F.; White, K.G.; Luthra, R.; Lu, K.H. Pathologic features of endometrial carcinoma associated with HNPCC. Cancer 2005, 106, 87–94. [Google Scholar] [CrossRef] [PubMed]
- Polymeros, K.; Guttery, D.S.; Hew, R.; Bishop, R.; Stannard, E.; Macip, S.; Symonds, P.; Moss, E. Differences in the molecular profile of endometrial cancers from British White and British South Asian women. PLoS ONE 2020, 15, e0233900. [Google Scholar] [CrossRef]
- Nevadunsky, N.S.; Van Arsdale, A.; Strickler, H.D.; Moadel, A.; Kaur, G.; Levitt, J.; Girda, E.; Goldfinger, M.; Goldberg, G.L.; Einstein, M.H. Obesity and Age at Diagnosis of Endometrial Cancer. Obstet. Gynecol. 2014, 124, 300–306. [Google Scholar] [CrossRef] [PubMed]
- Paul, S.K.; Adjah, E.S.O.; Samanta, M.; Patel, K.; Bellary, S.; Hanif, W.; Khunti, K. Comparison of body mass index at diagnosis of diabetes in a multiethnic population: A case-control study with matched non-diabetic controls. Diabetes Obes. Metab. 2017, 19, 1014–1023. [Google Scholar] [CrossRef] [PubMed] [Green Version]
- Tang, Y.-L.; Zhu, L.-Y.; Li, Y.; Yu, J.; Wang, J.; Zeng, X.-X.; Hu, K.-X.; Liu, J.-Y.; Xu, J.-X. Metformin Use Is Associated with Reduced Incidence and Improved Survival of Endometrial Cancer: A Meta-Analysis. BioMed Res. Int. 2017, 2017, 5905384. [Google Scholar] [CrossRef]
- Nevadunsky, N.S.; Van Arsdale, A.; Strickler, H.D.; Moadel, A.; Kaur, G.; Frimer, M.; Conroy, E.; Goldberg, G.L.; Einstein, M.H. Metformin use and endometrial cancer survival. Gynecol. Oncol. 2014, 132, 236–240. [Google Scholar] [CrossRef] [PubMed]
- Kumarakulasingam, P.; McDermott, H.; Boutler, L.; Patel, N.; Tincello, D.; Moss, E. Knowledge of the risk factors and symptoms associated with endometrial cancer in British South Asian and British White women. Eur. J. Obstet. Gynecol. Reprod. Biol. 2018, 224, 85–88. [Google Scholar] [CrossRef] [PubMed] [Green Version]
- Kolar, S.K.; Wheldon, C.; Hernandez, N.D.; Young, L.; Romero-Daza, N.; Daley, E.M. Human Papillomavirus Vaccine Knowledge and Attitudes, Preventative Health Behaviors, and Medical Mistrust Among a Racially and Ethnically Diverse Sample of College Women. J. Racial Ethn. Health Disparities 2014, 2, 77–85. [Google Scholar] [CrossRef]


| Characteristics | Categories | White (n = 1633) | South Asian (n = 251) | p-Value *≠ |
|---|---|---|---|---|
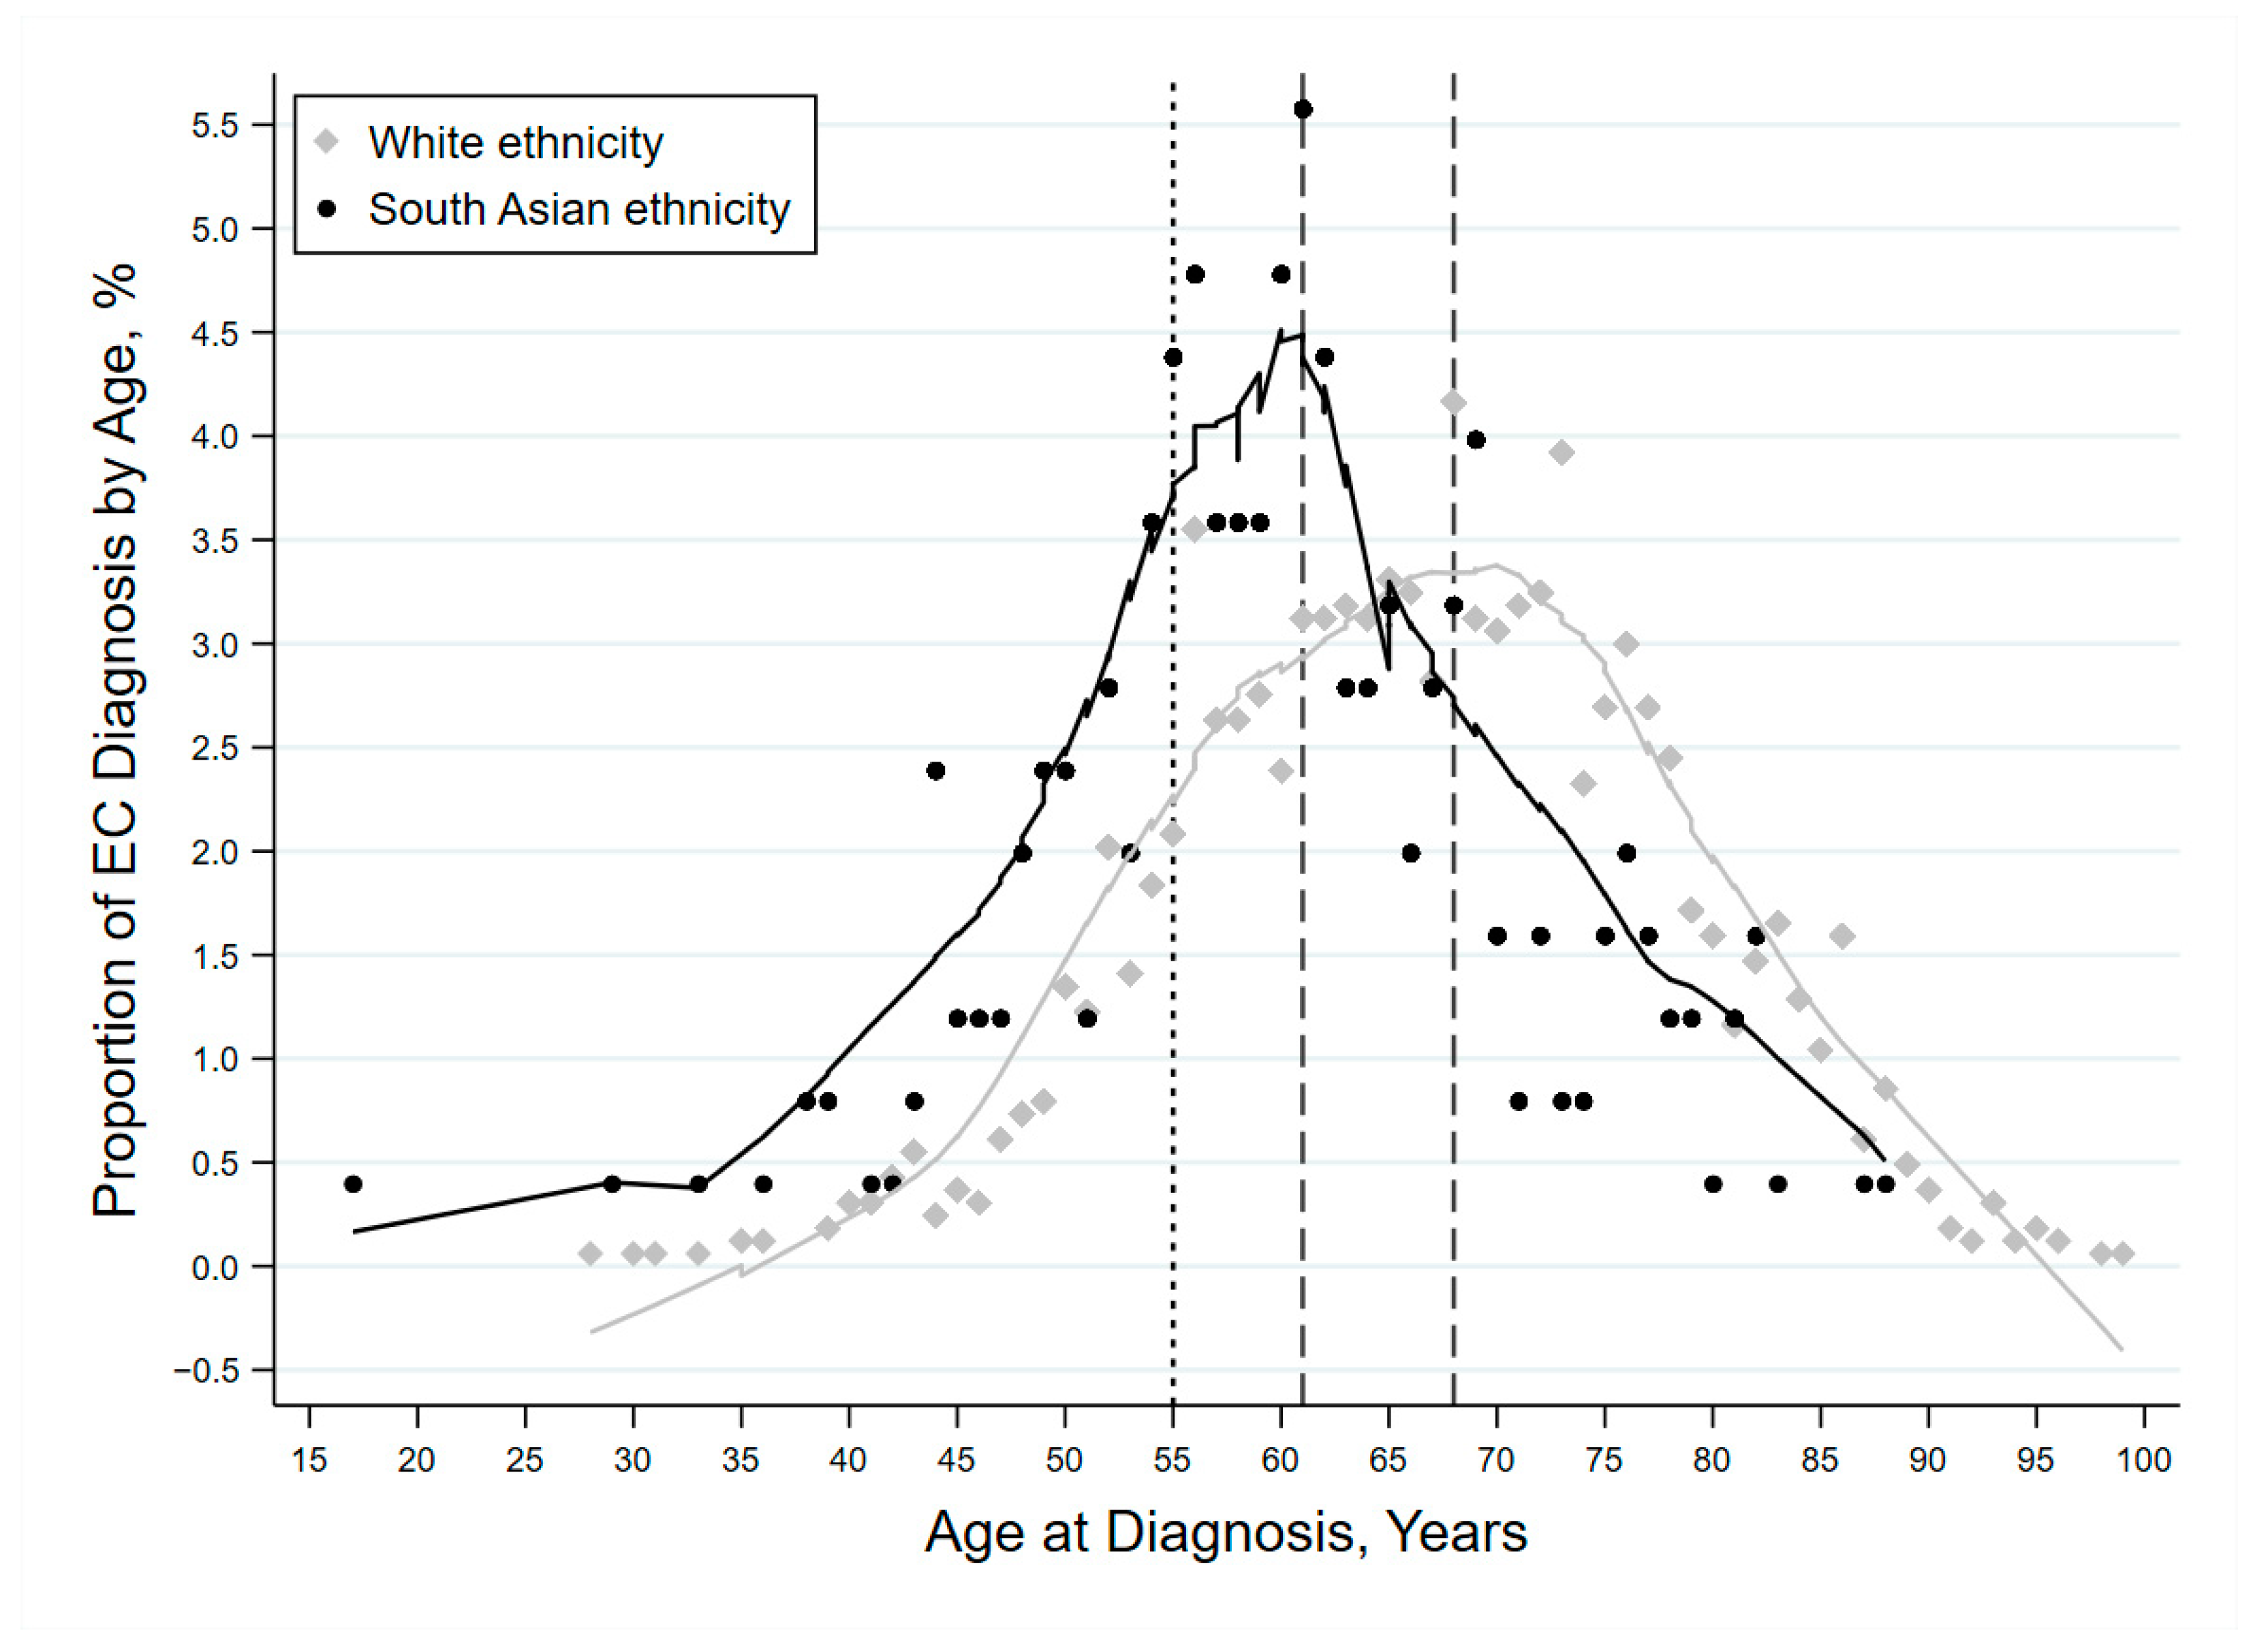
| Age at diagnosis in years | Mean (SD) | 66.9 (11.2) | 60.3 (10.9) | <0.001 |
| Median (IQR) | 67 (59, 75) | 60 (54, 67) | <0.001 | |
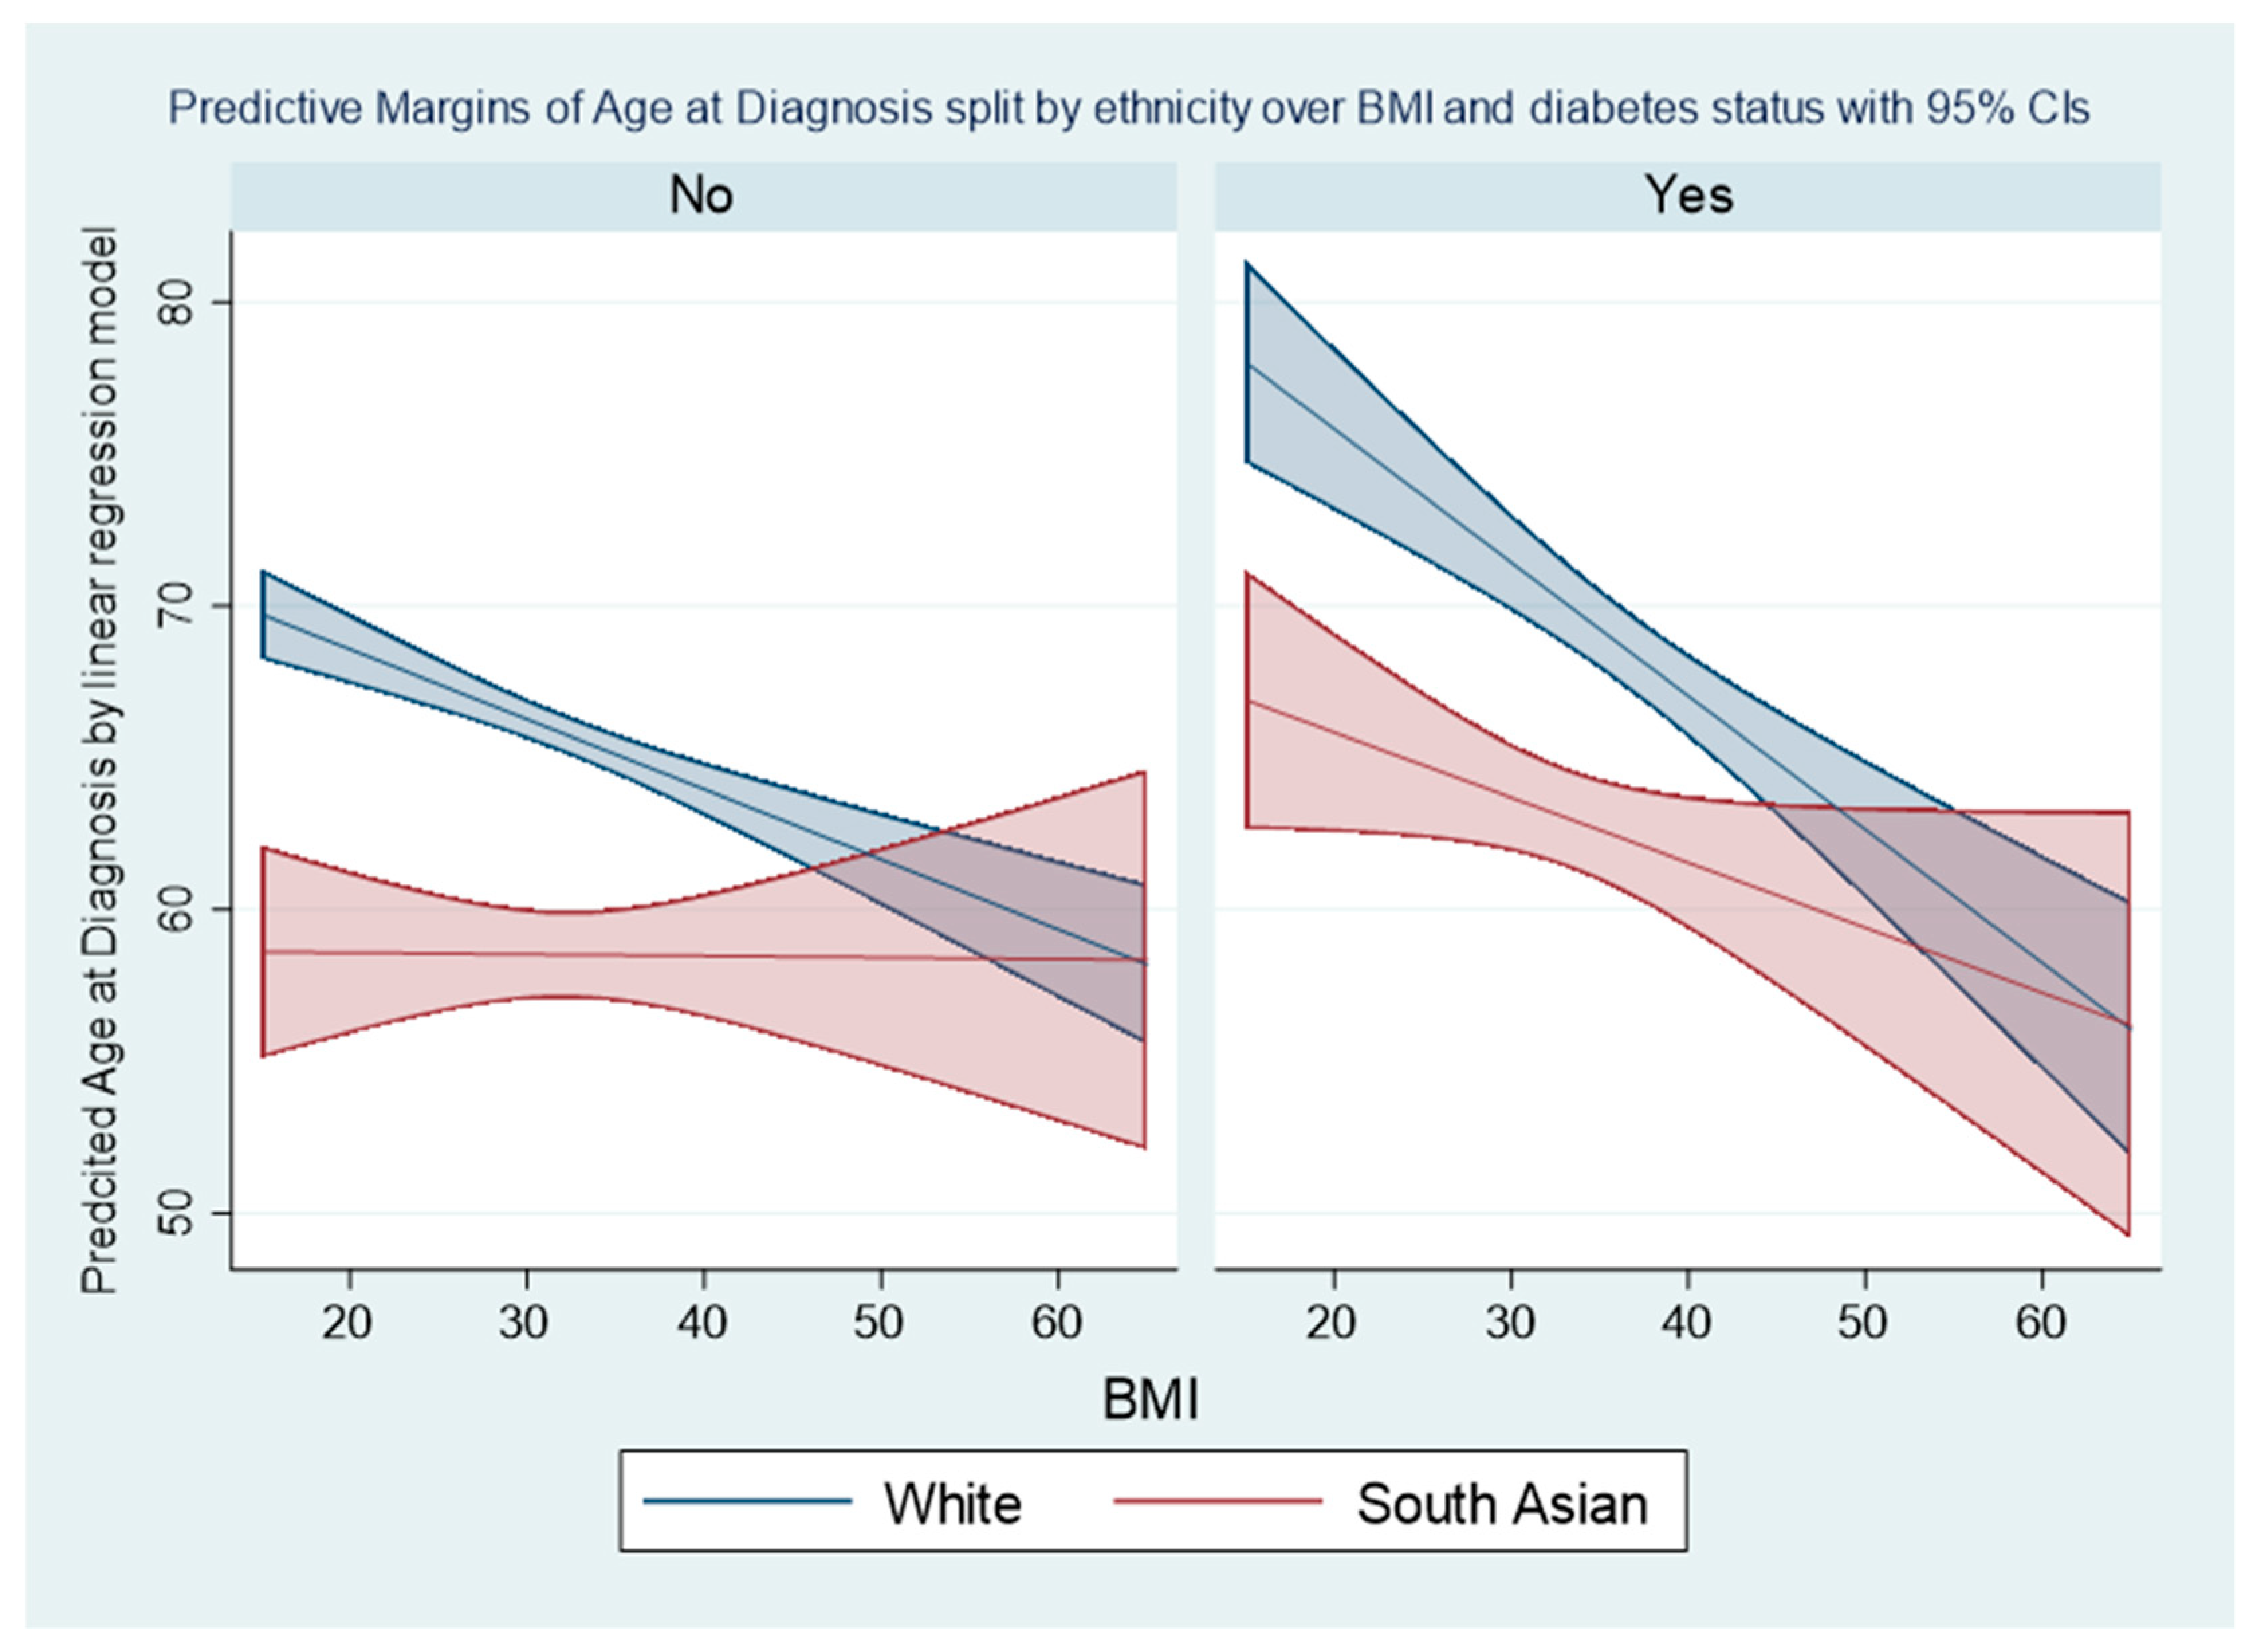
| BMI in Kg/m2 | Mean (SD) ^ | 33.1 (8.9) | 32.1 (7.4) | 0.114 |
| Median (IQR) ^ | 32 (26, 39) | 31 (27, 37) | 0.443 | |
| Age group | Below 55 | 215 (13.2%) | 68 (27.1%) | <0.001 |
| 55–69 | 739 (45.3%) | 139 (55.4%) | ||
| 70 and above | 679 (41.6%) | 44 (17.5%) | ||
| BMI group | Below 30 | 452 (27.7%) | 90 (35.9%) | 0.131 ≠ |
| 30–40 | 416 (25.5%) | 101 (40.2%) | ||
| 40 and above | 255 (15.6%) | 42 (16.7%) | ||
| Missing | 510 (31.2%) | 18 (7.2%) | ||
| Type II Diabetes | No | 1142 (70.0%) | 151 (60.2%) | <0.001 ≠ |
| Yes | 233 (14.3%) | 88 (35.2%) | ||
| Unknown | 256 (15.7%) | 11 (4.4%) | ||
| Metformin use | No | 1250 (91.6%) | 191 (80.9%) | <0.001 |
| Yes | 114 (8.4%) | 45 (19.1%) | ||
| Histological subtype | Endometrioid | 1334 (81.7%) | 209 (83.3%) | 0.754 ≠ |
| Non-Endometrioid | 247 (15.1%) | 41 (16.3%) | ||
| Unknown | 52 (3.2%) | 1 (0.4%) | ||
| Stage of cancer | Stage I | 1140 (69.8%) | 195 (77.7%) | 0.174 ≠ |
| Stage II | 155 (9.5%) | 25 (10.0%) | ||
| Stage III and IV | 198 (12.1%) | 20 (8.0%) | ||
| Unknown | 140 (8.6%) | 11 (4.4%) | ||
| Grade of cancer | Grade 1 | 693 (42.4%) | 112 (44.6%) | 0.792 ≠ |
| Grade 2 | 424 (26.0%) | 63 (25.1%) | ||
| Grade 3 | 428 (26.2%) | 72 (28.7%) | ||
| Unknown | 88 (5.4%) | 4 (1.6%) | ||
| Risk group | Low | 595 (36.4%) | 108 (43.0%) | 0.441 ≠ |
| Intermediate and H-intermediate | 281 (17.2%) | 43 (17.1%) | ||
| High/advanced | 500 (30.6%) | 75 (29.9%) | ||
| Unknown/NA | 257 (15.7%) | 25 (10.0%) | ||
| Diagnosis year | 2003–2008 | 540 (33.1%) | 54 (21.5%) | <0.001 |
| 2009–2013 | 553 (33.9%) | 84 (33.5%) | ||
| 2014–2018 | 540 (33.1%) | 113 (45.0%) |
Publisher’s Note: MDPI stays neutral with regard to jurisdictional claims in published maps and institutional affiliations. |
© 2021 by the authors. Licensee MDPI, Basel, Switzerland. This article is an open access article distributed under the terms and conditions of the Creative Commons Attribution (CC BY) license (https://creativecommons.org/licenses/by/4.0/).
Share and Cite
Mohammed, S.; Polymeros, K.; Wickham-Joseph, R.; Luqman, I.; Charadva, C.; Morris, T.; Collins, A.; Barber, S.; Khunti, K.; Moss, E.L. Comparing Characteristics of Endometrial Cancer in Women of South Asian and White Ethnicity in England. Cancers 2021, 13, 6123. https://0-doi-org.brum.beds.ac.uk/10.3390/cancers13236123
Mohammed S, Polymeros K, Wickham-Joseph R, Luqman I, Charadva C, Morris T, Collins A, Barber S, Khunti K, Moss EL. Comparing Characteristics of Endometrial Cancer in Women of South Asian and White Ethnicity in England. Cancers. 2021; 13(23):6123. https://0-doi-org.brum.beds.ac.uk/10.3390/cancers13236123
Chicago/Turabian StyleMohammed, Seid, Konstantinos Polymeros, Rochelle Wickham-Joseph, Iqra Luqman, Creana Charadva, Thomas Morris, Anna Collins, Shaun Barber, Kamlesh Khunti, and Esther L. Moss. 2021. "Comparing Characteristics of Endometrial Cancer in Women of South Asian and White Ethnicity in England" Cancers 13, no. 23: 6123. https://0-doi-org.brum.beds.ac.uk/10.3390/cancers13236123