
Effects of the Novel PFKFB3 Inhibitor KAN0438757 on Colorectal Cancer Cells and Its Systemic Toxicity Evaluation In Vivo

 , , , ,
  , , and
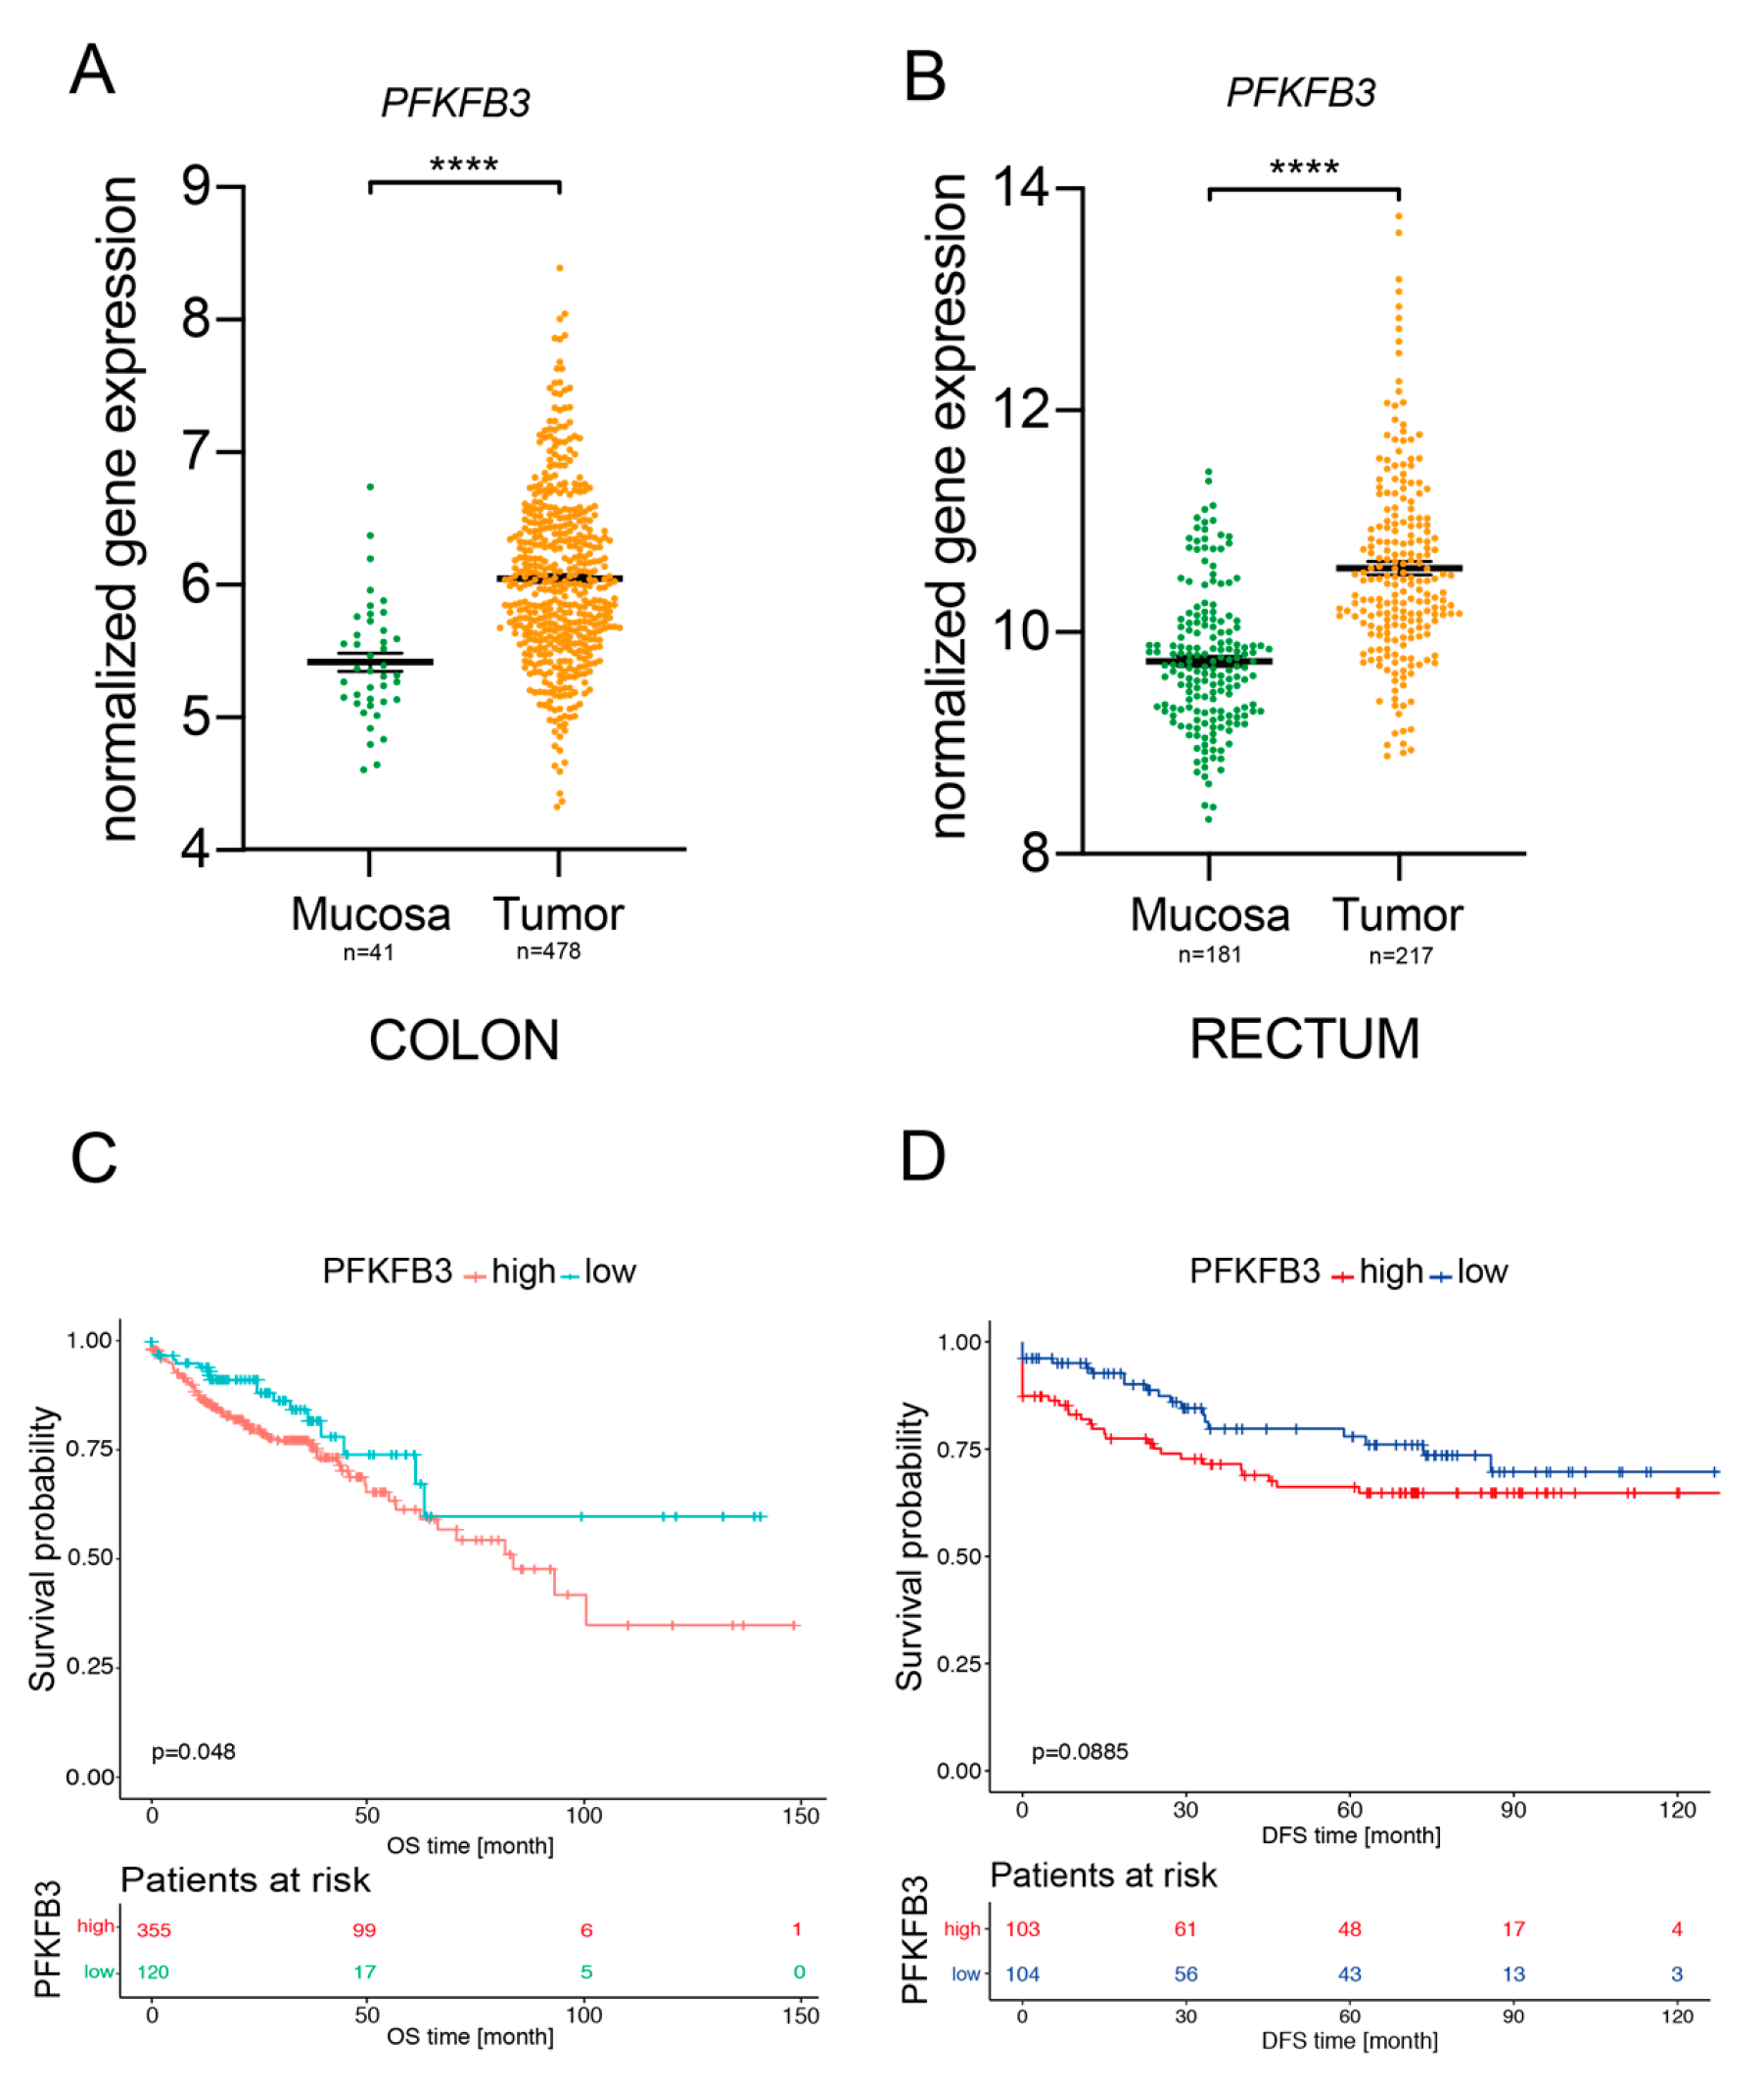
Abstract
:Simple Summary
Abstract
1. Introduction
2. Results
2.1. PFKFB3 Expression in Human CRC Is Associated with Poor Survival
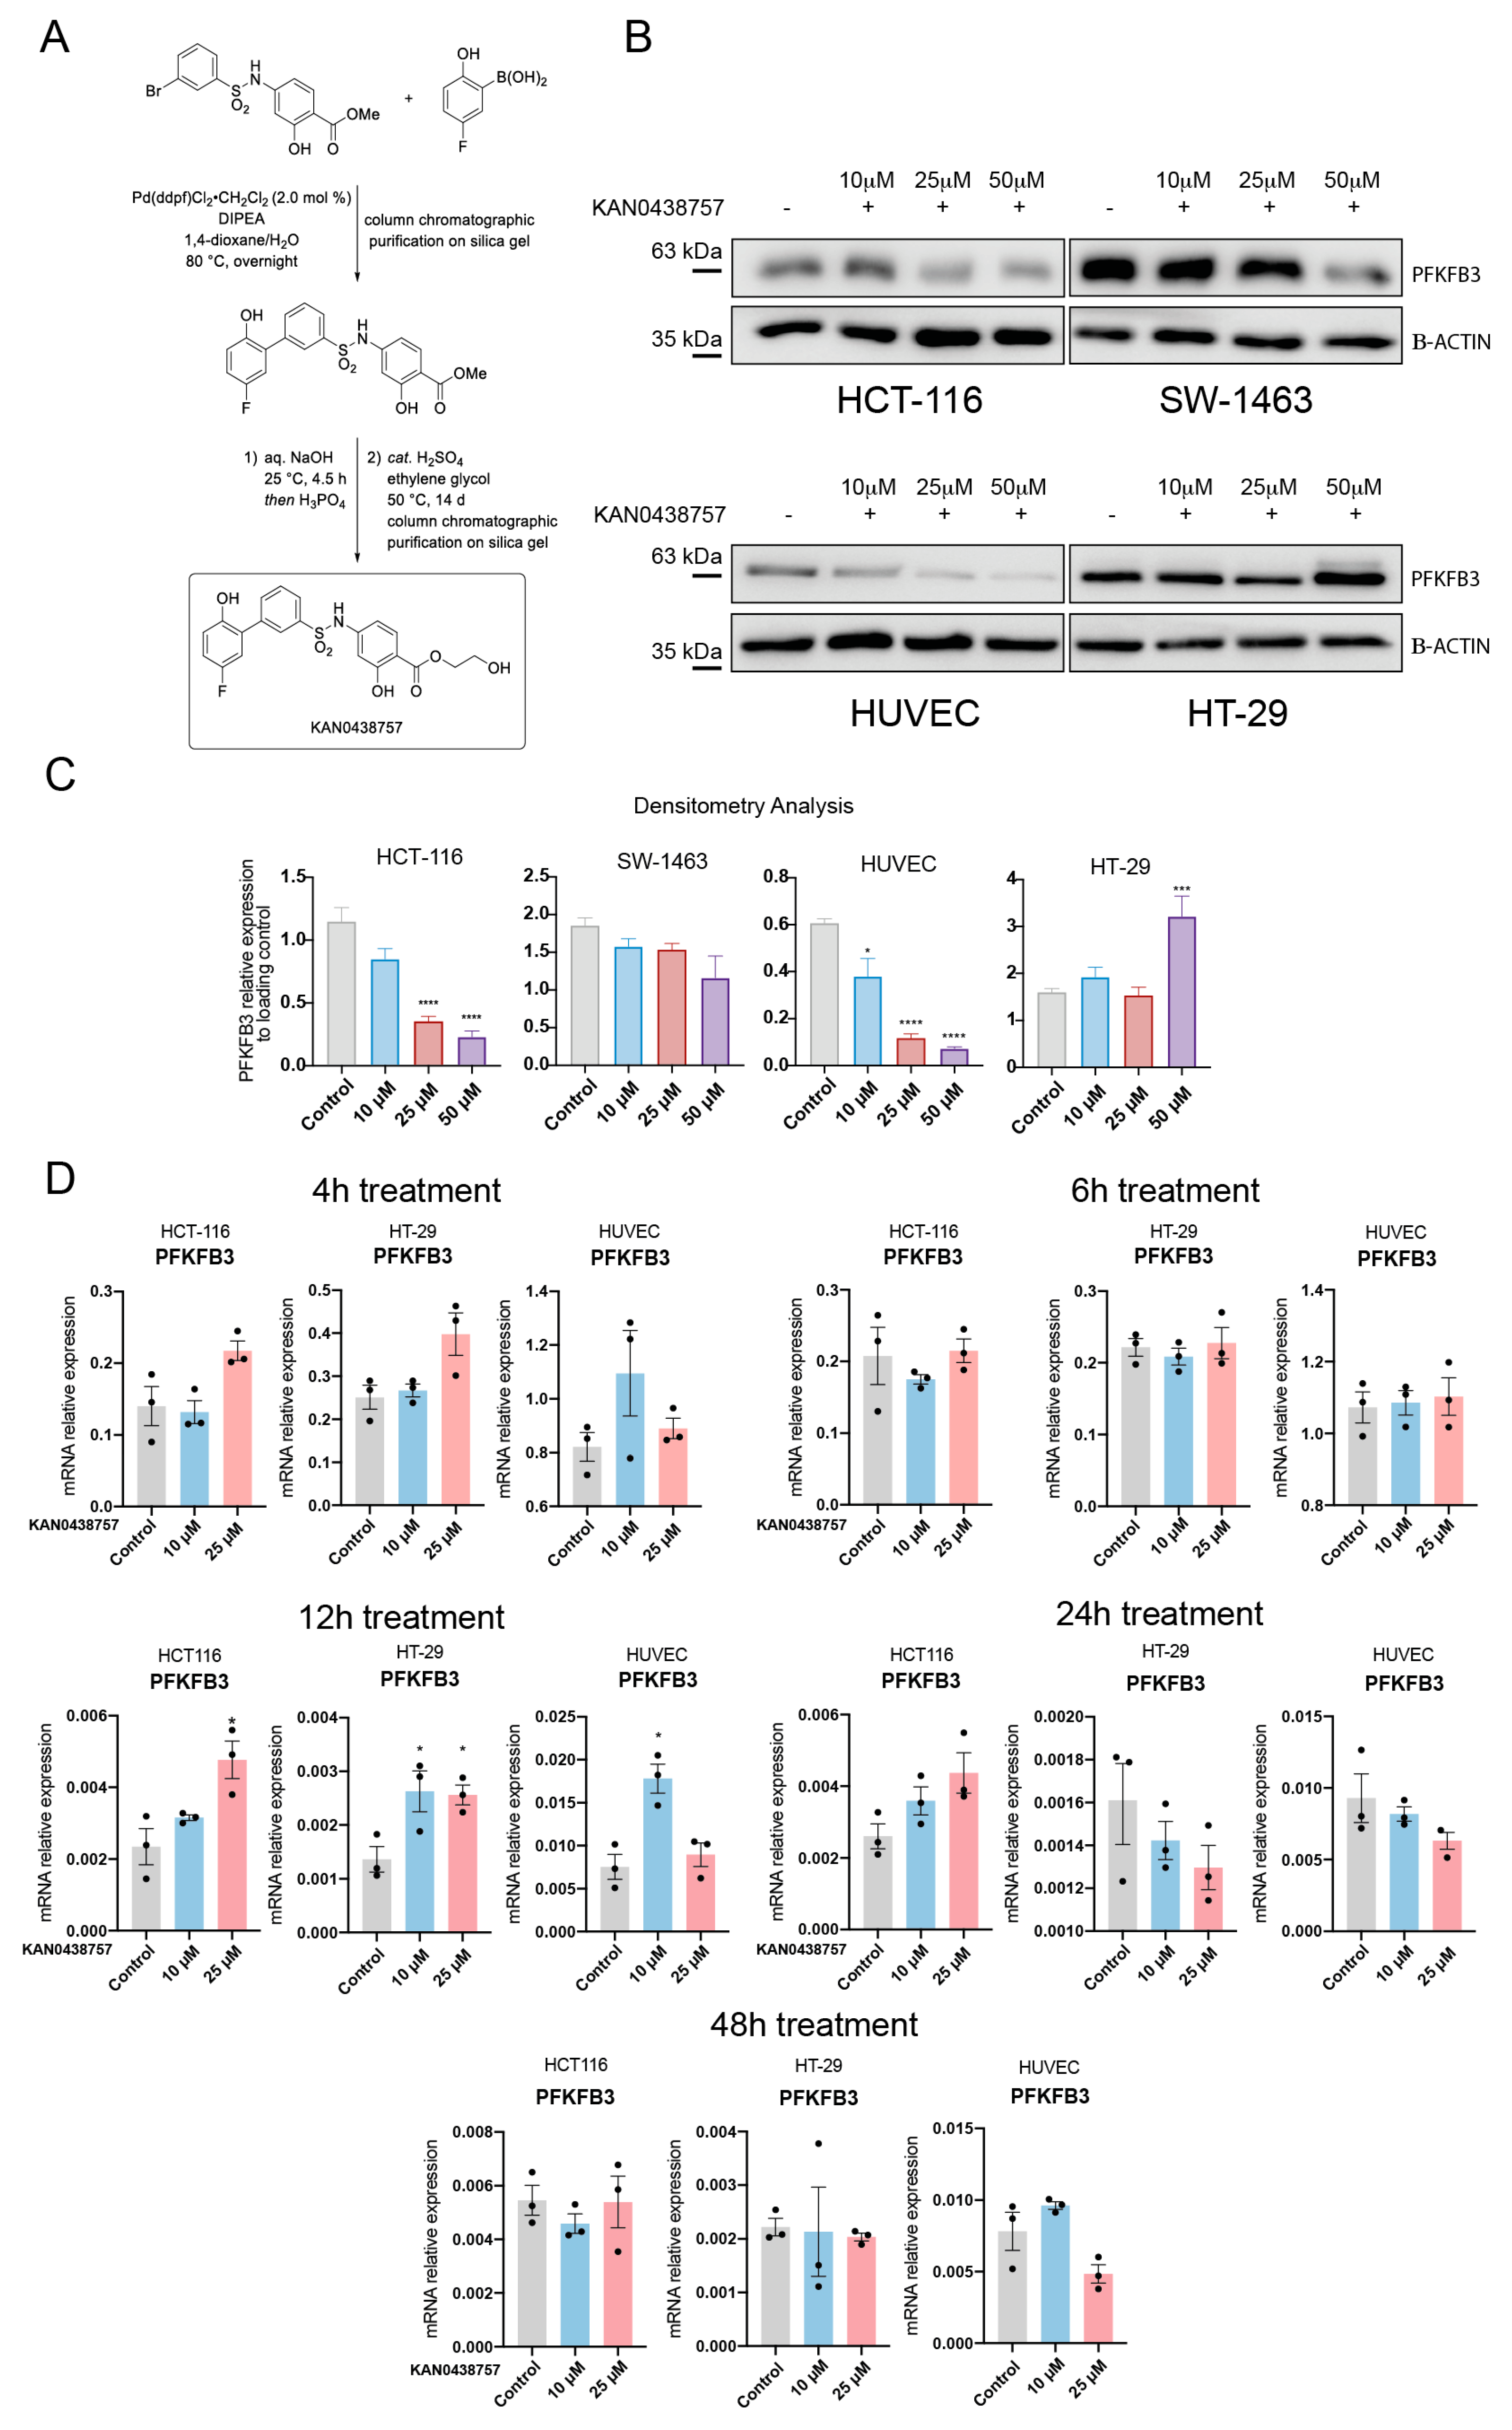
2.2. KAN0438757 Efficiently Reduces PFKFB3 Expression in Colorectal Cancer Cells, without Reducing Its Transcriptional Regulation
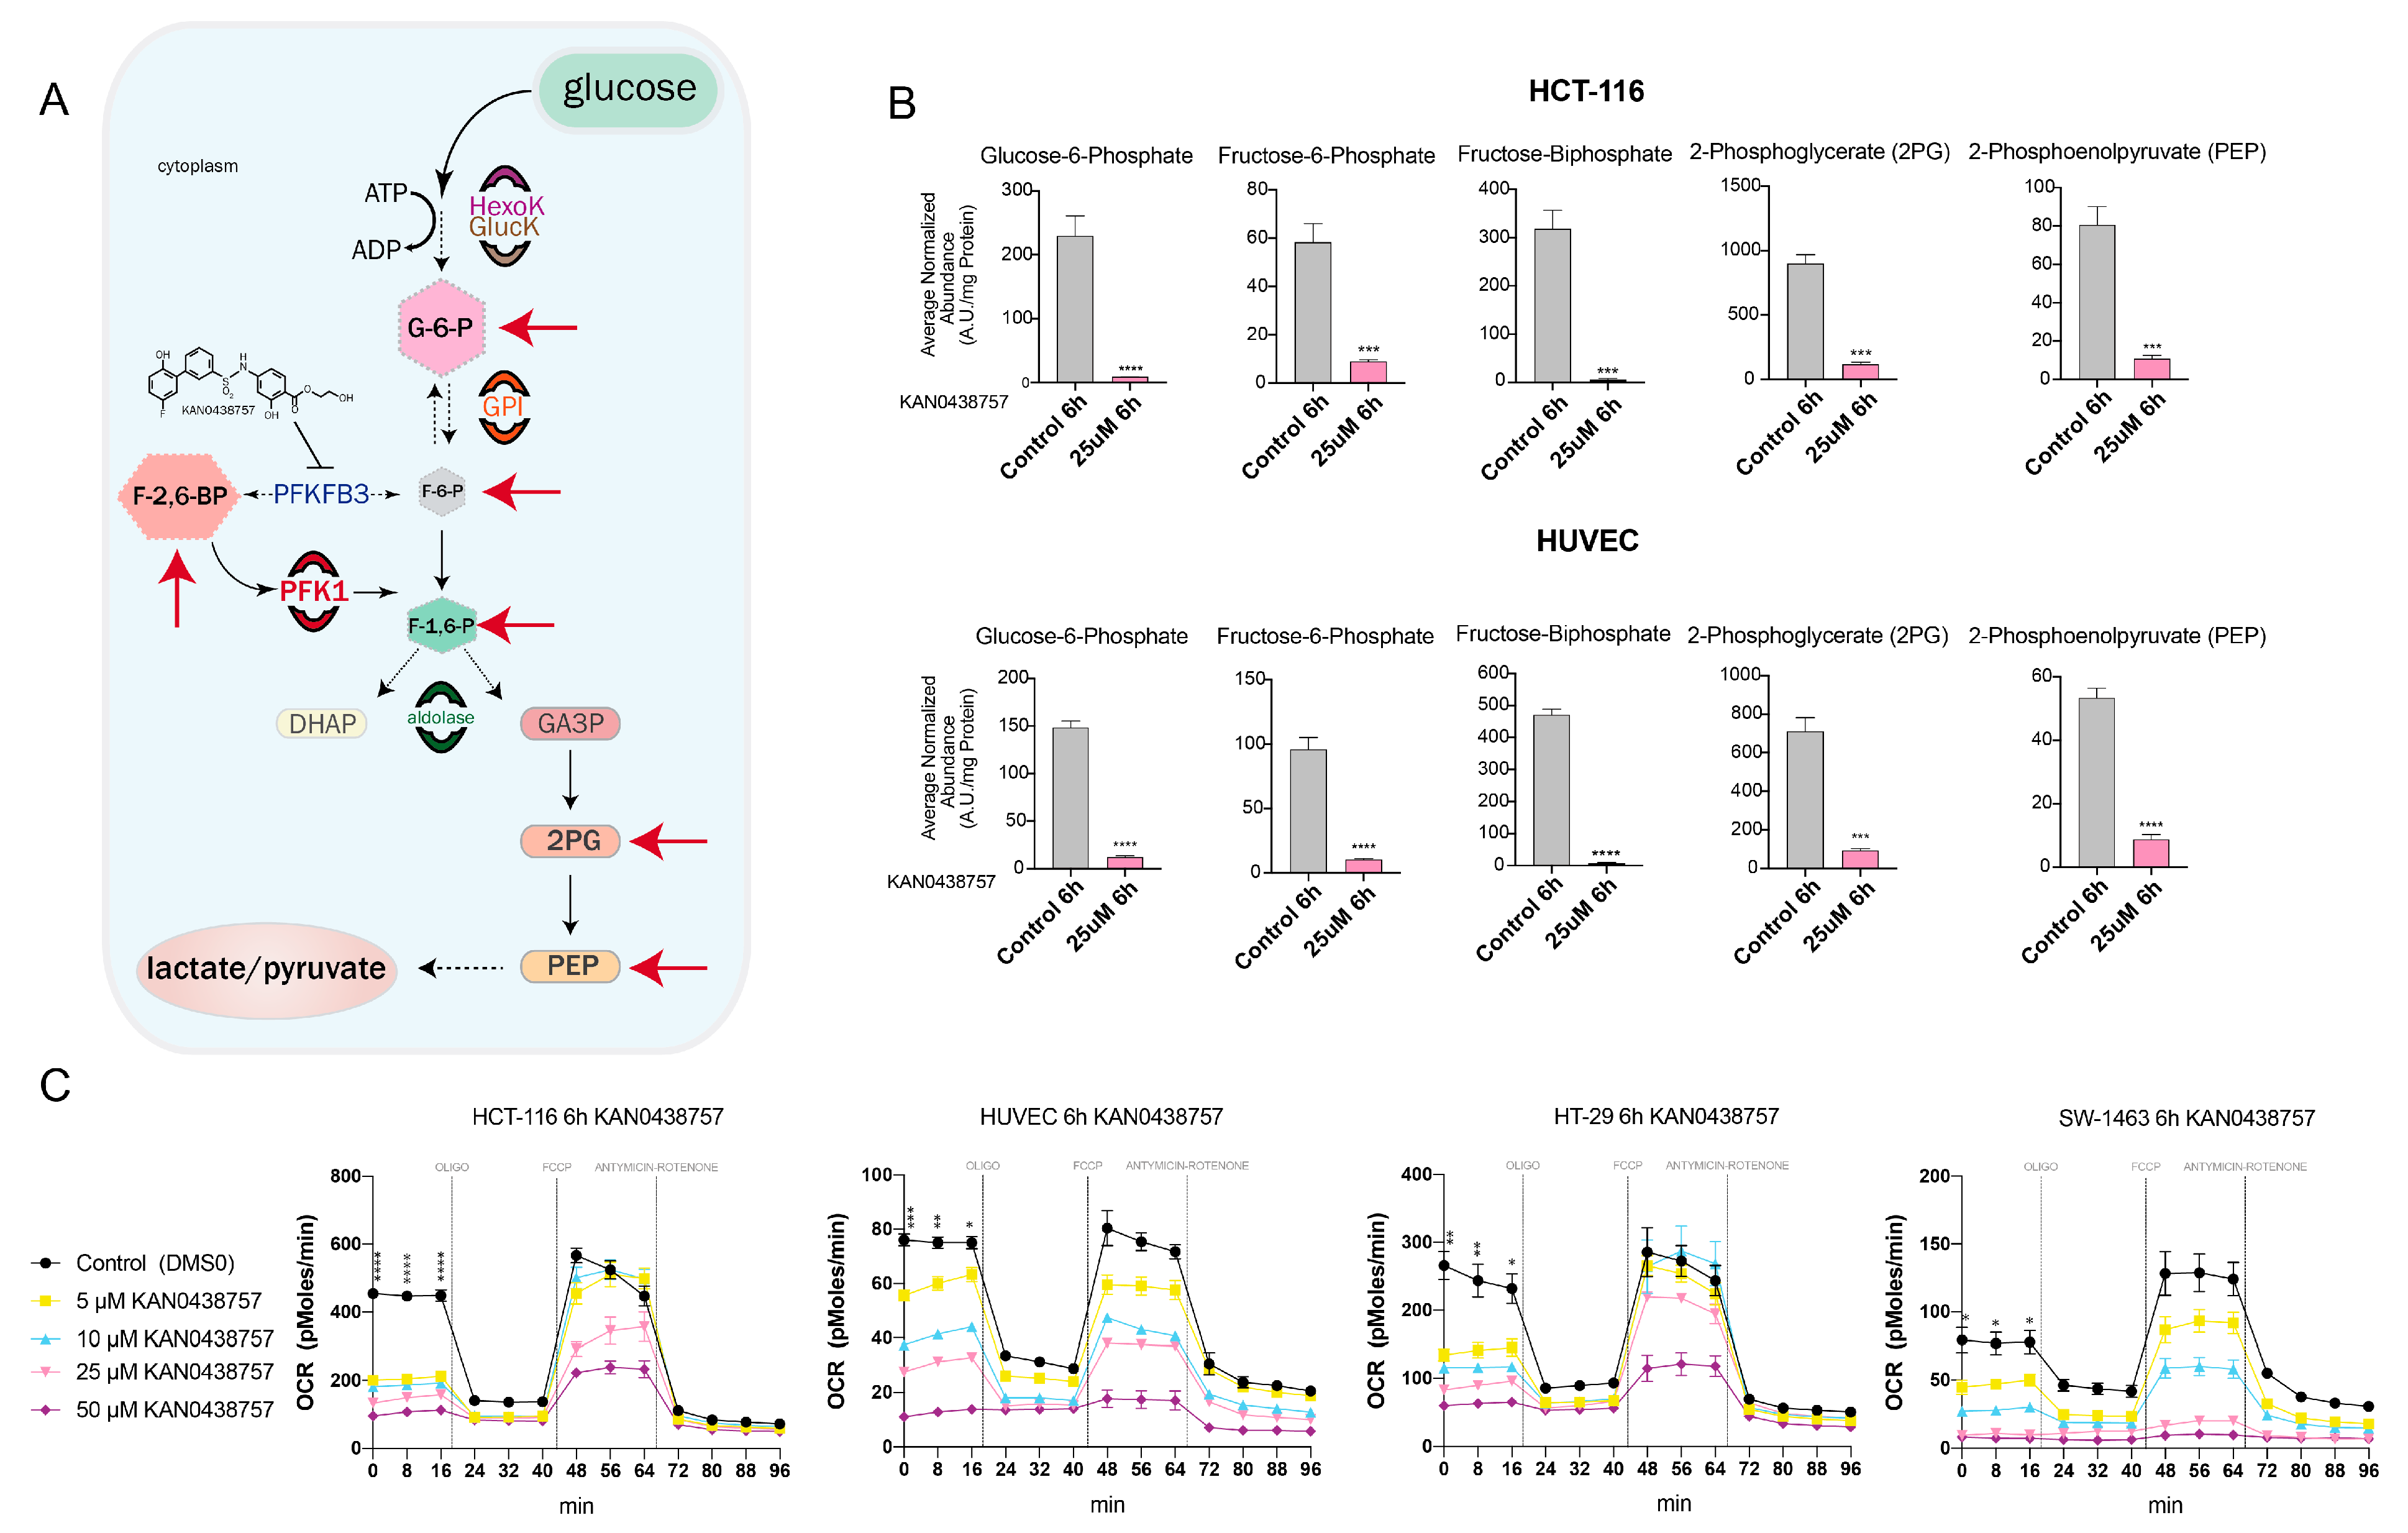
2.3. KAN0438757 Affects the Energy Metabolism of HUVECs and Colorectal Cancer Cells
2.4. PFKFB3 Inhibition by KAN0438757 Affects Cellular Growth, Reduces Cell Viability and Induces Cancer Cell Death in a Concentration-Dependent Manner
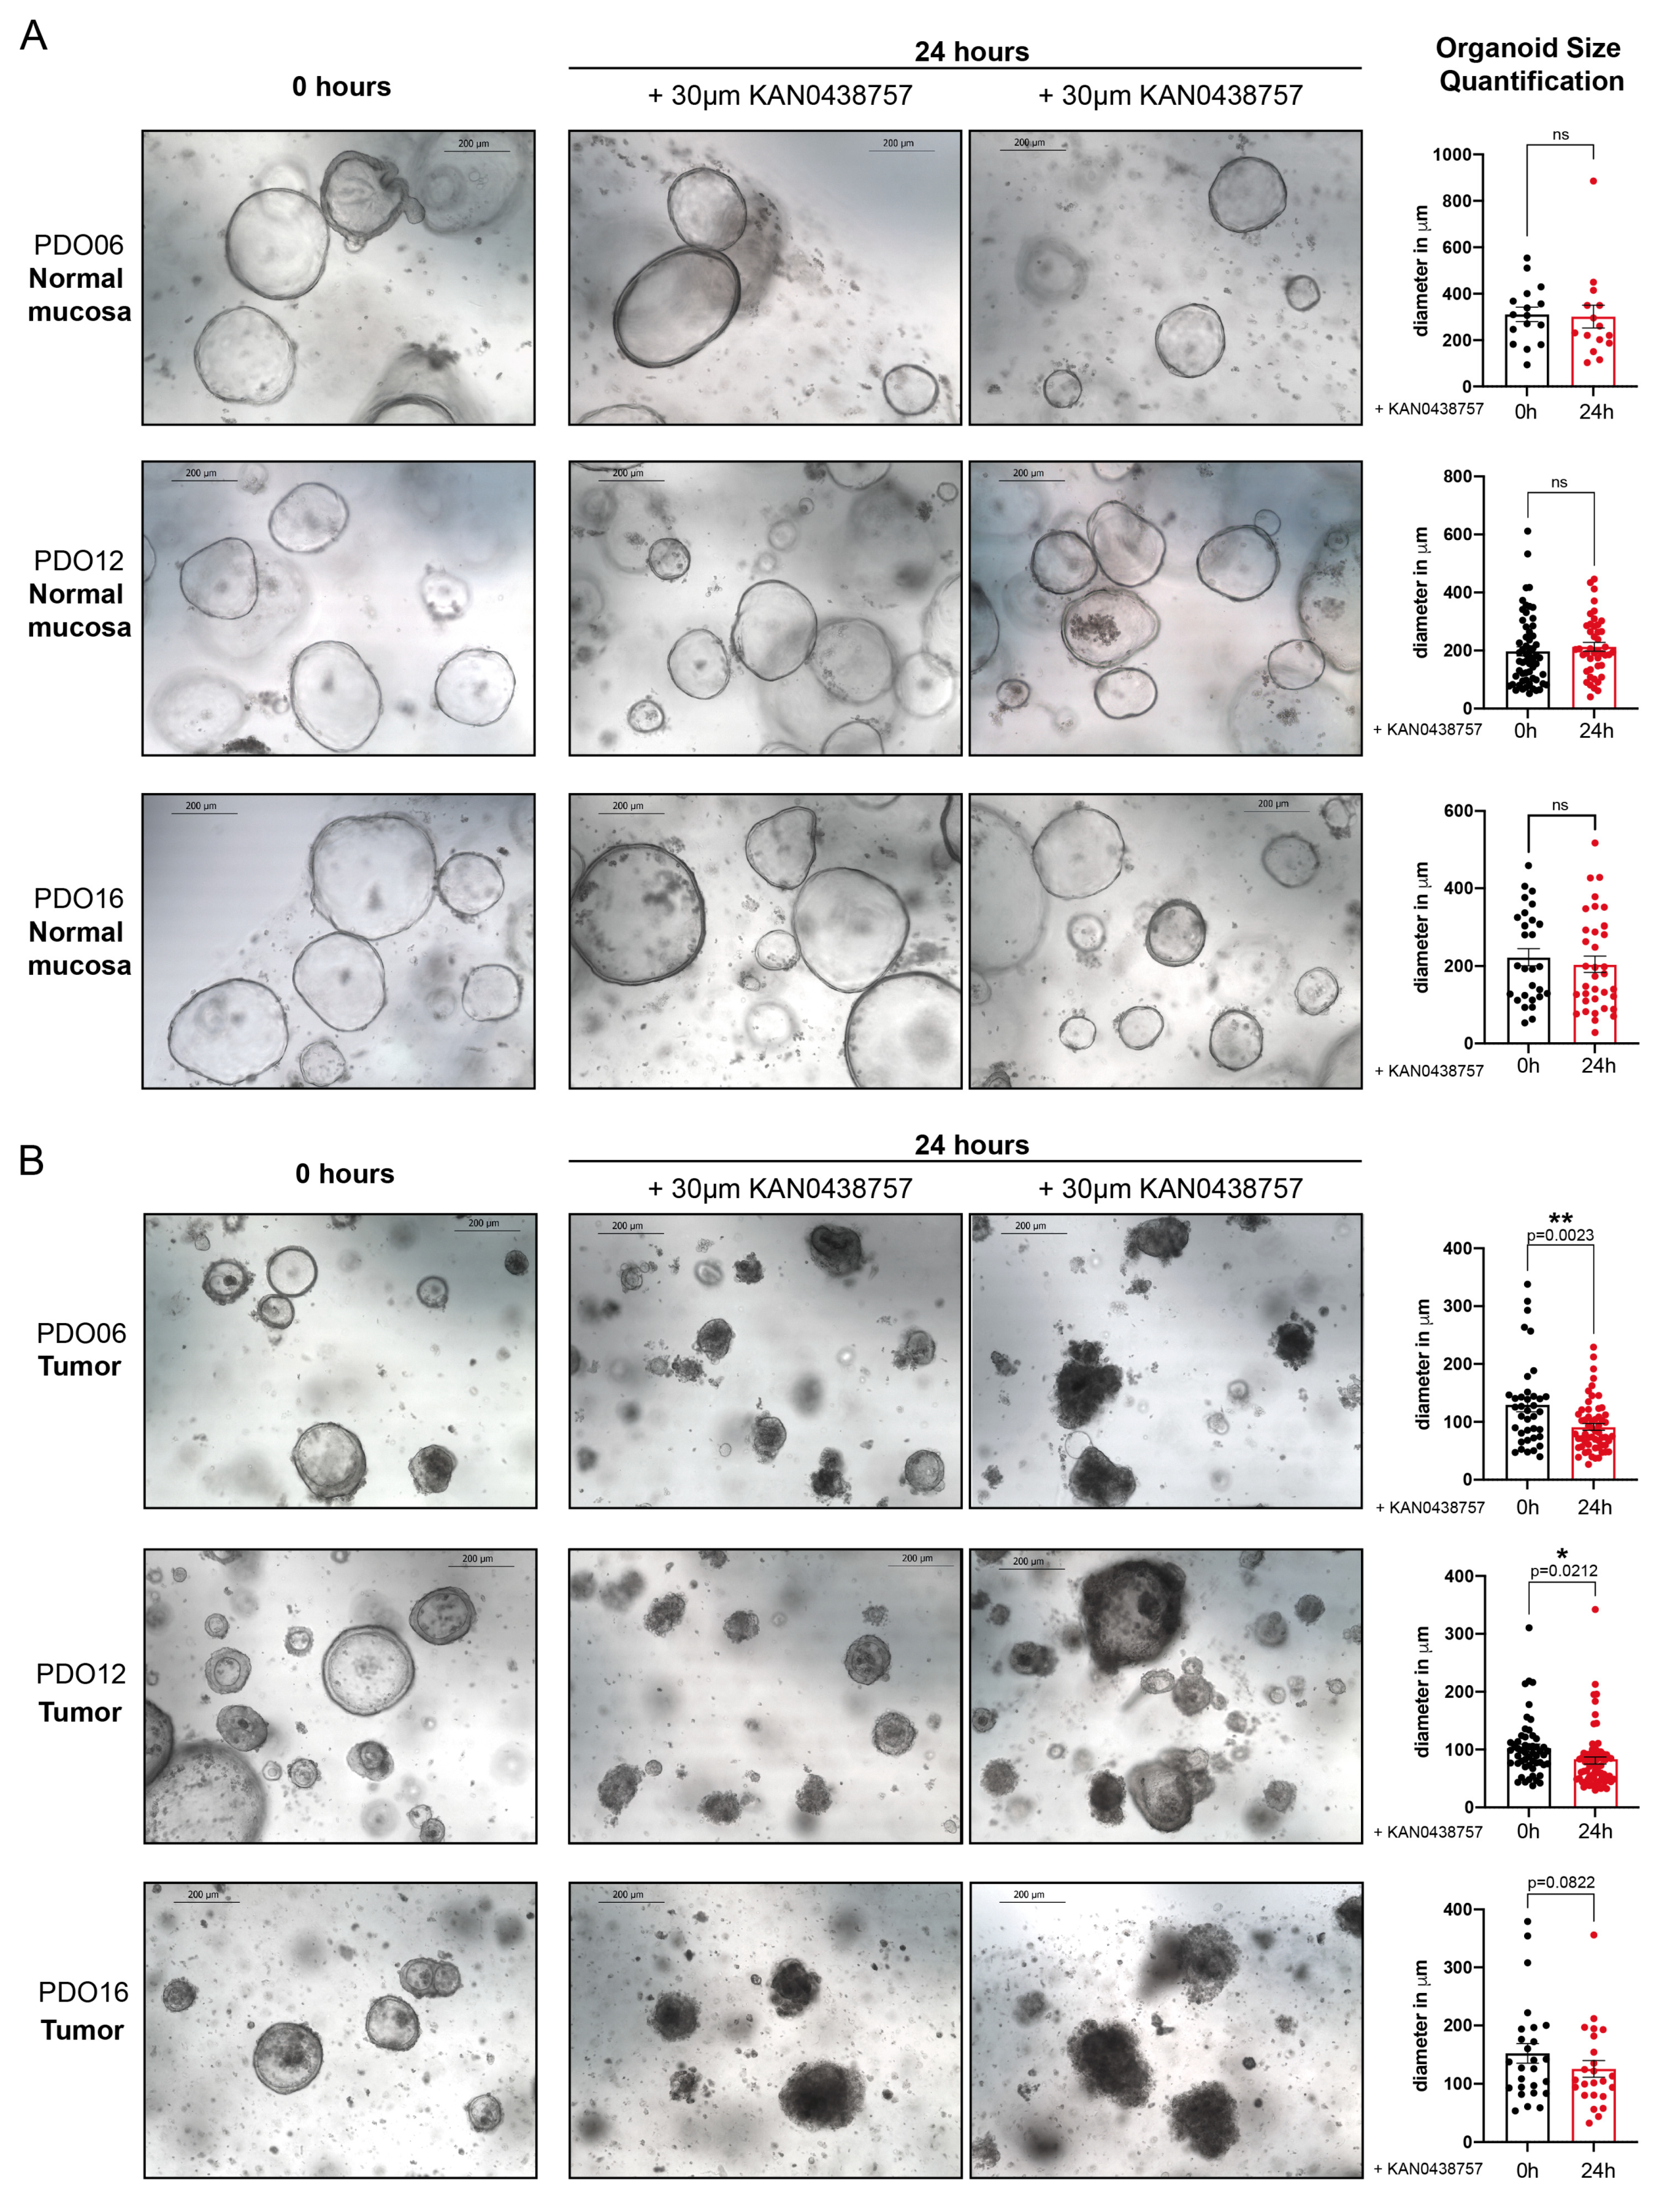
2.5. KAN0438757 Treatment Selectively Affects Intestinal Patient-Derived Tumor Organoids’ Morphology and Growth Preserving Normal Colon Organoids
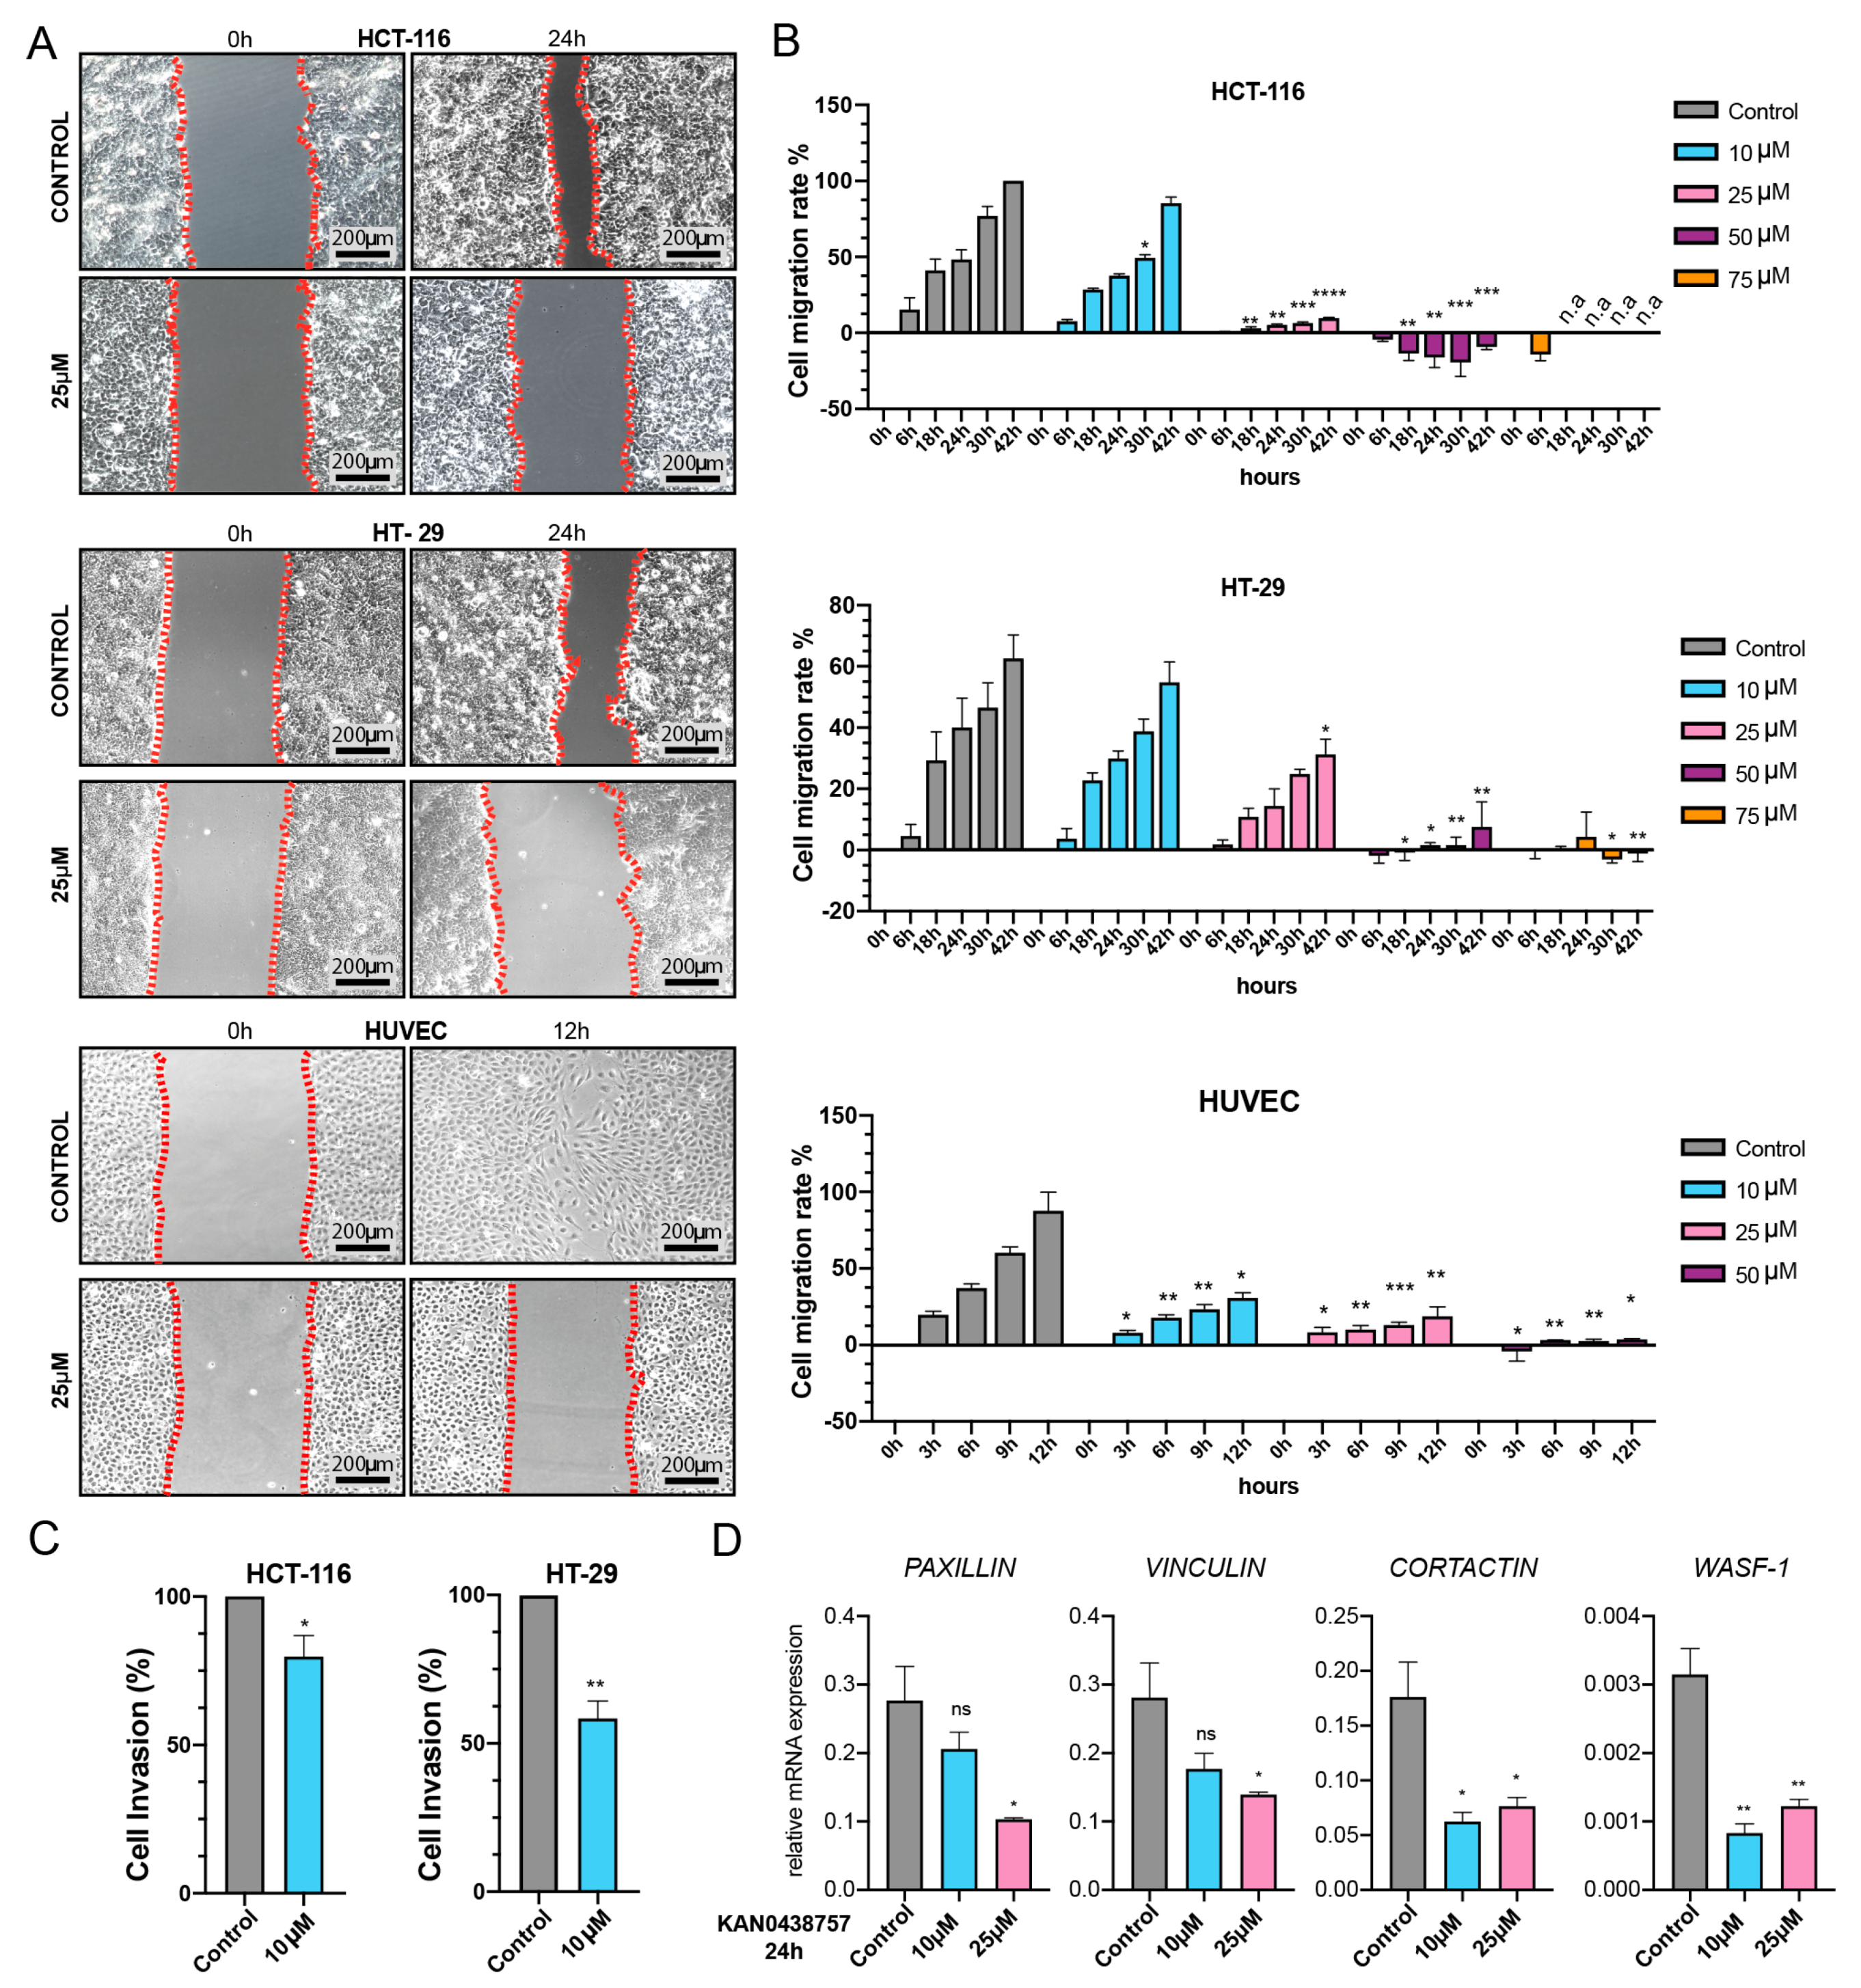
2.6. Cancer Cell Motility and Invasiveness Are Reduced by KAN0438757
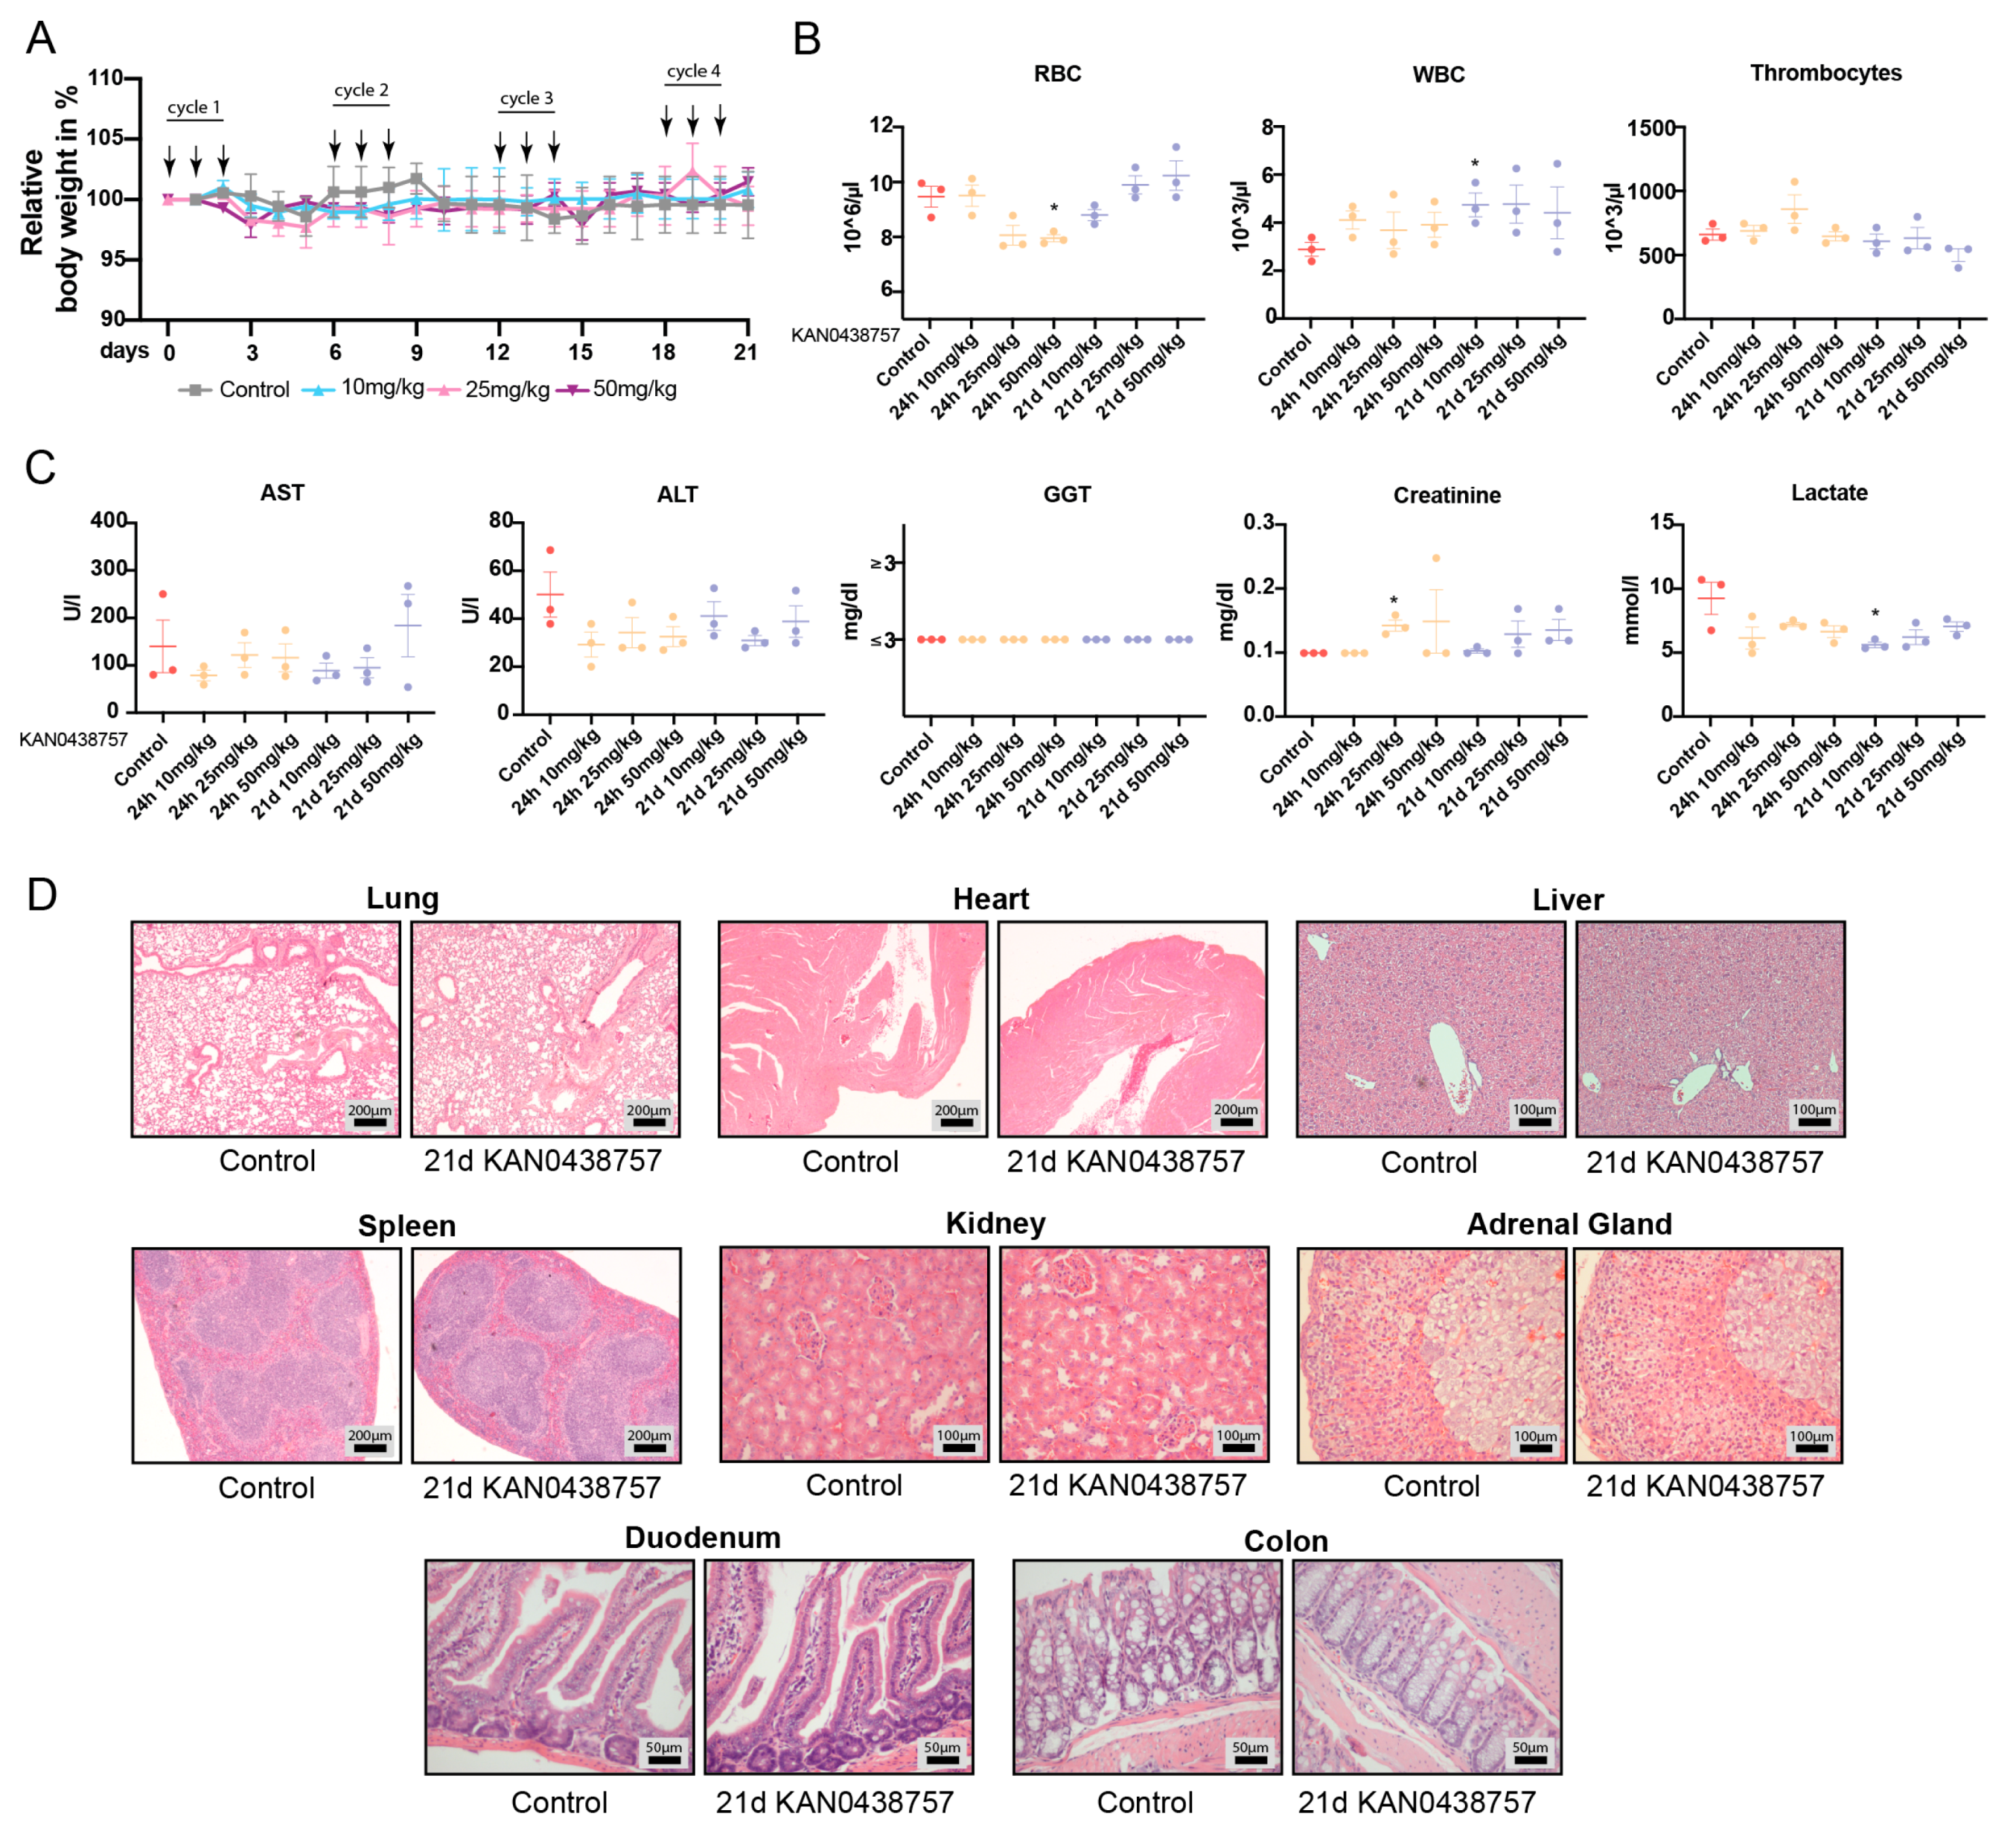
2.7. In Vivo Administration of KAN0438757 Shows No Relevant Systemic Toxic Effects
3. Discussions
4. Materials and Methods
4.1. Cell Culture
4.2. Patient-Derived Organoids
4.3. CellTiterBlue Assay
4.4. LDH-Assay
4.5. Invasion Assay
4.6. xCELLigence Assay
4.7. Animal Experiments
4.8. Seahorse Analysis
4.9. Histological Analysis
4.10. Immunoblot Analysis
4.11. Migration Assay
4.12. Real-Time PCR Analysis
4.13. In Silico Analyses and Patients Survival Assessment
4.14. Metabolomics
4.15. Statistical Analysis
5. Conclusions
Supplementary Materials
Author Contributions
Funding
Institutional Review Board Statement
Informed Consent Statement
Data Availability Statement
Acknowledgments
Conflicts of Interest
References
- Bray, F.; Ferlay, J.; Soerjomataram, I.; Siegel, R.L.; Torre, L.A.; Jemal, A. Global cancer statistics 2018: GLOBOCAN estimates of incidence and mortality worldwide for 36 cancers in 185 countries. CA Cancer J. Clin. 2018, 68, 394–424. [Google Scholar] [CrossRef] [Green Version]
- Lansdorp-Vogelaar, I.; van Ballegooijen, M.; Zauber, A.G.; Habbema, J.D.; Kuipers, E.J. Effect of rising chemotherapy costs on the cost savings of colorectal cancer screening. J. Natl Cancer Inst. 2009, 101, 1412–1422. [Google Scholar] [CrossRef] [Green Version]
- Dekker, E.; Tanis, P.J.; Vleugels, J.L.A.; Kasi, P.M.; Wallace, M.B. Colorectal cancer. Lancet 2019, 394, 1467–1480. [Google Scholar] [CrossRef]
- Paschke, S.; Jafarov, S.; Staib, L.; Kreuser, E.D.; Maulbecker-Armstrong, C.; Roitman, M.; Holm, T.; Harris, C.C.; Link, K.H.; Kornmann, M. Are Colon and Rectal Cancer Two Different Tumor Entities? A Proposal to Abandon the Term Colorectal Cancer. Int. J. Mol. Sci. 2018, 19, 2577. [Google Scholar] [CrossRef] [PubMed] [Green Version]
- Cantelmo, A.R.; Conradi, L.C.; Brajic, A.; Goveia, J.; Kalucka, J.; Pircher, A.; Chaturvedi, P.; Hol, J.; Thienpont, B.; Teuwen, L.A.; et al. Inhibition of the Glycolytic Activator PFKFB3 in Endothelium Induces Tumor Vessel Normalization, Impairs Metastasis, and Improves Chemotherapy. Cancer Cell 2016, 30, 968–985. [Google Scholar] [CrossRef] [PubMed] [Green Version]
- Gustafsson, N.M.S.; Farnegardh, K.; Bonagas, N.; Ninou, A.H.; Groth, P.; Wiita, E.; Jonsson, M.; Hallberg, K.; Lehto, J.; Pennisi, R.; et al. Targeting PFKFB3 radiosensitizes cancer cells and suppresses homologous recombination. Nat. Commun. 2018, 9, 3872. [Google Scholar] [CrossRef] [Green Version]
- De Bock, K.; Georgiadou, M.; Schoors, S.; Kuchnio, A.; Wong, B.W.; Cantelmo, A.R.; Quaegebeur, A.; Ghesquiere, B.; Cauwenberghs, S.; Eelen, G.; et al. Role of PFKFB3-driven glycolysis in vessel sprouting. Cell 2013, 154, 651–663. [Google Scholar] [CrossRef] [Green Version]
- Fang, S.; Fang, X. Advances in glucose metabolism research in colorectal cancer. Biomed. Rep. 2016, 5, 289–295. [Google Scholar] [CrossRef]
- Yan, L.; Raj, P.; Yao, W.; Ying, H. Glucose Metabolism in Pancreatic Cancer. Cancers 2019, 11, 1460. [Google Scholar] [CrossRef] [Green Version]
- Liu, Y.; Zhang, Z.; Wang, J.; Chen, C.; Tang, X.; Zhu, J.; Liu, J. Metabolic reprogramming results in abnormal glycolysis in gastric cancer: A review. Onco. Targets Ther. 2019, 12, 1195–1204. [Google Scholar] [CrossRef] [PubMed] [Green Version]
- Lee, N.C.W.; Carella, M.A.; Papa, S.; Bubici, C. High Expression of Glycolytic Genes in Cirrhosis Correlates with the Risk of Developing Liver Cancer. Front. Cell Dev. Biol. 2018, 6, 138. [Google Scholar] [CrossRef] [Green Version]
- Shi, T.; Ma, Y.; Cao, L.; Zhan, S.; Xu, Y.; Fu, F.; Liu, C.; Zhang, G.; Wang, Z.; Wang, R.; et al. B7-H3 promotes aerobic glycolysis and chemoresistance in colorectal cancer cells by regulating HK2. Cell Death Dis. 2019, 10, 308. [Google Scholar] [CrossRef] [Green Version]
- Lin, S.; Ma, R.; Zheng, X.Y.; Yu, H.; Liang, X.; Lin, H.; Cai, X.J. Meta-analysis of immunohistochemical expression of hypoxia inducible factor-1alpha as a prognostic role in gastric cancer. World J. Gastroenterol. 2014, 20, 1107–1113. [Google Scholar] [CrossRef]
- Baba, Y.; Nosho, K.; Shima, K.; Irahara, N.; Chan, A.T.; Meyerhardt, J.A.; Chung, D.C.; Giovannucci, E.L.; Fuchs, C.S.; Ogino, S. HIF1A overexpression is associated with poor prognosis in a cohort of 731 colorectal cancers. Am. J. Pathol. 2010, 176, 2292–2301. [Google Scholar] [CrossRef]
- Ayala, F.R.; Rocha, R.M.; Carvalho, K.C.; Carvalho, A.L.; da Cunha, I.W.; Lourenco, S.V.; Soares, F.A. GLUT1 and GLUT3 as potential prognostic markers for Oral Squamous Cell Carcinoma. Molecules 2010, 15, 2374–2387. [Google Scholar] [CrossRef]
- Wu, J.; Hu, L.; Wu, F.; Zou, L.; He, T. Poor prognosis of hexokinase 2 overexpression in solid tumors of digestive system: A meta-analysis. Oncotarget 2017, 8, 32332–32344. [Google Scholar] [CrossRef] [Green Version]
- Pisarsky, L.; Bill, R.; Fagiani, E.; Dimeloe, S.; Goosen, R.W.; Hagmann, J.; Hess, C.; Christofori, G. Targeting Metabolic Symbiosis to Overcome Resistance to Anti-angiogenic Therapy. Cell Rep. 2016, 15, 1161–1174. [Google Scholar] [CrossRef] [PubMed] [Green Version]
- Nicole Nowak, A.K.; Gutowicz, J. Up-regulation of key glycolysis proteins in cancer development. Open Life Sci. 2018, 13, 569–581. [Google Scholar] [CrossRef]
- Shi, L.; Pan, H.; Liu, Z.; Xie, J.; Han, W. Roles of PFKFB3 in cancer. Signal. Transduct. Target. Ther. 2017, 2, 17044. [Google Scholar] [CrossRef]
- Cancer Genome Atlas, N. Comprehensive molecular characterization of human colon and rectal cancer. Nature 2012, 487, 330–337. [Google Scholar] [CrossRef] [Green Version]
- Rohlenova, K.; Veys, K.; Miranda-Santos, I.; De Bock, K.; Carmeliet, P. Endothelial Cell Metabolism in Health and Disease. Trends Cell Biol. 2018, 28, 224–236. [Google Scholar] [CrossRef]
- Locasale, J.W. New concepts in feedback regulation of glucose metabolism. Curr. Opin. Syst. Biol. 2018, 8, 32–38. [Google Scholar] [CrossRef]
- Abbaszadeh, Z.; Cesmeli, S.; Biray Avci, C. Crucial players in glycolysis: Cancer progress. Gene 2020, 726, 144158. [Google Scholar] [CrossRef] [PubMed]
- Lenzen, S. A fresh view of glycolysis and glucokinase regulation: History and current status. J. Biol. Chem. 2014, 289, 12189–12194. [Google Scholar] [CrossRef] [Green Version]
- Ke, N.; Wang, X.; Xu, X.; Abassi, Y.A. The xCELLigence system for real-time and label-free monitoring of cell viability. Methods Mol. Biol. 2011, 740, 33–43. [Google Scholar] [CrossRef] [PubMed]
- Hamidi, H.; Lilja, J.; Ivaska, J. Using xCELLigence RTCA Instrument to Measure Cell Adhesion. Bio. Protoc. 2017, 7. [Google Scholar] [CrossRef]
- Drost, J.; Clevers, H. Organoids in cancer research. Nat. Rev. Cancer 2018, 18, 407–418. [Google Scholar] [CrossRef]
- Narasimhan, V.; Das, A.; Pham, T.; Wilson, K.; Kong, J.; Ramsay, R.; Heriot, A. Organoids: The new kid in cancer research. ANZ J. Surg. 2019, 89, 1189–1190. [Google Scholar] [CrossRef] [Green Version]
- Nowogrodzki, A. How cerebral organoids are guiding brain-cancer research and therapies. Nature 2018, 561, S48–S49. [Google Scholar] [CrossRef] [Green Version]
- Yang, L.; Yang, S.; Li, X.; Li, B.; Li, Y.; Zhang, X.; Ma, Y.; Peng, X.; Jin, H.; Fan, Q.; et al. Tumor organoids: From inception to future in cancer research. Cancer Lett. 2019, 454, 120–133. [Google Scholar] [CrossRef]
- Fujii, M.; Sato, T. Somatic cell-derived organoids as prototypes of human epithelial tissues and diseases. Nat. Mater. 2021, 20, 156–169. [Google Scholar] [CrossRef] [PubMed]
- Grabinger, T.; Luks, L.; Kostadinova, F.; Zimberlin, C.; Medema, J.P.; Leist, M.; Brunner, T. Ex vivo culture of intestinal crypt organoids as a model system for assessing cell death induction in intestinal epithelial cells and enteropathy. Cell Death Dis. 2014, 5, e1228. [Google Scholar] [CrossRef] [Green Version]
- Sato, T.; Stange, D.E.; Ferrante, M.; Vries, R.G.; Van Es, J.H.; Van den Brink, S.; Van Houdt, W.J.; Pronk, A.; Van Gorp, J.; Siersema, P.D.; et al. Long-term expansion of epithelial organoids from human colon, adenoma, adenocarcinoma, and Barrett’s epithelium. Gastroenterology 2011, 141, 1762–1772. [Google Scholar] [CrossRef]
- Parasuraman, S. Toxicological screening. J. Pharmacol. Pharmacother. 2011, 2, 74–79. [Google Scholar] [CrossRef] [Green Version]
- Conradi, L.C.; Brajic, A.; Cantelmo, A.R.; Bouche, A.; Kalucka, J.; Pircher, A.; Bruning, U.; Teuwen, L.A.; Vinckier, S.; Ghesquiere, B.; et al. Tumor vessel disintegration by maximum tolerable PFKFB3 blockade. Angiogenesis 2017, 20, 599–613. [Google Scholar] [CrossRef]
- Hughes, J.P.; Rees, S.; Kalindjian, S.B.; Philpott, K.L. Principles of early drug discovery. Br. J. Pharmacol. 2011, 162, 1239–1249. [Google Scholar] [CrossRef] [Green Version]
- Shoshan, M.C.; Linder, S. Target specificity and off-target effects as determinants of cancer drug efficacy. Expert Opin Drug Metab. Toxicol. 2008, 4, 273–280. [Google Scholar] [CrossRef] [PubMed]
- Hanahan, D.; Weinberg, R.A. Hallmarks of cancer: The next generation. Cell 2011, 144, 646–674. [Google Scholar] [CrossRef] [PubMed] [Green Version]
- Yan, S.; Zhou, N.; Zhang, D.; Zhang, K.; Zheng, W.; Bao, Y.; Yang, W. PFKFB3 Inhibition Attenuates Oxaliplatin-Induced Autophagy and Enhances Its Cytotoxicity in Colon Cancer Cells. Int. J. Mol. Sci. 2019, 20, 5415. [Google Scholar] [CrossRef] [Green Version]
- Richardson, D.A.; Sritangos, P.; James, A.D.; Sultan, A.; Bruce, J.I.E. Metabolic regulation of calcium pumps in pancreatic cancer: Role of phosphofructokinase-fructose-bisphosphatase-3 (PFKFB3). Cancer Metab. 2020, 8, 2. [Google Scholar] [CrossRef] [Green Version]
- Satoh, K.; Yachida, S.; Sugimoto, M.; Oshima, M.; Nakagawa, T.; Akamoto, S.; Tabata, S.; Saitoh, K.; Kato, K.; Sato, S.; et al. Global metabolic reprogramming of colorectal cancer occurs at adenoma stage and is induced by MYC. Proc. Natl. Acad. Sci. USA 2017, 114, E7697–E7706. [Google Scholar] [CrossRef] [PubMed] [Green Version]
- Ahmed, D.; Eide, P.W.; Eilertsen, I.A.; Danielsen, S.A.; Eknaes, M.; Hektoen, M.; Lind, G.E.; Lothe, R.A. Epigenetic and genetic features of 24 colon cancer cell lines. Oncogenesis 2013, 2, e71. [Google Scholar] [CrossRef]
- Schneider, M.; Huber, J.; Hadaschik, B.; Siegers, G.M.; Fiebig, H.H.; Schuler, J. Characterization of colon cancer cells: A functional approach characterizing CD133 as a potential stem cell marker. BMC Cancer 2012, 12, 96. [Google Scholar] [CrossRef] [Green Version]
- Balin-Gauthier, D.; Delord, J.P.; Rochaix, P.; Mallard, V.; Thomas, F.; Hennebelle, I.; Bugat, R.; Canal, P.; Allal, C. In vivo and in vitro antitumor activity of oxaliplatin in combination with cetuximab in human colorectal tumor cell lines expressing different level of EGFR. Cancer Chemother. Pharmacol. 2006, 57, 709–718. [Google Scholar] [CrossRef]
- Morales, C.; Ribas, M.; Aiza, G.; Peinado, M.A. Genetic determinants of methotrexate responsiveness and resistance in colon cancer cells. Oncogene 2005, 24, 6842–6847. [Google Scholar] [CrossRef] [PubMed] [Green Version]
- Pal, R.; Wei, N.; Song, N.; Wu, S.; Kim, R.S.; Wang, Y.; Gavin, P.G.; Lucas, P.C.; Srinivasan, A.; Allegra, C.J.; et al. Molecular subtypes of colorectal cancer in pre-clinical models show differential response to targeted therapies: Treatment implications beyond KRAS mutations. PLoS ONE 2018, 13, e0200836. [Google Scholar] [CrossRef] [PubMed] [Green Version]
- Park, J.H.; Kim, Y.H.; Park, E.H.; Lee, S.J.; Kim, H.; Kim, A.; Lee, S.B.; Shim, S.; Jang, H.; Myung, J.K.; et al. Effects of metformin and phenformin on apoptosis and epithelial-mesenchymal transition in chemoresistant rectal cancer. Cancer Sci. 2019, 110, 2834–2845. [Google Scholar] [CrossRef]
- Ebi, H.; Corcoran, R.B.; Singh, A.; Chen, Z.; Song, Y.; Lifshits, E.; Ryan, D.P.; Meyerhardt, J.A.; Benes, C.; Settleman, J.; et al. Receptor tyrosine kinases exert dominant control over PI3K signaling in human KRAS mutant colorectal cancers. J. Clin. Investig. 2011, 121, 4311–4321. [Google Scholar] [CrossRef] [PubMed]
- Papa, S.; Choy, P.M.; Bubici, C. The ERK and JNK pathways in the regulation of metabolic reprogramming. Oncogene 2019, 38, 2223–2240. [Google Scholar] [CrossRef] [Green Version]
- Oh, S.; Kim, H.; Nam, K.; Shin, I. Glut1 promotes cell proliferation, migration and invasion by regulating epidermal growth factor receptor and integrin signaling in triple-negative breast cancer cells. BMB Rep. 2017, 50, 132–137. [Google Scholar] [CrossRef]
- Zheng, J. Energy metabolism of cancer: Glycolysis versus oxidative phosphorylation (Review). Oncol. Lett. 2012, 4, 1151–1157. [Google Scholar] [CrossRef] [PubMed] [Green Version]
- Patel, T.H.; Cecchini, M. Targeted Therapies in Advanced Gastric Cancer. Curr. Treat. Options Oncol. 2020, 21, 70. [Google Scholar] [CrossRef] [PubMed]
- Gangi, A.; Lu, S.C. Chemotherapy-associated liver injury in colorectal cancer. Therap. Adv. Gastroenterol. 2020, 13, 1756284820924194. [Google Scholar] [CrossRef]
- Paulik, A.; Nekvindova, J.; Filip, S. Irinotecan toxicity during treatment of metastatic colorectal cancer: Focus on pharmacogenomics and personalized medicine. Tumori J. 2020, 106, 87–94. [Google Scholar] [CrossRef] [PubMed]
- Meunier, L.; Larrey, D. Chemotherapy-associated steatohepatitis. Ann. Hepatol. 2020, 19, 597–601. [Google Scholar] [CrossRef] [PubMed]
- Gelibter, A.J.; Caponnetto, S.; Urbano, F.; Emiliani, A.; Scagnoli, S.; Sirgiovanni, G.; Napoli, V.M.; Cortesi, E. Adjuvant chemotherapy in resected colon cancer: When, how and how long? Surg Oncol. 2019, 30, 100–107. [Google Scholar] [CrossRef]
- Han, J.; Meng, Q.; Xi, Q.; Wang, H.; Wu, G. PFKFB3 was overexpressed in gastric cancer patients and promoted the proliferation and migration of gastric cancer cells. Cancer Biomark 2017, 18, 249–256. [Google Scholar] [CrossRef]
- Peng, F.; Li, Q.; Sun, J.Y.; Luo, Y.; Chen, M.; Bao, Y. PFKFB3 is involved in breast cancer proliferation, migration, invasion and angiogenesis. Int. J. Oncol. 2018, 52, 945–954. [Google Scholar] [CrossRef] [PubMed] [Green Version]
- Yalcin, A.; Clem, B.F.; Imbert-Fernandez, Y.; Ozcan, S.C.; Peker, S.; O’Neal, J.; Klarer, A.C.; Clem, A.L.; Telang, S.; Chesney, J. 6-Phosphofructo-2-kinase (PFKFB3) promotes cell cycle progression and suppresses apoptosis via Cdk1-mediated phosphorylation of p27. Cell Death Dis. 2014, 5, e1337. [Google Scholar] [CrossRef]
- Zhu, W.; Ye, L.; Zhang, J.; Yu, P.; Wang, H.; Ye, Z.; Tian, J. PFK15, a Small Molecule Inhibitor of PFKFB3, Induces Cell Cycle Arrest, Apoptosis and Inhibits Invasion in Gastric Cancer. PLoS ONE 2016, 11, e0163768. [Google Scholar] [CrossRef] [PubMed]
- Du, J.Y.; Wang, L.F.; Wang, Q.; Yu, L.D. miR-26b inhibits proliferation, migration, invasion and apoptosis induction via the downregulation of 6-phosphofructo-2-kinase/fructose-2,6-bisphosphatase-3 driven glycolysis in osteosarcoma cells. Oncol. Rep. 2015, 33, 1890–1898. [Google Scholar] [CrossRef] [Green Version]
- Sottnik, J.L.; Lori, J.C.; Rose, B.J.; Thamm, D.H. Glycolysis inhibition by 2-deoxy-D-glucose reverts the metastatic phenotype in vitro and in vivo. Clin. Exp. Metastasis 2011, 28, 865–875. [Google Scholar] [CrossRef]
- Han, J.; Meng, Q.; Xi, Q.; Zhang, Y.; Zhuang, Q.; Han, Y.; Jiang, Y.; Ding, Q.; Wu, G. Interleukin-6 stimulates aerobic glycolysis by regulating PFKFB3 at early stage of colorectal cancer. Int. J. Oncol. 2016, 48, 215–224. [Google Scholar] [CrossRef] [PubMed]
- Shiratori, R.; Furuichi, K.; Yamaguchi, M.; Miyazaki, N.; Aoki, H.; Chibana, H.; Ito, K.; Aoki, S. Glycolytic suppression dramatically changes the intracellular metabolic profile of multiple cancer cell lines in a mitochondrial metabolism-dependent manner. Sci. Rep. 2019, 9, 18699. [Google Scholar] [CrossRef] [Green Version]
- Weyandt, J.D.; Thompson, C.B.; Giaccia, A.J.; Rathmell, W.K. Metabolic Alterations in Cancer and Their Potential as Therapeutic Targets. Am. Soc. Clin. Oncol. Educ. Book 2017, 37, 825–832. [Google Scholar] [CrossRef] [PubMed]
- Hongmao, S. A Pratical Guide to Rational Drug Desing; ELSEVIER: Woodhead, Cambridge, UK, 2015; p. 292. [Google Scholar] [CrossRef]
- Fielden, M.R.; Kolaja, K.L. The role of early in vivo toxicity testing in drug discovery toxicology. Expert Opin. Drug Saf. 2008, 7, 107–110. [Google Scholar] [CrossRef] [PubMed]
- Mihara, E.; Hirai, H.; Yamamoto, H.; Tamura-Kawakami, K.; Matano, M.; Kikuchi, A.; Sato, T.; Takagi, J. Active and water-soluble form of lipidated Wnt protein is maintained by a serum glycoprotein afamin/alpha-albumin. Elife 2016, 5. [Google Scholar] [CrossRef] [PubMed]
- Hagemann, T.; Robinson, S.C.; Schulz, M.; Trumper, L.; Balkwill, F.R.; Binder, C. Enhanced invasiveness of breast cancer cell lines upon co-cultivation with macrophages is due to TNF-alpha dependent up-regulation of matrix metalloproteases. Carcinogenesis 2004, 25, 1543–1549. [Google Scholar] [CrossRef] [Green Version]
- Liang, Y.; Hou, L.; Li, L.; Li, L.; Zhu, L.; Wang, Y.; Huang, X.; Hou, Y.; Zhu, D.; Zou, H.; et al. Dichloroacetate restores colorectal cancer chemosensitivity through the p53/miR-149-3p/PDK2-mediated glucose metabolic pathway. Oncogene 2020, 39, 469–485. [Google Scholar] [CrossRef]
- Abiatari, I.; DeOliveira, T.; Kerkadze, V.; Schwager, C.; Esposito, I.; Giese, N.A.; Huber, P.; Bergman, F.; Abdollahi, A.; Friess, H.; et al. Consensus transcriptome signature of perineural invasion in pancreatic carcinoma. Mol. Cancer Ther. 2009, 8, 1494–1504. [Google Scholar] [CrossRef] [Green Version]
- Ferrandon, S.; DeVecchio, J.; Duraes, L.; Chouhan, H.; Karagkounis, G.; Davenport, J.; Orloff, M.; Liska, D.; Kalady, M.F. CoA Synthase (COASY) Mediates Radiation Resistance via PI3K Signaling in Rectal Cancer. Cancer Res. 2020, 80, 334–346. [Google Scholar] [CrossRef] [Green Version]
- Jo, P.; Nietert, M.; Gusky, L.; Kitz, J.; Conradi, L.C.; Muller-Dornieden, A.; Schuler, P.; Wolff, H.A.; Ruschoff, J.; Strobel, P.; et al. Neoadjuvant Therapy in Rectal Cancer—Biobanking of Preoperative Tumor Biopsies. Sci. Rep. 2016, 6, 35589. [Google Scholar] [CrossRef] [PubMed] [Green Version]
- Bremer, S.C.B.; Conradi, L.C.; Mechie, N.C.; Amanzada, A.; Mavropoulou, E.; Kitz, J.; Ghadimi, M.; Ellenrieder, V.; Strobel, P.; Hessmann, E.; et al. Enhancer of Zeste Homolog 2 in Colorectal Cancer Development and Progression. Digestion 2019, 1–9. [Google Scholar] [CrossRef]
- Colaprico, A.; Silva, T.C.; Olsen, C.; Garofano, L.; Cava, C.; Garolini, D.; Sabedot, T.S.; Malta, T.M.; Pagnotta, S.M.; Castiglioni, I.; et al. TCGAbiolinks: An R/Bioconductor package for integrative analysis of TCGA data. Nucleic Acids Res. 2016, 44, e71. [Google Scholar] [CrossRef] [PubMed]
- Serebriiskii, I.G.; Connelly, C.; Frampton, G.; Newberg, J.; Cooke, M.; Miller, V.; Ali, S.; Ross, J.S.; Handorf, E.; Arora, S.; et al. Comprehensive characterization of RAS mutations in colon and rectal cancers in old and young patients. Nat. Commun. 2019, 10, 3722. [Google Scholar] [CrossRef] [Green Version]
- Tomczak, K.; Czerwinska, P.; Wiznerowicz, M. The Cancer Genome Atlas (TCGA): An immeasurable source of knowledge. Contemp. Oncol. (Pozn) 2015, 19, A68–A77. [Google Scholar] [CrossRef]
- Robinson, M.D.; Oshlack, A. A scaling normalization method for differential expression analysis of RNA-seq data. Genome Biol. 2010, 11, R25. [Google Scholar] [CrossRef] [Green Version]
- Robinson, M.D.; McCarthy, D.J.; Smyth, G.K. edgeR: A Bioconductor package for differential expression analysis of digital gene expression data. Bioinformatics 2010, 26, 139–140. [Google Scholar] [CrossRef] [Green Version]
- Ritchie, M.E.; Phipson, B.; Wu, D.; Hu, Y.; Law, C.W.; Shi, W.; Smyth, G.K. limma powers differential expression analyses for RNA-sequencing and microarray studies. Nucleic Acids Res. 2015, 43, e47. [Google Scholar] [CrossRef] [PubMed]
- Taverna, F.; Goveia, J.; Karakach, T.K.; Khan, S.; Rohlenova, K.; Treps, L.; Subramanian, A.; Schoonjans, L.; Dewerchin, M.; Eelen, G.; et al. BIOMEX: An interactive workflow for (single cell) omics data interpretation and visualization. Nucleic Acids Res. 2020, 48, W385–W394. [Google Scholar] [CrossRef] [PubMed]
- Elia, I.; Broekaert, D.; Christen, S.; Boon, R.; Radaelli, E.; Orth, M.F.; Verfaillie, C.; Grunewald, T.G.P.; Fendt, S.M. Proline metabolism supports metastasis formation and could be inhibited to selectively target metastasizing cancer cells. Nat. Commun. 2017, 8, 15267. [Google Scholar] [CrossRef] [PubMed]
- van Gorsel, M.; Elia, I.; Fendt, S.M. 13C Tracer Analysis and Metabolomics in 3D Cultured Cancer Cells. In Metabolic Signaling, Methods and Protocols, 1st ed.; Fendt, S.-M., Lunt, S., Eds.; Humana Press: New York, NY, USA, 2019; pp. 53–66. [Google Scholar] [CrossRef]


Publisher’s Note: MDPI stays neutral with regard to jurisdictional claims in published maps and institutional affiliations. |
© 2021 by the authors. Licensee MDPI, Basel, Switzerland. This article is an open access article distributed under the terms and conditions of the Creative Commons Attribution (CC BY) license (http://creativecommons.org/licenses/by/4.0/).
Share and Cite
De Oliveira, T.; Goldhardt, T.; Edelmann, M.; Rogge, T.; Rauch, K.; Kyuchukov, N.D.; Menck, K.; Bleckmann, A.; Kalucka, J.; Khan, S.; et al. Effects of the Novel PFKFB3 Inhibitor KAN0438757 on Colorectal Cancer Cells and Its Systemic Toxicity Evaluation In Vivo. Cancers 2021, 13, 1011. https://0-doi-org.brum.beds.ac.uk/10.3390/cancers13051011
De Oliveira T, Goldhardt T, Edelmann M, Rogge T, Rauch K, Kyuchukov ND, Menck K, Bleckmann A, Kalucka J, Khan S, et al. Effects of the Novel PFKFB3 Inhibitor KAN0438757 on Colorectal Cancer Cells and Its Systemic Toxicity Evaluation In Vivo. Cancers. 2021; 13(5):1011. https://0-doi-org.brum.beds.ac.uk/10.3390/cancers13051011
Chicago/Turabian StyleDe Oliveira, Tiago, Tina Goldhardt, Marcus Edelmann, Torben Rogge, Karsten Rauch, Nikola Dobrinov Kyuchukov, Kerstin Menck, Annalen Bleckmann, Joanna Kalucka, Shawez Khan, and et al. 2021. "Effects of the Novel PFKFB3 Inhibitor KAN0438757 on Colorectal Cancer Cells and Its Systemic Toxicity Evaluation In Vivo" Cancers 13, no. 5: 1011. https://0-doi-org.brum.beds.ac.uk/10.3390/cancers13051011