
Pure Solid Pattern of Non-Small Cell Lung Cancer and Clustered Circulating Tumor Cells
 ,
,
Abstract
:Simple Summary
Abstract

1. Introduction
2. Materials and Methods
2.1. Ethical Considerations
2.2. Evaluation Outcomes
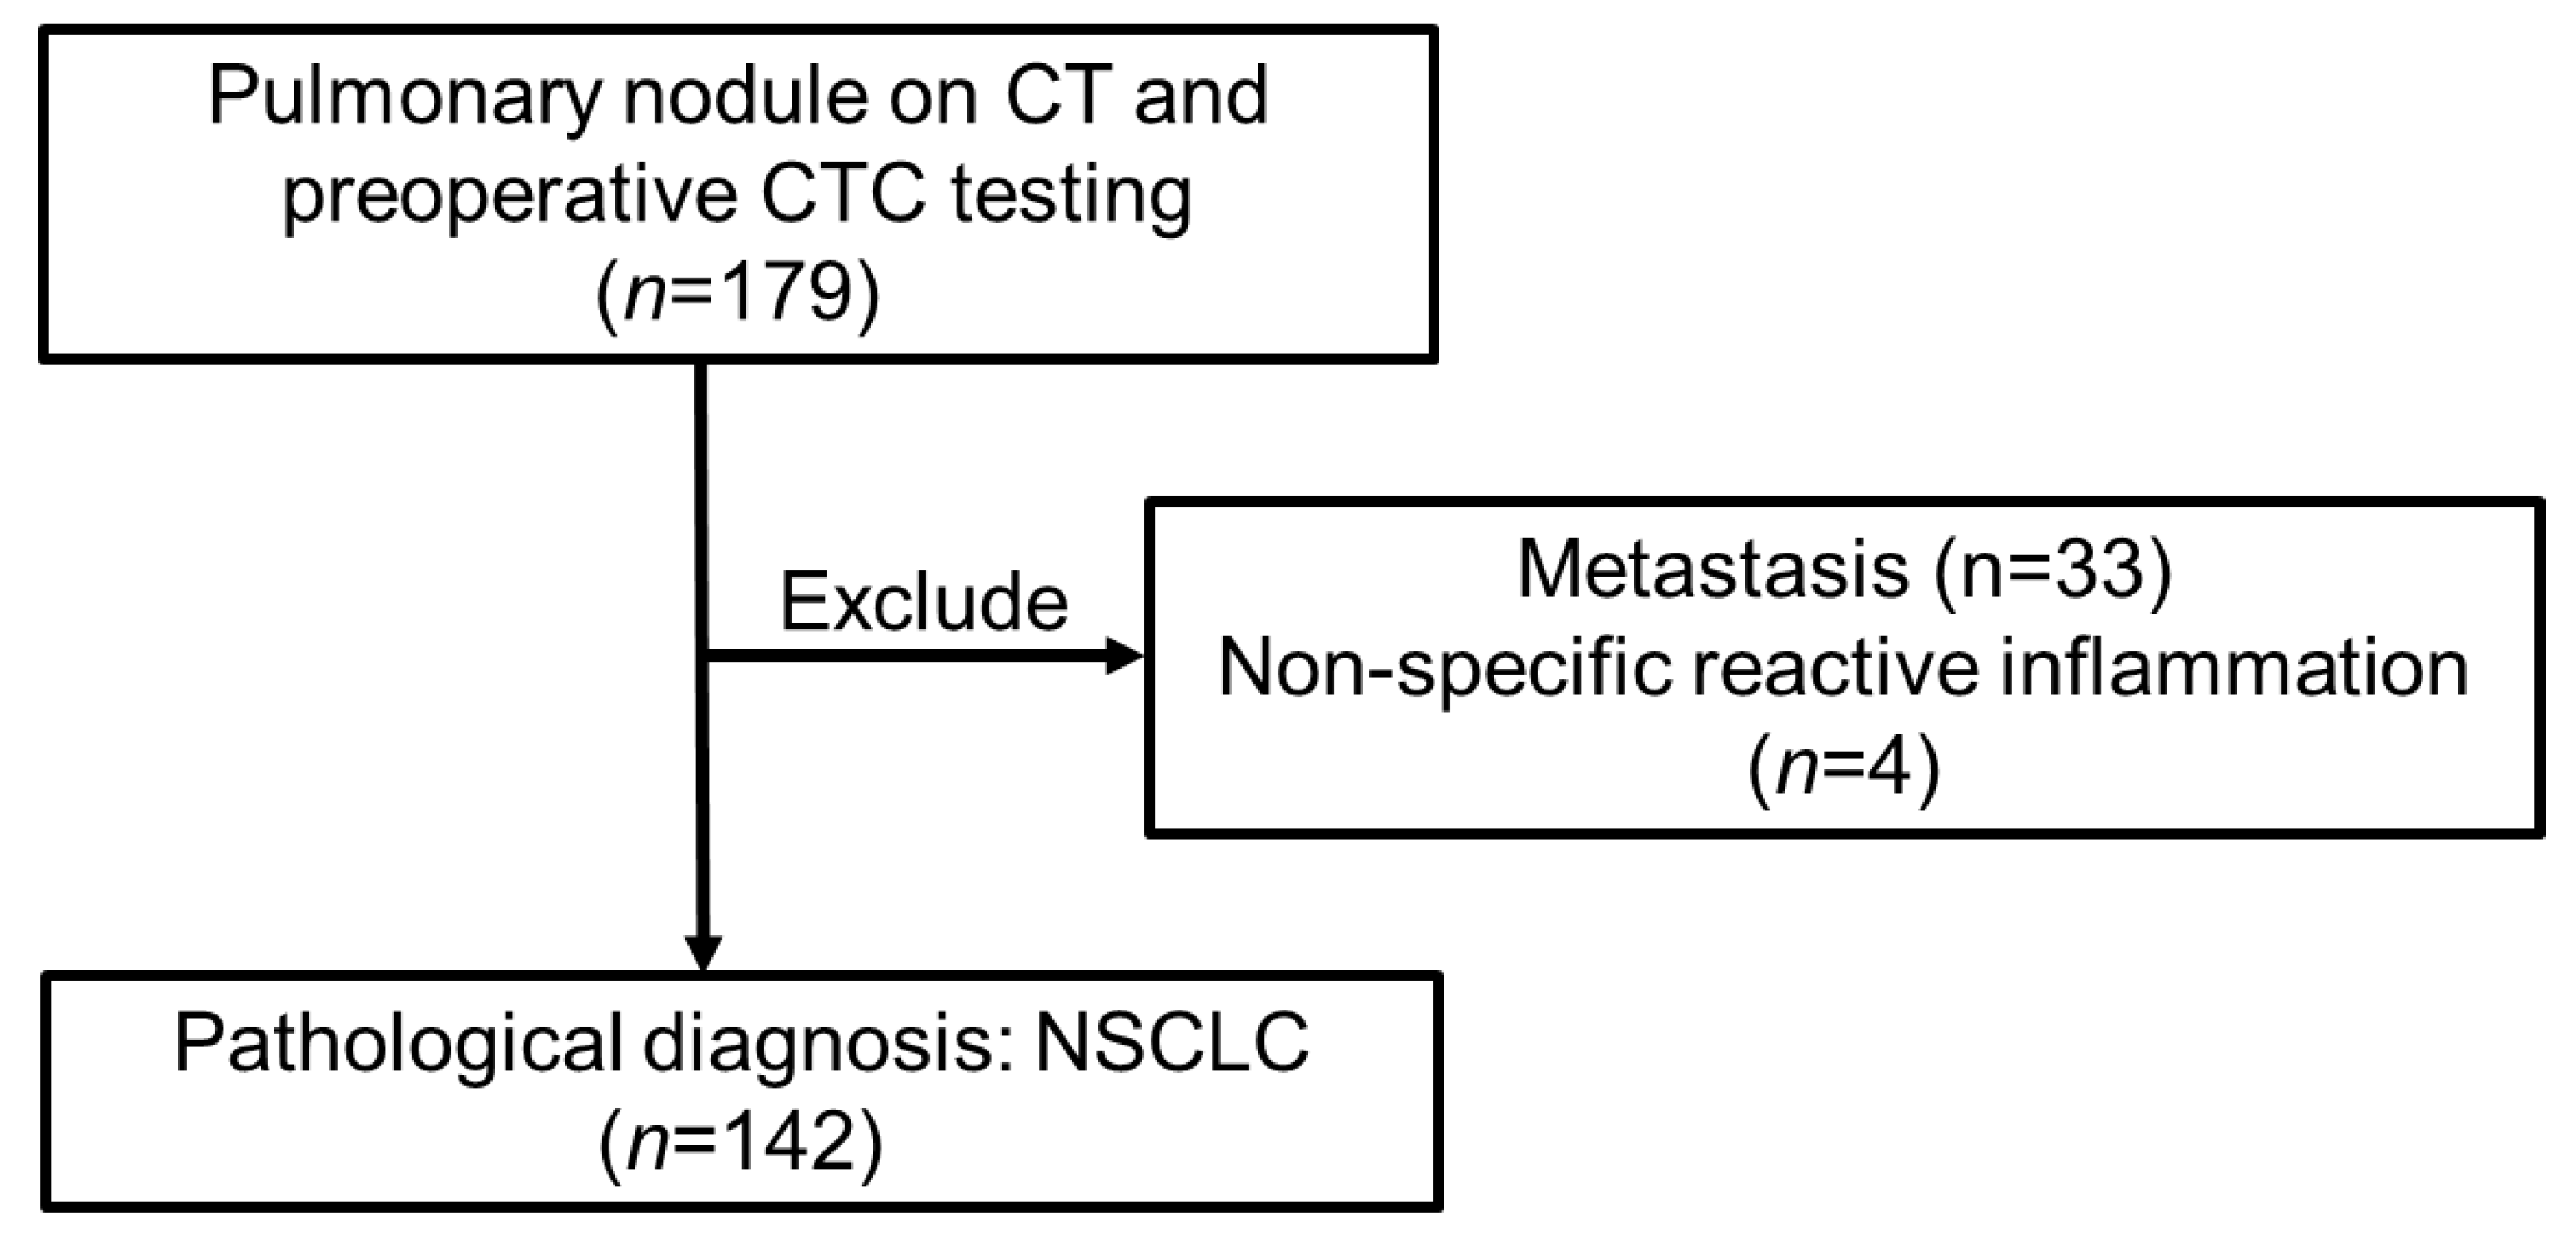
2.3. Settings and Patient Selection
2.4. Definition of Pure Solid Lesions and Non-Pure Solid Lesions on CT
2.5. Clinicopathological Parameters
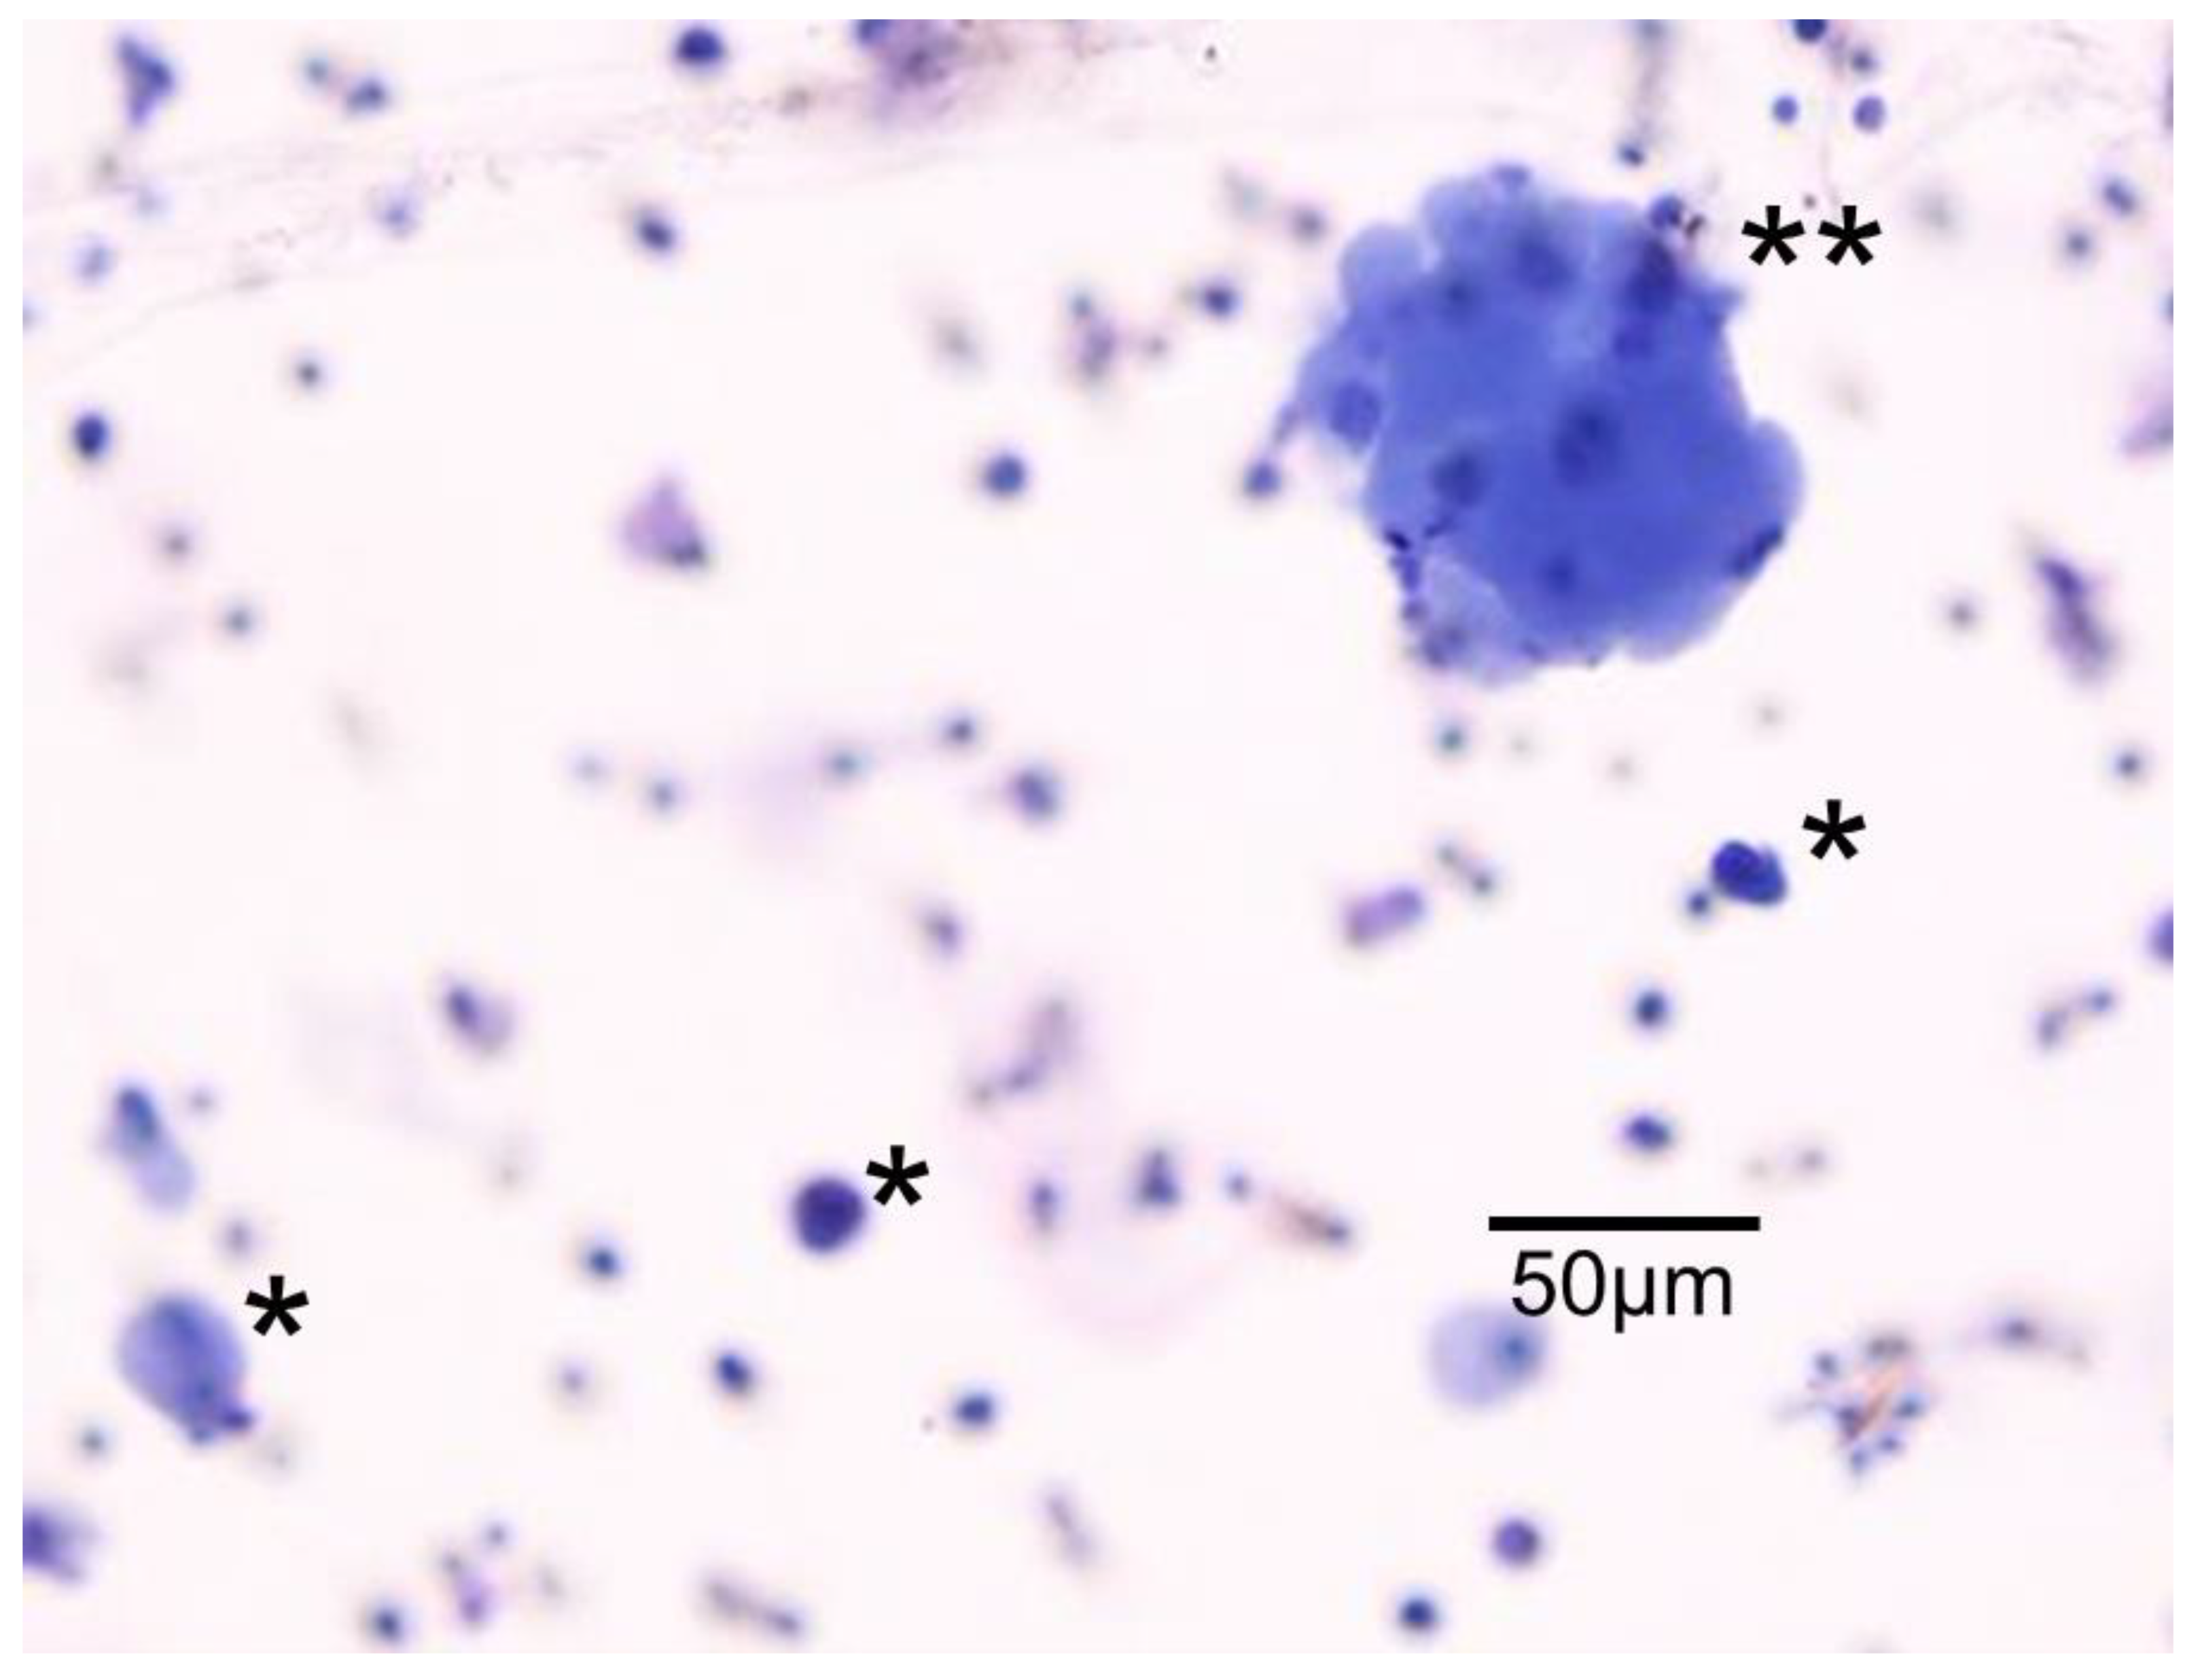
2.6. Detection of CTCs
2.7. Prognosis Evaluation
2.8. Statistical Analyses
3. Results
3.1. Characteristics of the Patients
3.2. CTC Status According to Solid Patterns on CT
3.3. Predictor of Preoperative Clustered CTCs
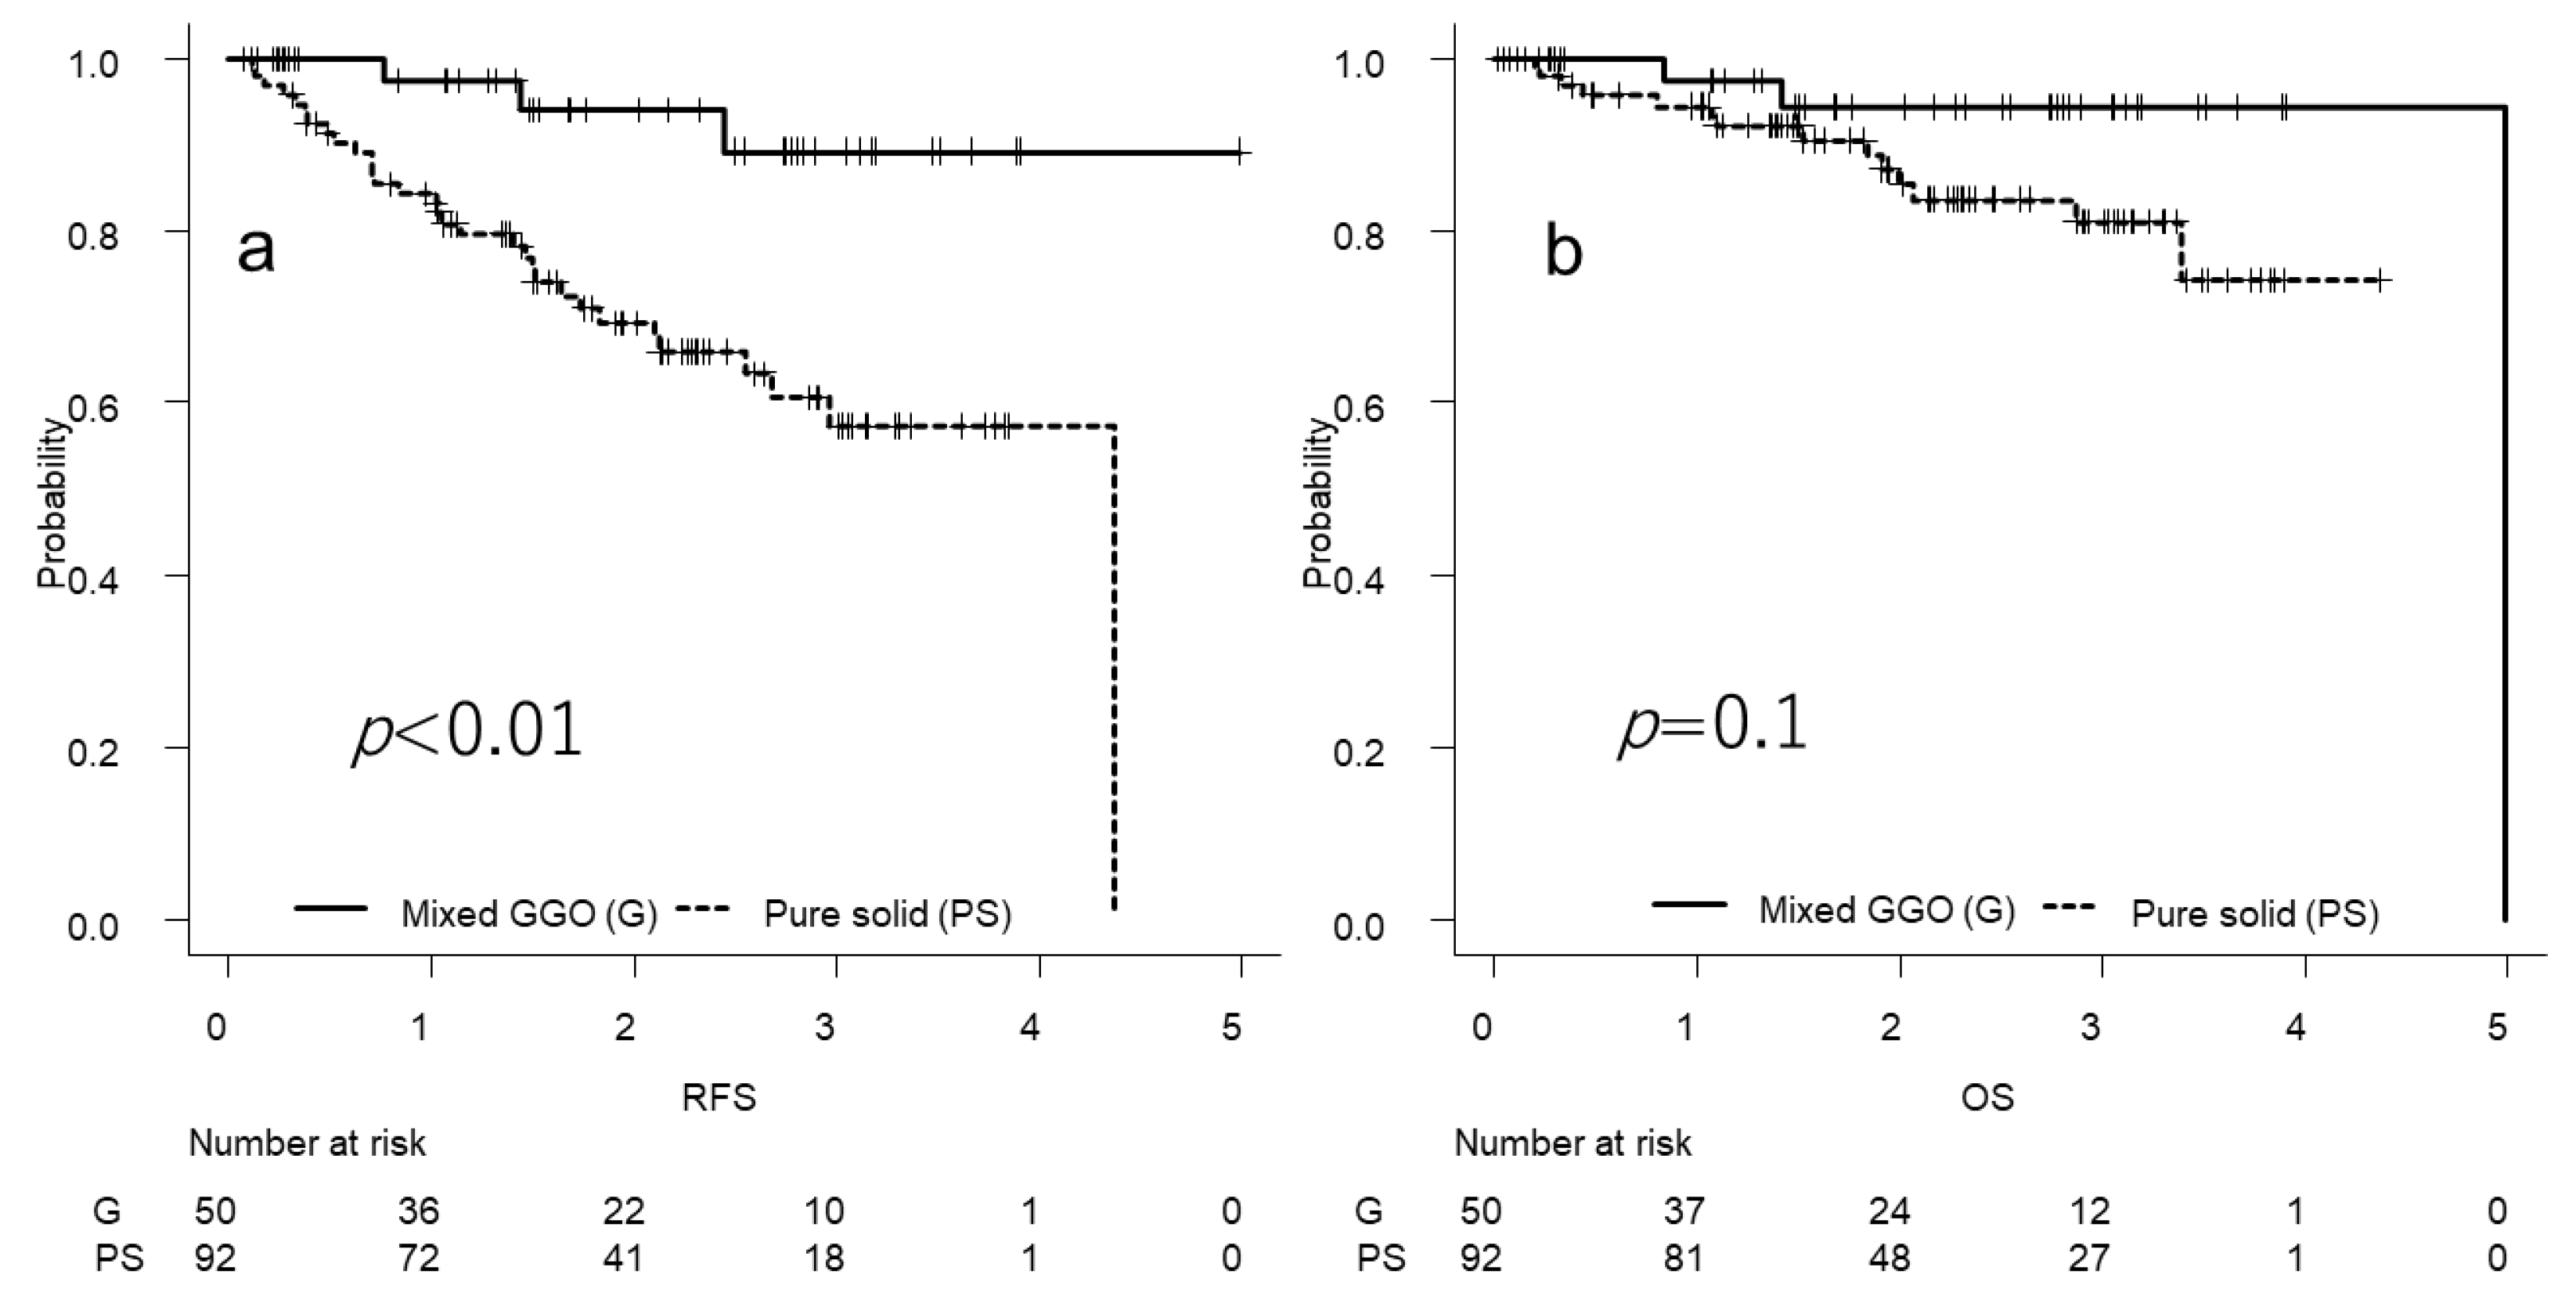
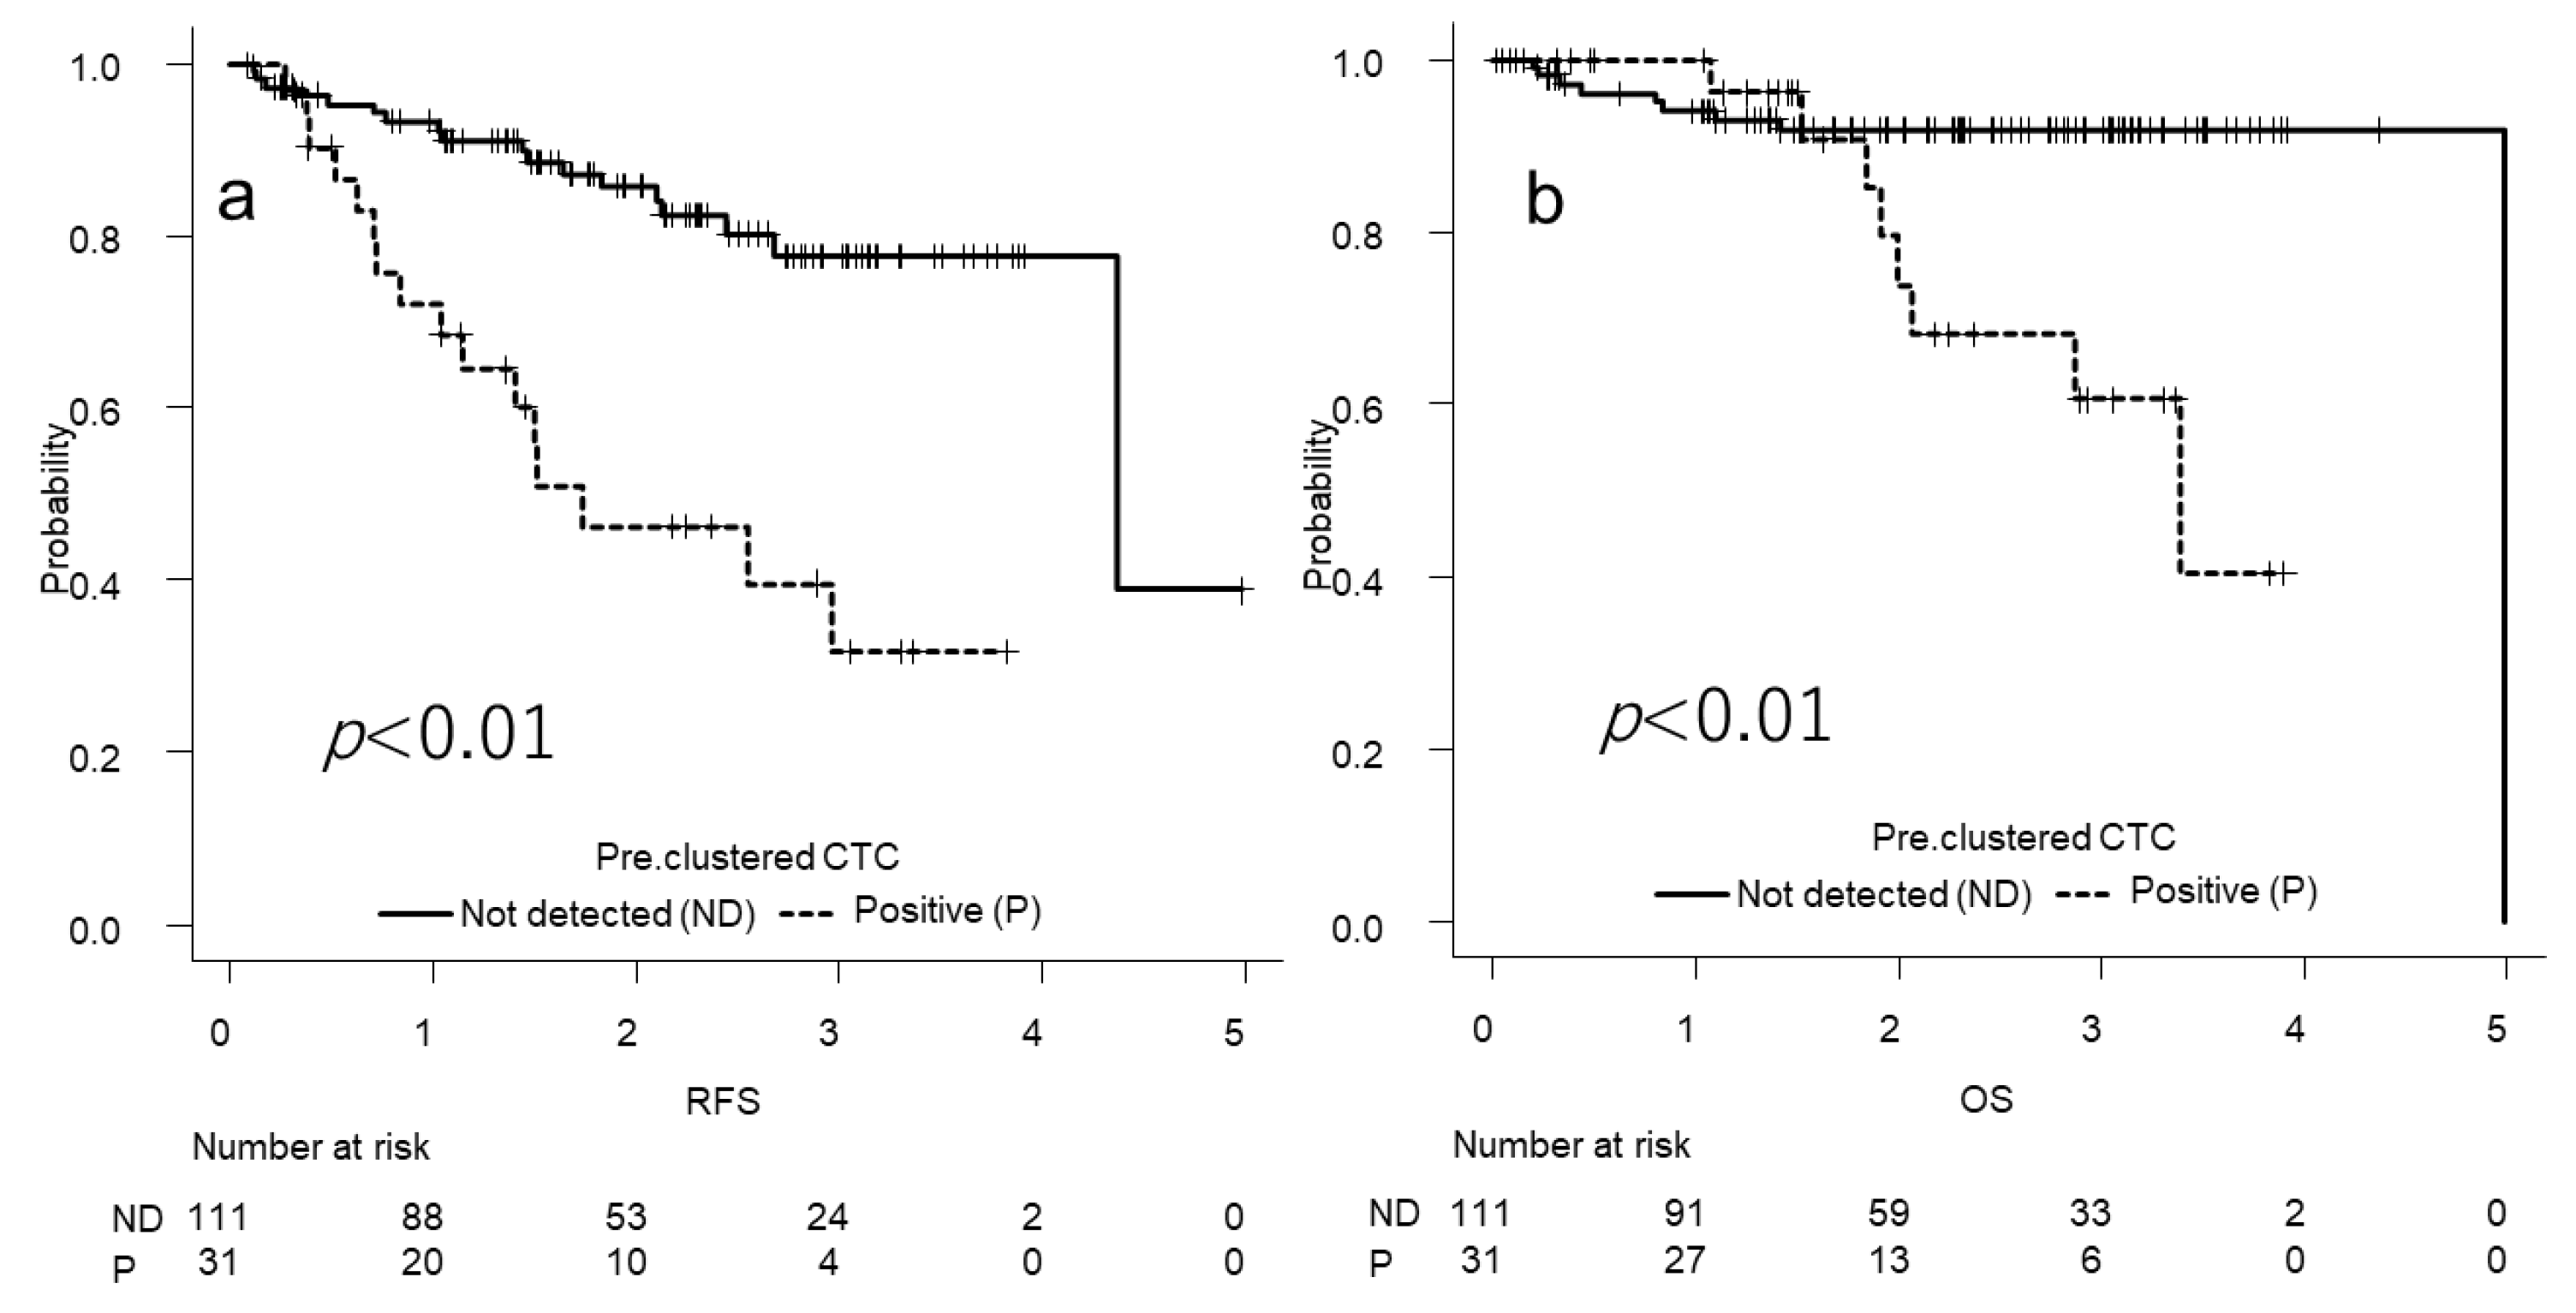
3.4. Survival Analyses
4. Discussion
5. Conclusions
Author Contributions
Funding
Institutional Review Board Statement
Informed Consent Statement
Data Availability Statement
Acknowledgments
Conflicts of Interest
References
- Bray, F.; Ferlay, J.; Soerjomataram, I.; Siegel, R.L.; Torre, L.A.; Jemal, A. Global cancer statistics 2018: GLOBOCAN estimates of incidence and mortality worldwide for 36 cancers in 185 countries. CA Cancer J. Clin. 2018, 68, 394–424. [Google Scholar] [CrossRef] [PubMed]
- Raman, V.; Jawitz, O.K.; Voigt, S.L.; Rhodin, K.E.; D’Amico, T.A.; Harpole, D.H.; Jeffrey Yang, C.F.; Tong, B.C. The effect of tumor size and histologic findings on outcomes after segmentectomy vs lobectomy for clinically node-negative non-small cell lung cancer. Chest 2021, 159, 390–400. [Google Scholar] [CrossRef] [PubMed]
- Travis, W.D.; Brambilla, E.; Noguchi, M.; Nicholson, A.G.; Geisinger, K.R.; Yatabe, Y.; Beer, D.G.; Powell, C.A.; Riely, G.J.; Van Schil, P.E.; et al. International association for the study of lung cancer/American thoracic society/European respiratory society international multidisciplinary classification of lung adenocarcinoma. J. Thorac. Oncol. 2011, 6, 244–285. [Google Scholar] [CrossRef] [PubMed]
- Fu, F.; Zhang, Y.; Wen, Z.; Zheng, D.; Gao, Z.; Han, H.; Deng, L.; Wang, S.; Liu, Q.; Li, Y.; et al. Distinct prognostic factors in patients with Stage I non-small cell lung cancer with radiologic part-solid or solid lesions. J. Thorac. Oncol. 2019, 14, 2133–2142. [Google Scholar] [CrossRef]
- Hattori, A.; Matsunaga, T.; Takamochi, K.; Oh, S.; Suzuki, K. Importance of ground glass opacity component in clinical stage IA radiologic invasive lung cancer. Ann. Thorac. Surg. 2017, 104, 313–320. [Google Scholar] [CrossRef]
- Mimae, T.; Tsutani, Y.; Miyata, Y.; Imai, K.; Ito, H.; Nakayama, H.; Ikeda, N.; Okada, M. Solid tumor size of 2 cm divides outcomes of patients with mixed ground glass opacity lung tumors. Ann. Thorac. Surg. 2020, 109, 1530–1536. [Google Scholar] [CrossRef]
- Henschke, C.I.; Yankelevitz, D.F.; Mirtcheva, R.; McGuinness, G.; McCauley, D.; Miettinen, O.S.; ELCAP Group. CT screening for lung cancer: Frequency and significance of partsolid and nonsolid nodules. AJR Am. J. Roentgenol. 2002, 178, 1053–1057. [Google Scholar] [CrossRef]
- Hansell, D.M.; Bankier, A.A.; MacMahon, H.; McLoud, T.C.; Müller, N.L.; Remy, J. Fleischner society: Glossary of terms for thoracic imaging. Radiology 2008, 246, 697–722. [Google Scholar] [CrossRef]
- Katsumata, S.; Aokage, K.; Miyoshi, T.; Tane, K.; Nakamura, H.; Sugano, M.; Kojima, M.; Fujii, S.; Kuwata, T.; Ochiai, A.; et al. Differences of tumor microenvironment between stage I lepidic-positive and lepidic-negative lung adenocarcinomas. J. Thorac. Cardiovasc. Surg. 2018, 156, 1679–1688.e2. [Google Scholar] [CrossRef]
- Thienpont, B.; Steinbacher, J.; Zhao, H.; D’Anna, F.; Kuchnio, A.; Ploumakis, A.; Ghesquière, B.; Van Dyck, L.; Boeckx, B.; Schoonjans, L.; et al. Tumour hypoxia causes DNA hypermethylation by reducing TET activity. Nature 2016, 537, 63–68. [Google Scholar] [CrossRef] [Green Version]
- Nieto, M.A.; Huang, R.Y.; Jackson, R.A.; Thiery, J.P. EMT: 2016. Cell 2016, 166, 21–45. [Google Scholar] [CrossRef] [PubMed]
- Bocci, F.; Kumar Jolly, M.; Onuchic, J.N. A biophysical model uncovers the size distribution of migrating cell clusters across cancer types. Cancer Res. 2019, 79, 5527–5535. [Google Scholar] [CrossRef]
- Gkountela, S.; Castro-Giner, F.; Szczerba, B.M.; Vetter, M.; Landin, J.; Scherrer, R.; Krol, I.; Scheidmann, M.C.; Beisel, C.; Stirnimann, C.U.; et al. Circulating tumor cell clustering shapes DNA methylation to enable metastasis seeding. Cell 2019, 176, 98–112.e14. [Google Scholar] [CrossRef] [PubMed]
- Sawabata, N.; Susaki, Y.; Nakamura, T.; Kawaguchi, T.; Yasukawa, M.; Taniguchi, S. Cluster circulating tumor cells in surgical cases of lung cancer. Gen. Thorac. Cardiovasc. Surg. 2020, 68, 975–983. [Google Scholar] [CrossRef] [PubMed]
- Murlidhar, V.; Reddy, R.M.; Fouladdel, S.; Zhao, L.; Ishikawa, M.K.; Grabauskiene, S.; Zhang, Z.; Lin, J.; Chang, A.C.; Carrott, P.; et al. Poor prognosis indicated by venous circulating tumor cell clusters in early-stage lung cancers. Cancer Res. 2017, 77, 5194–5206. [Google Scholar] [CrossRef]
- Japanese Society of Nuclear Medicine. [Guidelines]. 2021. Available online: http://jsnm.org/english/e_guidelines/ (accessed on 15 December 2021).
- Drucker, A.; Teh, E.M.; Kostyleva, R.; Rayson, D.; Douglas, S.; Pinto, D.M. Comparative performance of different methods for circulating tumor cell enrichment in metastatic breast cancer patients. PLoS ONE 2020, 15, e0237308. [Google Scholar] [CrossRef]
- Wechsler, J. Circulating tumor cells. In Circulating Tumor Cells from Solid Cancers, 1st ed.; Wechsler, J., Ed.; Sauramps Medical: Paris, France, 2015; pp. 44–50. [Google Scholar]
- Kanda, Y. Investigation of the freely available easy-to-use software ‘EZR’ for medical statistics. Bone Marrow Transpl. 2013, 48, 452–458. [Google Scholar] [CrossRef]
- Aceto, N.; Bardia, A.; Miyamoto, D.T.; Donaldson, M.C.; Wittner, B.S.; Spencer, J.A.; Yu, M.; Pely, A.; Engstrom, A.; Zhu, H.; et al. Circulating tumor cell clusters are oligoclonal precursors of breast cancer metastasis. Cell 2014, 158, 1110–1122. [Google Scholar] [CrossRef]
- Bottos, A.; Hynes, N.E. Cancer: Staying together on the road to metastasis. Nature 2014, 514, 309–310. [Google Scholar] [CrossRef]
- Sawabata, N.; Funaki, S.; Hyakutake, T.; Shintani, Y.; Fujiwara, A.; Okumura, M. Perioperative circulating tumor cells in surgical patients with non-small cell lung cancer: Does surgical manipulation dislodge cancer cells thus allowing them to pass into the peripheral blood? Surg. Today 2016, 46, 1402–1409. [Google Scholar] [CrossRef]
- Cabibi, D.; Bellavia, S.; Giannone, A.G.; Barraco, N.; Cipolla, C.; Martorana, A.; Rodolico, V.; Cajozzo, M.; Florena, A.M. TTF-1/p63-positive poorly differentiated NSCLC: A histogenetic hypothesis from the basal reserve cell of the terminal respiratory unit. Diagnostics 2020, 10, 25. [Google Scholar] [CrossRef] [PubMed]
- Chen, Z.; Fillmore, C.M.; Hammerman, P.S.; Kim, C.F.; Wong, K.K. Non-small-cell lung cancers: A heterogeneous set of diseases. Nat. Rev. Cancer 2014, 14, 535–546. [Google Scholar] [CrossRef] [PubMed]
- Herath, S.; Razavi Bazaz, S.; Monkman, J.; Ebrahimi Warkiani, M.; Richard, D.; O’Byrne, K.; Kulasinghe, A. Circulating tumor cell clusters: Insights into tumour dissemination and metastasis. Expert Rev. Mol. Diagn. 2020, 20, 1139–1147. [Google Scholar] [CrossRef] [PubMed]
- Ichikawa, T.; Aokage, K.; Miyoshi, T.; Tane, K.; Suzuki, K.; Makinoshima, H.; Tsuboi, M.; Ishii, G. Correlation between maximum standardized uptake values on FDG-PET and microenvironmental factors in patients with clinical stage IA radiologic pure-solid lung adenocarcinoma. Lung Cancer 2019, 136, 57–64. [Google Scholar] [CrossRef]
- Hattori, A.; Matsunaga, T.; Fukui, M.; Takamochi, K.; Suzuki, K. Prognostic influence of a ground-glass opacity component in hypermetabolic lung adenocarcinoma. Eur. J. Cardiothorac. Surg. 2022, 61, 249–256. [Google Scholar] [CrossRef]


| Variables | CT Findings | ||||
|---|---|---|---|---|---|
| Total | Pure Solid | Mixed GGO | p-Value | ||
| N | 142 | 92 (64.8%) | 50 (35.2%) | ||
| Demographics | |||||
| Sex (Female) | 60 (42.3%) | 37 (40.2%) | 23 (46.0%) | 0.6 | |
| Age, years | 69.4 ± 8.8 | 68.8 ± 8.8 | 70.4 ± 8.8 | 0.3 | |
| CT | |||||
| Whole size, cm | 2.5 ± 1.5 | 2.7 ± 1.7 | 2.1 ± 0.9 | 0.02 | |
| Solid size, cm | 2.3 ± 1.7 | 2.7 ± 1.7 | 1.2 ± 1.1 | <0.01 | |
| Solid ratio, cm | 0.8 ± 0.3 | 1.0 ± 0.0 | 0.5 ± 0.4 | <0.01 | |
| Clinical parameters | |||||
| CEA (µg/mL) | 7.4 ± 12.9 | 8.6 ± 14.1 | 5.0 ± 10.0 | 0.1 | |
| CEA > 7.5 (µg/mL) | 32 (22.5%) | 28 (30.4%) | 4 (7.7%) | <0.01 | |
| CYFRA (ng/mL) | 2.4 ± 2.7 | 2.7 ± 3.2 | 1.9 ± 1.0 | 0.1 | |
| CYFRA > 3.3 (ng/mL) | 19 (13.3%) | 16 (17.4%) | 3 (6.0%) | 0.1 | |
| SUVmax | 5.5 ± 5.9 | 7.4 ± 6.4 | 2.1 ± 2.2 | <0.01 | |
| SUVmax > 2.9 | 84 (59.2) | 70 (76.1%) | 14 (28.0%) | <0.01 | |
| Stage | |||||
| Clinical | I | 118 (87.4%) | 75 (81.5%) | 50 (100%) | <0.01 |
| II | 17 (13.3%) | 17 (18.5%) | 0 (0.0%) | ||
| Pathological | I | 109 (76.8%) | 61 (66.3%) | 48 (96.0%) | <0.01 |
| II | 20 (14.1%) | 18 (19.6%) | 2 (4.0%) | ||
| III | 7 (4.9%) | 7 (7.6%) | 0 (0.0%) | ||
| IV | 6 (4.2%) | 6 (6.5%) | 0 (0.0%) | ||
| Operation | |||||
| Wedge | 41 (28.9%) | 19 (20.7%) | 22 (44.0%) | <0.01 | |
| Segmentectomy | 13 (9.2%) | 7 (7.6%) | 6(12.0%) | ||
| Lobectomy | 86 (60.6%) | 64 (69.6%) | 22 (44.0%) | ||
| Pneumonectomy | 2 (1.4%) | 2 (2.2%) | 0 (0.0%) | ||
| Histology | |||||
| Whole tumor size (cm) | 2.4 ± 1.5 | 2.1 ± 0.9 | 2.7 ± 1.8 | 0.03 | |
| Invasion size (cm) | 2.1 ± 1.6 | 1.1 ± 1.0 | 2.7 ± 1.6 | <0.01 | |
| Invasion size ≥ 2 cm | 60 (42.3%) | 5 (12.8%) | 63 (37.5%) | <0.01 | |
| Non- or nini-invasive AD | 17 (12.0%) | 0 (18.5%) | 17 (0.0%) | <0.01 | |
| Invasive AD | 81 (57.0%) | 49 (64.1%) | 32 (76.0%) | ||
| SQ | 26 (19.2%) | 26 (0.0%) | 0 (52.0%) | ||
| ADSQ | 1 (0.1%) | 1 (0.0%) | 1 (2.0%) | ||
| Others | 17 (12.0%) | 17 (0.0%) | 0 (34.0%) | ||
| Dominant legion of inv-AD | |||||
| Lepidic | 32 (32.7%) | 0 (0.0%) | 32 (65.3%) | <0.01 | |
| Acinar | 39 (39.8%) | 32 (65.3%) | 7 (14.3%) | ||
| Papillary | 23 (24.0%) | 14 (28.5%) | 9 (18.4%) | ||
| Solid | 4 (4.1%) | 3 (6.1%) | 1 (2.0%) | ||
| V (+) | 65 (45.8%) | 56 (60.9%) | 9 (18.0%) | <0.01 | |
| Ly (+) | 78 (54.9%) | 64 (69.6%) | 14 (28.0%) | <0.01 | |
| Pl (+) | 45 (32.6%) | 37 (40.2%) | 8 (16.0%) | <0.01 | |
| STAS | 37 (26.1%) | 33 (35.9%) | 4 (8.0%) | <0.01 | |
| Adjuvant treatment | 30 (21.1%) | 26 (28.2%) | 4 (8.9%) | <0.01 | |
| CTC Morphology | Total | Solid | Mixed GGO | p-Value | |
|---|---|---|---|---|---|
| N | 142 (100%) | 92 (64.8%) | 50 (35.2%) | ||
| CTC count | |||||
| All | 1.7 ± 3.7 | 2.2 ± 3.9 | 0.8 ± 3.0 | 0.02 | |
| Cluster | 0.6 ± 2.0 | 1.0 ± 2.5 | 0.0 ± 0.1 | <0.01 | |
| CTC morphology | |||||
| Cluster | 31 (21.8%) | 30 (32.6%) | 1 (2.0%) | <0.01 | |
| Single | 14 (9.9%) | 8 (8.7%) | 6 (12.0%) | ||
| Not detected | 97 (68.3%) | 54 (58.7%) | 43 (86.0%) |
| Variables | Univariate | Multivariate | ||||
|---|---|---|---|---|---|---|
| OR | 95% CI | p-Value | OR | 95% CI | p-Value | |
| Pure solid | 23.70 | 3.12–180.00 | <0.01 | 10.30 | 1.21–87.40 | <0.05 |
| Invasive size > 2.0 cm | 3.23 | 1.41–7.41 | <0.01 | 1.30 | 0.45–3.80 | 0.6 |
| V (+) | 4.72 | 1.94–11.50 | <0.01 | 1.65 | 0.48–5.73 | 0.4 |
| STAS | 3.79 | 1.63–3.83 | <0.01 | 1.06 | 0.29–3.88 | 0.9 |
| CEA > 7.5 μg/mL | 7.77 | 3.18–19.00 | <0.01 | 4.33 | 1.61–11.70 | <0.01 |
| CYFRA > 3.3 ng/ml | 2.21 | 0.78–6.23 | 0.1 | |||
| SUVmax > 2.9 | 9.17 | 2.63–31.90 | <0.01 | 2.34 | 0.54–11.30 | 0.3 |
| Sublobar resection | 1.56 | 0.64–3.81 | 0.3 | |||
| P-stage III, IV | 1.08 | 0.28–4.20 | 0.9 |
| Variables | Univariate | Multivariate | ||||
|---|---|---|---|---|---|---|
| HR | 95% CI | p-Value | HR | 95% CI | p-Value | |
| RFS | ||||||
| Sex (Female) | 1.27 | 0.68–2.44 | 0.5 | |||
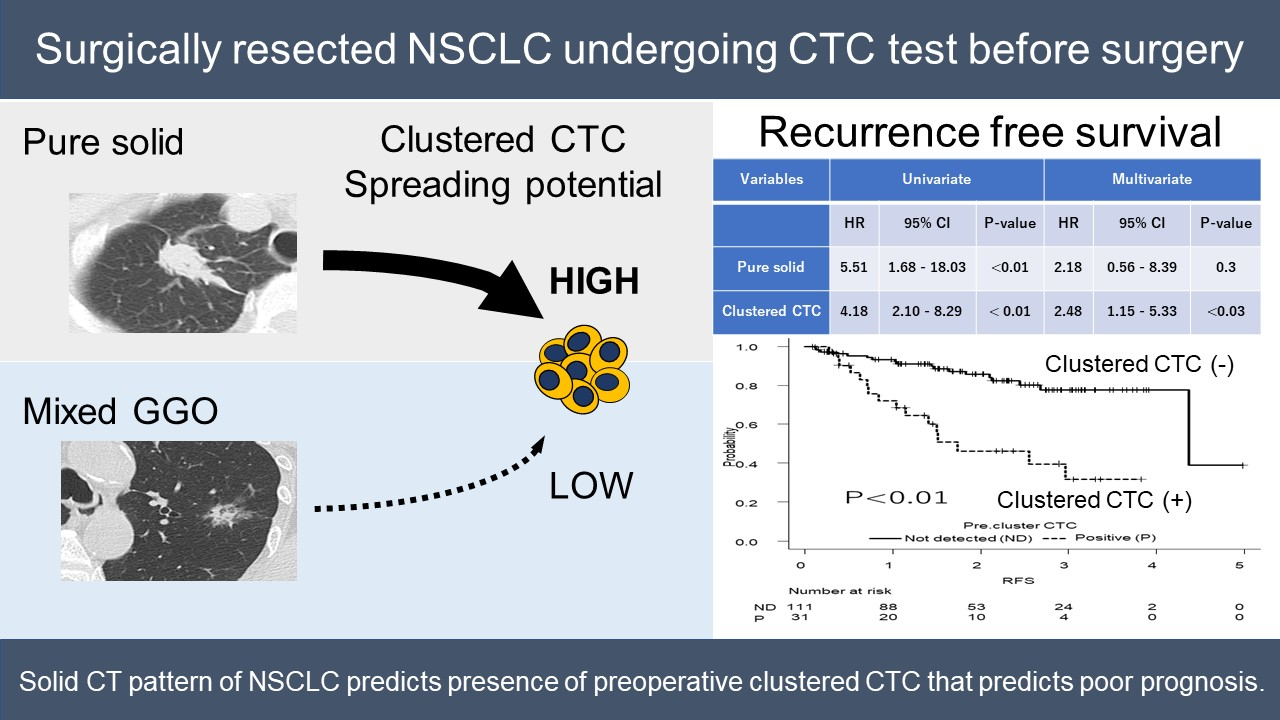
| Pure solid | 5.51 | 1.68–18.03 | <0.01 | 2.18 | 0.56–8.39 | 0.3 |
| Clustered CTC | 4.18 | 2.10–8.29 | <0.01 | 2.48 | 1.15–5.33 | <0.03 |
| Invasive size > 2.0 cm | 2.39 | 1.18–4.84 | <0.02 | 1.26 | 0.58–2.74 | 0.6 |
| V (+) | 3.03 | 1.14–6.50 | <0.01 | 1.30 | 0.50–2.44 | 0.6 |
| STAS | 1.79 | 0.90–3.56 | 0.1 | |||
| CEA > 7.5 μg/mL | 2.20 | 1.10–4.42 | <0.03 | 1.11 | 0.50–2.44 | 0.9 |
| CYFRA > 3.3 ng/ml | 1.67 | 0.68–4.04 | 0.3 | |||
| SUVmax > 2.9 | 3.23 | 1.33–7.80 | <0.01 | 1.49 | 0.53–4.15 | 0.5 |
| Sublober resection | 1.36 | 0.61–3.02 | 0.4 | |||
| P-stage III, IV | 4.56 | 2.11–9.86 | <0.01 | 3.21 | 1.42–7.26 | <0.01 |
| Adjuvant treatment | 0.83 | 0.40–1.99 | 0.8 | |||
| OS | ||||||
| Sex (Female) | 0.40 | 0.13–1.25 | 0.1 | |||
| Pure solid | 3.29 | 0.75–14.47 | 0.1 | |||
| Clustered CTC | 3.76 | 1.41–10.06 | <0.01 | 2.66 | 0.82–8.63 | 0.1 |
| Invasive size > 2.0 cm | 1.63 | 0.60–4.39 | 0.3 | |||
| V (+) | 1.63 | 0.60–5.94 | 0.3 | |||
| STAS | 1.55 | 0.56–4.26 | 0.4 | |||
| CEA > 7.5 μg/mL | 2.97 | 1.11–8.06 | <0.03 | 2.82 | 0.86–9.23 | 0.1 |
| CYFRA > 3.3 ng/ml | 5.43 | 1.91–15.42 | <0.01 | 6.14 | 2.00–18.80 | <0.01 |
| SUVmax > 2.9 | 1.84 | 0.59–5.71 | 0.3 | |||
| Sublober resection | 0.33 | 0.12–0.90 | <0.03 | 0.21 | 0.07–0.63 | <0.01 |
| P-stage III, IV | 2.87 | 0.92–8.90 | 0.07 | |||
| Adjuvant treatment | 0.40 | 0.09–1.75 | 0.2 |
Publisher’s Note: MDPI stays neutral with regard to jurisdictional claims in published maps and institutional affiliations. |
© 2022 by the authors. Licensee MDPI, Basel, Switzerland. This article is an open access article distributed under the terms and conditions of the Creative Commons Attribution (CC BY) license (https://creativecommons.org/licenses/by/4.0/).
Share and Cite
Sawabata, N.; Kawaguchi, T.; Watanabe, T.; Yohikawa, D.; Ouji-Sageshima, N.; Ito, T. Pure Solid Pattern of Non-Small Cell Lung Cancer and Clustered Circulating Tumor Cells. Cancers 2022, 14, 4514. https://0-doi-org.brum.beds.ac.uk/10.3390/cancers14184514
Sawabata N, Kawaguchi T, Watanabe T, Yohikawa D, Ouji-Sageshima N, Ito T. Pure Solid Pattern of Non-Small Cell Lung Cancer and Clustered Circulating Tumor Cells. Cancers. 2022; 14(18):4514. https://0-doi-org.brum.beds.ac.uk/10.3390/cancers14184514
Chicago/Turabian StyleSawabata, Noriyoshi, Takeshi Kawaguchi, Takashi Watanabe, Daiki Yohikawa, Noriko Ouji-Sageshima, and Toshihiro Ito. 2022. "Pure Solid Pattern of Non-Small Cell Lung Cancer and Clustered Circulating Tumor Cells" Cancers 14, no. 18: 4514. https://0-doi-org.brum.beds.ac.uk/10.3390/cancers14184514