
Reproducibility of Gene Expression Signatures in Diffuse Large B-Cell Lymphoma

 ,
,  , , , , , and
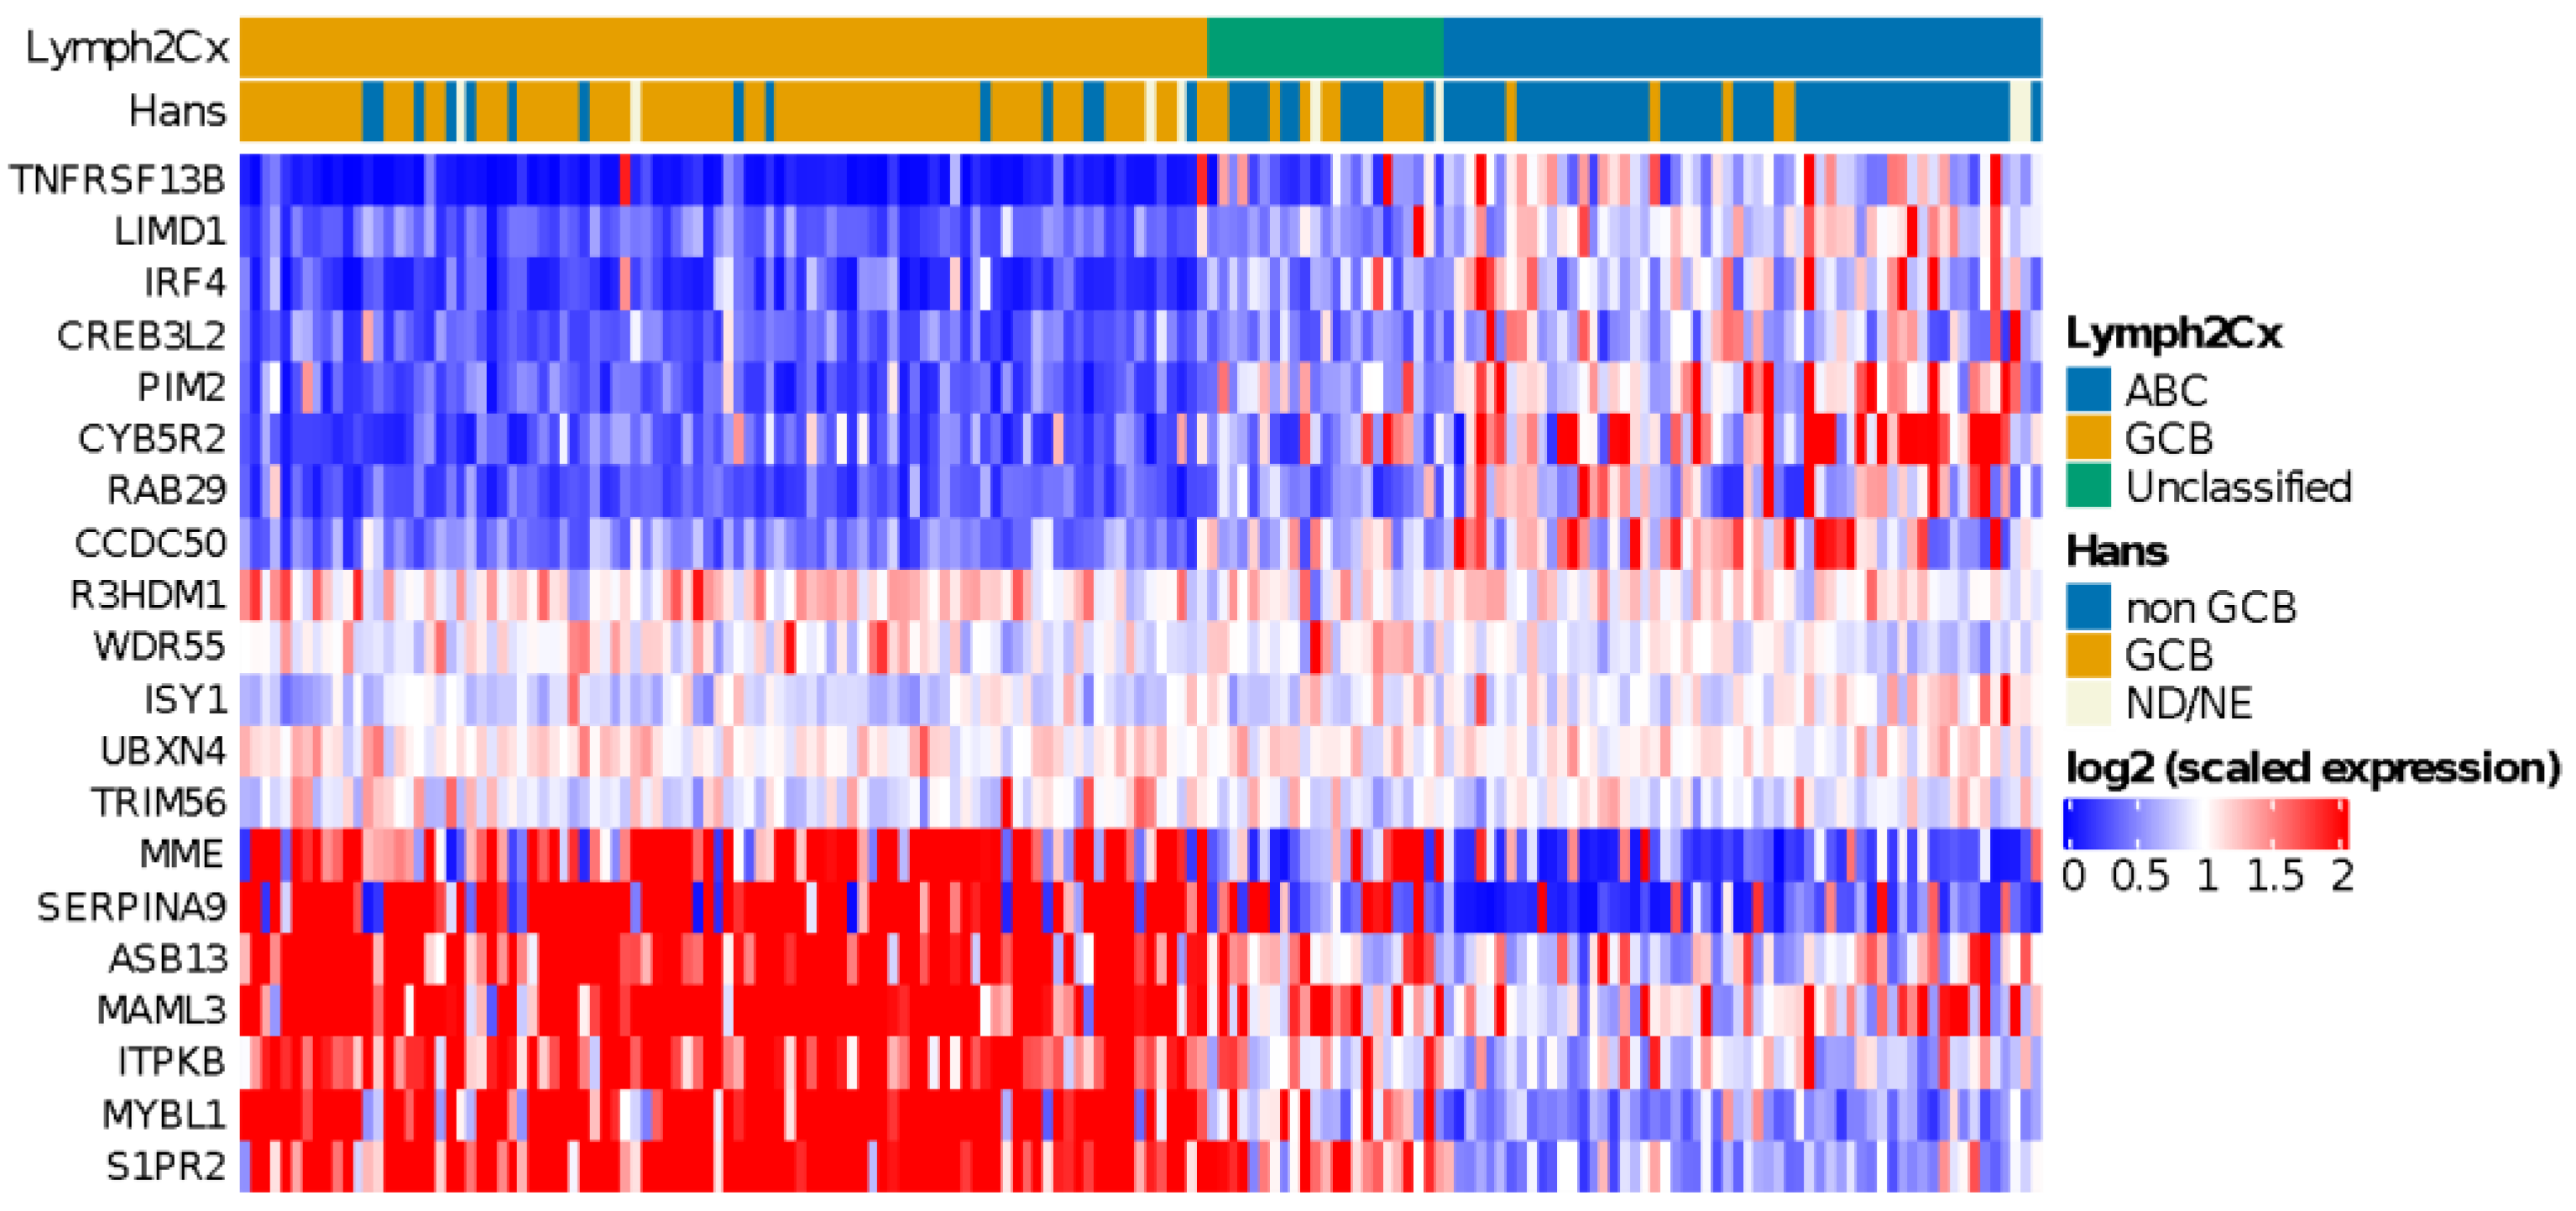
Abstract
:Simple Summary
Abstract
1. Introduction
2. Materials and Methods
2.1. Patient Cohort
2.2. Immunohistochemistry
2.3. Detection of Chromosomal Translocations in BCL2, BCL6, and MYC
2.4. Gene Expression Profiling
2.5. COO Classifier
2.6. MYC Activity Score
2.7. Monti Consensus Clustering
2.8. Immune Ratio
2.9. Statistical Analysis
3. Results
3.1. Study Design
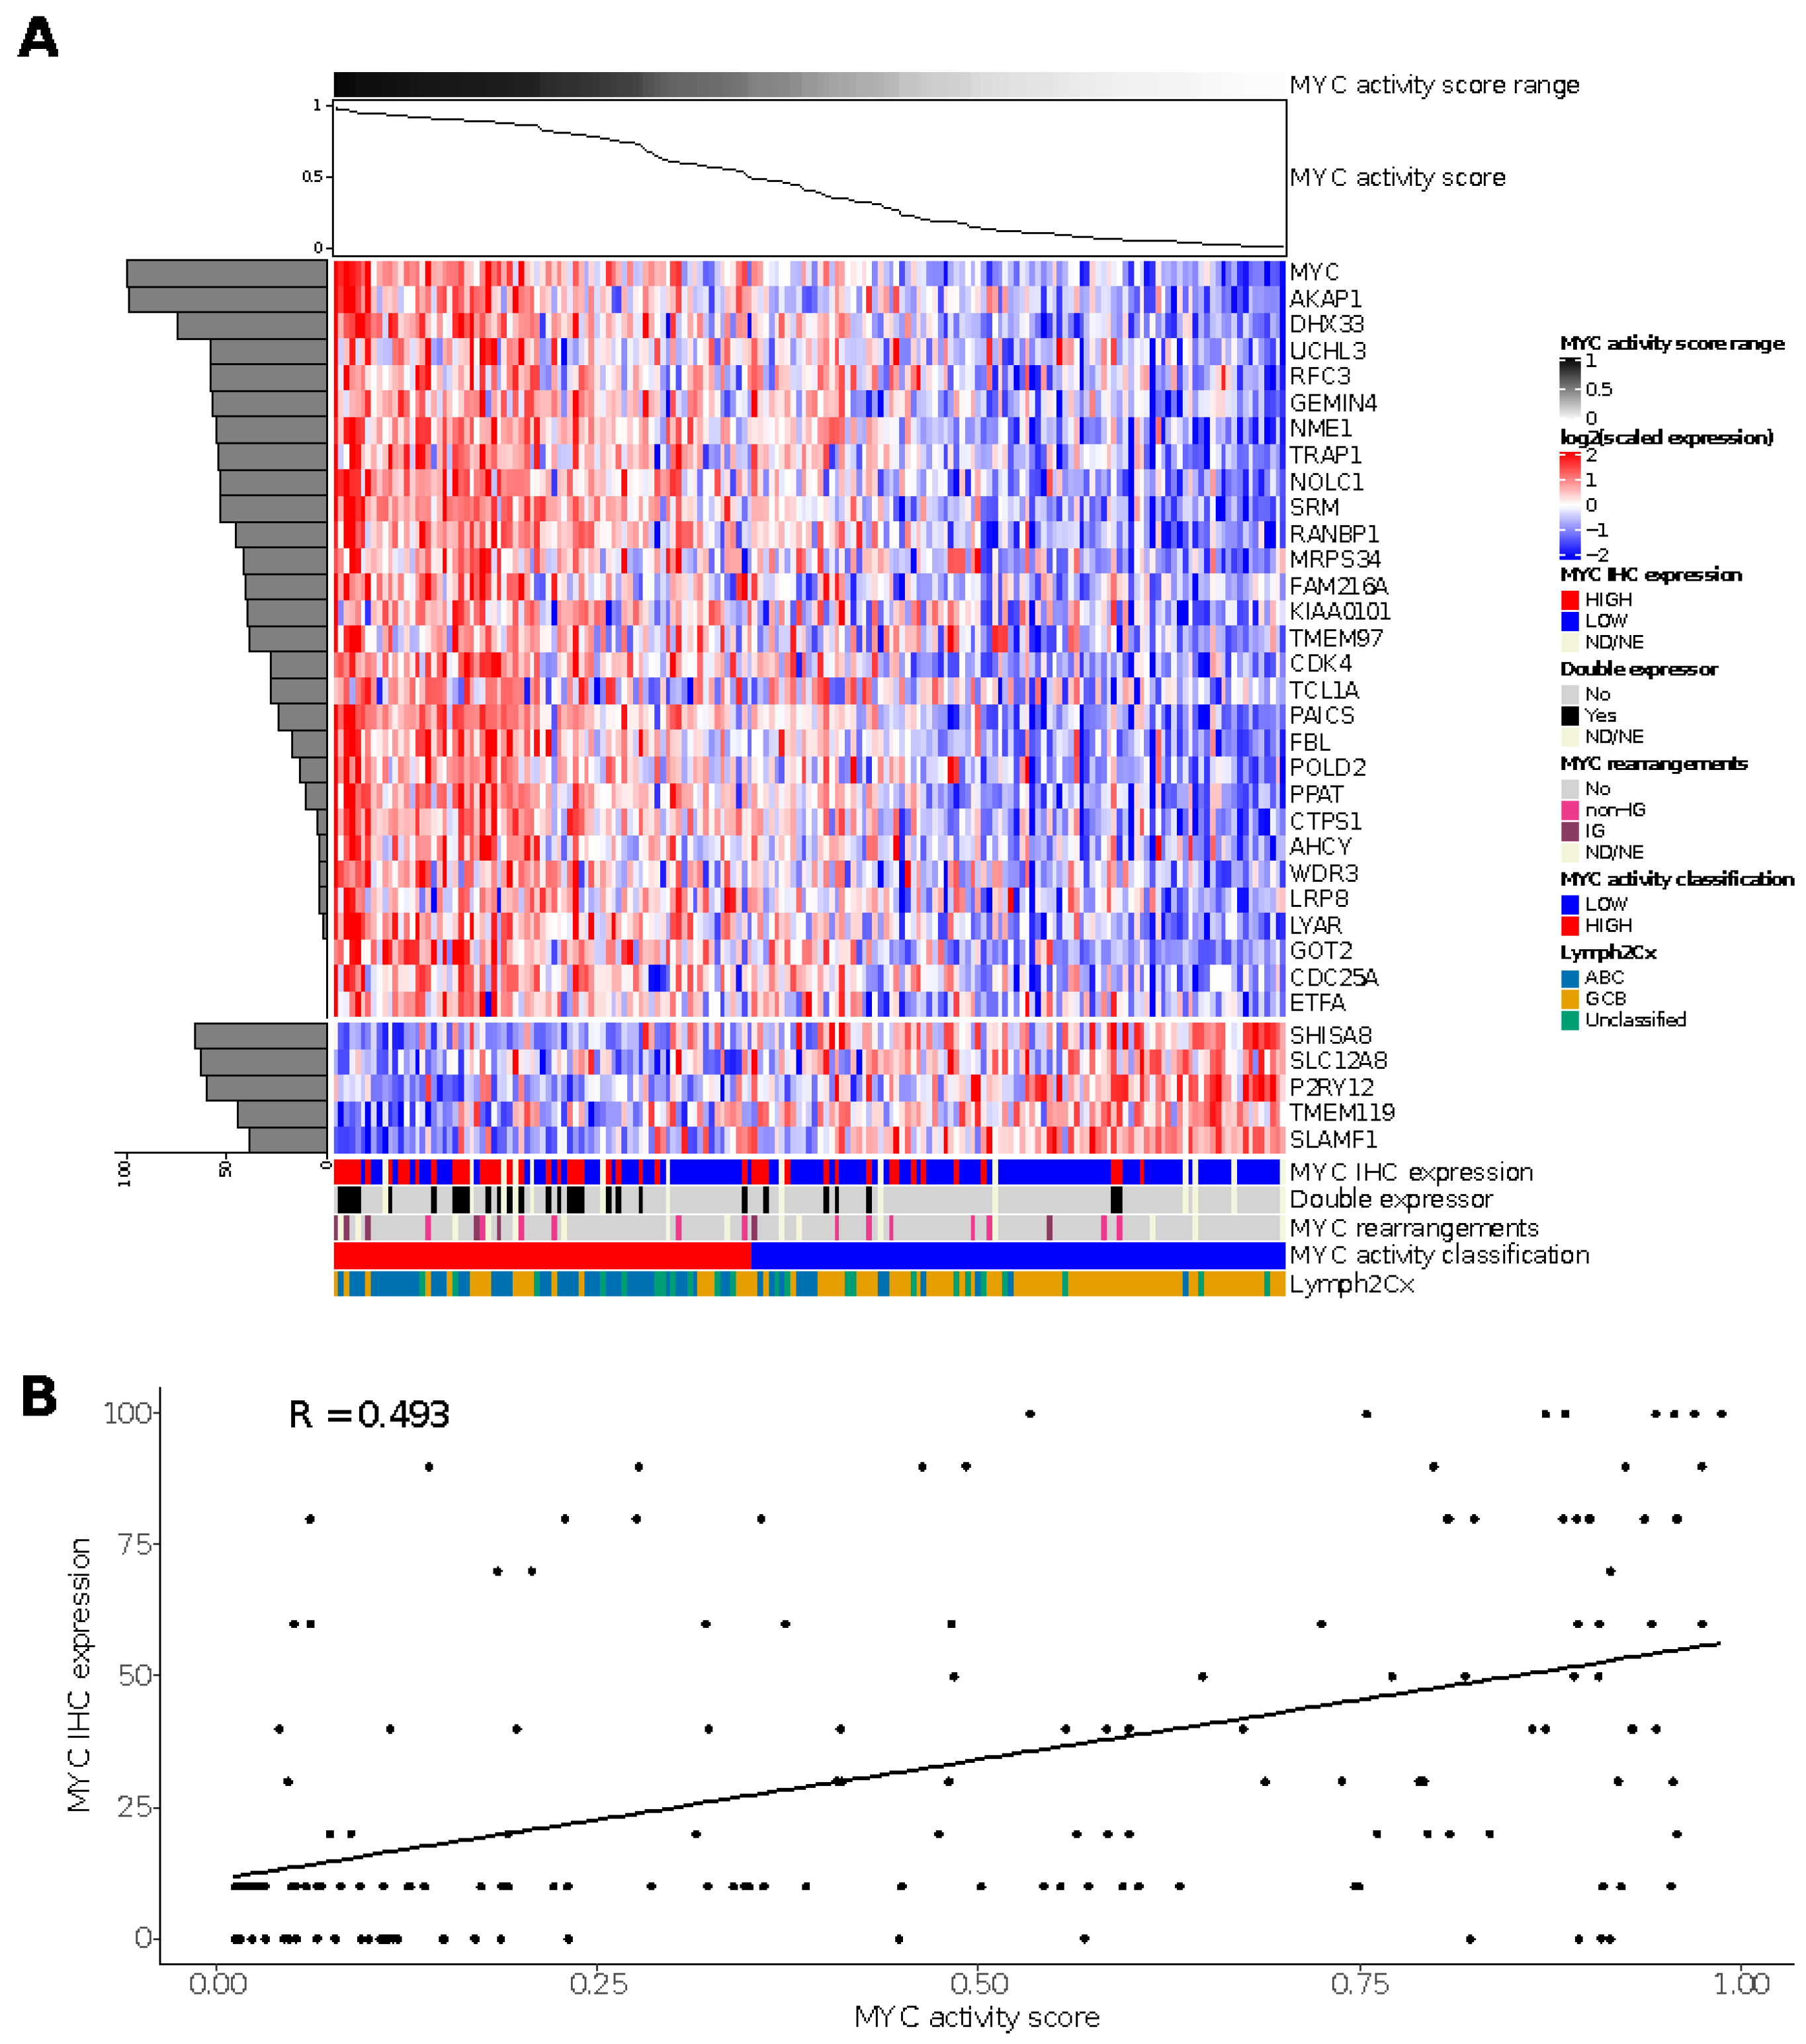
3.2. Performance of the MYC Activity Score Using a Subset of the Genes
3.3. Performance of the Monti Consensus Clustering Algorithm Using a Subset of the Genes
3.4. COO Classifier in HOVON-84
3.5. MYC Activity Score in HOVON-84
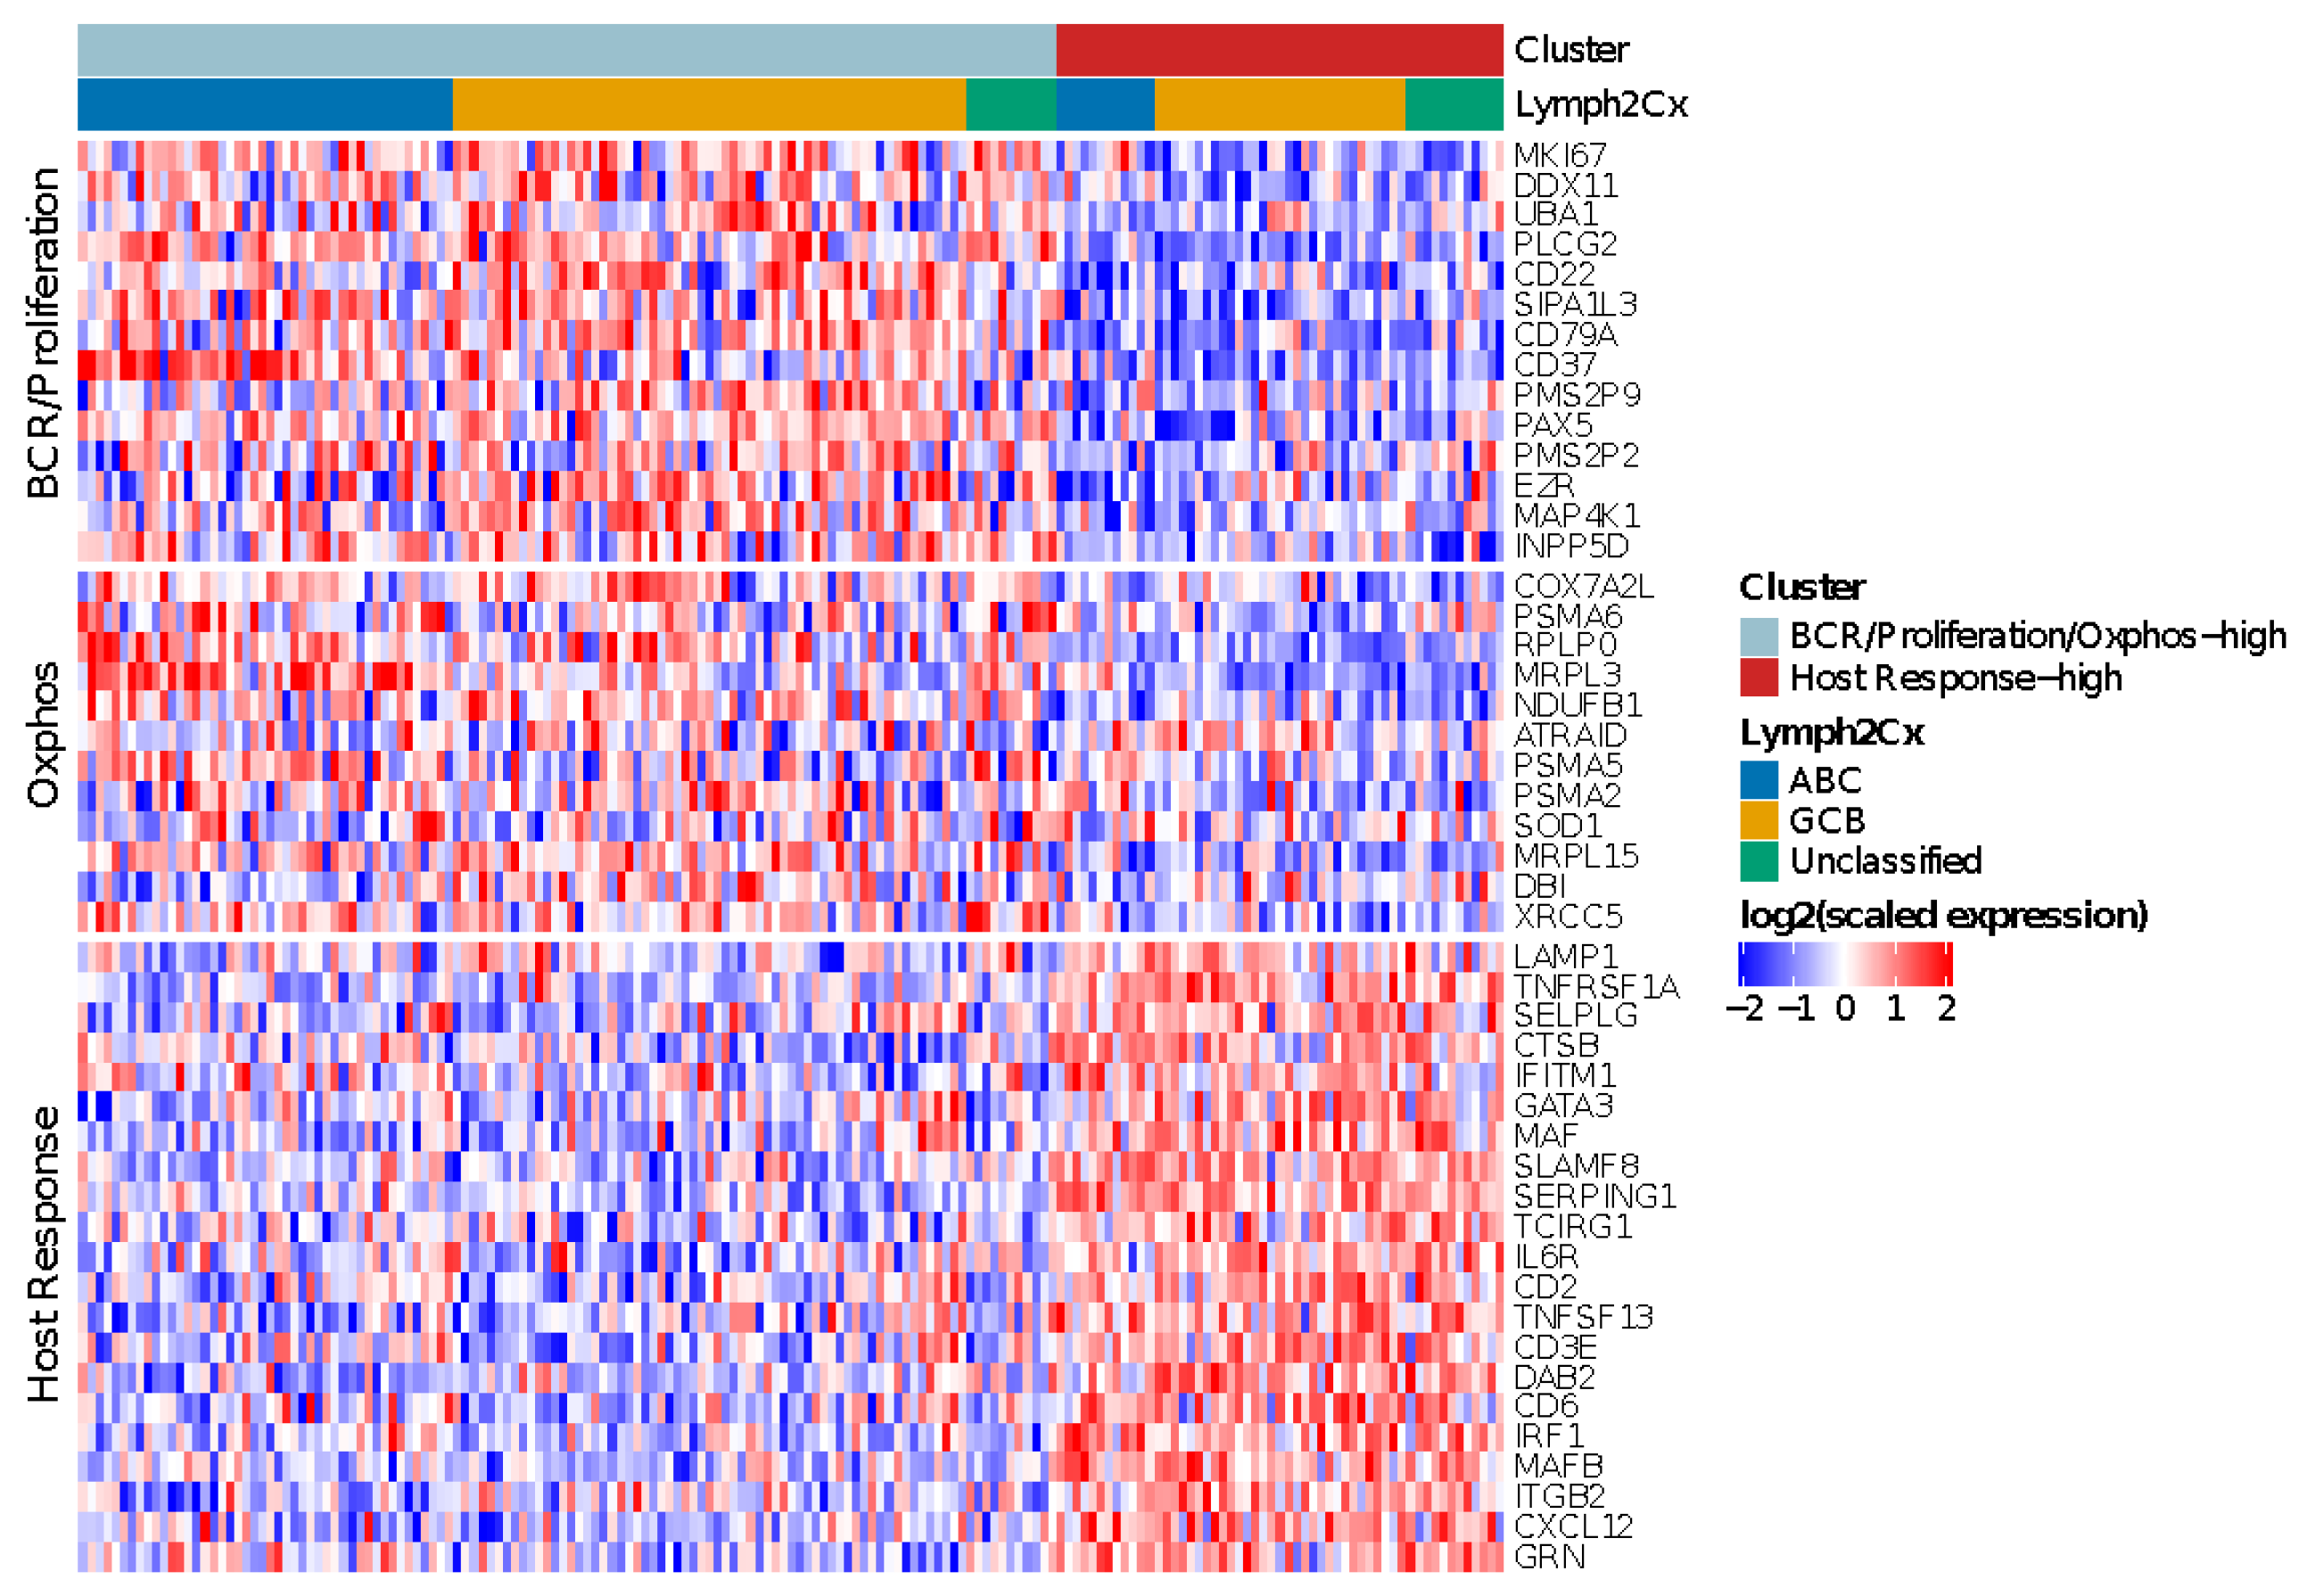
3.6. Monti Consensus Clustering in HOVON-84
3.7. Immune-Ratio Classifier
3.8. Comparison of the Reproduced GEPs
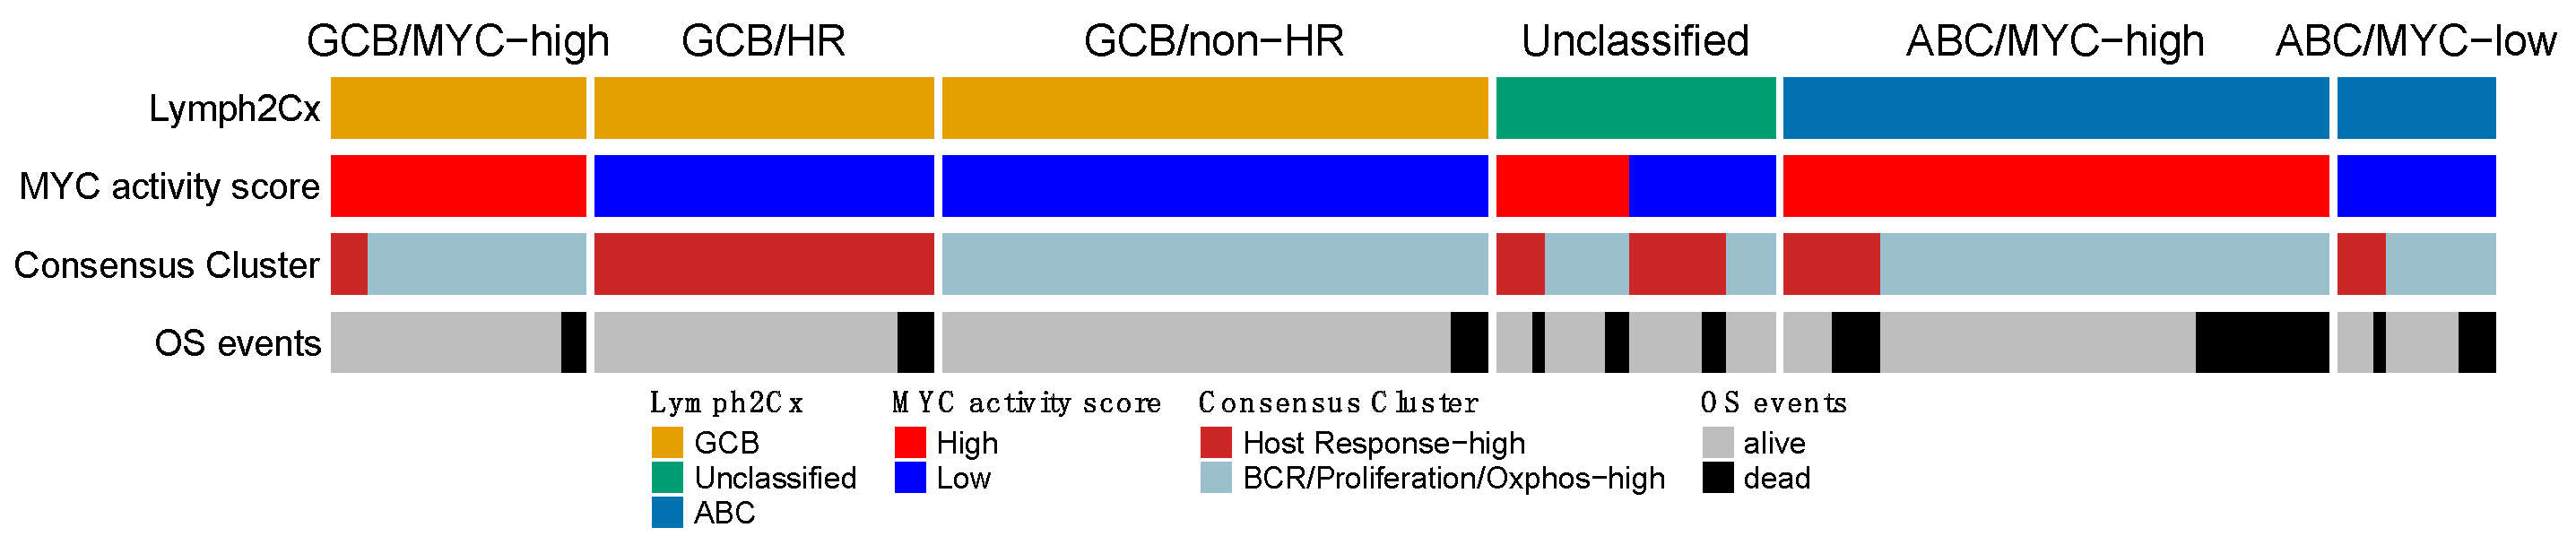
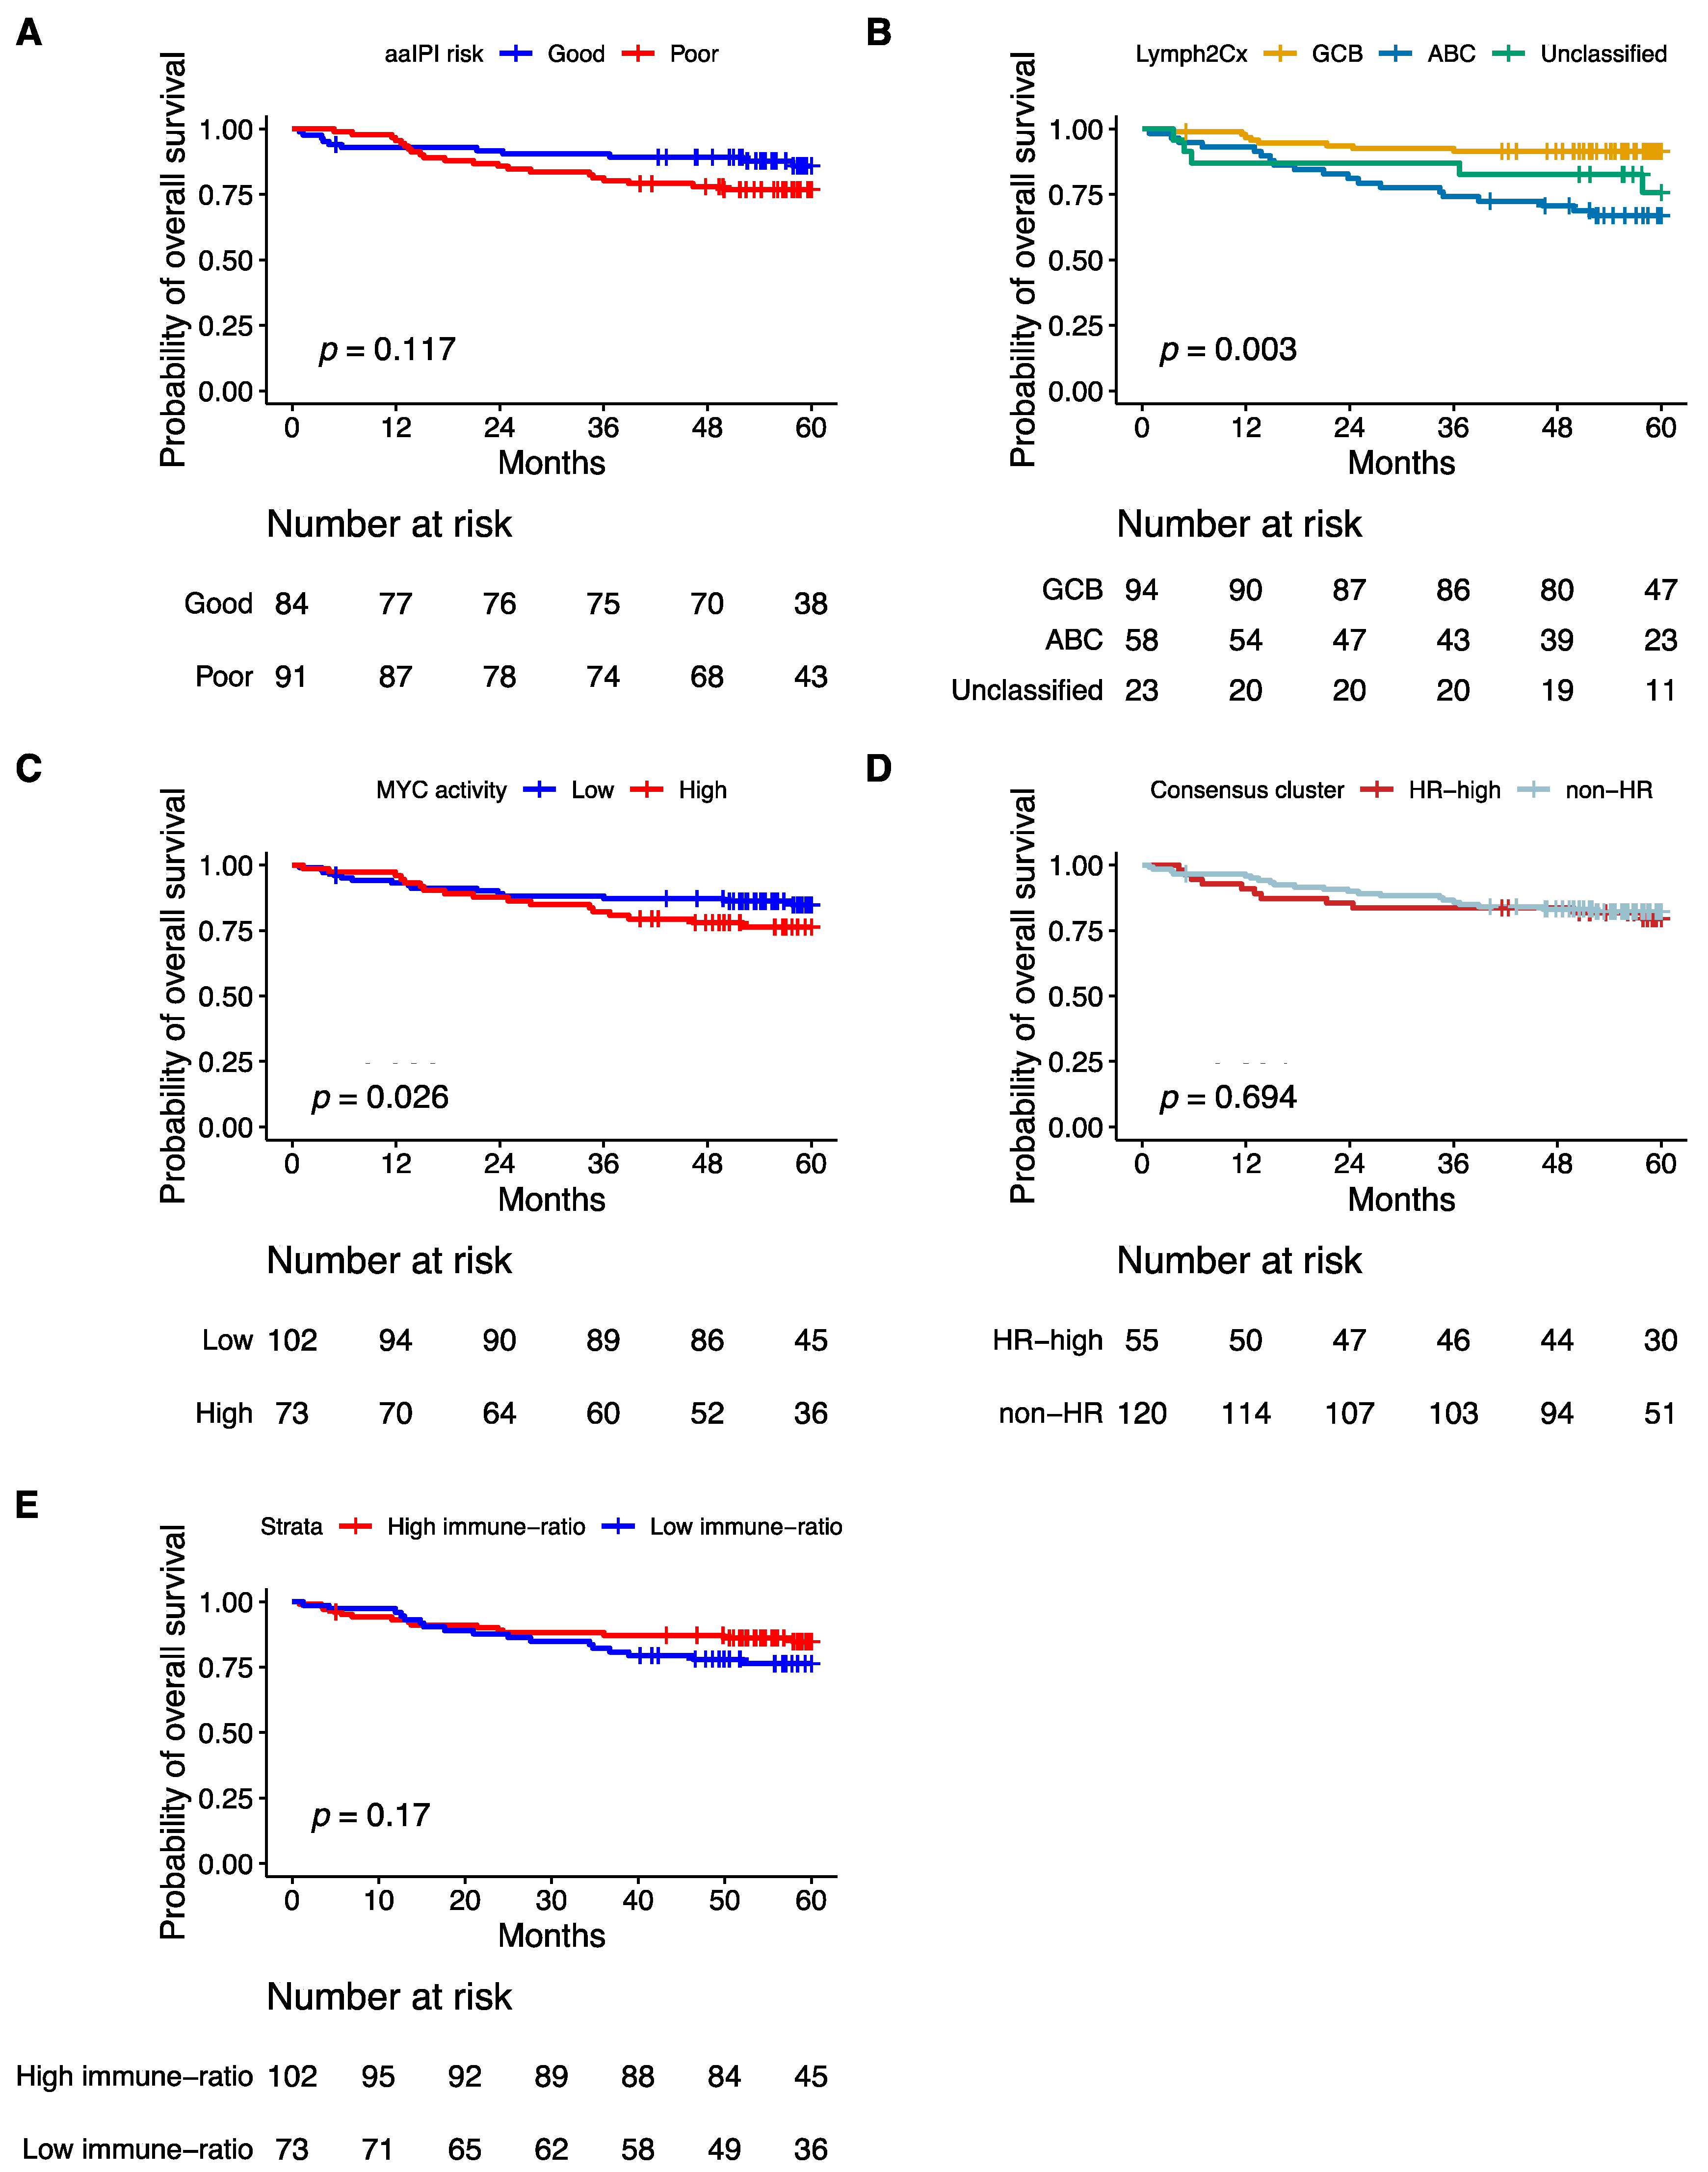
3.9. Prognostic Impact of Validated Signatures
4. Discussion
5. Conclusions
Supplementary Materials
Author Contributions
Funding
Institutional Review Board Statement
Informed Consent Statement
Data Availability Statement
Acknowledgments
Conflicts of Interest
References
- Swerdlow, S.; Campo, E.; Harris, N. WHO Classification of Tumours of Haematopoietic and Lymphoid Tissues; WHO: Rome, Italy, 2017. [Google Scholar]
- Sehn, L.H.; Berry, B.; Chhanabhai, M.; Fitzgerald, C.; Gill, K.; Hoskins, P.; Klasa, R.; Savage, K.J.; Shenkier, T.; Sutherland, J.; et al. The revised International Prognostic Index (R-IPI) is a better predictor of outcome than the standard IPI for patients with diffuse large B-cell lymphoma treated with R-CHOP. Blood 2007, 109, 1857–1861. [Google Scholar] [CrossRef] [PubMed] [Green Version]
- Alizadeh, A.A.; Eisen, M.B.; Davis, R.E.; Ma, C.; Lossos, I.S.; Rosenwald, A.; Boldrick, J.C.; Sabet, H.; Tran, T.; Yu, X.; et al. Distinct types of diffuse large B-cell lymphoma identified by gene expression profiling. Nature 2000, 403, 503–511. [Google Scholar] [CrossRef] [PubMed]
- Leonard, J.P.; Kolibaba, K.S.; Reeves, J.A.; Tulpule, A.; Flinn, I.W.; Kolevska, T.; Robles, R.; Flowers, C.R.; Collins, R.; DiBella, N.J.; et al. Randomized Phase II Study of R-CHOP with or Without Bortezomib in Previously Untreated Patients with Non-Germinal Center B-Cell-Like Diffuse Large B-Cell Lymphoma. J. Clin. Oncol. 2017, 35, 3538–3546. [Google Scholar] [CrossRef] [PubMed]
- Younes, A.; Sehn, L.H.; Johnson, P.; Zinzani, P.L.; Hong, X.; Zhu, J.; Patti, C.; Belada, D.; Samoilova, O.; Suh, C.; et al. Randomized Phase III Trial of Ibrutinib and Rituximab Plus Cyclophosphamide, Doxorubicin, Vincristine, and Prednisone in Non-Germinal Center B-Cell Diffuse Large B-Cell Lymphoma. J. Clin. Oncol. 2019, 37, 1285–1295. [Google Scholar] [CrossRef]
- Vitolo, U.; Witzig, T.E.; Gascoyne, R.D.; Scott, D.W.; Zhang, Q.; Jurczak, W.; Özcan, M.; Hong, X.; Zhu, J.; Jin, J.; et al. ROBUST: First report of phase III randomized study of lenalidomide/R-CHOP (R2-CHOP) vs placebo/R-CHOP in previously untreated ABC-type diffuse large B-cell lymphoma. Hematol. Oncol. 2019, 37, 36–37. [Google Scholar] [CrossRef] [Green Version]
- Rosenwald, A.; Bens, S.; Advani, R.; Barrans, S.; Copie-Bergman, C.; Elsensohn, M.H.; Natkunam, Y.; Calaminici, M.; Sander, B.; Baia, M.; et al. Prognostic Significance of MYC Rearrangement and Translocation Partner in Diffuse Large B-Cell Lymphoma: A Study by the Lunenburg Lymphoma Biomarker Consortium. J. Clin. Oncol. 2019, 37, 3359–3368. [Google Scholar] [CrossRef] [Green Version]
- Casan, J.M.; Barraclough, A.; Shortt, J.; Hawkes, E.A. Dose-adjusted EPOCH-R therapy in MYC-rearranged diffuse large B-cell lymphoma: Not yet the standard of care. Lancet Haematol. 2019, 6, e119. [Google Scholar] [CrossRef] [Green Version]
- Chamuleau, M.E.D.; Burggraaff, C.N.; Nijland, M.; Bakunina, K.; Mous, R.; Lugtenburg, P.J.; Dierickx, D.; van Imhoff, G.W.; Vermaat, J.S.P.; Marijt, E.A.F.; et al. Treatment of patients with MYC rearrangement positive large B-cell lymphoma with R-CHOP plus lenalidomide: Results of a multicenter HOVON phase II trial. Haematologica 2019, 105, 2805–2812. [Google Scholar] [CrossRef] [Green Version]
- Pasqualucci, L.; Trifonov, V.; Fabbri, G.; Ma, J.; Rossi, D.; Chiarenza, A.; Wells, V.A.; Grunn, A.; Messina, M.; Elliot, O.; et al. Analysis of the coding genome of diffuse large B-cell lymphoma. Nat. Genet. 2011, 43, 830–837. [Google Scholar] [CrossRef] [Green Version]
- Reddy, A.; Zhang, J.; Davis, N.S.; Moffitt, A.B.; Love, C.L.; Waldrop, A.; Leppa, S.; Pasanen, A.; Meriranta, L.; Karjalainen-Lindsberg, M.L.; et al. Genetic and Functional Drivers of Diffuse Large B Cell Lymphoma. Cell 2017, 171, 481–494.e15. [Google Scholar] [CrossRef] [Green Version]
- Schmitz, R.; Wright, G.W.; Huang, D.W.; Johnson, C.A.; Phelan, J.D.; Wang, J.Q.; Roulland, S.; Kasbekar, M.; Young, R.M.; Shaffer, A.L.; et al. Genetics and Pathogenesis of Diffuse Large B-Cell Lymphoma. N. Engl. J. Med. 2018, 378, 1396–1407. [Google Scholar] [CrossRef] [PubMed]
- Chapuy, B.; Stewart, C.; Dunford, A.J.; Kim, J.; Kamburov, A.; Redd, R.A.; Lawrence, M.S.; Roemer, M.G.M.; Li, A.J.; Ziepert, M.; et al. Molecular subtypes of diffuse large B cell lymphoma are associated with distinct pathogenic mechanisms and outcomes. Nat. Med. 2018, 24, 679–690. [Google Scholar] [CrossRef] [PubMed]
- Lacy, S.E.; Barrans, S.L.; Beer, P.A.; Painter, D.; Smith, A.G.; Roman, E.; Cooke, S.L.; Ruiz, C.; Glover, P.; Van Hoppe, S.J.L.; et al. Targeted sequencing in DLBCL, molecular subtypes, and outcomes: A Haematological Malignancy Research Network report. Blood 2020, 135, 1759–1771. [Google Scholar] [CrossRef] [PubMed]
- Scott, D.W.; Wright, G.W.; Williams, P.M.; Lih, C.J.; Walsh, W.; Jaffe, E.S.; Rosenwald, A.; Campo, E.; Chan, W.C.; Connors, J.M.; et al. Determining cell-of-origin subtypes of diffuse large B-cell lymphoma using gene expression in formalin-fixed paraffin-embedded tissue. Blood 2014, 123, 1214–1217. [Google Scholar] [CrossRef] [PubMed]
- Carey, C.D.; Gusenleitner, D.; Chapuy, B.; Kovach, A.E.; Kluk, M.J.; Sun, H.H.; Crossland, R.E.; Bacon, C.M.; Rand, V.; Dal Cin, P.; et al. Molecular classification of MYC-driven B-cell lymphomas by targeted gene expression profiling of fixed biopsy specimens. J. Mol. Diagn. 2015, 17, 19–30. [Google Scholar] [CrossRef] [Green Version]
- Monti, S.; Savage, K.J.; Kutok, J.L.; Feuerhake, F.; Kurtin, P.; Mihm, M.; Wu, B.; Pasqualucci, L.; Neuberg, D.; Aguiar, R.C.; et al. Molecular profiling of diffuse large B-cell lymphoma identifies robust subtypes including one characterized by host inflammatory response. Blood 2005, 105, 1851–1861. [Google Scholar] [CrossRef] [Green Version]
- Keane, C.; Vari, F.; Hertzberg, M.; Cao, K.A.; Green, M.R.; Han, E.; Seymour, J.F.; Hicks, R.J.; Gill, D.; Crooks, P.; et al. Ratios of T-cell immune effectors and checkpoint molecules as prognostic biomarkers in diffuse large B-cell lymphoma: A population-based study. Lancet Haematol. 2015, 2, e445–e455. [Google Scholar] [CrossRef] [Green Version]
- Rosenwald, A.; Wright, G.; Chan, W.C.; Connors, J.M.; Campo, E.; Fisher, R.I.; Gascoyne, R.D.; Muller-Hermelink, H.K.; Smeland, E.B.; Giltnane, J.M.; et al. The use of molecular profiling to predict survival after chemotherapy for diffuse large-B-cell lymphoma. N. Engl. J. Med. 2002, 346, 1937–1947. [Google Scholar] [CrossRef]
- Lenz, G.; Wright, G.; Dave, S.S.; Xiao, W.; Powell, J.; Zhao, H.; Xu, W.; Tan, B.; Goldschmidt, N.; Iqbal, J.; et al. Stromal gene signatures in large-B-cell lymphomas. N. Engl. J. Med. 2008, 359, 2313–2323. [Google Scholar] [CrossRef] [Green Version]
- Shipp, M.A.; Ross, K.N.; Tamayo, P.; Weng, A.P.; Kutok, J.L.; Aguiar, R.C.; Gaasenbeek, M.; Angelo, M.; Reich, M.; Pinkus, G.S.; et al. Diffuse large B-cell lymphoma outcome prediction by gene-expression profiling and supervised machine learning. Nat. Med. 2002, 8, 68–74. [Google Scholar] [CrossRef]
- Chan, F.C.; Telenius, A.; Healy, S.; Ben-Neriah, S.; Mottok, A.; Lim, R.; Drake, M.; Hu, S.; Ding, J.; Ha, G.; et al. An RCOR1 loss-associated gene expression signature identifies a prognostically significant DLBCL subgroup. Blood 2015, 125, 959–966. [Google Scholar] [CrossRef] [PubMed] [Green Version]
- Dybkær, K.; Bøgsted, M.; Falgreen, S.; Bødker, J.S.; Kjeldsen, M.K.; Schmitz, A.; Bilgrau, A.E.; Xu-Monette, Z.Y.; Li, L.; Bergkvist, K.S.; et al. Diffuse large B-cell lymphoma classification system that associates normal B-cell subset phenotypes with prognosis. J. Clin. Oncol. 2015, 33, 1379–1388. [Google Scholar] [CrossRef] [PubMed] [Green Version]
- Li, C.; Kim, S.W.; Rai, D.; Bolla, A.R.; Adhvaryu, S.; Kinney, M.C.; Robetorye, R.S.; Aguiar, R.C. Copy number abnormalities, MYC activity, and the genetic fingerprint of normal B cells mechanistically define the microRNA profile of diffuse large B-cell lymphoma. Blood 2009, 113, 6681–6690. [Google Scholar] [CrossRef]
- Sha, C.; Barrans, S.; Care, M.A.; Cunningham, D.; Tooze, R.M.; Jack, A.; Westhead, D.R. Transferring genomics to the clinic: Distinguishing Burkitt and diffuse large B cell lymphomas. Genome Med. 2015, 7, 64. [Google Scholar] [CrossRef] [PubMed] [Green Version]
- Masqué-Soler, N.; Szczepanowski, M.; Kohler, C.W.; Spang, R.; Klapper, W. Molecular classification of mature aggressive B-cell lymphoma using digital multiplexed gene expression on formalin-fixed paraffin-embedded biopsy specimens. Blood 2013, 122, 1985–1986. [Google Scholar] [CrossRef] [PubMed] [Green Version]
- Ciavarella, S.; Vegliante, M.C.; Fabbri, M.; De Summa, S.; Melle, F.; Motta, G.; De Iuliis, V.; Opinto, G.; Enjuanes, A.; Rega, S.; et al. Dissection of DLBCL microenvironment provides a gene expression-based predictor of survival applicable to formalin-fixed paraffin-embedded tissue. Ann. Oncol. 2018, 29, 2363–2370. [Google Scholar] [CrossRef] [Green Version]
- Ennishi, D.; Jiang, A.; Boyle, M.; Collinge, B.; Grande, B.M.; Ben-Neriah, S.; Rushton, C.; Tang, J.; Thomas, N.; Slack, G.W.; et al. Double-Hit Gene Expression Signature Defines a Distinct Subgroup of Germinal Center B-Cell-Like Diffuse Large B-Cell Lymphoma. J. Clin. Oncol. 2019, 37, 190–201. [Google Scholar] [CrossRef] [PubMed]
- Staiger, A.M.; Altenbuchinger, M.; Ziepert, M.; Kohler, C.; Horn, H.; Huttner, M.; Hüttl, K.S.; Glehr, G.; Klapper, W.; Szczepanowski, M.; et al. A novel lymphoma-associated macrophage interaction signature (LAMIS) provides robust risk prognostication in diffuse large B-cell lymphoma clinical trial cohorts of the DSHNHL. Leukemia 2020, 34, 543–552. [Google Scholar] [CrossRef]
- Veldman-Jones, M.H.; Brant, R.; Rooney, C.; Geh, C.; Emery, H.; Harbron, C.G.; Wappett, M.; Sharpe, A.; Dymond, M.; Barrett, J.C.; et al. Evaluating Robustness and Sensitivity of the NanoString Technologies nCounter Platform to Enable Multiplexed Gene Expression Analysis of Clinical Samples. Cancer Res. 2015, 75, 2587–2593. [Google Scholar] [CrossRef] [Green Version]
- Lugtenburg, P.J.; Brown, P.d.N.; Holt, B.v.d.; D’Amore, F.A.; Koene, H.R.; Jongh, E.d.; Fijnheer, R.; Esser, J.W.v.; Böhmer, L.H.; Pruijt, J.F. Rituximab-CHOP with early rituximab intensification for diffuse large B-cell lymphoma: A randomized phase 3 trial of the HOVON and the Nordic Lymphoma Group (HOVON-84). J. Clin. Oncol. 2020, 38, 3377–3387. [Google Scholar] [CrossRef]
- Salles, G.; de Jong, D.; Xie, W.; Rosenwald, A.; Chhanabhai, M.; Gaulard, P.; Klapper, W.; Calaminici, M.; Sander, B.; Thorns, C.; et al. Prognostic significance of immunohistochemical biomarkers in diffuse large B-cell lymphoma: A study from the Lunenburg Lymphoma Biomarker Consortium. Blood 2011, 117, 7070–7078. [Google Scholar] [CrossRef] [PubMed]
- Hans, C.P.; Weisenburger, D.D.; Greiner, T.C.; Gascoyne, R.D.; Delabie, J.; Ott, G.; Müller-Hermelink, H.K.; Campo, E.; Braziel, R.M.; Jaffe, E.S.; et al. Confirmation of the molecular classification of diffuse large B-cell lymphoma by immunohistochemistry using a tissue microarray. Blood 2004, 103, 275–282. [Google Scholar] [CrossRef]
- Hu, S.; Xu-Monette, Z.Y.; Tzankov, A.; Green, T.; Wu, L.; Balasubramanyam, A.; Liu, W.M.; Visco, C.; Li, Y.; Miranda, R.N.; et al. MYC/BCL2 protein coexpression contributes to the inferior survival of activated B-cell subtype of diffuse large B-cell lymphoma and demonstrates high-risk gene expression signatures: A report from The International DLBCL Rituximab-CHOP Consortium Program. Blood 2013, 121, 4021–4031. [Google Scholar] [CrossRef] [PubMed] [Green Version]
- Nijland, M.; Veenstra, R.N.; Visser, L.; Xu, C.; Kushekhar, K.; van Imhoff, G.W.; Kluin, P.M.; van den Berg, A.; Diepstra, A. HLA dependent immune escape mechanisms in B-cell lymphomas: Implications for immune checkpoint inhibitor therapy? Oncoimmunology 2017, 6, e1295202. [Google Scholar] [CrossRef] [PubMed] [Green Version]
- Mendeville, M.; Roemer, M.G.M.; van den Hout, M.; Los-de Vries, G.T.; Bladergroen, R.; Stathi, P.; Hijmering, N.J.; Rosenwald, A.; Ylstra, B.; de Jong, D. Aggressive genomic features in clinically indolent primary HHV8-negative effusion-based lymphoma. Blood 2019, 133, 377–380. [Google Scholar] [CrossRef] [Green Version]
- Waggott, D.; Chu, K.; Yin, S.; Yin, S.; Wouters, B.G.; Wouters, B.; Liu, F.-F.; Liu, F.; Boutros, P.C.; Boutros, P.C. NanoStringNorm: An extensible R package for the pre-processing of NanoString mRNA and miRNA data. Bioinformatics 2012, 28, 1546–1548. [Google Scholar] [CrossRef] [Green Version]
- Gevrey, M.; Dimopoulos, I.; Lek, S. Review and comparison of methods to study the contribution of variables in artificial neural network models. Ecol. Model. 2003, 160, 249–264. [Google Scholar] [CrossRef]
- Kuhn, M. Building Predictive Models in R Using the caret Package. J. Stat. Softw. 2008, 28, 1–26. [Google Scholar] [CrossRef] [Green Version]
- Wilkerson, M.D.; Hayes, D.N. ConsensusClusterPlus: A class discovery tool with confidence assessments and item tracking. Bioinformaticsi 2010, 26, 1572–1573. [Google Scholar] [CrossRef] [Green Version]
- Wehrens, R.; Kruisselbrink, J. Flexible Self-Organizing Maps in kohonen 3.0. J. Stat. Softw. 2018, 87, 1–18. [Google Scholar] [CrossRef] [Green Version]
- Scrucca, L.; Fop, M.; Murphy, T.B.; Raftery, A.E. mclust 5: Clustering, Classification and Density Estimation Using Gaussian Finite Mixture Models. R J. 2016, 8, 289–317. [Google Scholar] [CrossRef] [PubMed] [Green Version]
- Team, R.C. R: A Language and Environment for Statistical Computing; R Foundation for Statistical Computing: Vienna, Austria, 2019. [Google Scholar]
- Yoon, N.; Ahn, S.; Yong Yoo, H.; Jin Kim, S.; Seog Kim, W.; Hyeh Ko, Y. Cell-of-origin of diffuse large B-cell lymphomas determined by the Lymph2Cx assay: Better prognostic indicator than Hans algorithm. Oncotarget 2017, 8, 22014–22022. [Google Scholar] [CrossRef] [PubMed]
- Klapper, W.; Kreuz, M.; Kohler, C.W.; Burkhardt, B.; Szczepanowski, M.; Salaverria, I.; Hummel, M.; Loeffler, M.; Pellissery, S.; Woessmann, W.; et al. Patient age at diagnosis is associated with the molecular characteristics of diffuse large B-cell lymphoma. Blood 2012, 119, 1882–1887. [Google Scholar] [CrossRef] [PubMed]
- Staiger, A.M.; Ziepert, M.; Horn, H.; Scott, D.W.; Barth, T.F.E.; Bernd, H.W.; Feller, A.C.; Klapper, W.; Szczepanowski, M.; Hummel, M.; et al. Clinical Impact of the Cell-of-Origin Classification and the MYC/ BCL2 Dual Expresser Status in Diffuse Large B-Cell Lymphoma Treated Within Prospective Clinical Trials of the German High-Grade Non-Hodgkin’s Lymphoma Study Group. J. Clin. Oncol. 2017, 35, 2515–2526. [Google Scholar] [CrossRef]
- Goy, A.; Ramchandren, R.; Ghosh, N.; Munoz, J.; Morgan, D.S.; Dang, N.H.; Knapp, M.; Delioukina, M.; Kingsley, E.; Ping, J.; et al. Ibrutinib plus lenalidomide and rituximab has promising activity in relapsed/refractory non-germinal center B-cell-like DLBCL. Blood 2019, 134, 1024–1036. [Google Scholar] [CrossRef] [Green Version]
- Ennishi, D.; Hsi, E.D.; Steidl, C.; Scott, D.W. Toward a New Molecular Taxonomy of Diffuse Large B-cell Lymphoma. Cancer Discov. 2020, 10, 1267–1281. [Google Scholar] [CrossRef]
- Hilton, L.K.; Tang, J.; Ben-Neriah, S.; Alcaide, M.; Jiang, A.; Grande, B.M.; Rushton, C.K.; Boyle, M.; Meissner, B.; Scott, D.W.; et al. The double-hit signature identifies double-hit diffuse large B-cell lymphoma with genetic events cryptic to FISH. Blood 2019, 134, 1528–1532. [Google Scholar] [CrossRef] [Green Version]
- Chen, B.; Khodadoust, M.S.; Liu, C.L.; Newman, A.M.; Alizadeh, A.A. Profiling Tumor Infiltrating Immune Cells with CIBERSORT. Methods Mol. Biol. 2018, 1711, 243–259. [Google Scholar] [CrossRef]
- Qin, J.S.; Johnstone, T.G.; Baturevych, A.; Hause, R.J.; Ragan, S.P.; Clouser, C.R.; Jones, J.C.; Ponce, R.; Krejsa, C.M.; Salmon, R.A.; et al. Antitumor Potency of an Anti-CD19 Chimeric Antigen Receptor T-Cell Therapy, Lisocabtagene Maraleucel in Combination with Ibrutinib or Acalabrutinib. J. Immunother. 2020, 43, 107–120. [Google Scholar] [CrossRef]


Publisher’s Note: MDPI stays neutral with regard to jurisdictional claims in published maps and institutional affiliations. |
© 2022 by the authors. Licensee MDPI, Basel, Switzerland. This article is an open access article distributed under the terms and conditions of the Creative Commons Attribution (CC BY) license (https://creativecommons.org/licenses/by/4.0/).
Share and Cite
Plaça, J.R.; Diepstra, A.; Los, T.; Mendeville, M.; Seitz, A.; Lugtenburg, P.J.; Zijlstra, J.; Lam, K.; da Silva, W.A., Jr.; Ylstra, B.; et al. Reproducibility of Gene Expression Signatures in Diffuse Large B-Cell Lymphoma. Cancers 2022, 14, 1346. https://0-doi-org.brum.beds.ac.uk/10.3390/cancers14051346
Plaça JR, Diepstra A, Los T, Mendeville M, Seitz A, Lugtenburg PJ, Zijlstra J, Lam K, da Silva WA Jr., Ylstra B, et al. Reproducibility of Gene Expression Signatures in Diffuse Large B-Cell Lymphoma. Cancers. 2022; 14(5):1346. https://0-doi-org.brum.beds.ac.uk/10.3390/cancers14051346
Chicago/Turabian StylePlaça, Jessica Rodrigues, Arjan Diepstra, Tjitske Los, Matías Mendeville, Annika Seitz, Pieternella J. Lugtenburg, Josée Zijlstra, King Lam, Wilson Araújo da Silva, Jr., Bauke Ylstra, and et al. 2022. "Reproducibility of Gene Expression Signatures in Diffuse Large B-Cell Lymphoma" Cancers 14, no. 5: 1346. https://0-doi-org.brum.beds.ac.uk/10.3390/cancers14051346