
Biomarker-Based Models for Preoperative Assessment of Adnexal Mass: A Multicenter Validation Study

 ,
,  , , , ,
Abstract
:Simple Summary
Abstract
1. Introduction
2. Materials and Methods
2.1. Patients and Samples
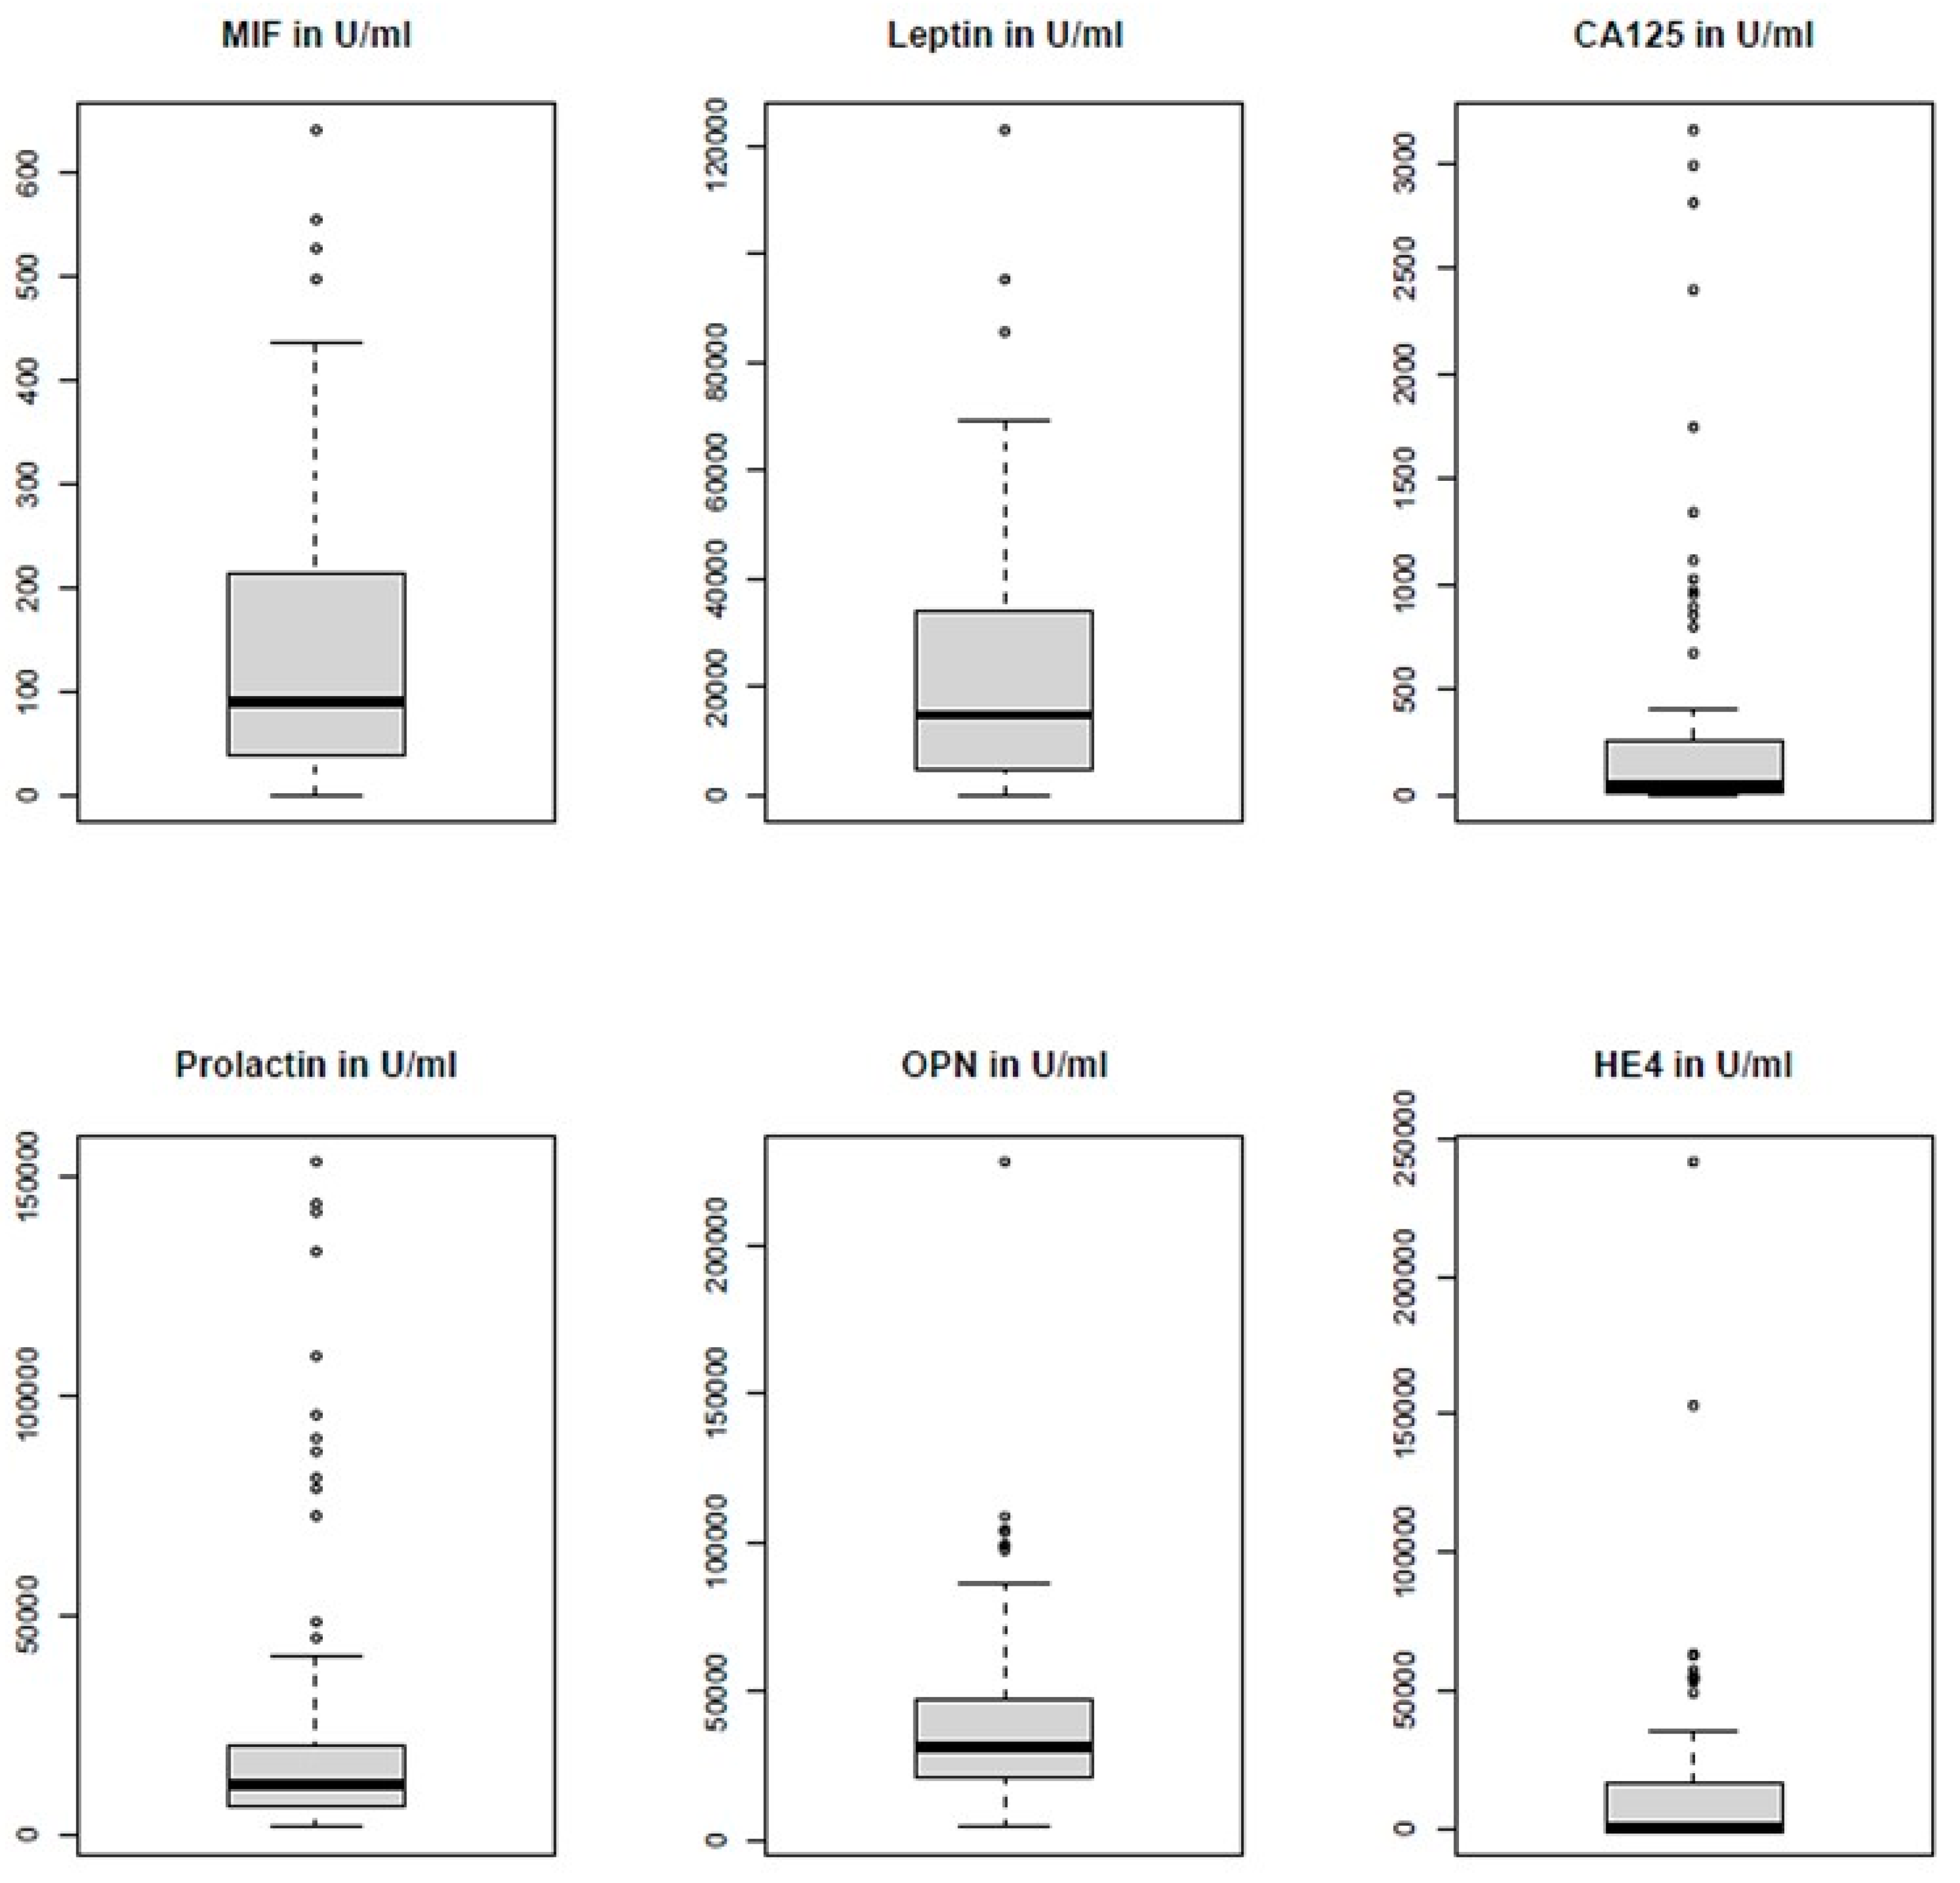
2.2. Laboratory Analyses
2.3. Statistical Analysis
log2(HE4 + 0.5) × 0.2234 + log2(leptin + 0.5) × −0.1320 + log2(PRL + 0.5) × −0.2910))−1
3. Results
3.1. Patient Characteristics
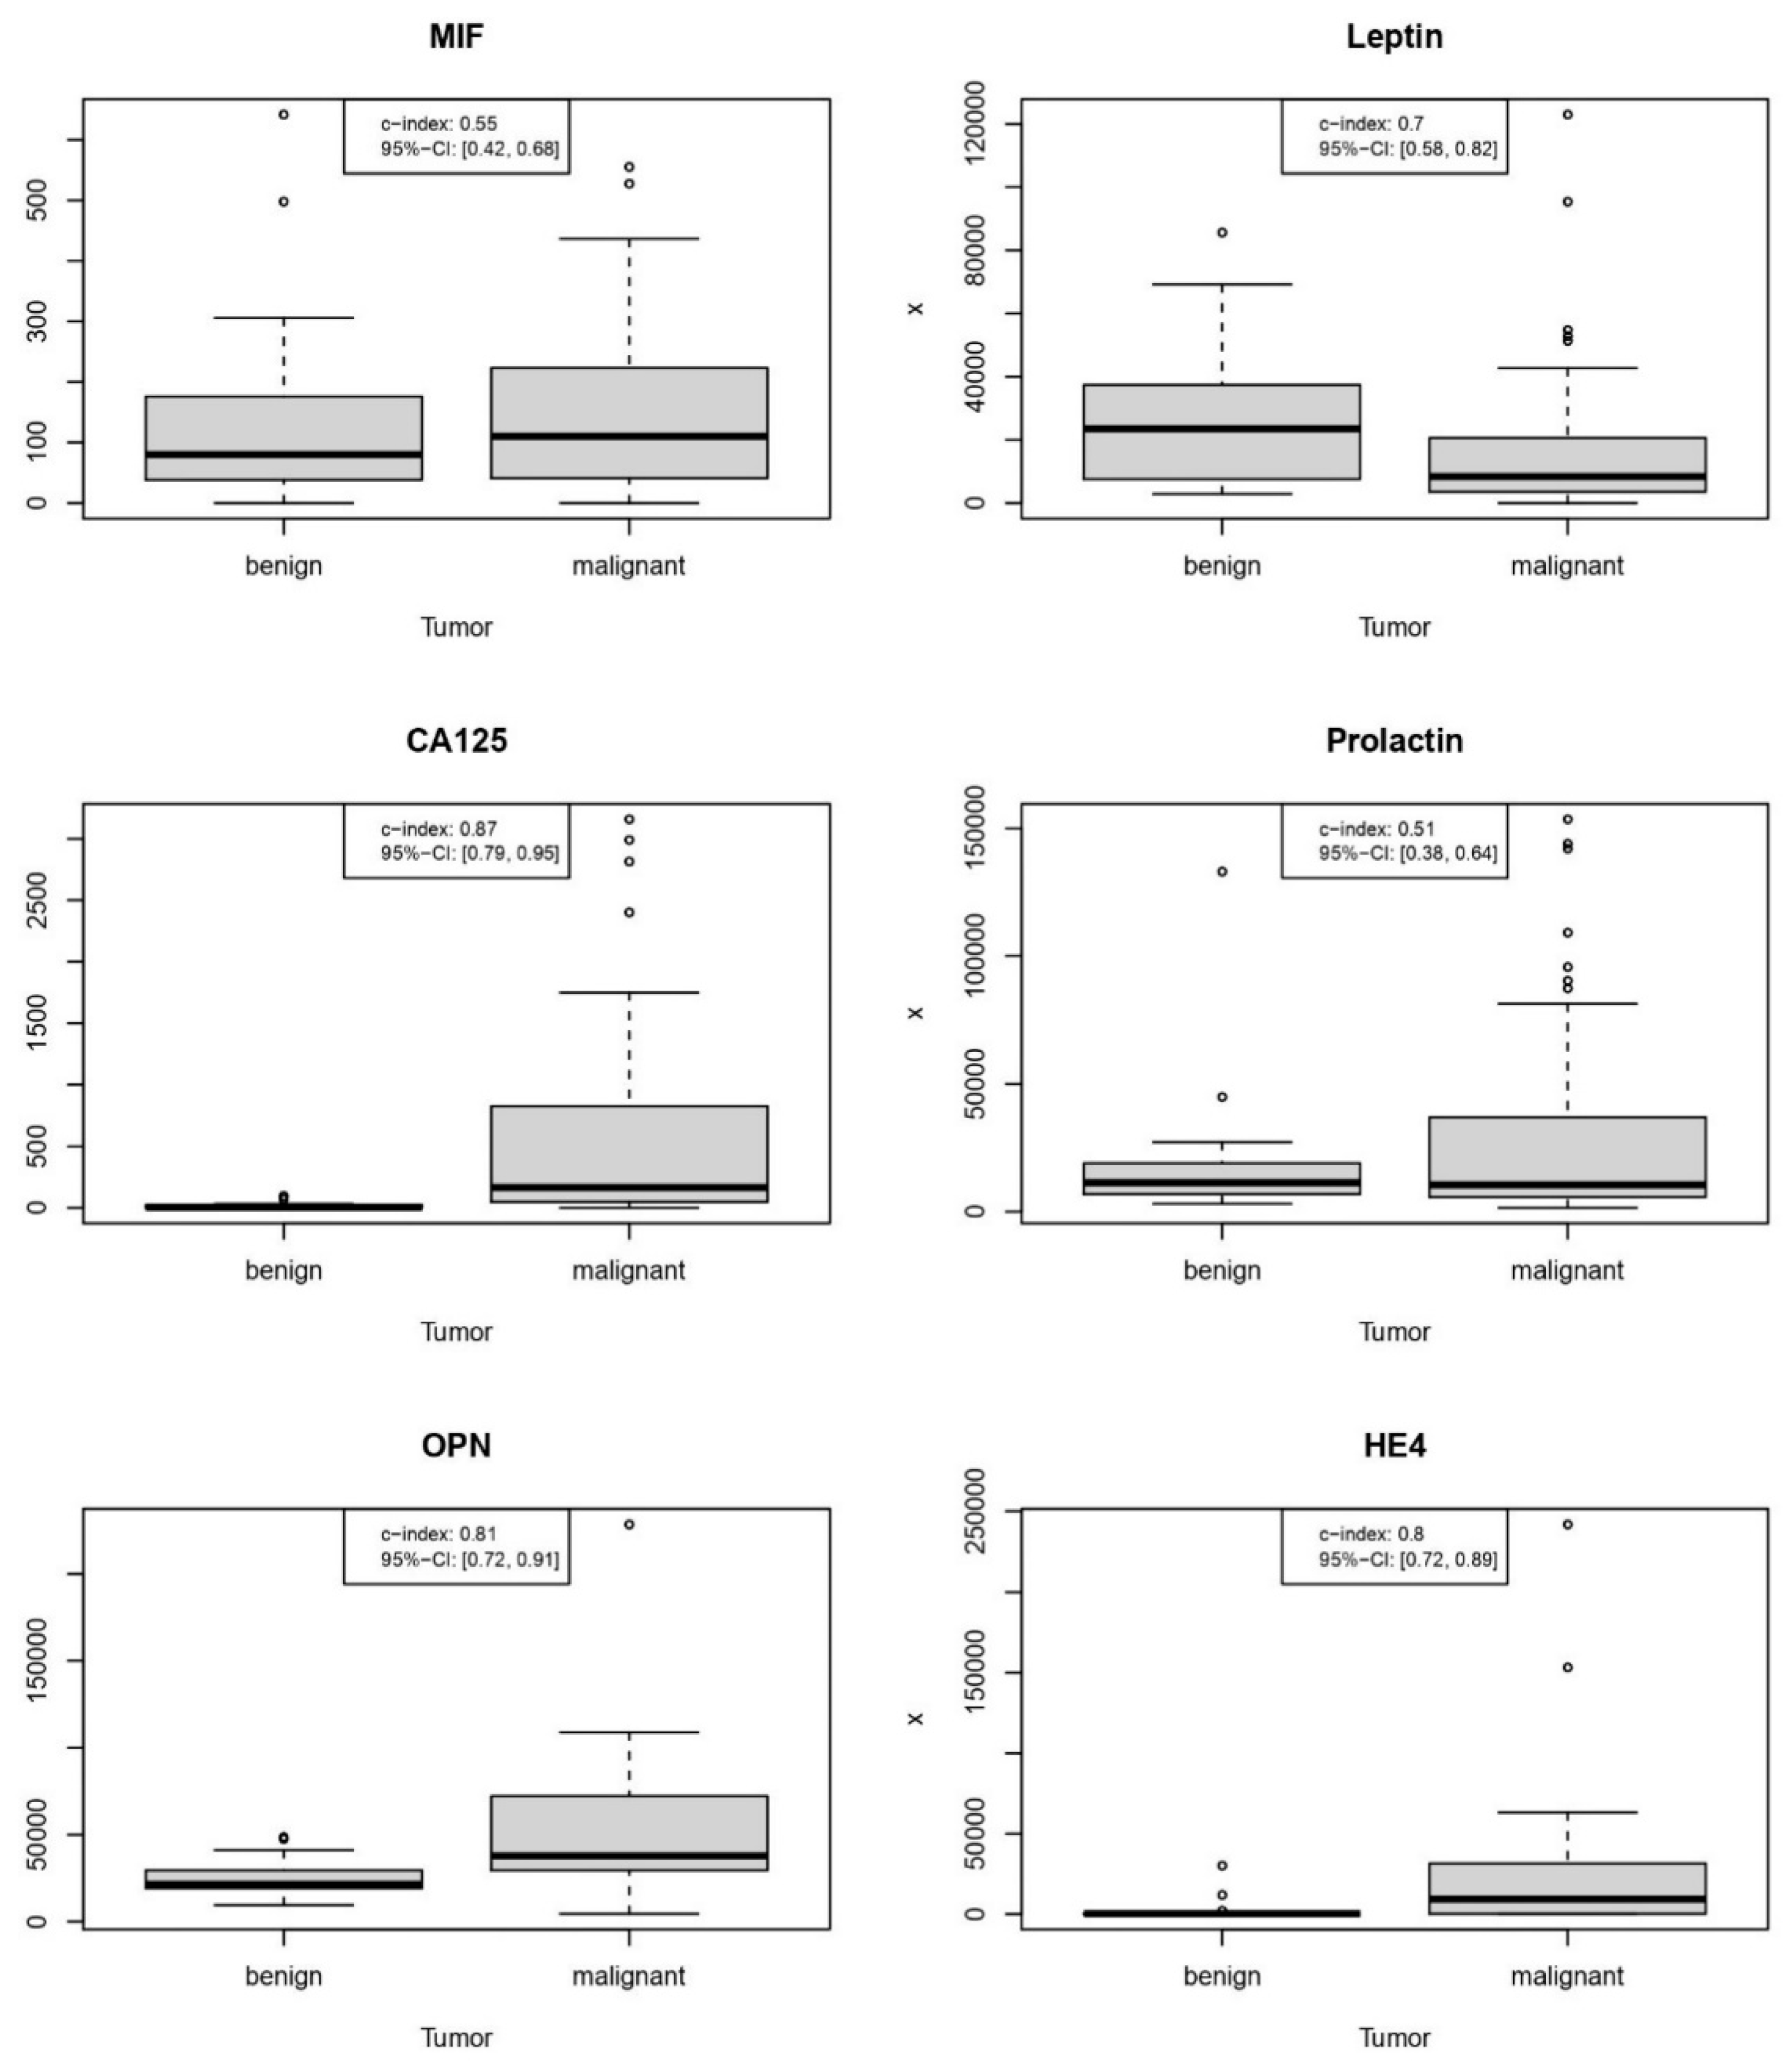
3.2. Performance of Individual Markers
3.3. New Predictive Models
3.3.1. Proteomic Model 2021: CA125, OPN, MIF, and PRL
0.0003 × log2(PRL + 0.5) + 0.0159 × log2(OPN + 0.5) + 0 × log2(HE4 + 0.5)
3.3.2. Combined Model 2021: Selection of Proteins + Age
0.5455 × log2(PRL + 0.5) + 0.0259 × log2(OPN + 0.5) + 0.0559 × log2(HE4 + 0.5)
3.3.3. Full Combined Model 2021: All Proteomics + Age
+ 0.3346 × log2(PRL + 0.5) + 0.0428 × log2(OPN + 0.5) + 0.0885 × log2(HE4 + 0.5)
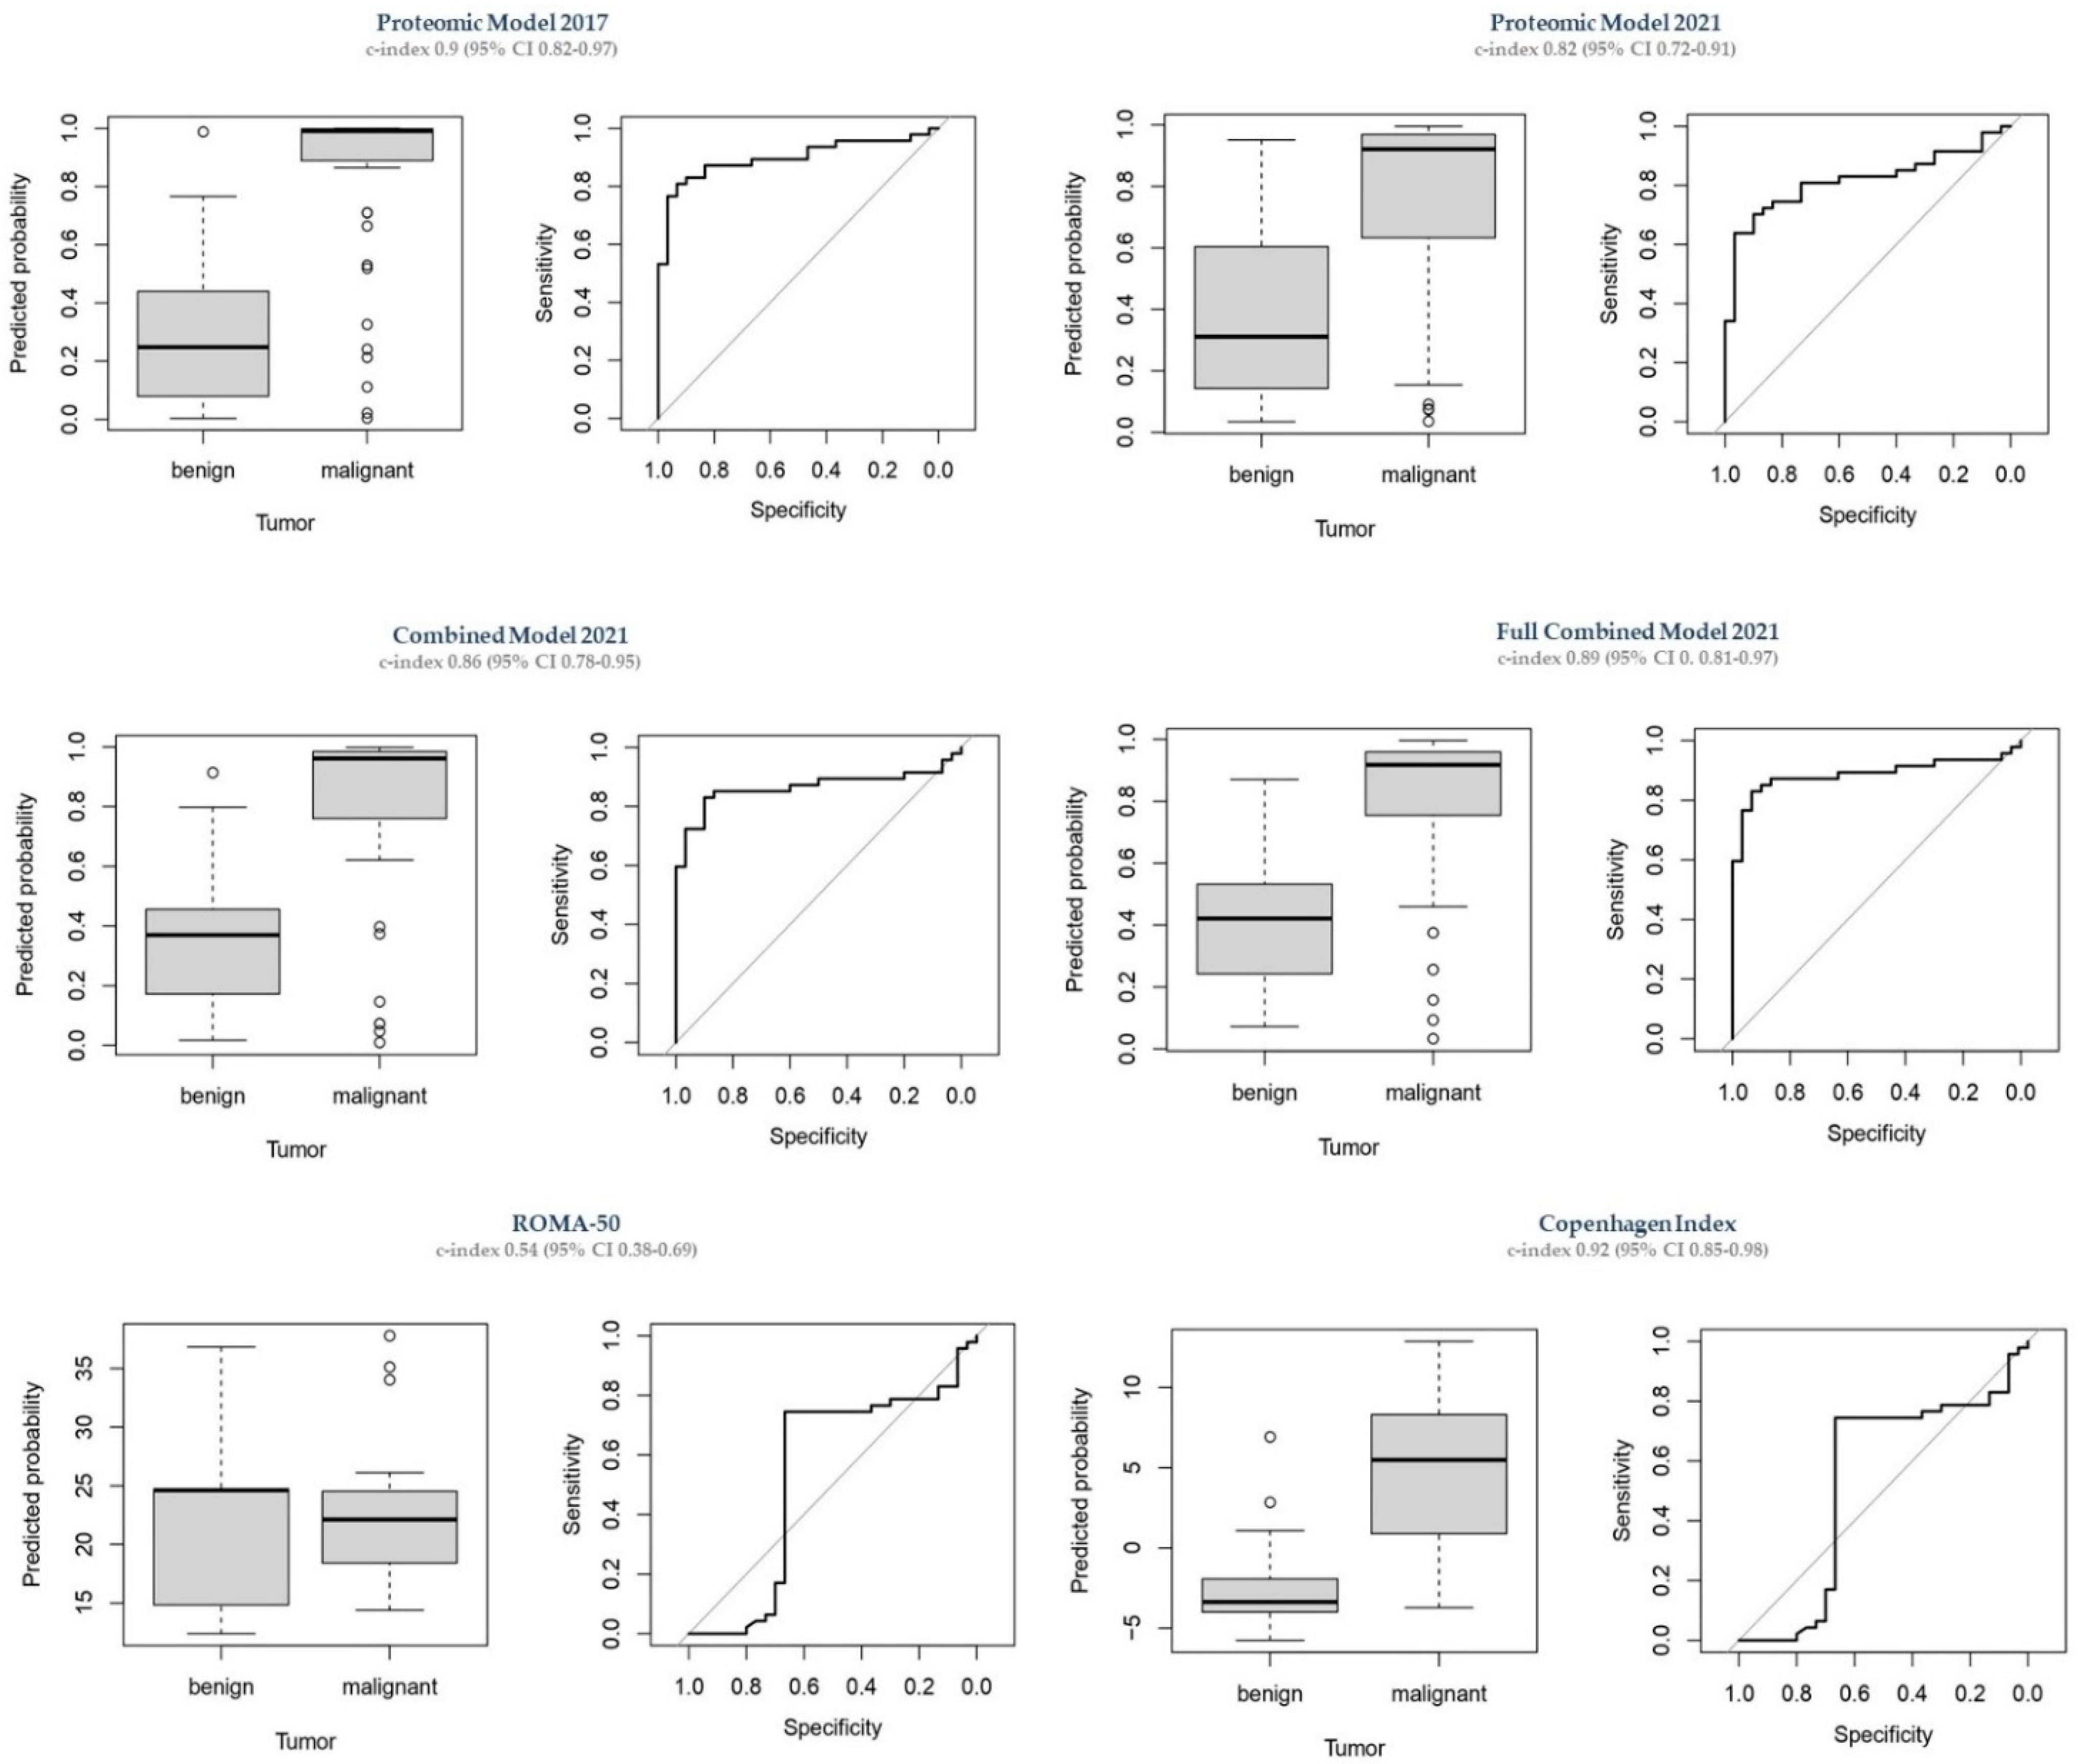
3.4. Comparison to Other Predictive Models
3.4.1. Proteomic Model 2017
3.4.2. ROMA-50
3.4.3. CPH-I
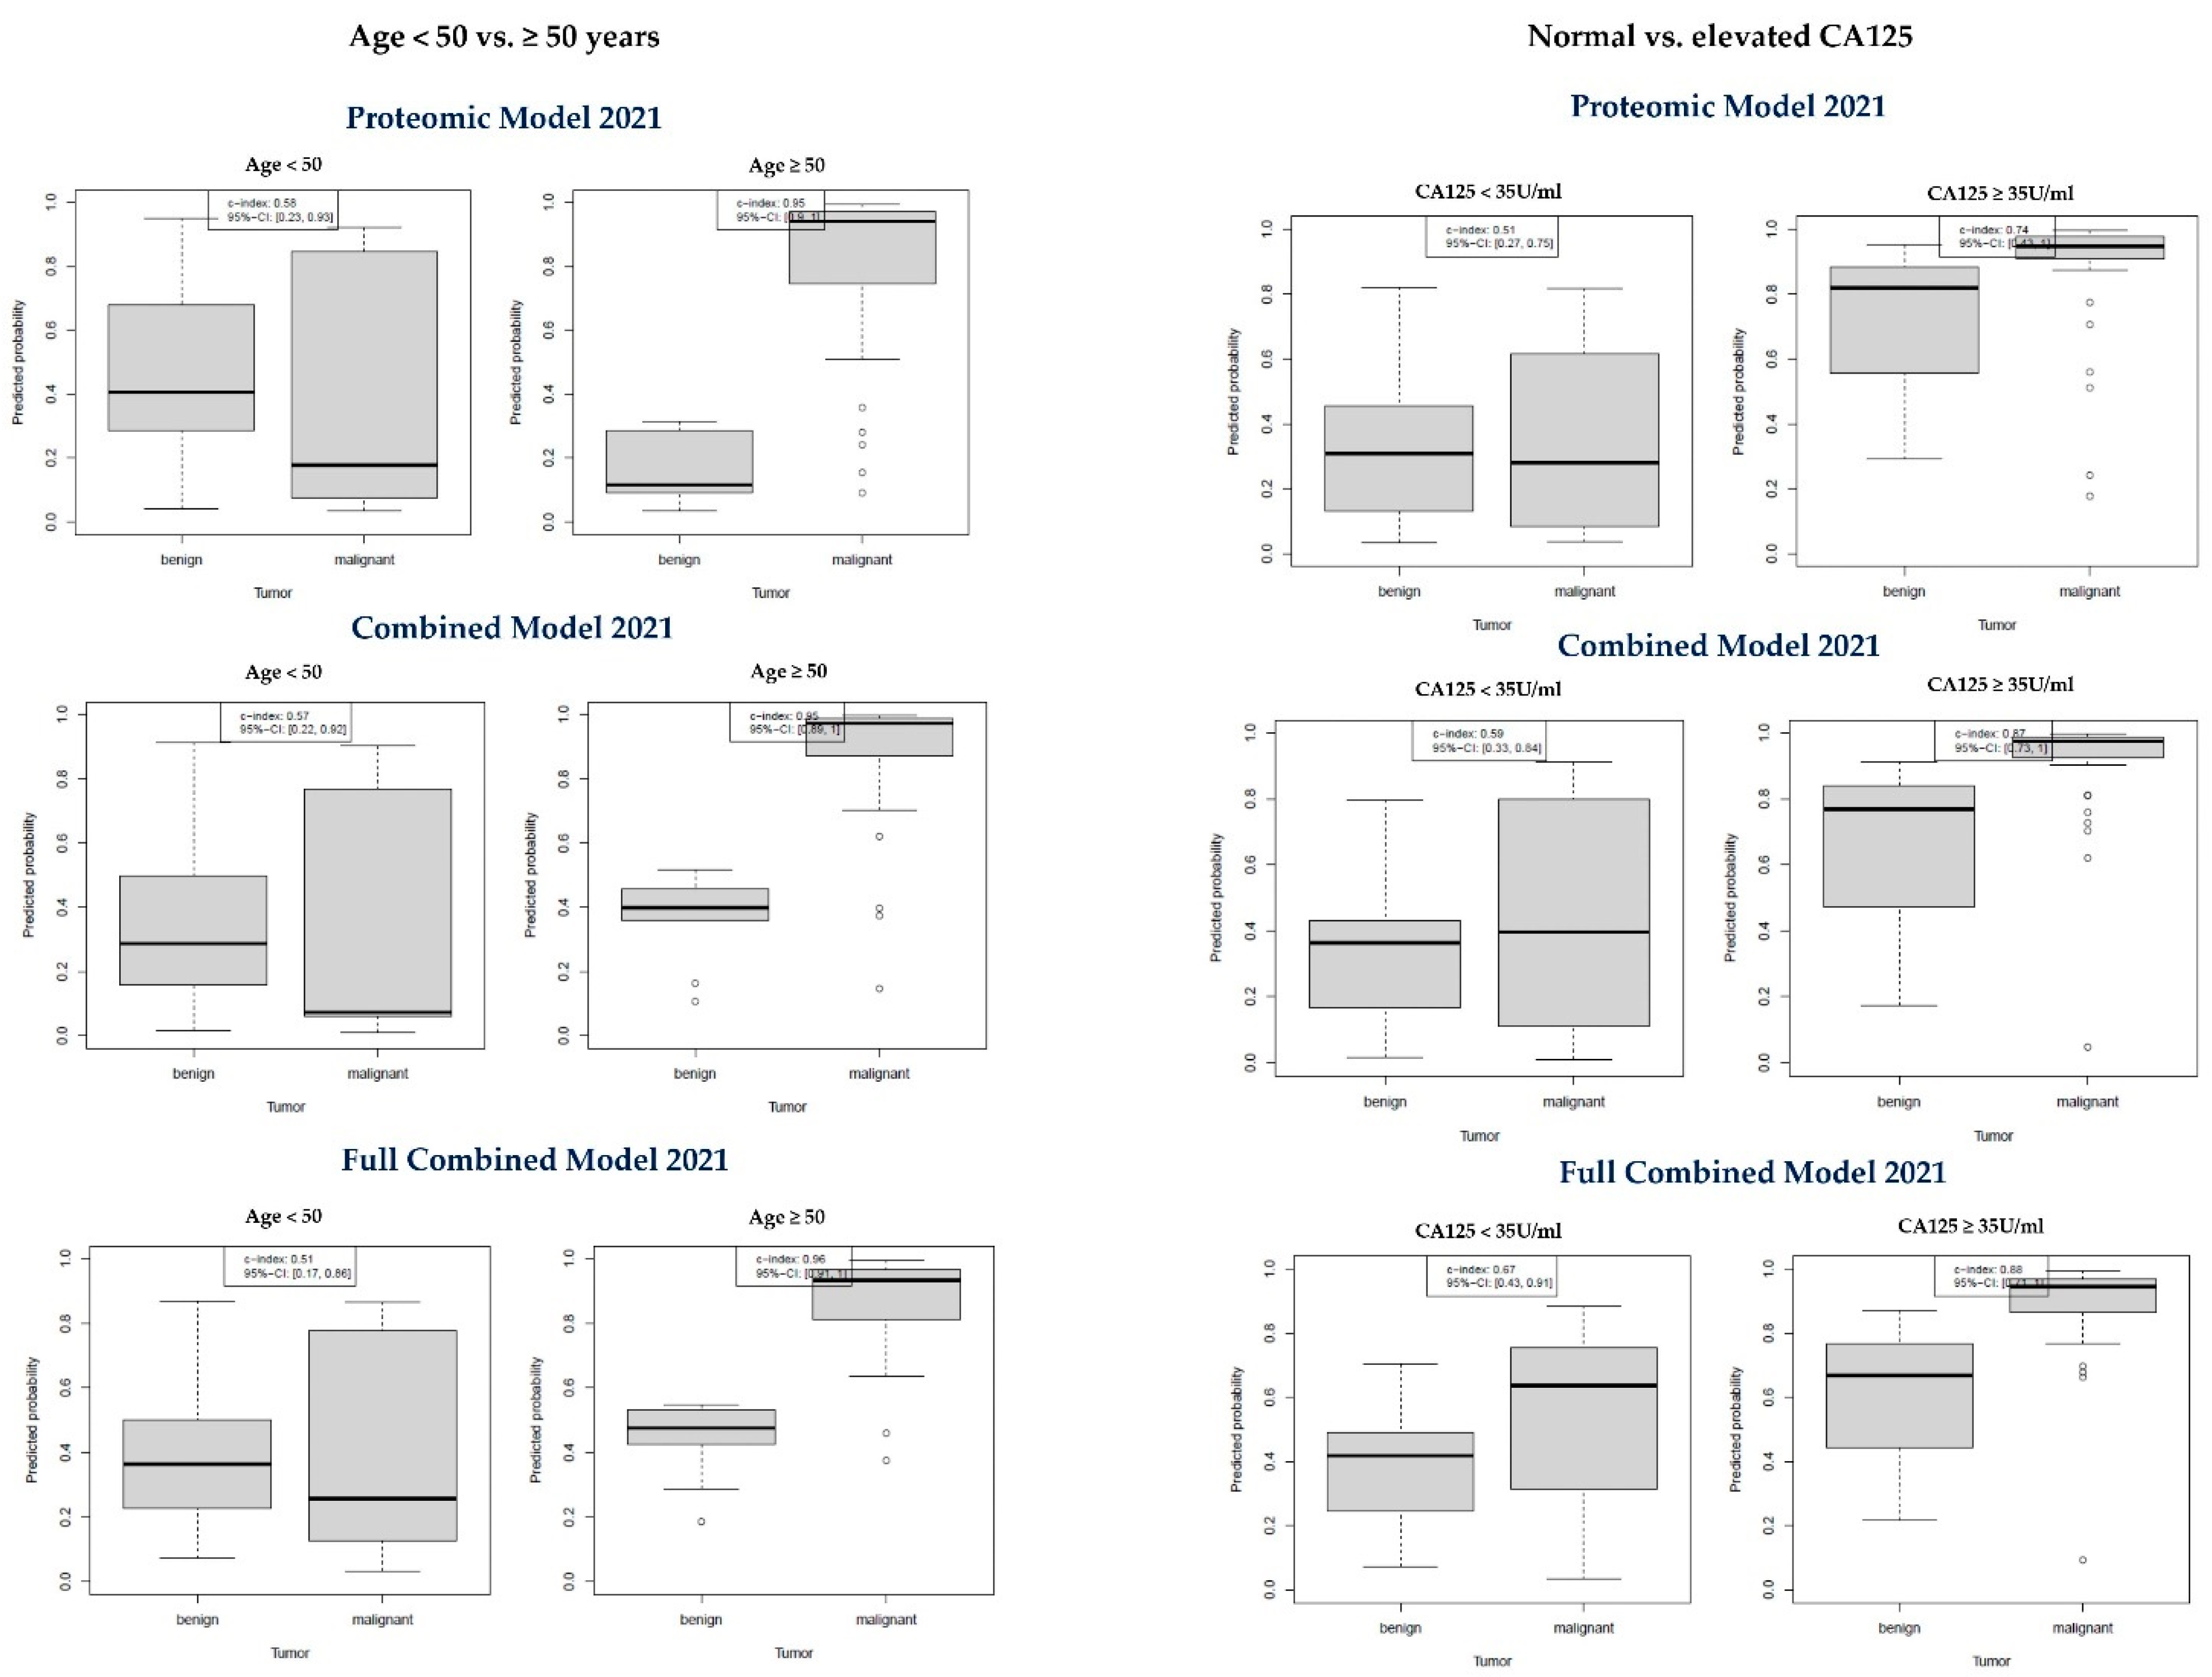
3.5. Subanalyses
3.5.1. Age < 50 vs. Age ≥ 50 Years
3.5.2. Normal CA-125 vs. Elevated CA-125
4. Discussion
5. Conclusions
Author Contributions
Funding
Institutional Review Board Statement
Informed Consent Statement
Data Availability Statement
Conflicts of Interest
Appendix A

| Cohort | Histology | Subtype | n | % |
|---|---|---|---|---|
| Training | benign | serous | 27 | 35.5% |
| dermoid | 19 | 25.0% | ||
| endometrioid | 14 | 18.4% | ||
| functional | 11 | 14.5% | ||
| others | 3 | 3.9% | ||
| n/a | 2 | 2.6% | ||
| total | 76 | 100% | ||
| malignant | HGSOC | 161 | 79.3% | |
| endometrioid | 19 | 9.4% | ||
| borderline | 10 | 4.9% | ||
| CCC | 4 | 2.0% | ||
| undifferentiated | 4 | 2.0% | ||
| LGSOC | 3 | 1.5% | ||
| Met-GI | 1 | 0.5% | ||
| SCST | 1 | 0.5% | ||
| total | 203 | 100% | ||
| Validation | benign | n/a | 21 | 70.0% |
| functional | 5 | 16.7% | ||
| serous | 3 | 10.0% | ||
| others | 1 | 3.3% | ||
| total | 30 | 100% | ||
| malignant | HGSOC | 37 | 78.7% | |
| LGSOC | 4 | 8.5% | ||
| borderline | 2 | 4.3% | ||
| mucinous | 2 | 4.3% | ||
| endometrioid | 1 | 2.1% | ||
| mixed | 1 | 2.1% | ||
| total | 47 | 100% |
| Clinical Center | Berlin | Freiburg | Innsbruck | Leuven | Vienna | ||||||||||
|---|---|---|---|---|---|---|---|---|---|---|---|---|---|---|---|
| Variable | n | Mean or % | SD | n | Mean or % | SD | n | Mean | SD | n | Mean or % | SD | n | Mean | SD |
| Diagnosis | 70 | 72 | 38 | 39 | 137 | ||||||||||
| Benign | 3 | 4% | 72 | 100% | 27 | 71% | 3 | 8% | 1 | 1% | |||||
| Borderline | 10 | 14% | 0 | 0% | 2 | 5% | 0 | 0% | 0 | 0% | |||||
| Malignant | 57 | 81% | 0 | 0% | 9 | 24% | 36 | 92% | 136 | 99% | |||||
| Stage | 64 | 0 | 9 | 35 | 136 | ||||||||||
| Early (I–IIa) | 12 | 19% | 0 | n/a | 1 | 11% | 1 | 3% | 19 | 14% | |||||
| Advanced (IIb–IV) | 52 | 81% | 0 | n/a | 8 | 89% | 34 | 97% | 117 | 86% | |||||
| Age (years) | 70 | 58.4 | 14.4 | 72 | 42.2 | 15 | 38 | 50.3 | 16.7 | 39 | 62.1 | 11.9 | 137 | 60.3 | 12.5 |
| Menopausal status | 70 | 72 | 38 | 39 | 137 | ||||||||||
| ≥50 years | 58 | 83% | 19 | 26% | 16 | 42% | 36 | 92% | 107 | 78% | |||||
| <50 years | 12 | 17% | 53 | 74% | 22 | 58% | 3 | 8% | 30 | 22% | |||||
| CA125 ≥ 35 U/mL | 70 | 72 | 38 | 39 | 137 | ||||||||||
| No | 17 | 24% | 69 | 96% | 27 | 71% | 11 | 28% | 30 | 22% | |||||
| Yes | 53 | 76% | 3 | 4% | 11 | 29% | 28 | 72% | 107 | 78% | |||||
| Model | Intercept | MIF Log2 | Leptin Log2 | CA125 Log2 | PRL Log2 | OPN Log2 | HE4 Log2 | Age |
|---|---|---|---|---|---|---|---|---|
| Proteomic Model 2021 | −4.7705 | 0.3699 | 0.0000 | 0.6134 | 0.0003 | 0.0159 | 0.0000 | - |
| Combined Model 2021 | −8.3526 | 0.3419 | 0.0000 | 0.5455 | 0.0259 | 0.0559 | 0.0000 | 0.0621 |
| Full Combined Model 2021 | −6.7962 | 0.2385 | −0.0340 | 0.3346 | 0.0428 | 0.0885 | 0.0550 | 0.0465 |
| Author (Year) | Country | Cutoff | Sensitivity | Specificity | C-Index (95% CI) |
|---|---|---|---|---|---|
| Karlsen et al. (2015) [24] | 6 European and 6 Asian countries | 0.07 | 0.82 | 0.84 | 0.93 (n/a) |
| Yoshida et al. (2016) [25] | Brazil | 0.07 | 0.73 | 0.84 | 0.84 (0.79–0.88) |
| Minar et al. (2018) [27] | Czech Republic | 0.07 | 0.69 | 0.85 | 0.83 (0.78–0.88) |
| Tran et al. (2021) [26] | Vietnam | 0.02 | 0.87 | 0.79 | 0.9 (0.87–0.92) |
| Carreras-Dieguez et al. (2022) [17] | Spain | 0.01 | 0.97 | 0.48 | 0.94 (0.91–0.96) |
| 0.03 | 0.91 | 0.79 | |||
| 0.05 | 0.87 | 0.88 | |||
| 0.07 | 0.82 | 0.91 | |||
| Watrowski et al. (present study) | Austria, Belgium, Germany | -0.72 | 0.83 | 0.90 | 0.92 (0.95–0.98) |


References
- Sung, H.; Ferlay, J.; Siegel, R.L.; Laversanne, M.; Soerjomataram, I.; Jemal, A.; Bray, F. Global Cancer Statistics 2020: GLOBOCAN Estimates of Incidence and Mortality Worldwide for 36 Cancers in 185 Countries. CA A Cancer J. Clin. 2021, 71, 209–249. [Google Scholar] [CrossRef]
- Zhou, Z.; Wang, X.; Ren, X.; Zhou, L.; Wang, N.; Kang, H. Disease Burden and Attributable Risk Factors of Ovarian Cancer from 1990 to 2017: Findings from the Global Burden of Disease Study 2017. Front. Public Health 2021, 9, 619581. [Google Scholar] [CrossRef] [PubMed]
- Global Burden of Disease 2019 Cancer Collaboration; Kocarnik, J.M.; Compton, K.; Dean, F.E.; Fu, W.; Gaw, B.L.; Harvey, J.D.; Henrikson, H.J.; Lu, D.; Pennini, A.; et al. Cancer Incidence, Mortality, Years of Life Lost, Years Lived with Disability, and Disability-Adjusted Life Years for 29 Cancer Groups From 2010 to 2019: A Systematic Analysis for the Global Burden of Disease Study 2019. JAMA Oncol. 2022, 8, 420–444. [Google Scholar] [CrossRef]
- Nolen, B.M.; Lokshin, A.E. Protein Biomarkers of Ovarian Cancer: The Forest and the Trees. Future Oncol. 2012, 8, 55–71. [Google Scholar] [CrossRef] [PubMed] [Green Version]
- Bast, R.C.; Lu, Z.; Han, C.Y.; Lu, K.H.; Anderson, K.S.; Drescher, C.W.; Skates, S.J. Biomarkers and Strategies for Early Detection of Ovarian Cancer. Cancer Epidemiol. Biomark. Prev. 2020, 29, 2504–2512. [Google Scholar] [CrossRef] [PubMed]
- van Baal, J.O.A.M.; Van de Vijver, K.K.; Algera, M.D.; van der Aa, M.A.; Sonke, G.S.; van Driel, W.J.; Kenter, G.G.; Amant, F.C.; Lok, C.A.R. The Effect of Adjuvant Chemotherapy on Survival in Patients with FIGO Stage I High-Grade Serous Ovarian Cancer. Gynecol. Oncol. 2019, 153, 562–567. [Google Scholar] [CrossRef] [PubMed]
- Matsuda, A.; Katanoda, K. Five-Year Relative Survival Rate of Ovarian Cancer in the USA, Europe and Japan. Jpn. J. Clin. Oncol. 2014, 44, 196. [Google Scholar] [CrossRef] [PubMed] [Green Version]
- du Bois, A.; Rochon, J.; Pfisterer, J.; Hoskins, W.J. Variations in Institutional Infrastructure, Physician Specialization and Experience, and Outcome in Ovarian Cancer: A Systematic Review. Gynecol. Oncol. 2009, 112, 422–436. [Google Scholar] [CrossRef] [PubMed]
- Timmerman, D.; Testa, A.C.; Bourne, T.; Ameye, L.; Jurkovic, D.; Van Holsbeke, C.; Paladini, D.; Van Calster, B.; Vergote, I.; Van Huffel, S.; et al. Simple Ultrasound-Based Rules for the Diagnosis of Ovarian Cancer. Ultrasound Obstet. Gynecol. 2008, 31, 681–690. [Google Scholar] [CrossRef] [PubMed]
- Sassu, C.M.; Palaia, I.; Boccia, S.M.; Caruso, G.; Perniola, G.; Tomao, F.; Di Donato, V.; Musella, A.; Muzii, L. Role of Circulating Biomarkers in Platinum-Resistant Ovarian Cancer. Int. J. Mol. Sci. 2021, 22, 13650. [Google Scholar] [CrossRef] [PubMed]
- Watrowski, R.; Heinze, G.; Jäger, C.; Forster, J.; Zeillinger, R. Usefulness of the Preoperative Platelet Count in the Diagnosis of Adnexal Tumors. Tumour Biol. 2016, 37, 12079–12087. [Google Scholar] [CrossRef] [PubMed]
- Watrowski, R.; Zeillinger, R. Simple Laboratory Score Improves the Preoperative Diagnosis of Adnexal Mass. Tumour Biol. 2016, 37, 4343–4349. [Google Scholar] [CrossRef] [PubMed]
- Yip, P.; Chen, T.-H.; Seshaiah, P.; Stephen, L.L.; Michael-Ballard, K.L.; Mapes, J.P.; Mansfield, B.C.; Bertenshaw, G.P. Comprehensive Serum Profiling for the Discovery of Epithelial Ovarian Cancer Biomarkers. PLoS ONE 2011, 6, e29533. [Google Scholar] [CrossRef] [PubMed] [Green Version]
- Bast, R.C.; Klug, T.L.; St John, E.; Jenison, E.; Niloff, J.M.; Lazarus, H.; Berkowitz, R.S.; Leavitt, T.; Griffiths, C.T.; Parker, L.; et al. A Radioimmunoassay Using a Monoclonal Antibody to Monitor the Course of Epithelial Ovarian Cancer. N. Engl. J. Med. 1983, 309, 883–887. [Google Scholar] [CrossRef] [PubMed]
- Charkhchi, P.; Cybulski, C.; Gronwald, J.; Wong, F.O.; Narod, S.A.; Akbari, M.R. CA125 and Ovarian Cancer: A Comprehensive Review. Cancers 2020, 12, 3730. [Google Scholar] [CrossRef]
- Funston, G.; Hamilton, W.; Abel, G.; Crosbie, E.J.; Rous, B.; Walter, F.M. The Diagnostic Performance of CA125 for the Detection of Ovarian and Non-Ovarian Cancer in Primary Care: A Population-Based Cohort Study. PLoS Med. 2020, 17, e1003295. [Google Scholar] [CrossRef] [PubMed]
- Carreras-Dieguez, N.; Glickman, A.; Munmany, M.; Casanovas, G.; Agustí, N.; Díaz-Feijoo, B.; Saco, A.; Sánchez, B.; Gaba, L.; Angeles, M.A.; et al. Comparison of HE4, CA125, ROMA and CPH-I for Preoperative Assessment of Adnexal Tumors. Diagnostics 2022, 12, 226. [Google Scholar] [CrossRef] [PubMed]
- Olsen, M.; Lof, P.; Stiekema, A.; Broek, D.; Wilthagen, E.A.; Bossuyt, P.M.; Lok, C.A.R. The Diagnostic Accuracy of Human Epididymis Protein 4 (HE4) for Discriminating between Benign and Malignant Pelvic Masses: A Systematic Review and Meta-analysis. Acta Obstet. Et Gynecol. Scand. 2021, 100, 1788–1799. [Google Scholar] [CrossRef]
- Suri, A.; Perumal, V.; Ammalli, P.; Suryan, V.; Bansal, S.K. Diagnostic Measures Comparison for Ovarian Malignancy Risk in Epithelial Ovarian Cancer Patients: A Meta-Analysis. Sci. Rep. 2021, 11, 17308. [Google Scholar] [CrossRef] [PubMed]
- Landolfo, C.; Achten, E.T.L.; Ceusters, J.; Baert, T.; Froyman, W.; Heremans, R.; Vanderstichele, A.; Thirion, G.; Van Hoylandt, A.; Claes, S.; et al. Assessment of Protein Biomarkers for Preoperative Differential Diagnosis between Benign and Malignant Ovarian Tumors. Gynecol. Oncol. 2020, 159, 811–819. [Google Scholar] [CrossRef]
- Moore, R.G.; McMeekin, D.S.; Brown, A.K.; DiSilvestro, P.; Miller, M.C.; Allard, W.J.; Gajewski, W.; Kurman, R.; Bast, R.C.; Skates, S.J. A Novel Multiple Marker Bioassay Utilizing HE4 and CA125 for the Prediction of Ovarian Cancer in Patients with a Pelvic Mass. Gynecol. Oncol. 2009, 112, 40–46. [Google Scholar] [CrossRef] [PubMed] [Green Version]
- Coleman, R.L.; Herzog, T.J.; Chan, D.W.; Munroe, D.G.; Pappas, T.C.; Smith, A.; Zhang, Z.; Wolf, J. Validation of a Second-Generation Multivariate Index Assay for Malignancy Risk of Adnexal Masses. Am. J. Obstet. Gynecol. 2016, 215, 82.e1–82.e11. [Google Scholar] [CrossRef] [Green Version]
- Cui, R.; Wang, Y.; Li, Y.; Li, Y. Clinical Value of ROMA Index in Diagnosis of Ovarian Cancer: Meta-Analysis. Cancer Manag. Res. 2019, 11, 2545–2551. [Google Scholar] [CrossRef] [PubMed] [Green Version]
- Karlsen, M.A.; Høgdall, E.V.S.; Christensen, I.J.; Borgfeldt, C.; Kalapotharakos, G.; Zdrazilova-Dubska, L.; Chovanec, J.; Lok, C.A.R.; Stiekema, A.; Mutz-Dehbalaie, I.; et al. A Novel Diagnostic Index Combining HE4, CA125 and Age May Improve Triage of Women with Suspected Ovarian Cancer—An International Multicenter Study in Women with an Ovarian Mass. Gynecol. Oncol. 2015, 138, 640–646. [Google Scholar] [CrossRef] [PubMed]
- Yoshida, A.; Derchain, S.F.; Pitta, D.R.; De Angelo Andrade, L.A.L.; Sarian, L.O. Comparing the Copenhagen Index (CPH-I) and Risk of Ovarian Malignancy Algorithm (ROMA): Two Equivalent Ways to Differentiate Malignant from Benign Ovarian Tumors before Surgery? Gynecol. Oncol. 2016, 140, 481–485. [Google Scholar] [CrossRef] [PubMed]
- Tran, D.T.; Vo, V.K.; Le, M.T.; Chuang, L.; Nguyen, V.Q.H. Copenhagen Index versus ROMA in Preoperative Ovarian Malignancy Risk Stratification: Result from the First Vietnamese Prospective Cohort Study. Gynecol. Oncol. 2021, 162, 113–119. [Google Scholar] [CrossRef] [PubMed]
- Minar, L.; Felsinger, M.; Cermakova, Z.; Zlamal, F.; Bienertova-Vasku, J. Comparison of the Copenhagen Index versus ROMA for the Preoperative Assessment of Women with Ovarian Tumors. Int. J. Gynecol. Obstet. 2018, 140, 241–246. [Google Scholar] [CrossRef] [PubMed]
- Mor, G.; Visintin, I.; Lai, Y.; Zhao, H.; Schwartz, P.; Rutherford, T.; Yue, L.; Bray-Ward, P.; Ward, D.C. Serum Protein Markers for Early Detection of Ovarian Cancer. Proc. Natl. Acad. Sci. USA 2005, 102, 7677–7682. [Google Scholar] [CrossRef] [PubMed] [Green Version]
- Visintin, I.; Feng, Z.; Longton, G.; Ward, D.C.; Alvero, A.B.; Lai, Y.; Tenthorey, J.; Leiser, A.; Flores-Saaib, R.; Yu, H.; et al. Diagnostic Markers for Early Detection of Ovarian Cancer. Clin. Cancer Res. 2008, 14, 1065–1072. [Google Scholar] [CrossRef] [PubMed] [Green Version]
- Greene, M.H.; Feng, Z.; Gail, M.H. The Importance of Test Positive Predictive Value in Ovarian Cancer Screening. Clin. Cancer Res. 2008, 14, 7574, author reply 7577–7579. [Google Scholar] [CrossRef] [PubMed] [Green Version]
- Coates, R.J.; Kolor, K.; Stewart, S.L.; Richardson, L.C. Diagnostic Markers for Ovarian Cancer Screening: Not Ready for Routine Clinical Use. Clin. Cancer Res. 2008, 14, 7575–7576, author reply 7577–7579. [Google Scholar] [CrossRef] [PubMed] [Green Version]
- McIntosh, M.; Anderson, G.; Drescher, C.; Hanash, S.; Urban, N.; Brown, P.; Gambhir, S.S.; Coukos, G.; Laird, P.W.; Nelson, B.; et al. Ovarian Cancer Early Detection Claims Are Biased. Clin. Cancer Res. 2008, 14, 7574, author reply 7577–7579. [Google Scholar] [CrossRef] [PubMed] [Green Version]
- US Food and Drug Administration. OvaSureTM Manufacturer Letter. Available online: https://www.fda.gov/medical-devices/ivd-regulatory-assistance/ovasuretm-manufacturer-letter (accessed on 7 December 2021).
- Pils, D.; Tong, D.; Hager, G.; Obermayr, E.; Aust, S.; Heinze, G.; Kohl, M.; Schuster, E.; Wolf, A.; Sehouli, J.; et al. A Combined Blood Based Gene Expression and Plasma Protein Abundance Signature for Diagnosis of Epithelial Ovarian Cancer—A Study of the OVCAD Consortium. BMC Cancer 2013, 13, 178. [Google Scholar] [CrossRef] [Green Version]
- Gschwantler-Kaulich, D.; Weingartshofer, S.; Rappaport-Fürhauser, C.; Zeilinger, R.; Pils, D.; Muhr, D.; Braicu, E.I.; Kastner, M.-T.; Tan, Y.Y.; Semmler, L.; et al. Diagnostic Markers for the Detection of Ovarian Cancer in BRCA1 Mutation Carriers. PLoS ONE 2017, 12, e0189641. [Google Scholar] [CrossRef] [PubMed] [Green Version]
- Hasenburg, A.; Eichkorn, D.; Vosshagen, F.; Obermayr, E.; Geroldinger, A.; Zeillinger, R.; Bossart, M. Biomarker-Based Early Detection of Epithelial Ovarian Cancer Based on a Five-Protein Signature in Patient’s Plasma—A Prospective Trial. BMC Cancer 2021, 21, 1037. [Google Scholar] [CrossRef] [PubMed]
- WHO Classification of Tumours of Female Reproductive Organs; Kurman, R.J.; International Agency for Research on Cancer; World Health Organization (Eds.) World Health Organization Classification of Tumours, 4th ed.; International Agency for Research on Cancer: Lyon, France, 2014; ISBN 978-92-832-2435-8. [Google Scholar]
- Prat, J. FIGO Committee on Gynecologic Oncology Staging Classification for Cancer of the Ovary, Fallopian Tube, and Peritoneum. Int. J. Gynaecol. Obstet. 2014, 124, 1–5. [Google Scholar] [CrossRef] [PubMed]
- Haslacher, H.; Gerner, M.; Hofer, P.; Jurkowitsch, A.; Hainfellner, J.; Kain, R.; Wagner, O.F.; Perkmann, T. Usage Data and Scientific Impact of the Prospectively Established Fluid Bioresources at the Hospital-Based MedUni Wien Biobank. Biopreserv. Biobank. 2018, 16, 477–482. [Google Scholar] [CrossRef] [PubMed] [Green Version]
- Høgdall, E.V.S.; Christensen, L.; Kjaer, S.K.; Blaakaer, J.; Kjaerbye-Thygesen, A.; Gayther, S.; Jacobs, I.J.; Høgdall, C.K. CA125 Expression Pattern, Prognosis and Correlation with Serum CA125 in Ovarian Tumor Patients. From the Danish “MALOVA” Ovarian Cancer Study. Gynecol. Oncol. 2007, 104, 508–515. [Google Scholar] [CrossRef] [PubMed]
- Hermann, N. Methodical and Pre-Analytical Characteristics of a Multiplex Cancer Biomarker Immunoassay. World J. Methodol. 2014, 4, 219. [Google Scholar] [CrossRef] [PubMed]
- Vrzalova, J.; Prazakova, M.; Novotny, Z.; Topolcan, O.; Casova, M.; Holubec, L. Test of Ovarian Cancer Multiplex XMAP Technology Panel. Anticancer Res. 2009, 29, 573–576. [Google Scholar] [PubMed]
- Lu, D.; Kuhn, E.; Bristow, R.E.; Giuntoli, R.L.; Kjær, S.K.; Shih, I.-M.; Roden, R.B.S. Comparison of Candidate Serologic Markers for Type I and Type II Ovarian Cancer. Gynecol. Oncol. 2011, 122, 560–566. [Google Scholar] [CrossRef] [PubMed] [Green Version]
- Guo, J.; Yang, W.-L.; Pak, D.; Celestino, J.; Lu, K.H.; Ning, J.; Lokshin, A.E.; Cheng, Z.; Lu, Z.; Bast, R.C. Osteopontin, Macrophage Migration Inhibitory Factor and Anti-Interleukin-8 Autoantibodies Complement CA125 for Detection of Early Stage Ovarian Cancer. Cancers 2019, 11, 596. [Google Scholar] [CrossRef] [PubMed] [Green Version]
- Horala, A.; Swiatly, A.; Matysiak, J.; Banach, P.; Nowak-Markwitz, E.; Kokot, Z.J. Diagnostic Value of Serum Angiogenesis Markers in Ovarian Cancer Using Multiplex Immunoassay. Int. J. Mol. Sci. 2017, 18, 123. [Google Scholar] [CrossRef] [PubMed] [Green Version]
- Walker, C.; Nguyen, T.-M.; Jessel, S.; Alvero, A.B.; Silasi, D.-A.; Rutherford, T.; Draghici, S.; Mor, G. Automated Assay of a Four-Protein Biomarker Panel for Improved Detection of Ovarian Cancer. Cancers 2021, 13, 325. [Google Scholar] [CrossRef] [PubMed]
- Kabawat, S.E.; Bast, R.C.; Bhan, A.K.; Welch, W.R.; Knapp, R.C.; Colvin, R.B. Tissue Distribution of a Coelomic-Epithelium-Related Antigen Recognized by the Monoclonal Antibody OC125. Int. J. Gynecol. Pathol. 1983, 2, 275–285. [Google Scholar] [CrossRef] [PubMed]
- Hirsch, M.; Duffy, J.; Davis, C.J.; Nieves Plana, M.; Khan, K.S. International Collaboration to Harmonise Outcomes and Measures for Endometriosis Diagnostic Accuracy of Cancer Antigen 125 for Endometriosis: A Systematic Review and Meta-Analysis. BJOG 2016, 123, 1761–1768. [Google Scholar] [CrossRef]
- Sikaris, K.A. CA125—A Test with a Change of Heart. Heart Lung Circ. 2011, 20, 634–640. [Google Scholar] [CrossRef] [PubMed]
- Drapkin, R.; von Horsten, H.H.; Lin, Y.; Mok, S.C.; Crum, C.P.; Welch, W.R.; Hecht, J.L. Human Epididymis Protein 4 (HE4) Is a Secreted Glycoprotein That Is Overexpressed by Serous and Endometrioid Ovarian Carcinomas. Cancer Res. 2005, 65, 2162–2169. [Google Scholar] [CrossRef] [PubMed] [Green Version]
- Lu, R.; Sun, X.; Xiao, R.; Zhou, L.; Gao, X.; Guo, L. Human Epididymis Protein 4 (HE4) Plays a Key Role in Ovarian Cancer Cell Adhesion and Motility. Biochem. Biophys. Res. Commun. 2012, 419, 274–280. [Google Scholar] [CrossRef]
- Moorman, H.R.; Poschel, D.; Klement, J.D.; Lu, C.; Redd, P.S.; Liu, K. Osteopontin: A Key Regulator of Tumor Progression and Immunomodulation. Cancers 2020, 12, 3379. [Google Scholar] [CrossRef] [PubMed]
- Hu, Z.-D.; Wei, T.-T.; Yang, M.; Ma, N.; Tang, Q.-Q.; Qin, B.-D.; Fu, H.-T.; Zhong, R.-Q. Diagnostic Value of Osteopontin in Ovarian Cancer: A Meta-Analysis and Systematic Review. PLoS ONE 2015, 10, e0126444. [Google Scholar] [CrossRef] [PubMed]
- Lan, Z.; Fu, D.; Yu, X.; Xi, M. Diagnostic Values of Osteopontin Combined with CA125 for Ovarian Cancer: A Meta-Analysis. Fam. Cancer 2016, 15, 221–230. [Google Scholar] [CrossRef]
- Kim, J.-H.; Skates, S.J.; Uede, T.; Wong, K.; Schorge, J.O.; Feltmate, C.M.; Berkowitz, R.S.; Cramer, D.W.; Mok, S.C. Osteopontin as a Potential Diagnostic Biomarker for Ovarian Cancer. JAMA 2002, 287, 1671–1679. [Google Scholar] [CrossRef] [Green Version]
- Ramírez-de-Arellano, A.; Villegas-Pineda, J.C.; Hernández-Silva, C.D.; Pereira-Suárez, A.L. The Relevant Participation of Prolactin in the Genesis and Progression of Gynecological Cancers. Front. Endocrinol. 2021, 12, 747810. [Google Scholar] [CrossRef] [PubMed]
- Sumaiya, K.; Langford, D.; Natarajaseenivasan, K.; Shanmughapriya, S. Macrophage Migration Inhibitory Factor (MIF): A Multifaceted Cytokine Regulated by Genetic and Physiological Strategies. Pharmacol. Ther. 2021, 108024. [Google Scholar] [CrossRef] [PubMed]
- Hagemann, T.; Robinson, S.C.; Thompson, R.G.; Charles, K.; Kulbe, H.; Balkwill, F.R. Ovarian Cancer Cell-Derived Migration Inhibitory Factor Enhances Tumor Growth, Progression, and Angiogenesis. Mol. Cancer Ther. 2007, 6, 1993–2002. [Google Scholar] [CrossRef] [PubMed] [Green Version]
- Kato, S.; Abarzua-Catalan, L.; Trigo, C.; Delpiano, A.; Sanhueza, C.; García, K.; Ibañez, C.; Hormazábal, K.; Diaz, D.; Brañes, J.; et al. Leptin Stimulates Migration and Invasion and Maintains Cancer Stem-like Properties in Ovarian Cancer Cells: An Explanation for Poor Outcomes in Obese Women. Oncotarget 2015, 6, 21100–21119. [Google Scholar] [CrossRef] [PubMed] [Green Version]
- Assidi, M.; Yahya, F.M.; Al-Zahrani, M.H.; Elkhatib, R.; Zari, A.; Elaimi, A.; Al-Maghrabi, J.; Dallol, A.; Buhmeida, A.; Abu-Elmagd, M. Leptin Protein Expression and Promoter Methylation in Ovarian Cancer: A Strong Prognostic Value with Theranostic Promises. Int. J. Mol. Sci. 2021, 22, 12872. [Google Scholar] [CrossRef]
- Grabowski, J.P.; Markowska, A.; Markowska, J. Evaluation of Leptin Serum Concentrations during Surgery and First-Line Chemotherapy in Primary Epithelial Ovarian Cancer Patients. Contemp. Oncol. 2014, 18, 318–322. [Google Scholar] [CrossRef] [PubMed] [Green Version]
- Jin, J.H.; Kim, H.-J.; Kim, C.Y.; Kim, Y.H.; Ju, W.; Kim, S.C. Association of Plasma Adiponectin and Leptin Levels with the Development and Progression of Ovarian Cancer. Obstet. Gynecol. Sci. 2016, 59, 279–285. [Google Scholar] [CrossRef] [Green Version]
- Dunton, C.J.; Hutchcraft, M.L.; Bullock, R.G.; Northrop, L.E.; Ueland, F.R. Salvaging Detection of Early-Stage Ovarian Malignancies When CA125 Is Not Informative. Diagnostics 2021, 11, 1440. [Google Scholar] [CrossRef] [PubMed]
- Phinyo, P.; Patumanond, J.; Saenrungmuaeng, P.; Chirdchim, W.; Pipanmekaporn, T.; Tantraworasin, A.; Tongsong, T.; Tantipalakorn, C. Diagnostic Added-Value of Serum CA-125 on the IOTA Simple Rules and Derivation of Practical Combined Prediction Models (IOTA SR X CA-125). Diagnostics 2021, 11, 173. [Google Scholar] [CrossRef]
- Anastasi, E.; Capoccia, D.; Granato, T.; Silecchia, G.; Rizzello, M.; Porpora, M.G.; Frati, L.; Angeloni, A.; Leonetti, F. Implementing the Risk of Ovarian Malignancy Algorithm Adding Obesity as a Predictive Factor. Anticancer Res. 2016, 36, 6425–6430. [Google Scholar] [CrossRef] [PubMed]
- Rolfsen, A.L.D.; Dahl, A.A.; Pripp, A.H.; Dørum, A. Base Rate of Ovarian Cancer on Algorithms in Patients with a Pelvic Mass. Int. J. Gynecol. Cancer 2020, 30, 1775–1779. [Google Scholar] [CrossRef]


| Variable | Training Cohort (n = 279) | Validation Cohort (n = 77) | ||||
|---|---|---|---|---|---|---|
| n | Mean or % | SD | n | Mean or % | SD | |
| Clinical center | ||||||
| Berlin | 70 | 25% | 0 | 0% | ||
| Freiburg | 72 | 26% | 0 | 0% | ||
| Innsbruck | 0 | 0% | 38 | 49% | ||
| Leuven | 0 | 0% | 39 | 51% | ||
| Vienna | 137 | 49% | 0 | 0% | ||
| Menopausal status | ||||||
| <50 years | 95 | 34.1% | 27 | 35.1% | ||
| ≥50 years | 184 | 65.9% | 50 | 64.9% | ||
| CA125 | ||||||
| <35 U/mL | 116 | 42% | 38 | 49% | ||
| ≥35 U/mL | 163 | 58% | 39 | 51% | ||
| Age (years) | 279 | 55.2 | 15.6 | 77 | 56.3 | 15.6 |
| CA125 (U/mL) | 279 | 444.8 | 751.5 | 77 | 341.6 | 690.3 |
| HE4 (pg/mL) | 279 | 28,051 | 107,318.9 | 77 | 15,987.4 | 35,499 |
| OPN (pg/mL) | 279 | 48,120.4 | 81,244.2 | 77 | 41,656.3 | 33,348.7 |
| PRL (pg/mL) | 279 | 47,622.9 | 78,443.3 | 77 | 25,950.3 | 36,547.4 |
| MIF (pg/mL) | 279 | 1788.2 | 2256.9 | 77 | 146.8 | 147.5 |
| Leptin (pg/mL) | 279 | 19,381.6 | 24,482.9 | 77 | 22,090.3 | 24,032.8 |
| Marker or Model | C-Index (95% CI) | Classification Cutoff | Accuracy | Sensitivity | Specificity | PPV | NPV |
|---|---|---|---|---|---|---|---|
| Age (years) | 0.76 (0.64–0.88) | 51.46 | 0.78 | 0.85 | 0.67 | 0.80 | 0.74 |
| CA125 (U/mL) | 0.87 (0.79–0.95) | 32.39 | 0.83 | 0.79 | 0.90 | 0.92 | 0.73 |
| OPN (pg/mL) | 0.81 (0.72–0.91) | 24,850.70 | 0.82 | 0.89 | 0.70 | 0.82 | 0.81 |
| HE4 (pg/mL) | 0.8 (0.72–0.89) | 2996.17 | 0.78 | 0.68 | 0.93 | 0.94 | 0.65 |
| Leptin (pg/mL) | 0.7 (0.58–0.82) | 16,428.78 | 0.70 | 0.70 | 0.70 | 0.79 | 0.60 |
| MIF (pg/mL) | 0.55 (0.42–0.68) | 95.17 | 0.58 | 0.55 | 0.63 | 0.70 | 0.48 |
| PRL (pg/mL) | 0.51 (0.38–0.64) | 5065.74 | 0.51 | 0.21 | 0.97 | 0.91 | 0.44 |
| Proteomic Model 2017 | 0.9 (0.82–0.97) | 0.69 | 0.86 | 0.81 | 0.93 | 0.95 | 0.76 |
| Proteomic Model 2021 | 0.82 (0.72–0.91) | 0.85 | 0.77 | 0.64 | 0.97 | 0.97 | 0.63 |
| Combined Model 2021 | 0.86 (0.78–0.95) | 0.69 | 0.86 | 0.83 | 0.90 | 0.93 | 0.77 |
| Full Combined Model 2021 | 0.89 (0.81–0.97) | 0.67 | 0.87 | 0.83 | 0.93 | 0.95 | 0.78 |
| ROMA-50 | 0.54 (0.38–0.69) | 24.45 | 0.71 | 0.74 | 0.67 | 0.78 | 0.62 |
| CPH-I | 0.92 (0.85–0.98) | −0.72 | 0.86 | 0.83 | 0.90 | 0.93 | 0.77 |
| Proteomic Model 2021 | Combined Model 2021 | Full Combined Model 2021 | ||||
|---|---|---|---|---|---|---|
| Age < 50 | Age ≥ 50 | Age < 50 | Age ≥ 50 | Age < 50 | Age ≥ 50 | |
| Patient number | 27 | 50 | 27 | 50 | 27 | 50 |
| C-index (95% CI) | 0.58 (0.23–0.93) | 0.95 (0.9–1.0) | 0.57 (0.22–0.92) | 0.95 (0.89–1.0) | 0.51 (0.17–0.86) | 0.96 (0.91–1.0) |
| Threshold | 0.18 | 0.34 | 0.09 | 0.57 | 0.17 | 0.59 |
| Overall accuracy | 0.81 | 0.92 | 0.81 | 0.94 | 0.78 | 0.96 |
| Sensitivity | 0.57 | 0.90 | 0.57 | 0.92 | 0.43 | 0.95 |
| Specificity | 0.90 | 1.00 | 0.90 | 1.00 | 0.90 | 1.00 |
| PPV | 0.67 | 1.00 | 0.67 | 1.00 | 0.60 | 1.00 |
| NPV | 0.86 | 0.71 | 0.86 | 0.77 | 0.82 | 0.83 |
| Proteomic Model 2021 | Combined Model 2021 | Full Combined Model 2021 | ||||
|---|---|---|---|---|---|---|
| Normal | Elevated | Normal | Elevated | Normal | Elevated | |
| Patient number | 38 | 39 | 38 | 39 | 38 | 39 |
| C-index (95% CI) | 0.51 (0.27–0.75) | 0.74 (0.43–1.0) | 0.59 (0.33–0.84) | 0.87 (0.73–1.0) | 0.67 (0.43–0.91) | 0.88 (0.71–1.0) |
| Threshold | 0.09 | 0.85 | 0.71 | 0.92 | 0.60 | 0.87 |
| Overall accuracy | 0.74 | 0.82 | 0.82 | 0.79 | 0.82 | 0.74 |
| Sensitivity | 0.36 | 0.83 | 0.45 | 0.78 | 0.55 | 0.72 |
| Specificity | 0.89 | 0.67 | 0.96 | 1.00 | 0.93 | 1.00 |
| PPV | 0.57 | 0.97 | 0.83 | 1.00 | 0.75 | 1.00 |
| NPV | 0.77 | 0.25 | 0.81 | 0.27 | 0.83 | 0.23 |
Publisher’s Note: MDPI stays neutral with regard to jurisdictional claims in published maps and institutional affiliations. |
© 2022 by the authors. Licensee MDPI, Basel, Switzerland. This article is an open access article distributed under the terms and conditions of the Creative Commons Attribution (CC BY) license (https://creativecommons.org/licenses/by/4.0/).
Share and Cite
Watrowski, R.; Obermayr, E.; Wallisch, C.; Aust, S.; Concin, N.; Braicu, E.I.; Van Gorp, T.; Hasenburg, A.; Sehouli, J.; Vergote, I.; et al. Biomarker-Based Models for Preoperative Assessment of Adnexal Mass: A Multicenter Validation Study. Cancers 2022, 14, 1780. https://0-doi-org.brum.beds.ac.uk/10.3390/cancers14071780
Watrowski R, Obermayr E, Wallisch C, Aust S, Concin N, Braicu EI, Van Gorp T, Hasenburg A, Sehouli J, Vergote I, et al. Biomarker-Based Models for Preoperative Assessment of Adnexal Mass: A Multicenter Validation Study. Cancers. 2022; 14(7):1780. https://0-doi-org.brum.beds.ac.uk/10.3390/cancers14071780
Chicago/Turabian StyleWatrowski, Rafał, Eva Obermayr, Christine Wallisch, Stefanie Aust, Nicole Concin, Elena Ioana Braicu, Toon Van Gorp, Annette Hasenburg, Jalid Sehouli, Ignace Vergote, and et al. 2022. "Biomarker-Based Models for Preoperative Assessment of Adnexal Mass: A Multicenter Validation Study" Cancers 14, no. 7: 1780. https://0-doi-org.brum.beds.ac.uk/10.3390/cancers14071780