
RB1-Negative Retinal Organoids Display Proliferation of Cone Photoreceptors and Loss of Retinal Differentiation

 , , and
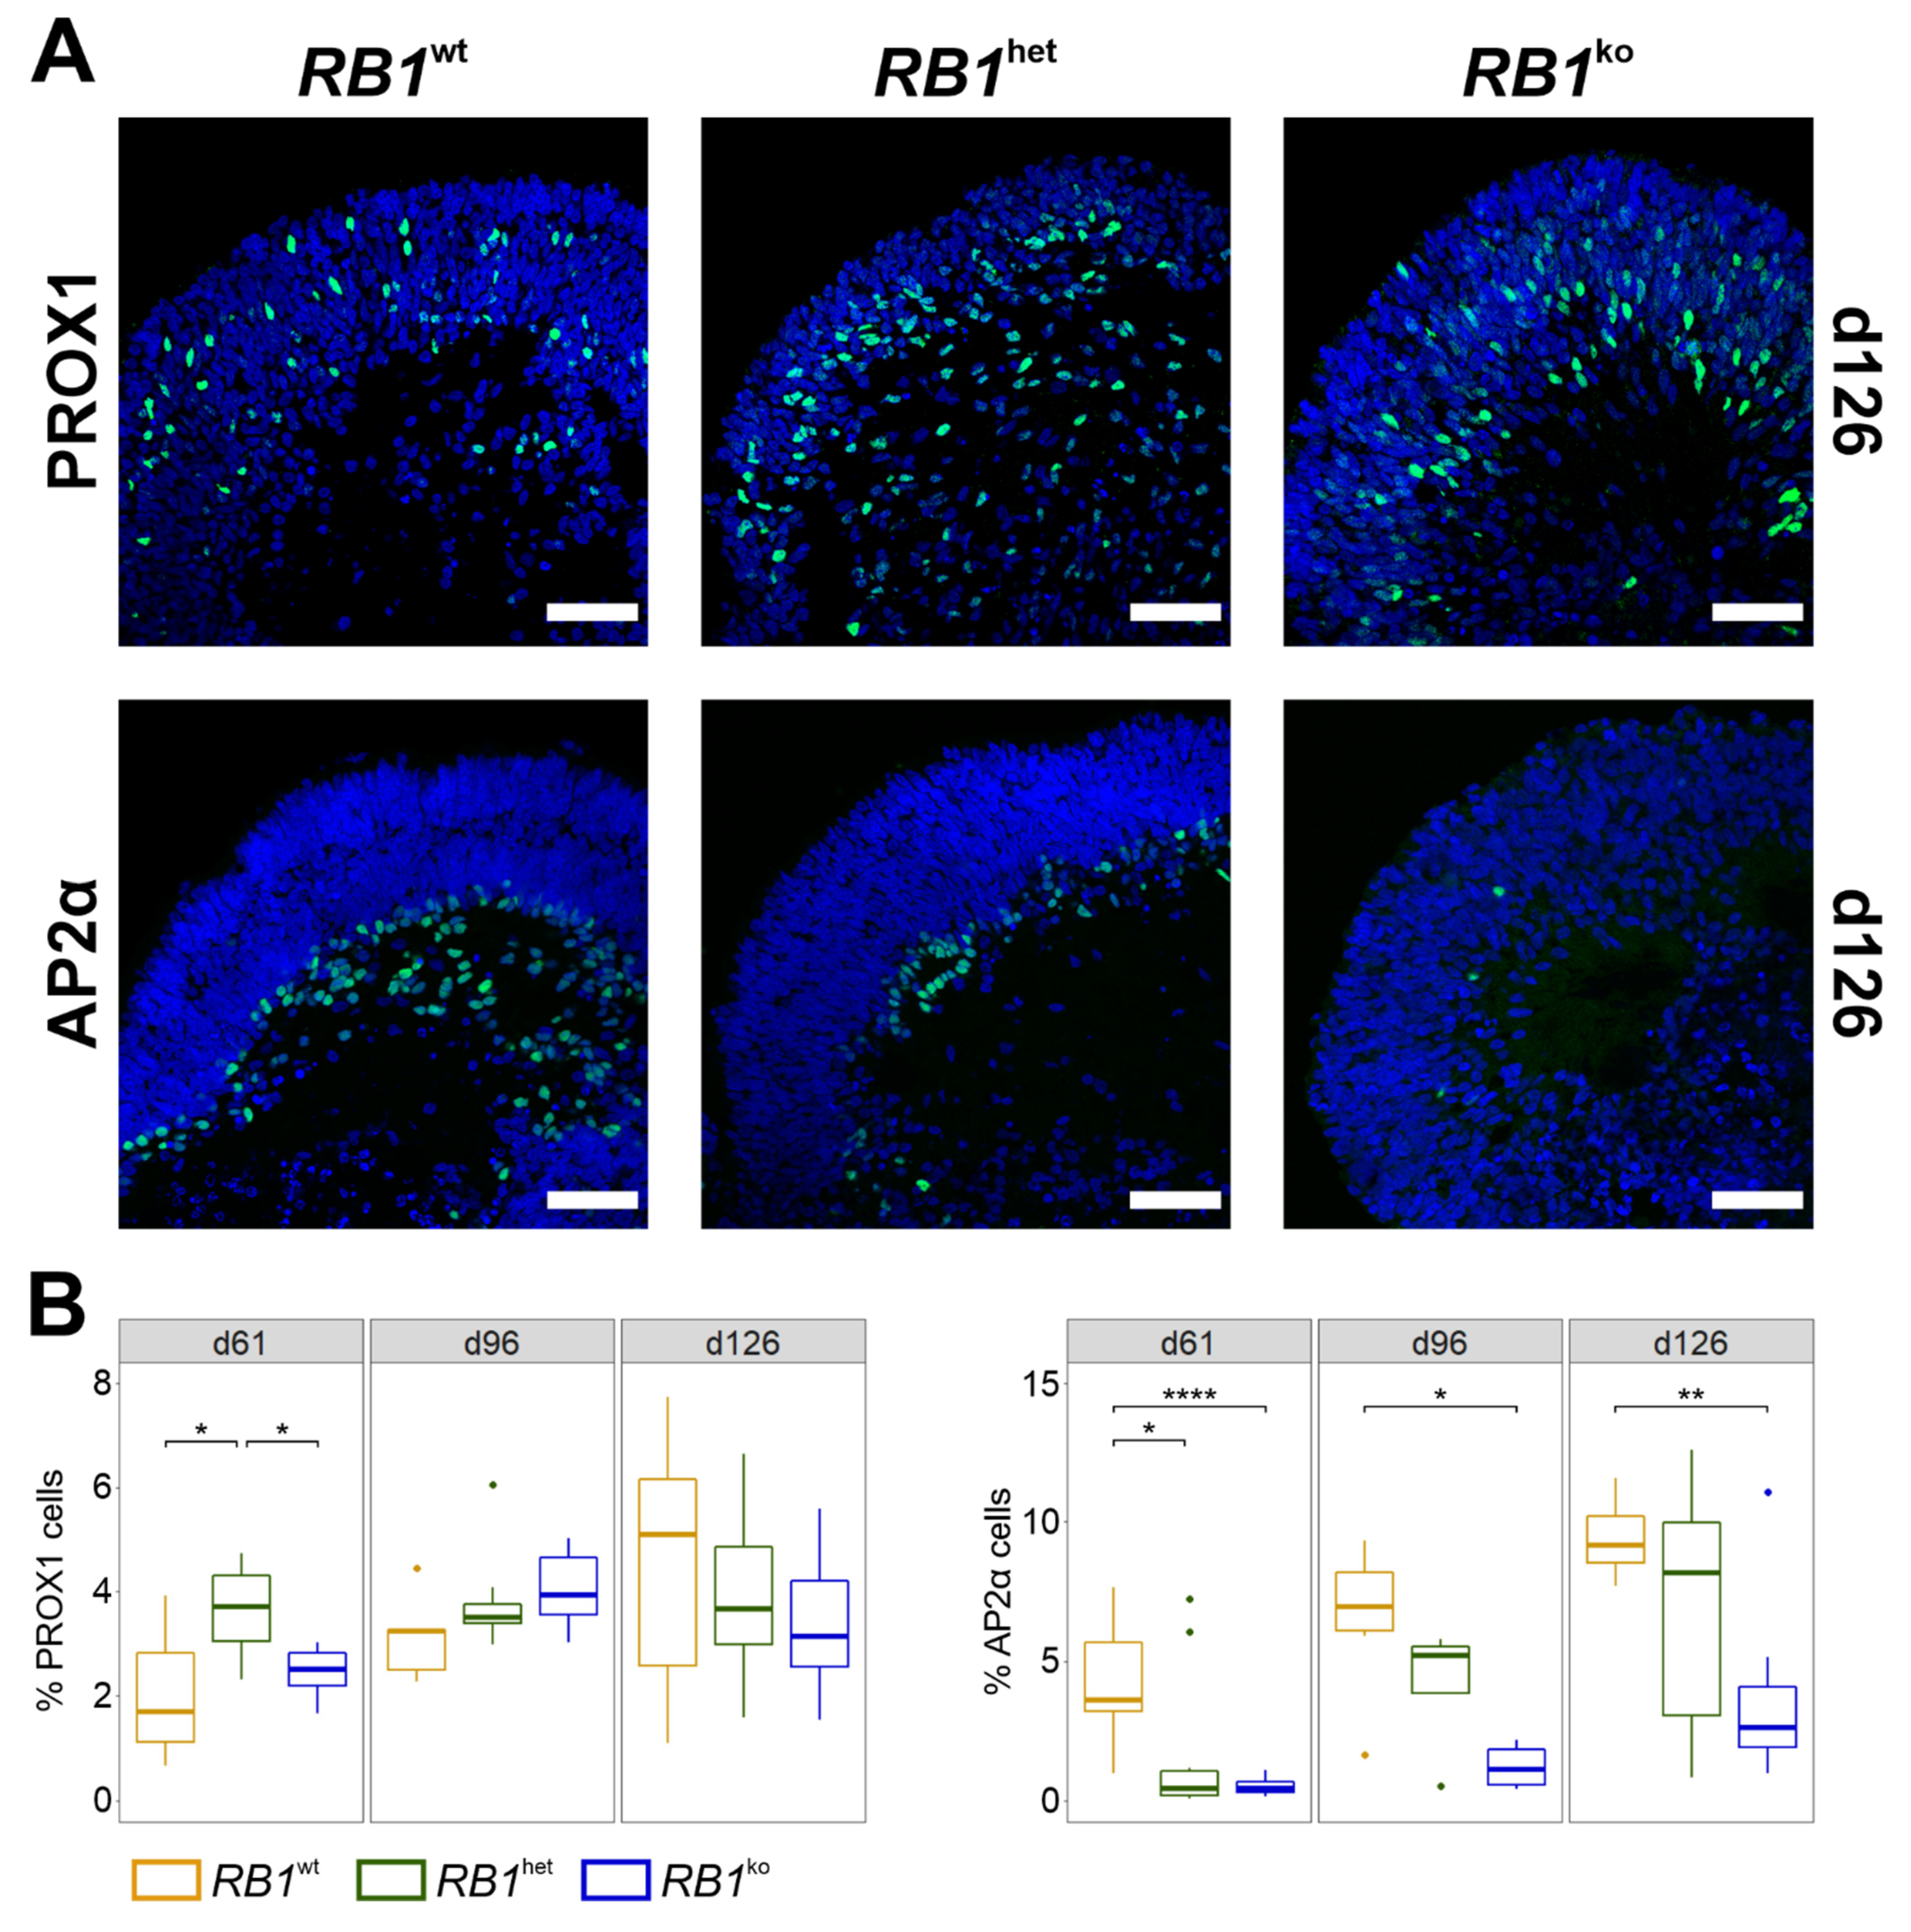
Abstract
:Simple Summary
Abstract
1. Introduction
2. Materials and Methods
2.1. Human Embryonic Stem Cells and Tumor Specimens
2.2. Generation and Cultivation of hESCs
2.3. Differentiation of hESCs into Neural Retina
2.4. Cryosectioning and Immunofluorescent Staining of 3D Organoids and Quantification
2.5. RNA-seq
3. Results
3.1. Differentiation into Neural Retina Is Impaired in RB1ko
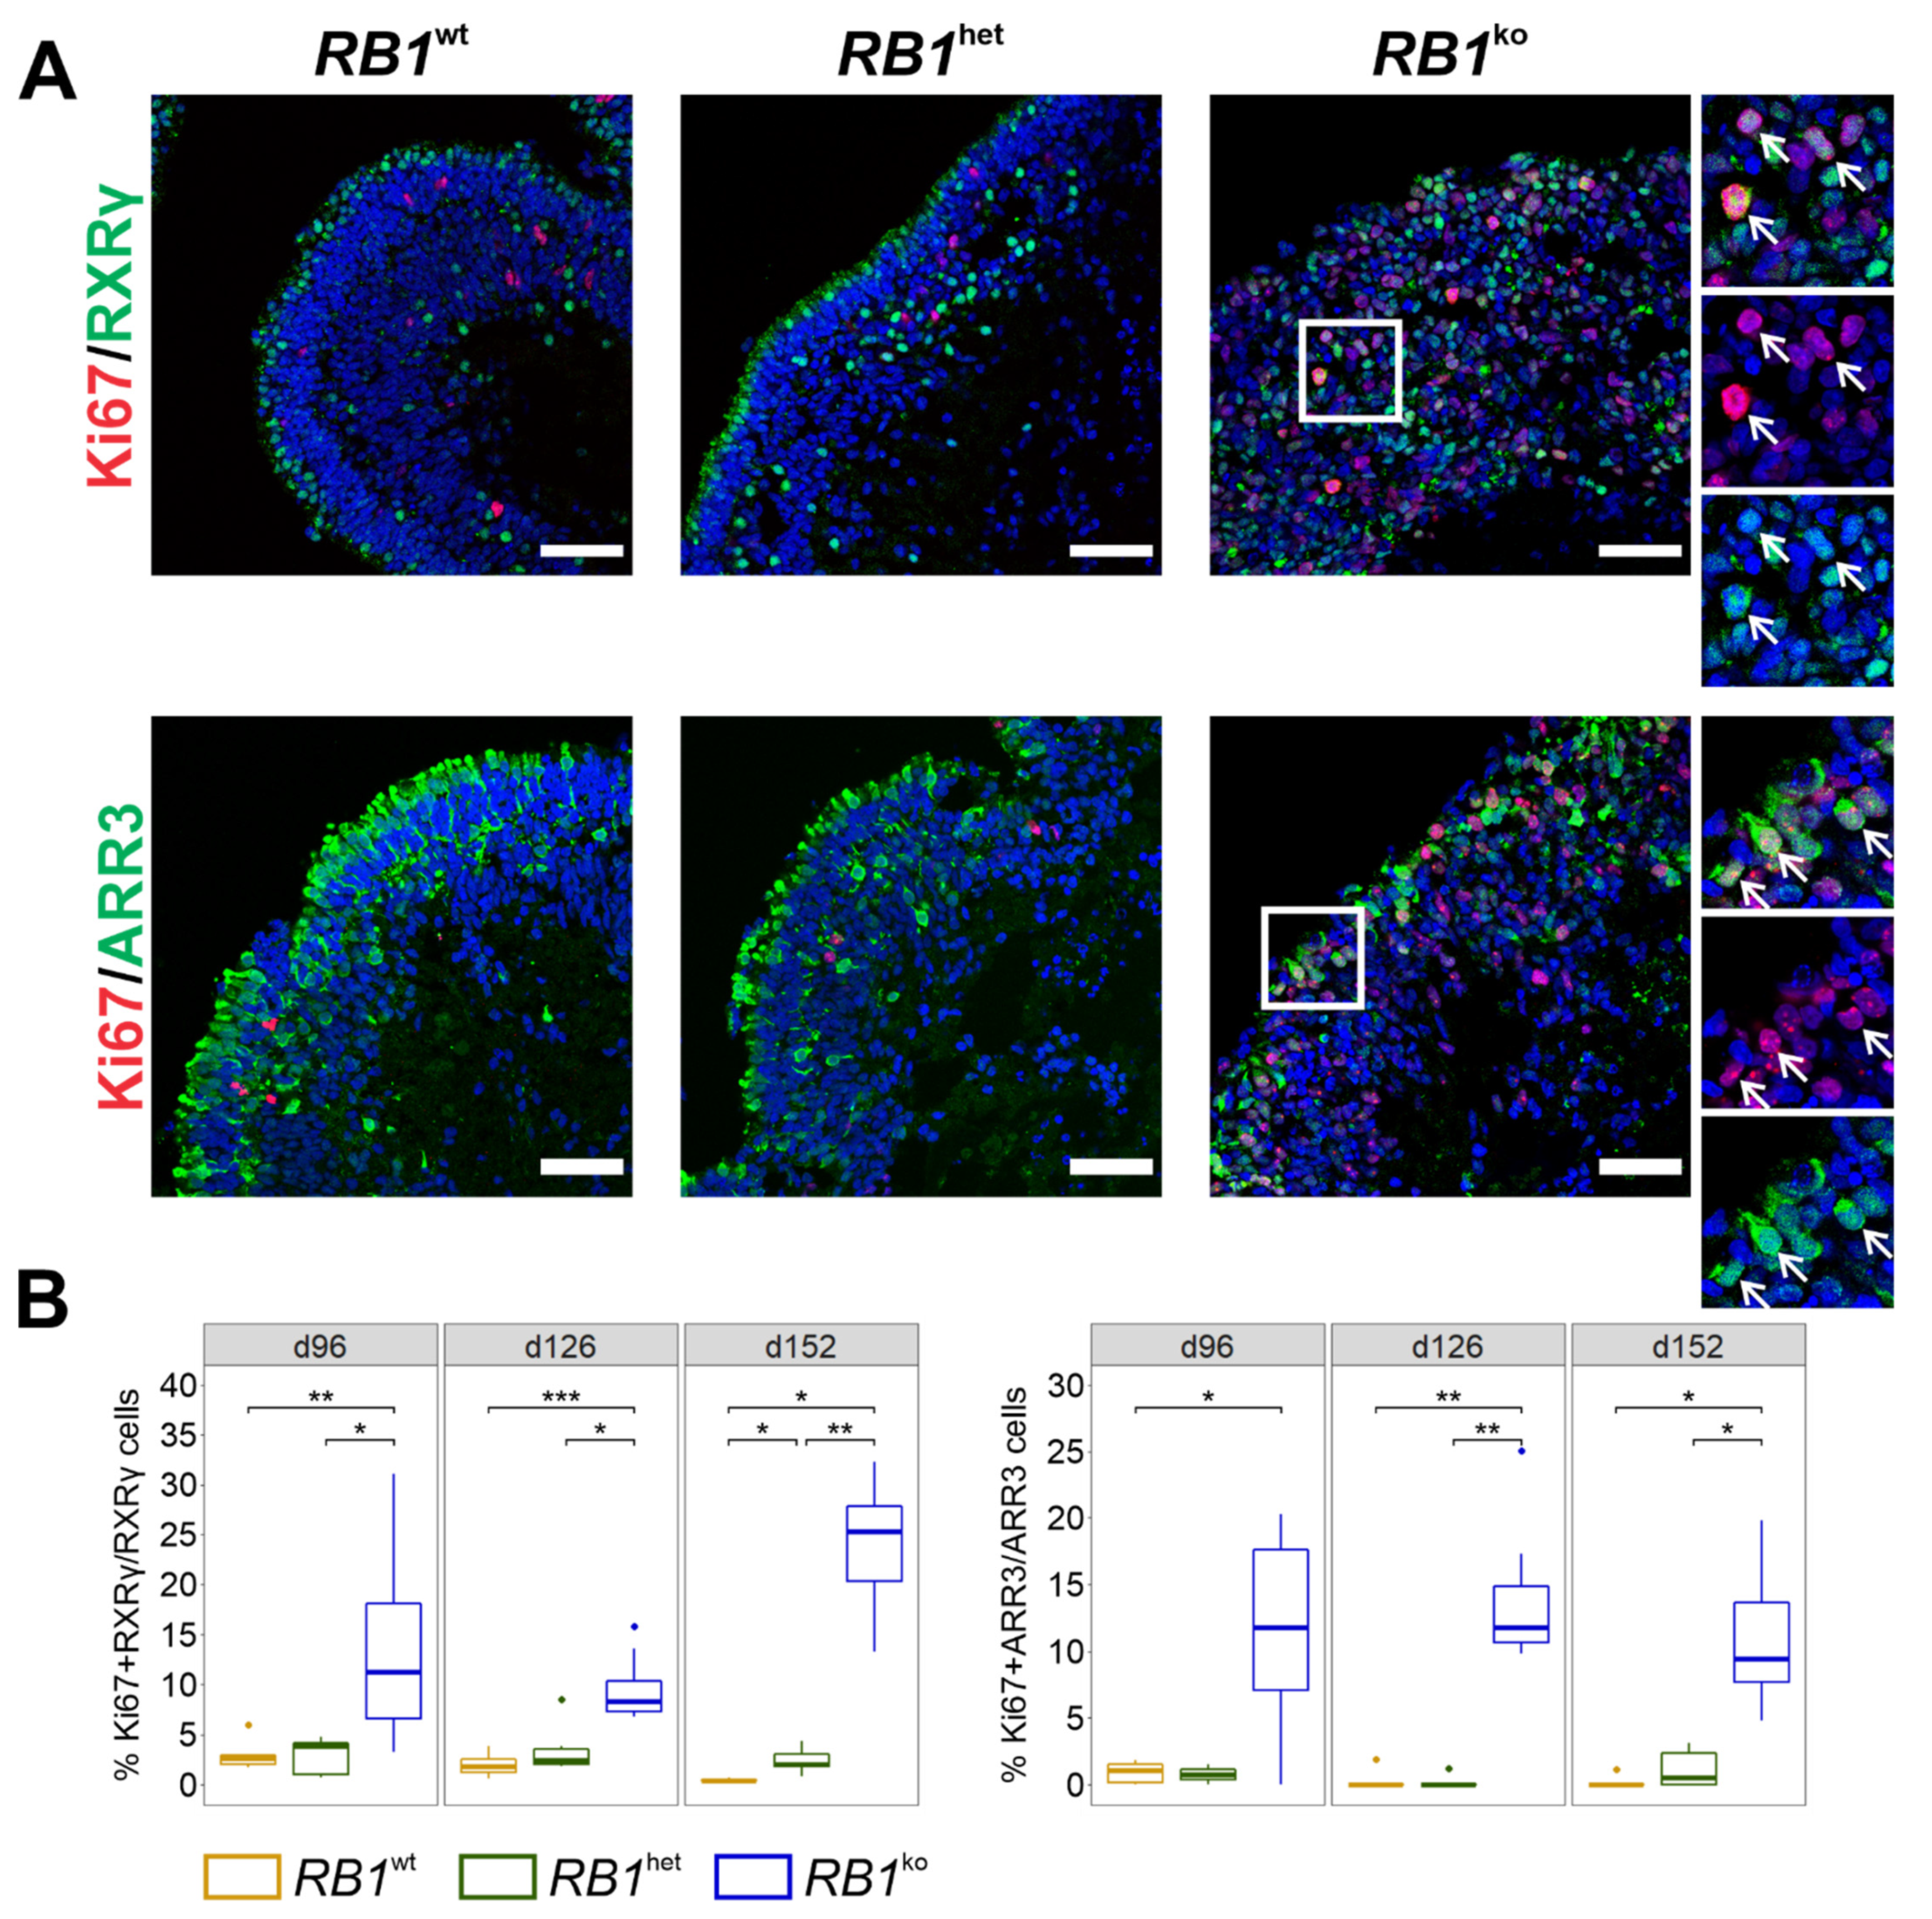
3.2. Persistent Proliferation in RB1ko
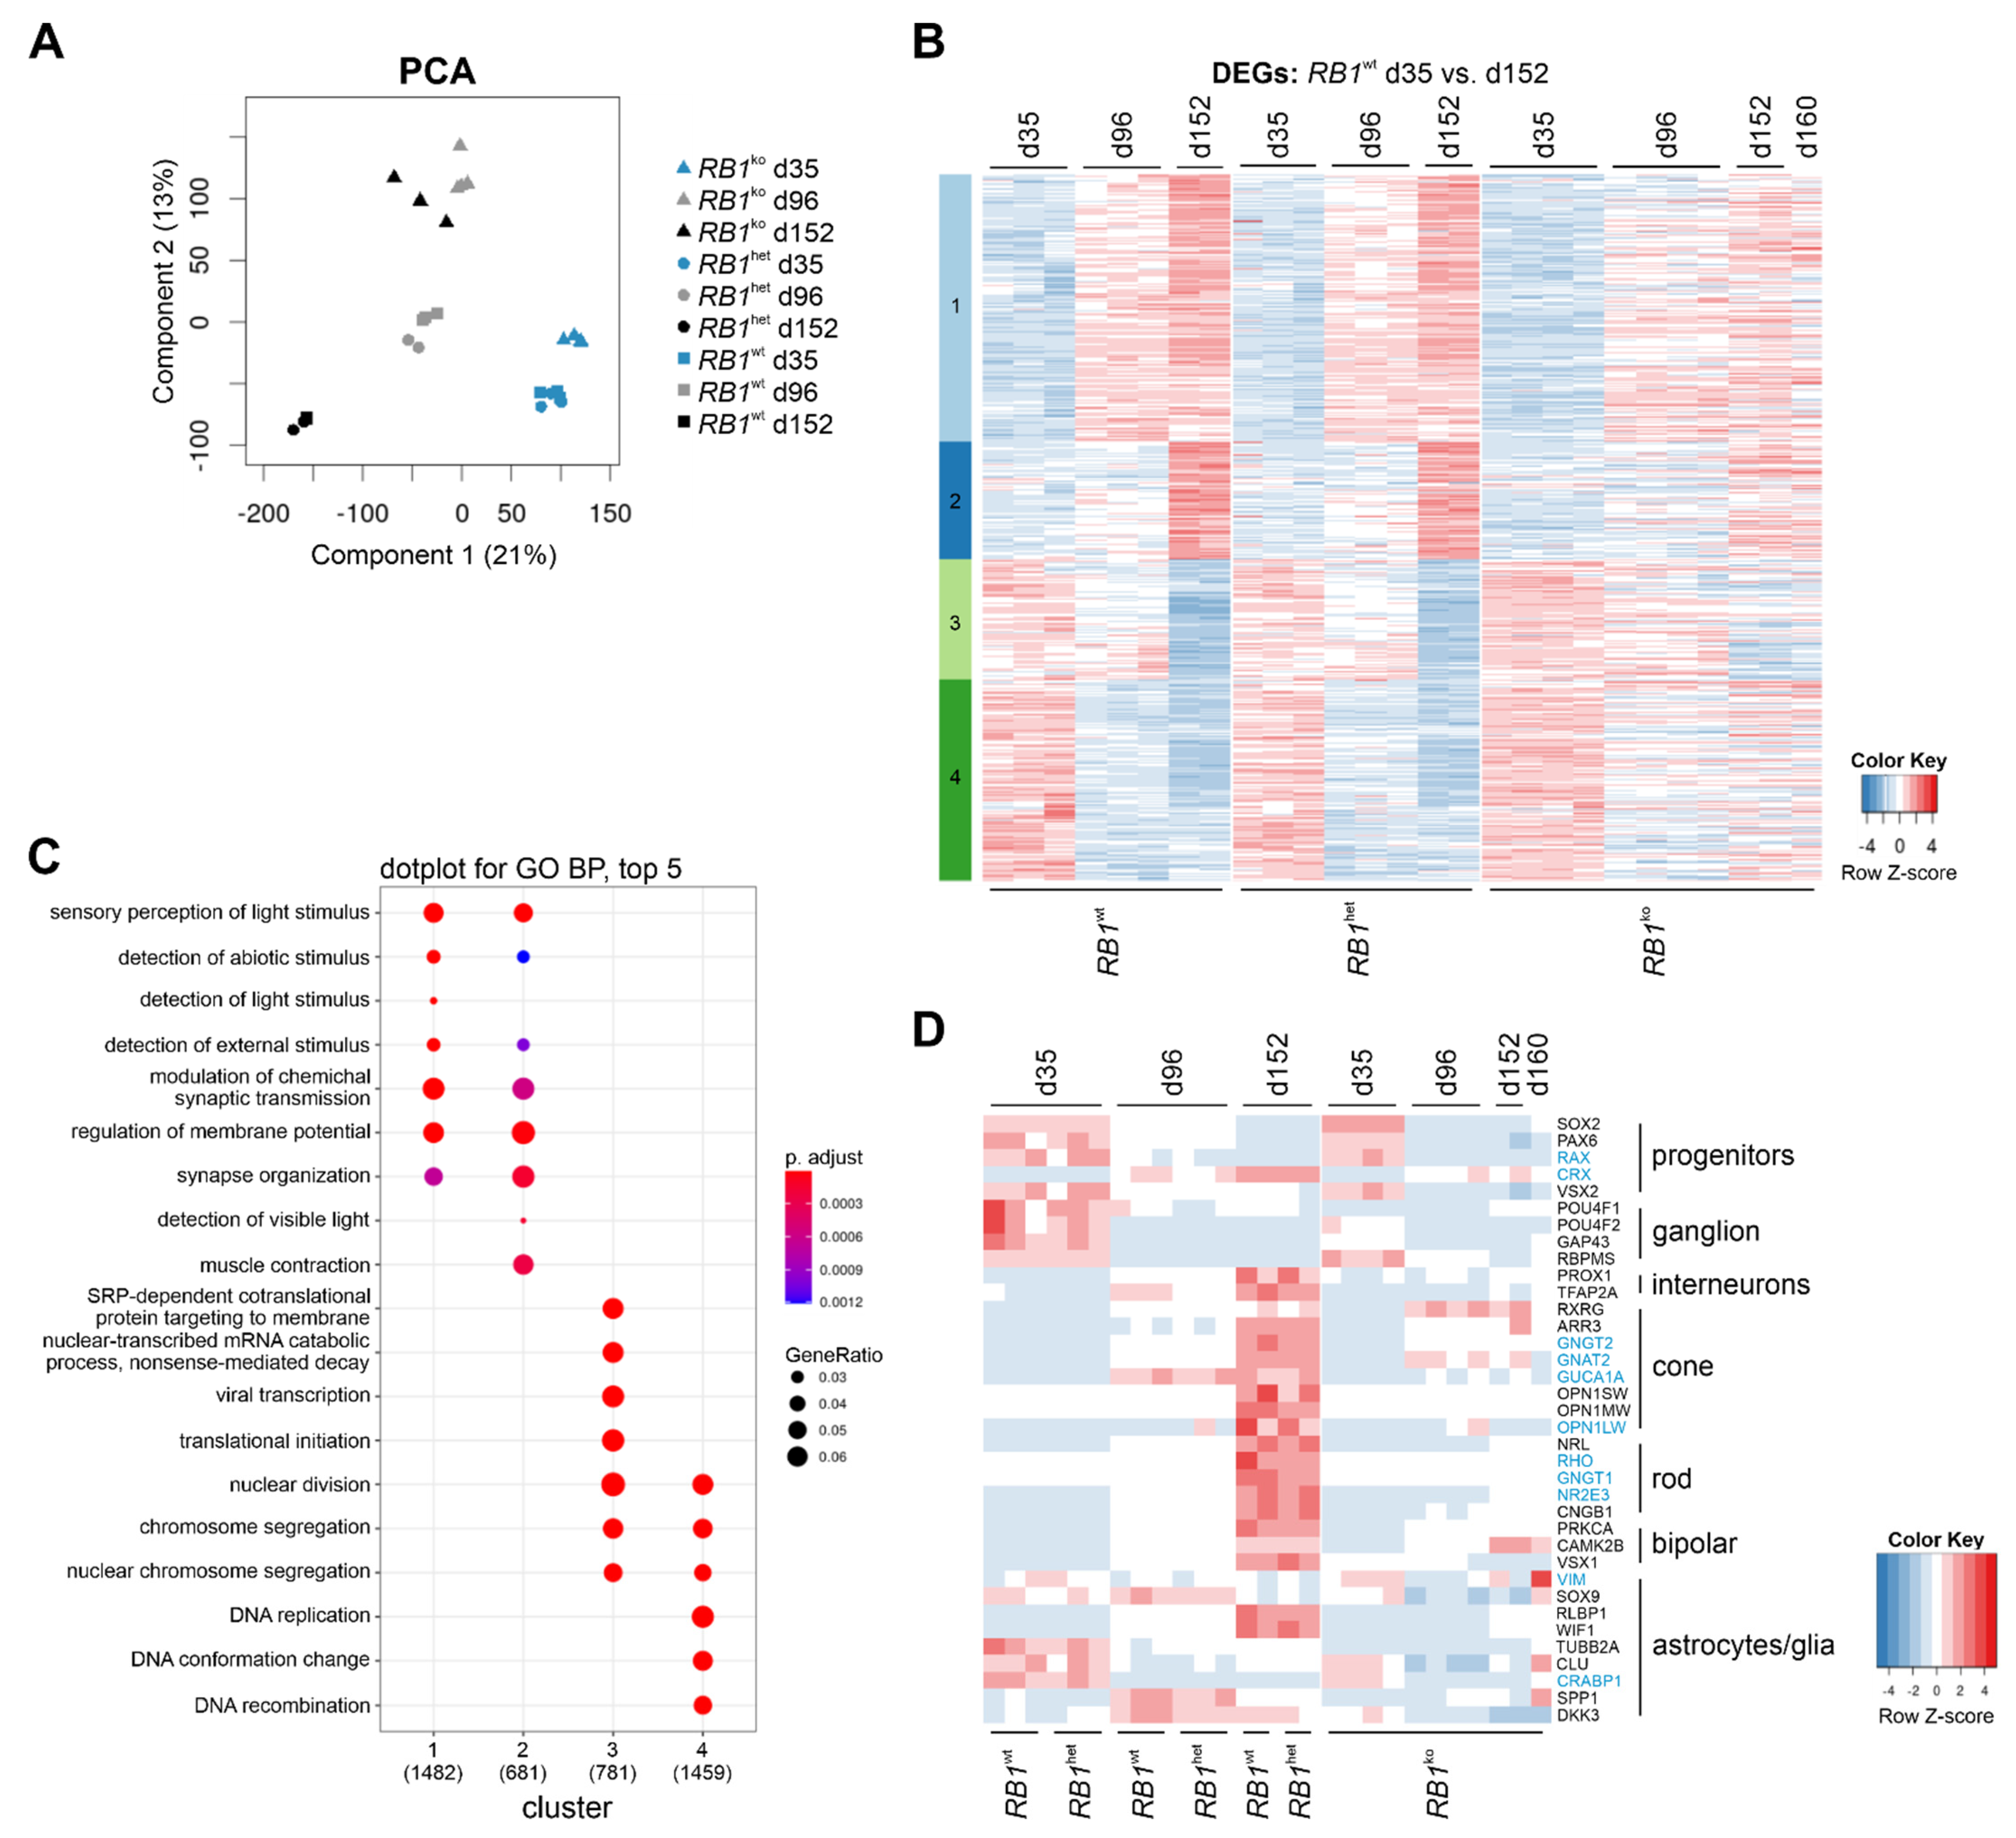
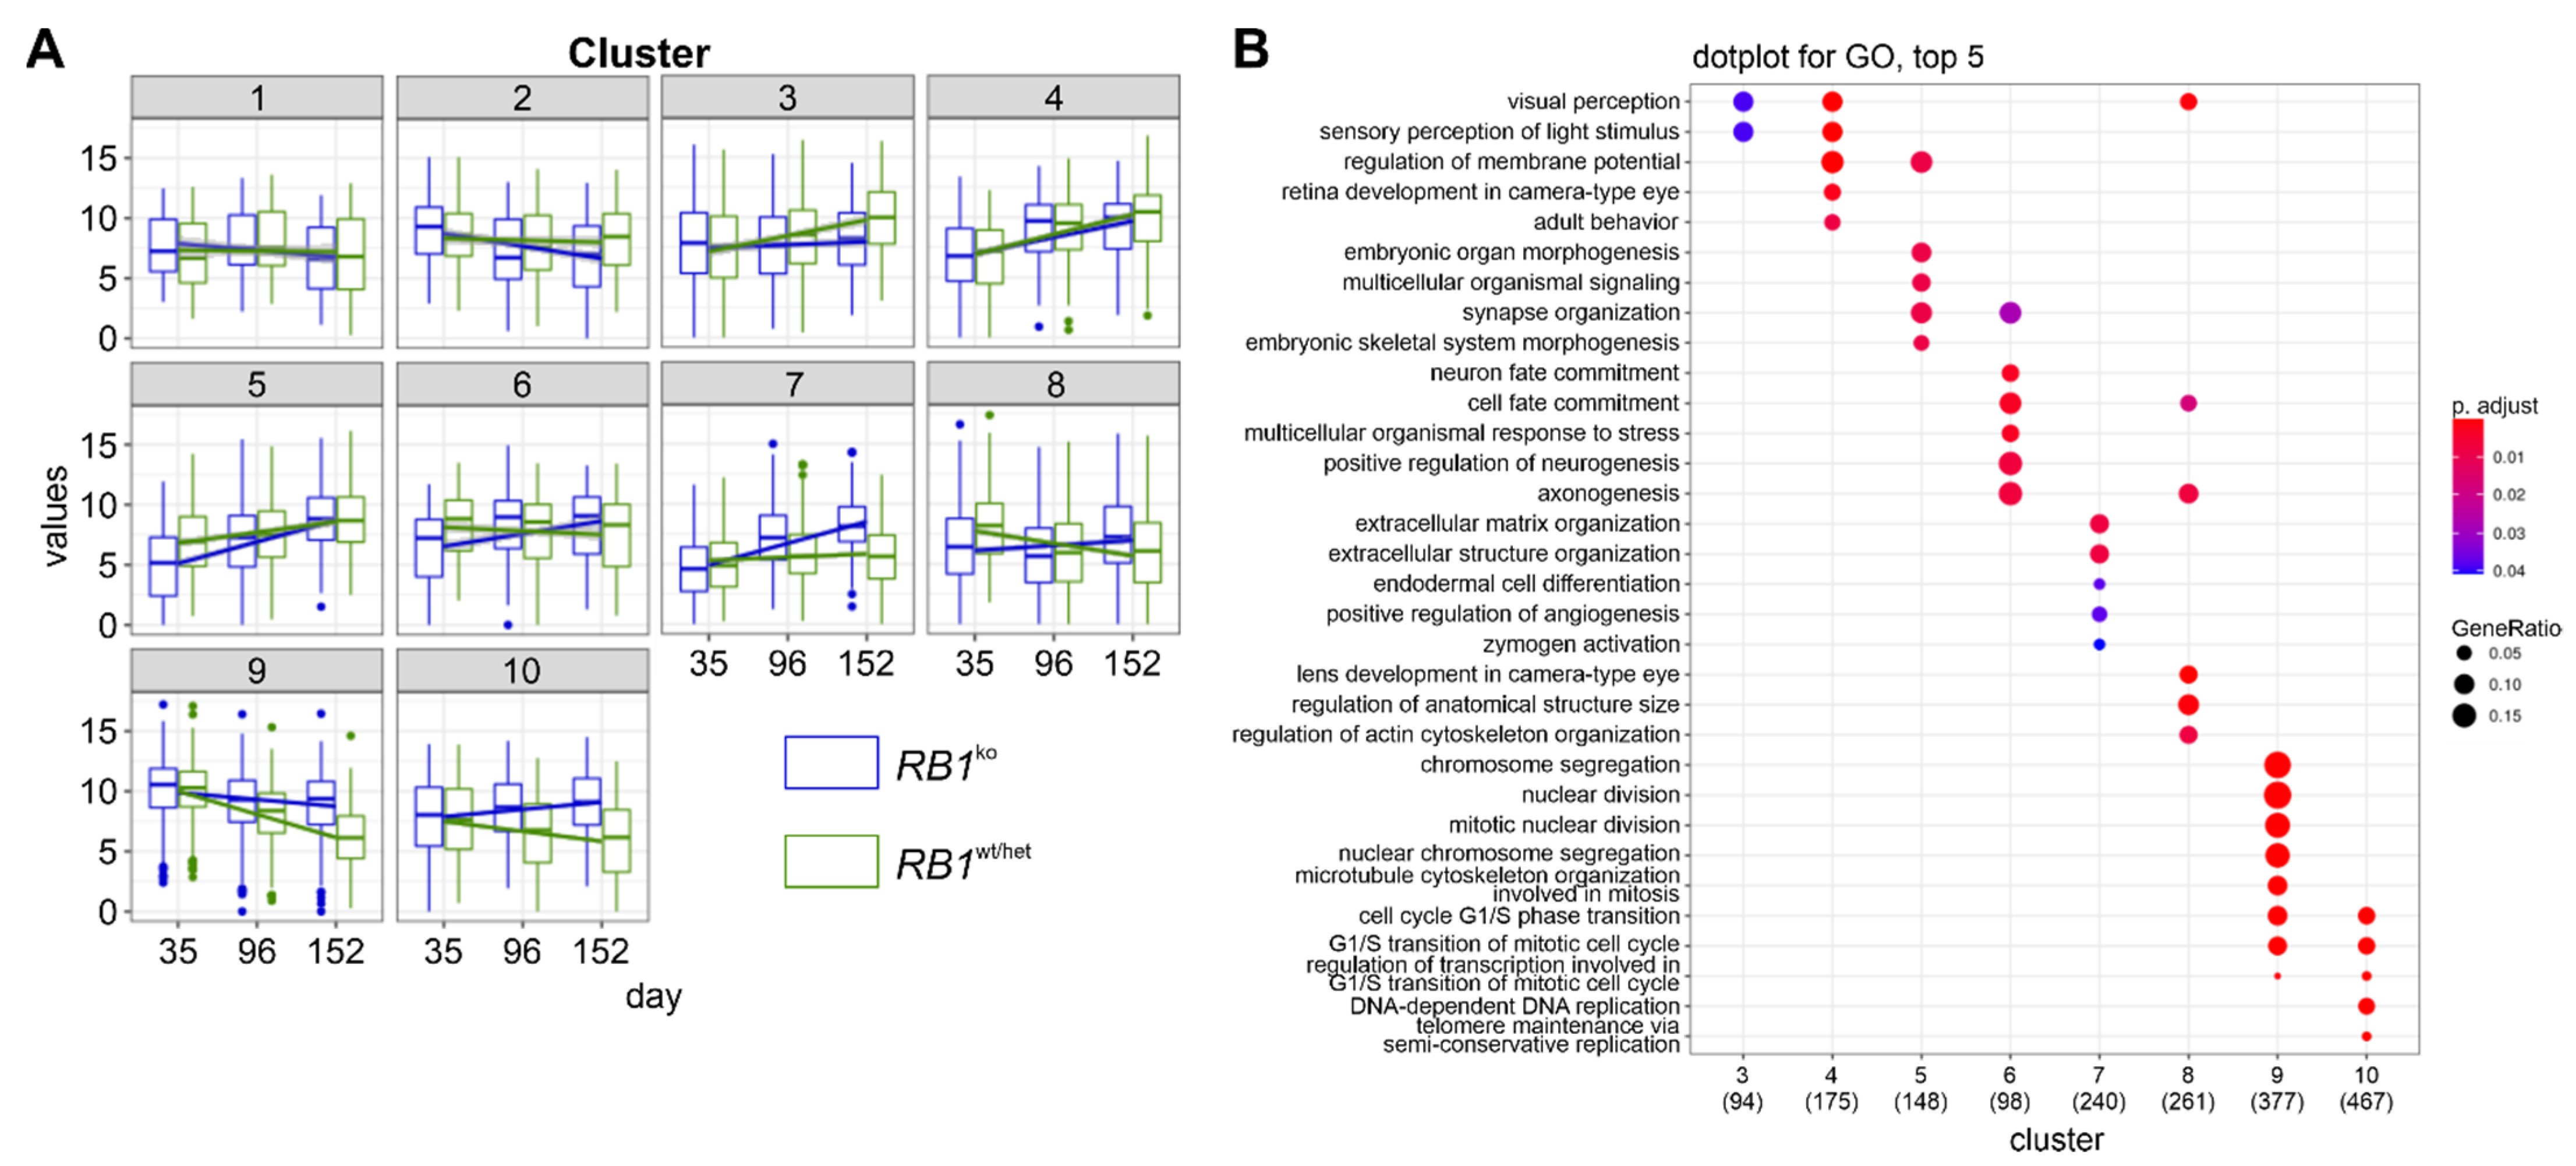
3.3. RNA-seq Confirmed Aberrant Retinal Differentiation and Proliferation in RB1ko
3.4. RB1ko Organoids Gain Retinoblastoma Expression Signature
4. Discussion
5. Conclusions
Supplementary Materials
Author Contributions
Funding
Institutional Review Board Statement
Informed Consent Statement
Data Availability Statement
Acknowledgments
Conflicts of Interest
References
- Gröbner, S.N.; Worst, B.C.; Weischenfeldt, J.; Buchhalter, I.; Kleinheinz, K.; Rudneva, V.A.; Johann, P.D.; Balasubramanian, G.P.; Segura-Wang, M.; Brabetz, S.; et al. The landscape of genomic alterations across childhood cancers. Nature 2018, 555, 321–327. [Google Scholar] [CrossRef] [PubMed] [Green Version]
- Kooi, I.E.; Mol, B.M.; Massink, M.P.; Ameziane, N.; Meijers-Heijboer, H.; Dommering, C.J.; van Mil, S.E.; de Vries, Y.; van der Hout, A.H.; Kaspers, G.J.; et al. Somatic genomic alterations in retinoblastoma beyond RB1 are rare and limited to copy number changes. Sci. Rep. 2016, 6, 25264. [Google Scholar] [CrossRef] [PubMed] [Green Version]
- Zhang, J.; Benavente, C.A.; McEvoy, J.; Flores-Otero, J.; Ding, L.; Chen, X.; Ulyanov, A.; Wu, G.; Wilson, M.; Wang, J.; et al. A novel retinoblastoma therapy from genomic and epigenetic analyses. Nature 2012, 481, 329–334. [Google Scholar] [CrossRef] [PubMed]
- Rushlow, D.E.; Mol, B.M.; Kennett, J.Y.; Yee, S.; Pajovic, S.; Thériault, B.L.; Prigoda-Lee, N.L.; Spencer, C.; Dimaras, H.; Corson, T.W.; et al. Characterisation of retinoblastomas without RB1 mutations: Genomic, gene expression, and clinical studies. Lancet Oncol. 2013, 14, 327–334. [Google Scholar] [CrossRef] [Green Version]
- Ganguly, A.; Shields, C.L. Differential gene expression profile of retinoblastoma compared to normal retina. Mol. Vis. 2010, 16, 1292–1303. [Google Scholar] [PubMed]
- Kapatai, G.; Brundler, M.A.; Jenkinson, H.; Kearns, P.; Parulekar, M.; Peet, A.C.; McConville, C.M. Gene expression profiling identifies different sub-types of retinoblastoma. Br. J. Cancer 2013, 109, 512–525. [Google Scholar] [CrossRef] [Green Version]
- Kooi, I.E.; Mol, B.M.; Moll, A.C.; van der Valk, P.; de Jong, M.C.; de Graaf, P.; van Mil, S.E.; Schouten-van Meeteren, A.Y.; Meijers-Heijboer, H.; Kaspers, G.L.; et al. Loss of photoreceptorness and gain of genomic alterations in retinoblastoma reveal tumor progression. EBioMedicine 2015, 2, 660–670. [Google Scholar] [CrossRef] [Green Version]
- McEvoy, J.; Flores-Otero, J.; Zhang, J.; Nemeth, K.; Brennan, R.; Bradley, C.; Krafcik, F.; Rodriguez-Galindo, C.; Wilson, M.; Xiong, S.; et al. Coexpression of normally incompatible developmental pathways in retinoblastoma genesis. Cancer Cell 2011, 20, 260–275. [Google Scholar] [CrossRef] [Green Version]
- Schwermer, M.; Dreesmann, S.; Eggert, A.; Althoff, K.; Steenpass, L.; Schramm, A.; Schulte, J.H.; Temming, P. Pharmaceutically inhibiting polo-like kinase 1 exerts a broad anti-tumour activity in retinoblastoma cell lines. Clin. Exp. Ophthalmol. 2017, 45, 288–296. [Google Scholar] [CrossRef]
- Schwermer, M.; Hiber, M.; Dreesmann, S.; Rieb, A.; Theißen, J.; Herold, T.; Schramm, A.; Temming, P.; Steenpass, L. Comprehensive characterization of RB1 mutant and MYCN amplified retinoblastoma cell lines. Exp. Cell Res. 2019, 375, 92–99. [Google Scholar] [CrossRef]
- Cobrinik, D. Learning About Retinoblastoma from Mouse Models That Missed. In Animal Models of Brain Tumors; Martínez Murillo, R., Martínez, A., Eds.; Neuromethods; Humana Press: Totowa, NJ, USA, 2012; Volume 77. [Google Scholar] [CrossRef]
- Chen, D.; Livne-bar, I.; Vanderluit, J.L.; Slack, R.S.; Agochiya, M.; Bremner, R. Cell-specific effects of RB or RB/p107 loss on retinal development implicate an intrinsically death-resistant cell-of-origin in retinoblastoma. Cancer Cell 2004, 5, 539–551. [Google Scholar] [CrossRef] [PubMed] [Green Version]
- MacPherson, D.; Sage, J.; Kim, T.; Ho, D.; McLaughlin, M.E.; Jacks, T. Cell type-specific effects of Rb deletion in the murine retina. Genes Dev. 2004, 18, 1681–1694. [Google Scholar] [CrossRef] [PubMed] [Green Version]
- Zhang, J.; Gray, J.; Wu, L.; Leone, G.; Rowan, S.; Cepko, C.L.; Zhu, X.; Craft, C.M.; Dyer, M.A. Rb regulates proliferation and rod photoreceptor development in the mouse retina. Nat. Genet. 2004, 36, 351–360. [Google Scholar] [CrossRef]
- Xu, X.L.; Fang, Y.; Lee, T.C.; Forrest, D.; Gregory-Evans, C.; Almeida, D.; Liu, A.; Jhanwar, S.C.; Abramson, D.H.; Cobrinik, D. Retinoblastoma has properties of a cone precursor tumor and depends upon cone-specific MDM2 signaling. Cell 2009, 137, 1018–1031. [Google Scholar] [CrossRef] [Green Version]
- Singh, H.P.; Wang, S.; Stachelek, K.; Lee, S.; Reid, M.W.; Thornton, M.E.; Craft, C.M.; Grubbs, B.H.; Cobrinik, D. Developmental stage-specific proliferation and retinoblastoma genesis in RB-deficient human but not mouse cone precursors. Proc. Natl. Acad. Sci. USA 2018, 115, E9391–E9400. [Google Scholar] [CrossRef] [Green Version]
- Xu, X.L.; Singh, H.P.; Wang, L.; Qi, D.L.; Poulos, B.K.; Abramson, D.H.; Jhanwar, S.C.; Cobrinik, D. Rb suppresses human cone-precursor-derived retinoblastoma tumours. Nature 2014, 514, 385–388. [Google Scholar] [CrossRef] [Green Version]
- Browne, A.W.; Arnesano, C.; Harutyunyan, N.; Khuu, T.; Martinez, J.C.; Pollack, H.A.; Koos, D.S.; Lee, T.C.; Fraser, S.E.; Moats, R.A.; et al. Structural and Functional Characterization of Human Stem-Cell-Derived Retinal Organoids by Live Imaging. Investig. Ophthalmol. Vis. Sci. 2017, 58, 3311–3318. [Google Scholar] [CrossRef]
- Capowski, E.E.; Samimi, K.; Mayerl, S.J.; Phillips, M.J.; Pinilla, I.; Howden, S.E.; Saha, J.; Jansen, A.D.; Edwards, K.L.; Jager, L.D.; et al. Reproducibility and staging of 3D human retinal organoids across multiple pluripotent stem cell lines. Development 2019, 146, dev171686. [Google Scholar] [CrossRef] [Green Version]
- Kuwahara, A.; Ozone, C.; Nakano, T.; Saito, K.; Eiraku, M.; Sasai, Y. Generation of a ciliary margin-like stem cell niche from self-organizing human retinal tissue. Nat. Commun. 2015, 6, 6286. [Google Scholar] [CrossRef] [Green Version]
- Llonch, S.; Carido, M.; Ader, M. Organoid technology for retinal repair. Dev. Biol. 2018, 433, 132–143. [Google Scholar] [CrossRef]
- Nakano, T.; Ando, S.; Takata, N.; Kawada, M.; Muguruma, K.; Sekiguchi, K.; Saito, K.; Yonemura, S.; Eiraku, M.; Sasai, Y. Self-formation of optic cups and storable stratified neural retina from human ESCs. Cell Stem Cell 2012, 10, 771–785. [Google Scholar] [CrossRef] [PubMed] [Green Version]
- Zhong, X.; Gutierrez, C.; Xue, T.; Hampton, C.; Vergara, M.N.; Cao, L.H.; Peters, A.; Park, T.S.; Zambidis, E.T.; Meyer, J.S.; et al. Generation of three-dimensional retinal tissue with functional photoreceptors from human iPSCs. Nat. Commun. 2014, 5, 4047. [Google Scholar] [CrossRef] [PubMed] [Green Version]
- Cowan, C.S.; Renner, M.; De Gennaro, M.; Gross-Scherf, B.; Goldblum, D.; Hou, Y.; Munz, M.; Rodrigues, T.M.; Krol, J.; Szikra, T.; et al. Cell Types of the Human Retina and Its Organoids at Single-Cell Resolution. Cell 2020, 182, 1623–1640.e34. [Google Scholar] [CrossRef] [PubMed]
- Liu, H.; Zhang, Y.; Zhang, Y.Y.; Li, Y.P.; Hua, Z.Q.; Zhang, C.J.; Wu, K.C.; Yu, F.; Zhang, Y.; Su, J.; et al. Human embryonic stem cell-derived organoid retinoblastoma reveals a cancerous origin. Proc. Natl. Acad. Sci. USA 2020, 117, 33628–33638. [Google Scholar] [CrossRef]
- Norrie, J.L.; Nityanandam, A.; Lai, K.; Chen, X.; Wilson, M.; Stewart, E.; Griffiths, L.; Jin, H.; Wu, G.; Orr, B.; et al. Retinoblastoma from human stem cell-derived retinal organoids. Nat. Commun. 2021, 12, 4535. [Google Scholar] [CrossRef]
- Rozanska, A.; Cerna-Chavez, R.; Queen, R.; Collin, J.; Zerti, D.; Dorgau, B.; Beh, C.S.; Davey, T.; Coxhead, J.; Hussain, R.; et al. pRB-Depleted Pluripotent Stem Cell Retinal Organoids Recapitulate Cell State Transitions of Retinoblastoma Development and Suggest an Important Role for pRB in Retinal Cell Differentiation. Stem Cells Transl. Med. 2022. Online ahead of print. [Google Scholar] [CrossRef]
- Zheng, C.; Schneider, J.W.; Hsieh, J. Role of RB1 in human embryonic stem cell-derived retinal organoids. Dev. Biol. 2020, 462, 197–207. [Google Scholar] [CrossRef]
- Schipper, L.; Kanber, D.; Steenpass, L. Generation of heterozygous and homozygous hESC H9 sublines carrying inactivating mutations in RB1. Stem Cell Res. 2018, 33, 41–45. [Google Scholar] [CrossRef]
- Döpper, H.; Horstmann, M.; Menges, J.; Bozet, M.; Kanber, D.; Steenpass, L. Biallelic and monoallelic deletion of the RB1 promoter in six isogenic clonal H9 hESC lines. Stem Cell Res. 2020, 45, 101779. [Google Scholar] [CrossRef]
- Döpper, H.; Menges, J.; Bozet, M.; Brenzel, A.; Lohmann, D.; Steenpass, L.; Kanber, D. Differentiation Protocol for 3D Retinal Organoids, Immunostaining and Signal Quantitation. Curr. Protoc. Stem Cell Biol. 2020, 55, e120. [Google Scholar] [CrossRef]
- Anders, S.; Pyl, P.T.; Huber, W. HTSeq—A Python framework to work with high-throughput sequencing data. Bioinformatics 2015, 31, 166–169. [Google Scholar] [CrossRef] [PubMed]
- Dobin, A.; Davis, C.A.; Schlesinger, F.; Drenkow, J.; Zaleski, C.; Jha, S.; Batut, P.; Chaisson, M.; Gingeras, T.R. STAR: Ultrafast universal RNA-Seq aligner. Bioinformatics 2013, 29, 15–21. [Google Scholar] [CrossRef] [PubMed]
- Li, H.; Handsaker, B.; Wysoker, A.; Fennell, T.; Ruan, J.; Homer, N.; Marth, G.; Abecasis, G.; Durbin, R. 1000 Genome Project Data Processing Subgroup. The Sequence Alignment/Map format and SAMtools. Bioinformatics 2009, 25, 2078–2079. [Google Scholar] [CrossRef] [PubMed] [Green Version]
- Love, M.I.; Huber, W.; Anders, S. Moderated estimation of fold change and dispersion for RNA-Seq data with DESeq2. Genome Biol. 2014, 15, 550. [Google Scholar] [CrossRef] [Green Version]
- Yu, G.; Wang, L.G.; Han, Y.; He, Q.Y. ClusterProfiler: An R package for comparing biological themes among gene clusters. Omics 2012, 16, 284–287. [Google Scholar] [CrossRef]
- Yu, G.; Li, F.; Qin, Y.; Bo, X.; Wu, Y.; Wang, S. GOSemSim: An R package for measuring semantic similarity among GO terms and gene products. Bioinformatics 2010, 26, 976–978. [Google Scholar] [CrossRef]
- Subramanian, A.; Tamayo, P.; Mootha, V.K.; Mukherjee, S.; Ebert, B.L.; Gillette, M.A.; Paulovich, A.; Pomeroy, S.L.; Golub, T.R.; Lander, E.S.; et al. Gene set enrichment analysis: A knowledge-based approach for interpreting genome-wide expression profiles. Proc. Natl. Acad. Sci. USA 2005, 102, 15545–15550. [Google Scholar] [CrossRef] [Green Version]
- Kaya, K.D.; Chen, H.Y.; Brooks, M.J.; Kelley, R.A.; Shimada, H.; Nagashima, K.; de Val, N.; Drinnan, C.T.; Gieser, L.; Kruczek, K.; et al. Transcriptome-based molecular staging of human stem cell-derived retinal organoids uncovers accelerated photoreceptor differentiation by 9-cis retinal. Mol. Vis. 2019, 25, 663–678. [Google Scholar]
- Hoshino, A.; Ratnapriya, R.; Brooks, M.J.; Chaitankar, V.; Wilken, M.S.; Zhang, C.; Starostik, M.R.; Gieser, L.; La Torre, A.; Nishio, M.; et al. Molecular Anatomy of the Developing Human Retina. Dev. Cell 2017, 43, 763–779.e4. [Google Scholar] [CrossRef] [Green Version]
- Mellough, C.B.; Bauer, R.; Collin, J.; Dorgau, B.; Zerti, D.; Dolan, D.W.P.; Jones, C.M.; Izuogu, O.G.; Yu, M.; Hallam, D.; et al. An integrated transcriptional analysis of the developing human retina. Development 2019, 146, dev169474. [Google Scholar] [CrossRef] [Green Version]
- Merkle, F.T.; Ghosh, S.; Kamitaki, N.; Mitchell, J.; Avior, Y.; Mello, C.; Kashin, S.; Mekhoubad, S.; Ilic, D.; Charlton, M.; et al. Human pluripotent stem cells recurrently acquire and expand dominant negative P53 mutations. Nature 2017, 545, 229–233. [Google Scholar] [CrossRef] [PubMed] [Green Version]
- Burkhart, D.L.; Sage, J. Cellular mechanisms of tumour suppression by the retinoblastoma gene. Nat. Rev. Cancer 2008, 8, 671–682. [Google Scholar] [CrossRef] [PubMed]
- Avior, Y.; Lezmi, E.; Yanuka, D.; Benvenisty, N. Modeling Developmental and Tumorigenic Aspects of Trilateral Retinoblastoma via Human Embryonic Stem Cells. Stem Cell Rep. 2017, 8, 1354–1365. [Google Scholar] [CrossRef] [PubMed] [Green Version]
- Matsui, T.; Nieto-Estévez, V.; Kyrychenko, S.; Schneider, J.W.; Hsieh, J. Retinoblastoma protein controls growth, survival and neuronal migration in human cerebral organoids. Development 2017, 144, 1025–1034. [Google Scholar] [CrossRef] [Green Version]
- Cornish, E.E.; Xiao, M.; Yang, Z.; Provis, J.M.; Hendrickson, A.E. The role of opsin expression and apoptosis in determination of cone types in human retina. Exp. Eye Res. 2004, 78, 1143–1154. [Google Scholar] [CrossRef]
- Santagata, S.; Maire, C.L.; Idbaih, A.; Geffers, L.; Correll, M.; Holton, K.; Quackenbush, J.; Ligon, K.L. CRX is a diagnostic marker of retinal and pineal lineage tumors. PLoS ONE 2009, 4, e7932. [Google Scholar] [CrossRef]
- Liu, J.; Ottaviani, D.; Sefta, M.; Desbrousses, C.; Chapeaublanc, E.; Aschero, R.; Sirab, N.; Lubieniecki, F.; Lamas, G.; Tonon, L.; et al. A high-risk retinoblastoma subtype with stemness features, dedifferentiated cone states and neuronal/ganglion cell gene expression. Nat. Commun. 2021, 12, 5578. [Google Scholar] [CrossRef]
- Aran, D.; Lasry, A.; Zinger, A.; Biton, M.; Pikarsky, E.; Hellman, A.; Butte, A.J.; Ben-Neriah, Y. Widespread parainflammation in human cancer. Genome Biol. 2016, 17, 145. [Google Scholar] [CrossRef] [Green Version]
- Medzhitov, R. Origin and physiological roles of inflammation. Nature 2008, 454, 428–435. [Google Scholar] [CrossRef]


Publisher’s Note: MDPI stays neutral with regard to jurisdictional claims in published maps and institutional affiliations. |
© 2022 by the authors. Licensee MDPI, Basel, Switzerland. This article is an open access article distributed under the terms and conditions of the Creative Commons Attribution (CC BY) license (https://creativecommons.org/licenses/by/4.0/).
Share and Cite
Kanber, D.; Woestefeld, J.; Döpper, H.; Bozet, M.; Brenzel, A.; Altmüller, J.; Kilpert, F.; Lohmann, D.; Pommerenke, C.; Steenpass, L. RB1-Negative Retinal Organoids Display Proliferation of Cone Photoreceptors and Loss of Retinal Differentiation. Cancers 2022, 14, 2166. https://0-doi-org.brum.beds.ac.uk/10.3390/cancers14092166
Kanber D, Woestefeld J, Döpper H, Bozet M, Brenzel A, Altmüller J, Kilpert F, Lohmann D, Pommerenke C, Steenpass L. RB1-Negative Retinal Organoids Display Proliferation of Cone Photoreceptors and Loss of Retinal Differentiation. Cancers. 2022; 14(9):2166. https://0-doi-org.brum.beds.ac.uk/10.3390/cancers14092166
Chicago/Turabian StyleKanber, Deniz, Julia Woestefeld, Hannah Döpper, Morgane Bozet, Alexandra Brenzel, Janine Altmüller, Fabian Kilpert, Dietmar Lohmann, Claudia Pommerenke, and Laura Steenpass. 2022. "RB1-Negative Retinal Organoids Display Proliferation of Cone Photoreceptors and Loss of Retinal Differentiation" Cancers 14, no. 9: 2166. https://0-doi-org.brum.beds.ac.uk/10.3390/cancers14092166