
An Apparent Diffusion Coefficient-Based Machine Learning Model Can Improve Prostate Cancer Detection in the Grey Area of the Prostate Imaging Reporting and Data System Category 3: A Single-Centre Experience
 , , ,
, , ,  ,
,  ,
,
Abstract
:Simple Summary
Abstract
1. Introduction
2. Materials and Methods
2.1. Study Population
2.2. Image Acquisition
2.3. Biopsy Procedure and Pathological Examination
2.4. Region of Interest (ROI) Segmentation
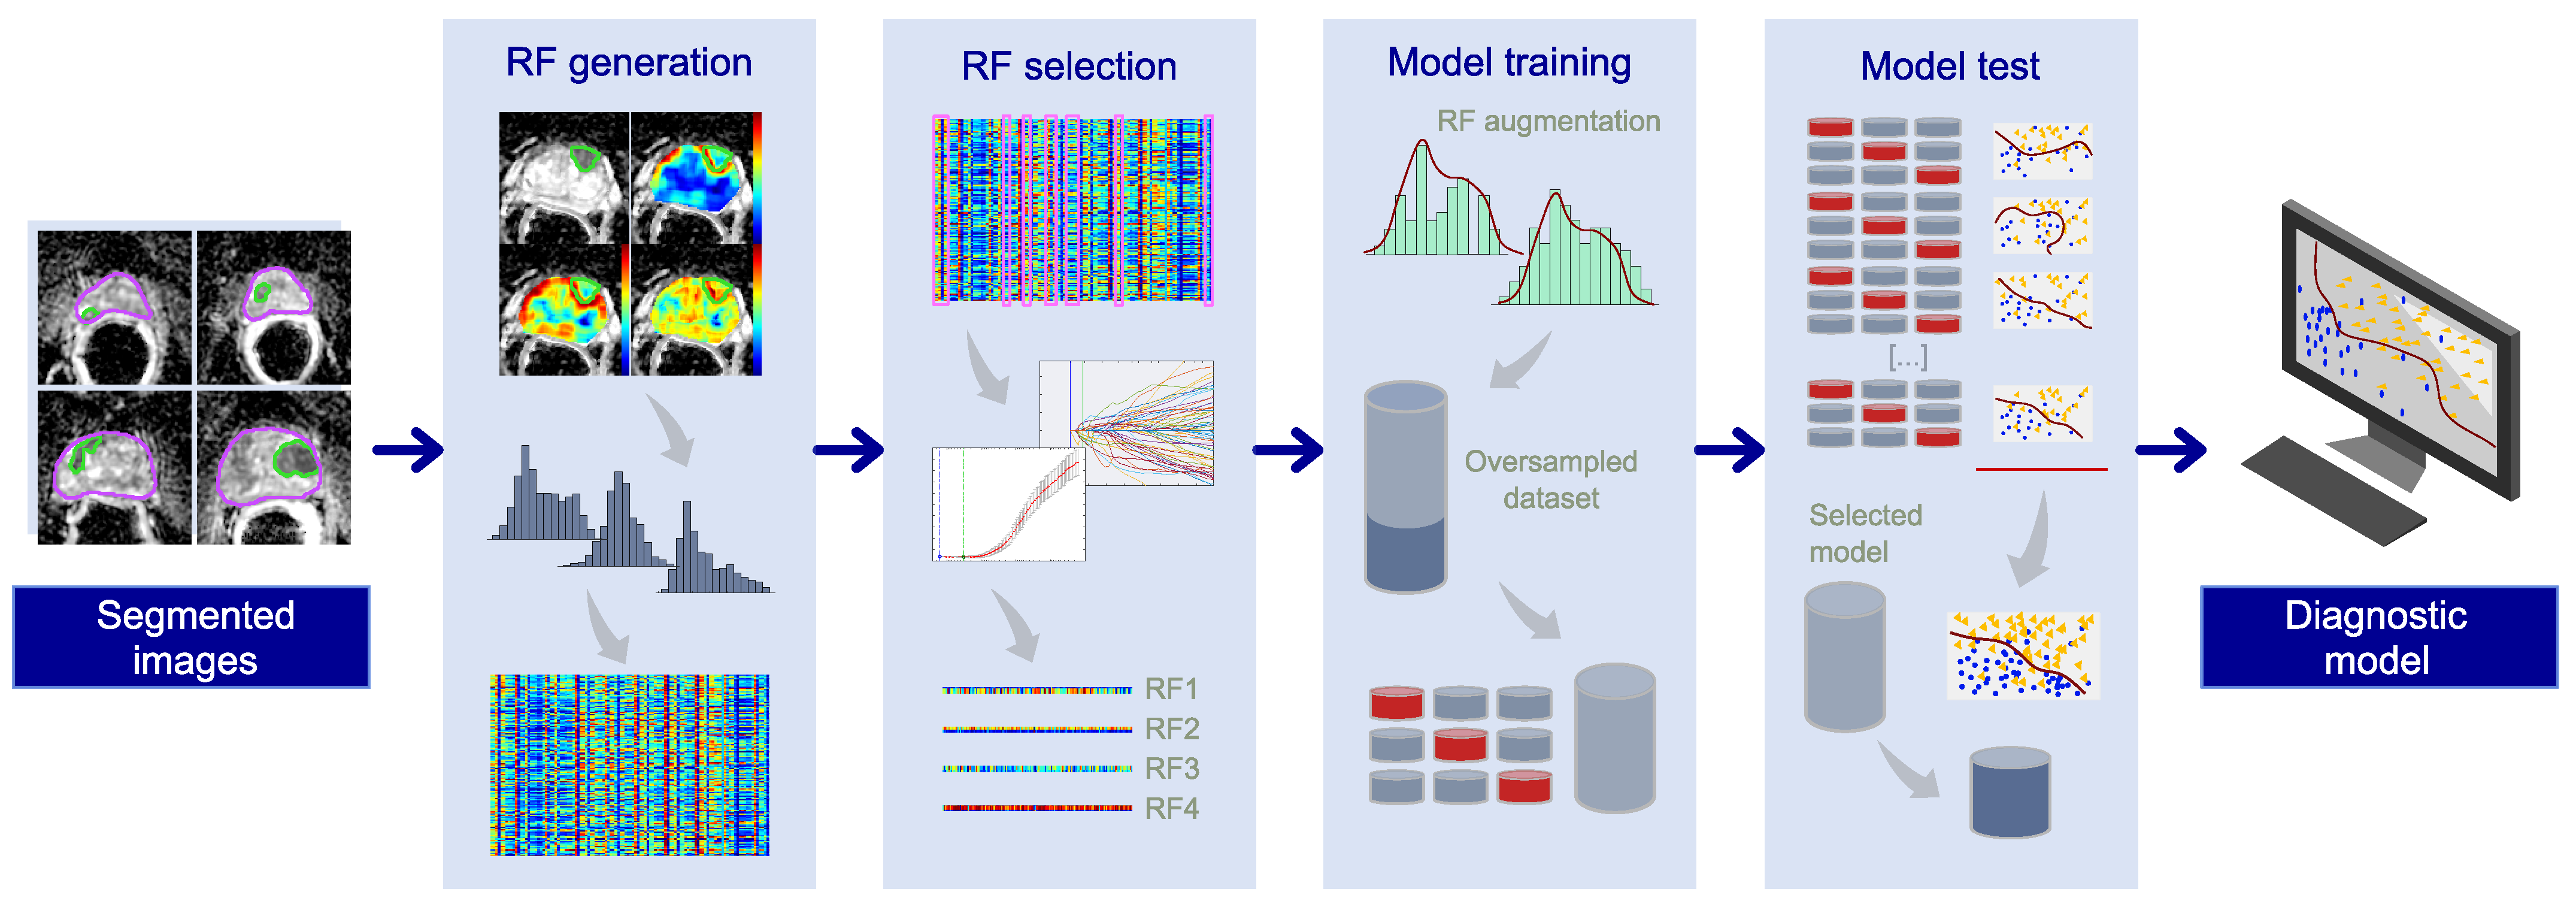
2.5. Machine Learning Pipeline
2.6. Radiomic Feature Generation
2.7. Radiomic Feature Selection
2.8. Training of the Prostate Cancer (PCa) Diagnostic Model
2.9. Final Model Selection and Holdout Test Phase
2.10. Literature Search
3. Results
3.1. Patient Characteristics
3.2. Radiomic Signature
3.3. PCa Diagnosis among PI-RADS 3 Lesions
3.4. Literature Analysis
4. Discussion
Author Contributions
Funding
Institutional Review Board Statement
Informed Consent Statement
Data Availability Statement
Conflicts of Interest
References
- Culp, M.B.; Soerjomataram, I.; Efstathiou, J.A.; Bray, F.; Jemal, A. Recent Global Patterns in Prostate Cancer Incidence and Mortality Rates. Eur. Urol. 2020, 77, 38–52. [Google Scholar] [CrossRef] [PubMed]
- Van der Kwast, T.H.; Roobol, M.J. Defining the threshold for significant versus insignificant prostate cancer. Nat. Rev. Urol. 2013, 10, 473–482. [Google Scholar] [CrossRef] [PubMed]
- Epstein, J.I.; Egevad, L.; Amin, M.B.; Delahunt, B.; Srigley, J.R.; Humphrey, P.A.; Grading, C. The 2014 International Society of Urological Pathology (ISUP) Consensus Conference on Gleason Grading of Prostatic Carcinoma: Definition of Grading Patterns and Proposal for a New Grading System. Am. J. Surg. Pathol. 2016, 40, 244–252. [Google Scholar] [CrossRef] [PubMed]
- Sauter, G.; Clauditz, T.; Steurer, S.; Wittmer, C.; Buscheck, F.; Krech, T.; Lutz, F.; Lennartz, M.; Harms, L.; Lawrenz, L.; et al. Integrating Tertiary Gleason 5 Patterns into Quantitative Gleason Grading in Prostate Biopsies and Prostatectomy Specimens. Eur. Urol. 2018, 73, 674–683. [Google Scholar] [CrossRef]
- Ross, H.M.; Kryvenko, O.N.; Cowan, J.E.; Simko, J.P.; Wheeler, T.M.; Epstein, J.I. Do adenocarcinomas of the prostate with Gleason score (GS) ≤ 6 have the potential to metastasize to lymph nodes? Am. J. Surg. Pathol. 2012, 36, 1346–1352. [Google Scholar] [CrossRef]
- Anderson, B.B.; Oberlin, D.T.; Razmaria, A.A.; Choy, B.; Zagaja, G.P.; Shalhav, A.L.; Meeks, J.J.; Yang, X.J.; Paner, G.P.; Eggener, S.E. Extraprostatic Extension Is Extremely Rare for Contemporary Gleason Score 6 Prostate Cancer. Eur. Urol. 2017, 72, 455–460. [Google Scholar] [CrossRef]
- Kasivisvanathan, V.; Emberton, M.; Moore, C.M. MRI-Targeted Biopsy for Prostate-Cancer Diagnosis. N. Engl. J. Med. 2018, 379, 589–590. [Google Scholar] [CrossRef]
- Rouviere, O.; Puech, P.; Renard-Penna, R.; Claudon, M.; Roy, C.; Mege-Lechevallier, F.; Decaussin-Petrucci, M.; Dubreuil-Chambardel, M.; Magaud, L.; Remontet, L.; et al. Use of prostate systematic and targeted biopsy on the basis of multiparametric MRI in biopsy-naive patients (MRI-FIRST): A prospective, multicentre, paired diagnostic study. Lancet Oncol. 2019, 20, 100–109. [Google Scholar] [CrossRef]
- Van der Leest, M.; Cornel, E.; Israel, B.; Hendriks, R.; Padhani, A.R.; Hoogenboom, M.; Zamecnik, P.; Bakker, D.; Setiasti, A.Y.; Veltman, J.; et al. Head-to-head Comparison of Transrectal Ultrasound-guided Prostate Biopsy Versus Multiparametric Prostate Resonance Imaging with Subsequent Magnetic Resonance-guided Biopsy in Biopsy-naive Men with Elevated Prostate-specific Antigen: A Large Prospective Multicenter Clinical Study. Eur. Urol. 2019, 75, 570–578. [Google Scholar] [CrossRef]
- Emmett, L.; Buteau, J.; Papa, N.; Moon, D.; Thompson, J.; Roberts, M.J.; Rasiah, K.; Pattison, D.A.; Yaxley, J.; Thomas, P.; et al. The Additive Diagnostic Value of Prostate-specific Membrane Antigen Positron Emission Tomography Computed Tomography to Multiparametric Magnetic Resonance Imaging Triage in the Diagnosis of Prostate Cancer (PRIMARY): A Prospective Multicentre Study. Eur. Urol. 2021, 80, 682–689. [Google Scholar] [CrossRef]
- Barentsz, J.O.; Richenberg, J.; Clements, R.; Choyke, P.; Verma, S.; Villeirs, G.; Rouviere, O.; Logager, V.; Futterer, J.J.; European Society of Urogenital, R. ESUR prostate MR guidelines 2012. Eur. Radiol. 2012, 22, 746–757. [Google Scholar] [CrossRef] [PubMed]
- Oerther, B.; Engel, H.; Bamberg, F.; Sigle, A.; Gratzke, C.; Benndorf, M. Cancer detection rates of the PI-RADSv2.1 assessment categories: Systematic review and meta-analysis on lesion level and patient level. Prostate Cancer Prostatic Dis. 2022, 25, 256–263. [Google Scholar] [CrossRef] [PubMed]
- Stabile, A.; Giganti, F.; Kasivisvanathan, V.; Giannarini, G.; Moore, C.M.; Padhani, A.R.; Panebianco, V.; Rosenkrantz, A.B.; Salomon, G.; Turkbey, B.; et al. Factors Influencing Variability in the Performance of Multiparametric Magnetic Resonance Imaging in Detecting Clinically Significant Prostate Cancer: A Systematic Literature Review. Eur. Urol. Oncol. 2020, 3, 145–167. [Google Scholar] [CrossRef] [PubMed]
- Wadera, A.; Alabousi, M.; Pozdnyakov, A.; Kashif Al-Ghita, M.; Jafri, A.; McInnes, M.D.; Schieda, N.; van der Pol, C.B.; Salameh, J.P.; Samoilov, L.; et al. Impact of PI-RADS Category 3 lesions on the diagnostic accuracy of MRI for detecting prostate cancer and the prevalence of prostate cancer within each PI-RADS category: A systematic review and meta-analysis. Br. J. Radiol. 2021, 94, 20191050. [Google Scholar] [CrossRef]
- Gaudiano, C.; Braccischi, L.; Taninokuchi Tomassoni, M.; Paccapelo, A.; Bianchi, L.; Corcioni, B.; Ciccarese, F.; Schiavina, R.; Droghetti, M.; Giunchi, F.; et al. Transverse prostate maximum sectional area can predict clinically significant prostate cancer in PI-RADS 3 lesions at multiparametric magnetic resonance imaging. Front. Oncol. 2023, 13, 1082564. [Google Scholar] [CrossRef]
- EAU-EANM-ESTRO-ESUR-SIOG Guidelines on Prostate Cancer 2023. Available online: https://uroweb.org/guidelines/prostate-cancer/chapter/diagnostic-evaluation (accessed on 28 February 2023).
- Emmett, L.; Papa, N.; Buteau, J.; Ho, B.; Liu, V.; Roberts, M.; Thompson, J.; Moon, D.; Sheehan-Dare, G.; Alghazo, O.; et al. The PRIMARY Score: Using Intraprostatic 68Ga-PSMA PET/CT Patterns to Optimize Prostate Cancer Diagnosis. J. Nucl. Med. 2022, 63, 1644–1650. [Google Scholar] [CrossRef]
- Roy, S.; Whitehead, T.D.; Quirk, J.D.; Salter, A.; Ademuyiwa, F.O.; Li, S.; An, H.; Shoghi, K.I. Optimal co-clinical radiomics: Sensitivity of radiomic features to tumour volume, image noise and resolution in co-clinical T1-weighted and T2-weighted magnetic resonance imaging. EBioMedicine 2020, 59, 102963. [Google Scholar] [CrossRef]
- Roy, S.; Whitehead, T.D.; Li, S.; Ademuyiwa, F.O.; Wahl, R.L.; Dehdashti, F.; Shoghi, K.I. Co-clinical FDG-PET radiomic signature in predicting response to neoadjuvant chemotherapy in triple-negative breast cancer. Eur. J. Nucl. Med. Mol. Imaging 2022, 49, 550–562. [Google Scholar] [CrossRef]
- Cuicchi, D.; Mottola, M.; Castellucci, P.; Bevilacqua, A.; Cattabriga, A.; Cocozza, M.A.; Cardelli, S.; Dajti, G.; Mattoni, S.; Golfieri, R.; et al. Radiomic Features from Post-Operative 18F-FDG PET/CT and CT Imaging Associated with Locally Recurrent Rectal Cancer: Preliminary Findings. J. Clin. Med. 2023, 12, 2058. [Google Scholar] [CrossRef]
- Giambelluca, D.; Cannella, R.; Vernuccio, F.; Comelli, A.; Pavone, A.; Salvaggio, L.; Galia, M.; Midiri, M.; Lagalla, R.; Salvaggio, G. PI-RADS 3 Lesions: Role of Prostate MRI Texture Analysis in the Identification of Prostate Cancer. Curr. Probl. Diagn. Radiol. 2021, 50, 175–185. [Google Scholar] [CrossRef]
- Li, M.; Yang, L.; Yue, Y.; Xu, J.; Huang, C.; Song, B. Use of Radiomics to Improve Diagnostic Performance of PI-RADS v2.1 in Prostate Cancer. Front. Oncol. 2020, 10, 631831. [Google Scholar] [CrossRef] [PubMed]
- Lim, C.S.; Abreu-Gomez, J.; Thornhill, R.; James, N.; Al Kindi, A.; Lim, A.S.; Schieda, N. Utility of machine learning of apparent diffusion coefficient (ADC) and T2-weighted (T2W) radiomic features in PI-RADS version 2.1 category 3 lesions to predict prostate cancer diagnosis. Abdom. Radiol. 2021, 46, 5647–5658. [Google Scholar] [CrossRef] [PubMed]
- Brancato, V.; Aiello, M.; Basso, L.; Monti, S.; Palumbo, L.; Di Costanzo, G.; Salvatore, M.; Ragozzino, A.; Cavaliere, C. Evaluation of a multiparametric MRI radiomic-based approach for stratification of equivocal PI-RADS 3 and upgraded PI-RADS 4 prostatic lesions. Sci. Rep. 2021, 11, 643. [Google Scholar] [CrossRef] [PubMed]
- Jin, P.; Shen, J.; Yang, L.; Zhang, J.; Shen, A.; Bao, J.; Wang, X. Machine learning-based radiomics model to predict benign and malignant PI-RADS v2.1 category 3 lesions: A retrospective multi-center study. BMC Med. Imaging 2023, 23, 47. [Google Scholar] [CrossRef] [PubMed]
- Borghesi, M.; Bianchi, L.; Barbaresi, U.; Vagnoni, V.; Corcioni, B.; Gaudiano, C.; Fiorentino, M.; Giunchi, F.; Chessa, F.; Garofalo, M.; et al. Diagnostic performance of MRI/TRUS fusion-guided biopsies vs. systematic prostate biopsies in biopsy-naive, previous negative biopsy patients and men undergoing active surveillance. Minerva Urol. Nephrol. 2021, 73, 357–366. [Google Scholar] [CrossRef]
- Gaudiano, C.; Bianchi, L.; Corcioni, B.; Giunchi, F.; Schiavina, R.; Ciccarese, F.; Braccischi, L.; Rustici, A.; Fiorentino, M.; Brunocilla, E.; et al. Evaluating the performance of clinical and radiological data in predicting prostate cancer in prostate imaging reporting and data system version 2.1 category 3 lesions of the peripheral and the transition zones. Int. Urol. Nephrol. 2022, 54, 263–271. [Google Scholar] [CrossRef]
- Droghetti, M.; Bianchi, L.; Gaudiano, C.; Corcioni, B.; Rustici, A.; Piazza, P.; Beretta, C.; Balestrazzi, E.; Costa, F.; Feruzzi, A.; et al. Comparison of prostate cancer detection rate at targeted biopsy of hub and spoke centers mpMRI: Experience matters. Minerva Urol. Nephrol. 2022, 75, 42–49. [Google Scholar] [CrossRef]
- Droghetti, M.; Bianchi, L.; Beretta, C.; Balestrazzi, E.; Costa, F.; Feruzzi, A.; Piazza, P.; Roveroni, C.; Gaudiano, C.; Corcioni, B.; et al. Site-specific concordance of targeted and systematic biopsy cores at the index lesion on multiparametric magnetic resonance: Can we spare the double-tap? World J. Urol. 2023, 41, 27–33. [Google Scholar] [CrossRef]
- Bevilacqua, A.; Mottola, M.; Ferroni, F.; Rossi, A.; Gavelli, G.; Barone, D. The Primacy of High B-Value 3T-DWI Radiomics in the Prediction of Clinically Significant Prostate Cancer. Diagnostics 2021, 11, 739. [Google Scholar] [CrossRef]
- Coppola, F.; Mottola, M.; Lo Monaco, S.; Cattabriga, A.; Cocozza, M.A.; Yuan, J.C.; De Benedittis, C.; Cuicchi, D.; Guido, A.; Rojas Llimpe, F.L.; et al. The Heterogeneity of Skewness in T2W-Based Radiomics Predicts the Response to Neoadjuvant Chemoradiotherapy in Locally Advanced Rectal Cancer. Diagnostics 2021, 11, 795. [Google Scholar] [CrossRef]
- Renzulli, M.; Mottola, M.; Coppola, F.; Cocozza, M.A.; Malavasi, S.; Cattabriga, A.; Vara, G.; Ravaioli, M.; Cescon, M.; Vasuri, F.; et al. Automatically Extracted Machine Learning Features from Preoperative CT to Early Predict Microvascular Invasion in HCC: The Role of the Zone of Transition (ZOT). Cancers 2022, 14, 1816. [Google Scholar] [CrossRef] [PubMed]
- Gaudiano, C.; Mottola, M.; Bianchi, L.; Corcioni, B.; Cattabriga, A.; Cocozza, M.A.; Palmeri, A.; Coppola, F.; Giunchi, F.; Schiavina, R.; et al. Beyond Multiparametric MRI and towards Radiomics to Detect Prostate Cancer: A Machine Learning Model to Predict Clinically Significant Lesions. Cancers 2022, 14, 6156. [Google Scholar] [CrossRef] [PubMed]


| Parameter | Value | |
|---|---|---|
| Patients (n°) | 133 | |
| Age | ||
| , years | 69 ± 6 | |
| range, years | 51–88 | |
| PSA | ||
| , ng/mL2 | 8 | |
| range, ng/mL2 | 1.59–46 | |
| PSAD | ||
| <0.15, ng/mL2 | 81 | |
| ≥0.15, ng/mL2 | 52 | |
| PI-RADS 3 lesions (n°) | 155 | |
| Size | ||
| median, mm2 | 119 | |
| IQR, mm2 | 177 | |
| PZ | 115 | |
| TZ | 40 | |
| Negative biopsy (n°) | 71/155 (46%) | |
| ISUP 1 (n°) | 28/84 (33%) | |
| PSAD < 0.15, ng/mL2 | 14 | |
| PSAD ≥ 0.15, ng/mL2 | 14 | |
| ISUP 2 (n°) | 34/84 (40%) | |
| PSAD < 0.15, ng/mL2 | 16 | |
| PSAD ≥ 0.15, ng/mL2 | 18 | |
| ISUP 3 (n°) | 10/84 (12%) | |
| PSAD < 0.15, ng/mL2 | 8 | |
| PSAD ≥ 0.15, ng/mL2 | 2 | |
| ISUP 4 (n°) | 8/84 (10%) | |
| PSAD < 0.15, ng/mL2 | 2 | |
| PSAD ≥ 0.15, ng/mL2 | 6 | |
| ISUP 5 (n°) | 4/84 (5%) | |
| PSAD < 0.15, ng/mL2 | 1 | |
| PSAD ≥ 0.15, ng/mL2 | 3 |
| Radiomic Feature (RF) | Local Parametric Map | Global Descriptors | |
|---|---|---|---|
| Number | Identifier | ||
| RF39 | –S | mean () | skewness (S) |
| RF55 | M–σ | median (M) | standard deviation (σ) |
| RF61 | μ90th–μ | μ of the last decile (μ90th) | μ |
| RF83 | M90th–e | M of the last decile (M90th) | entropy (e) |
| RF91 | S–σ | mean (μ) | S |
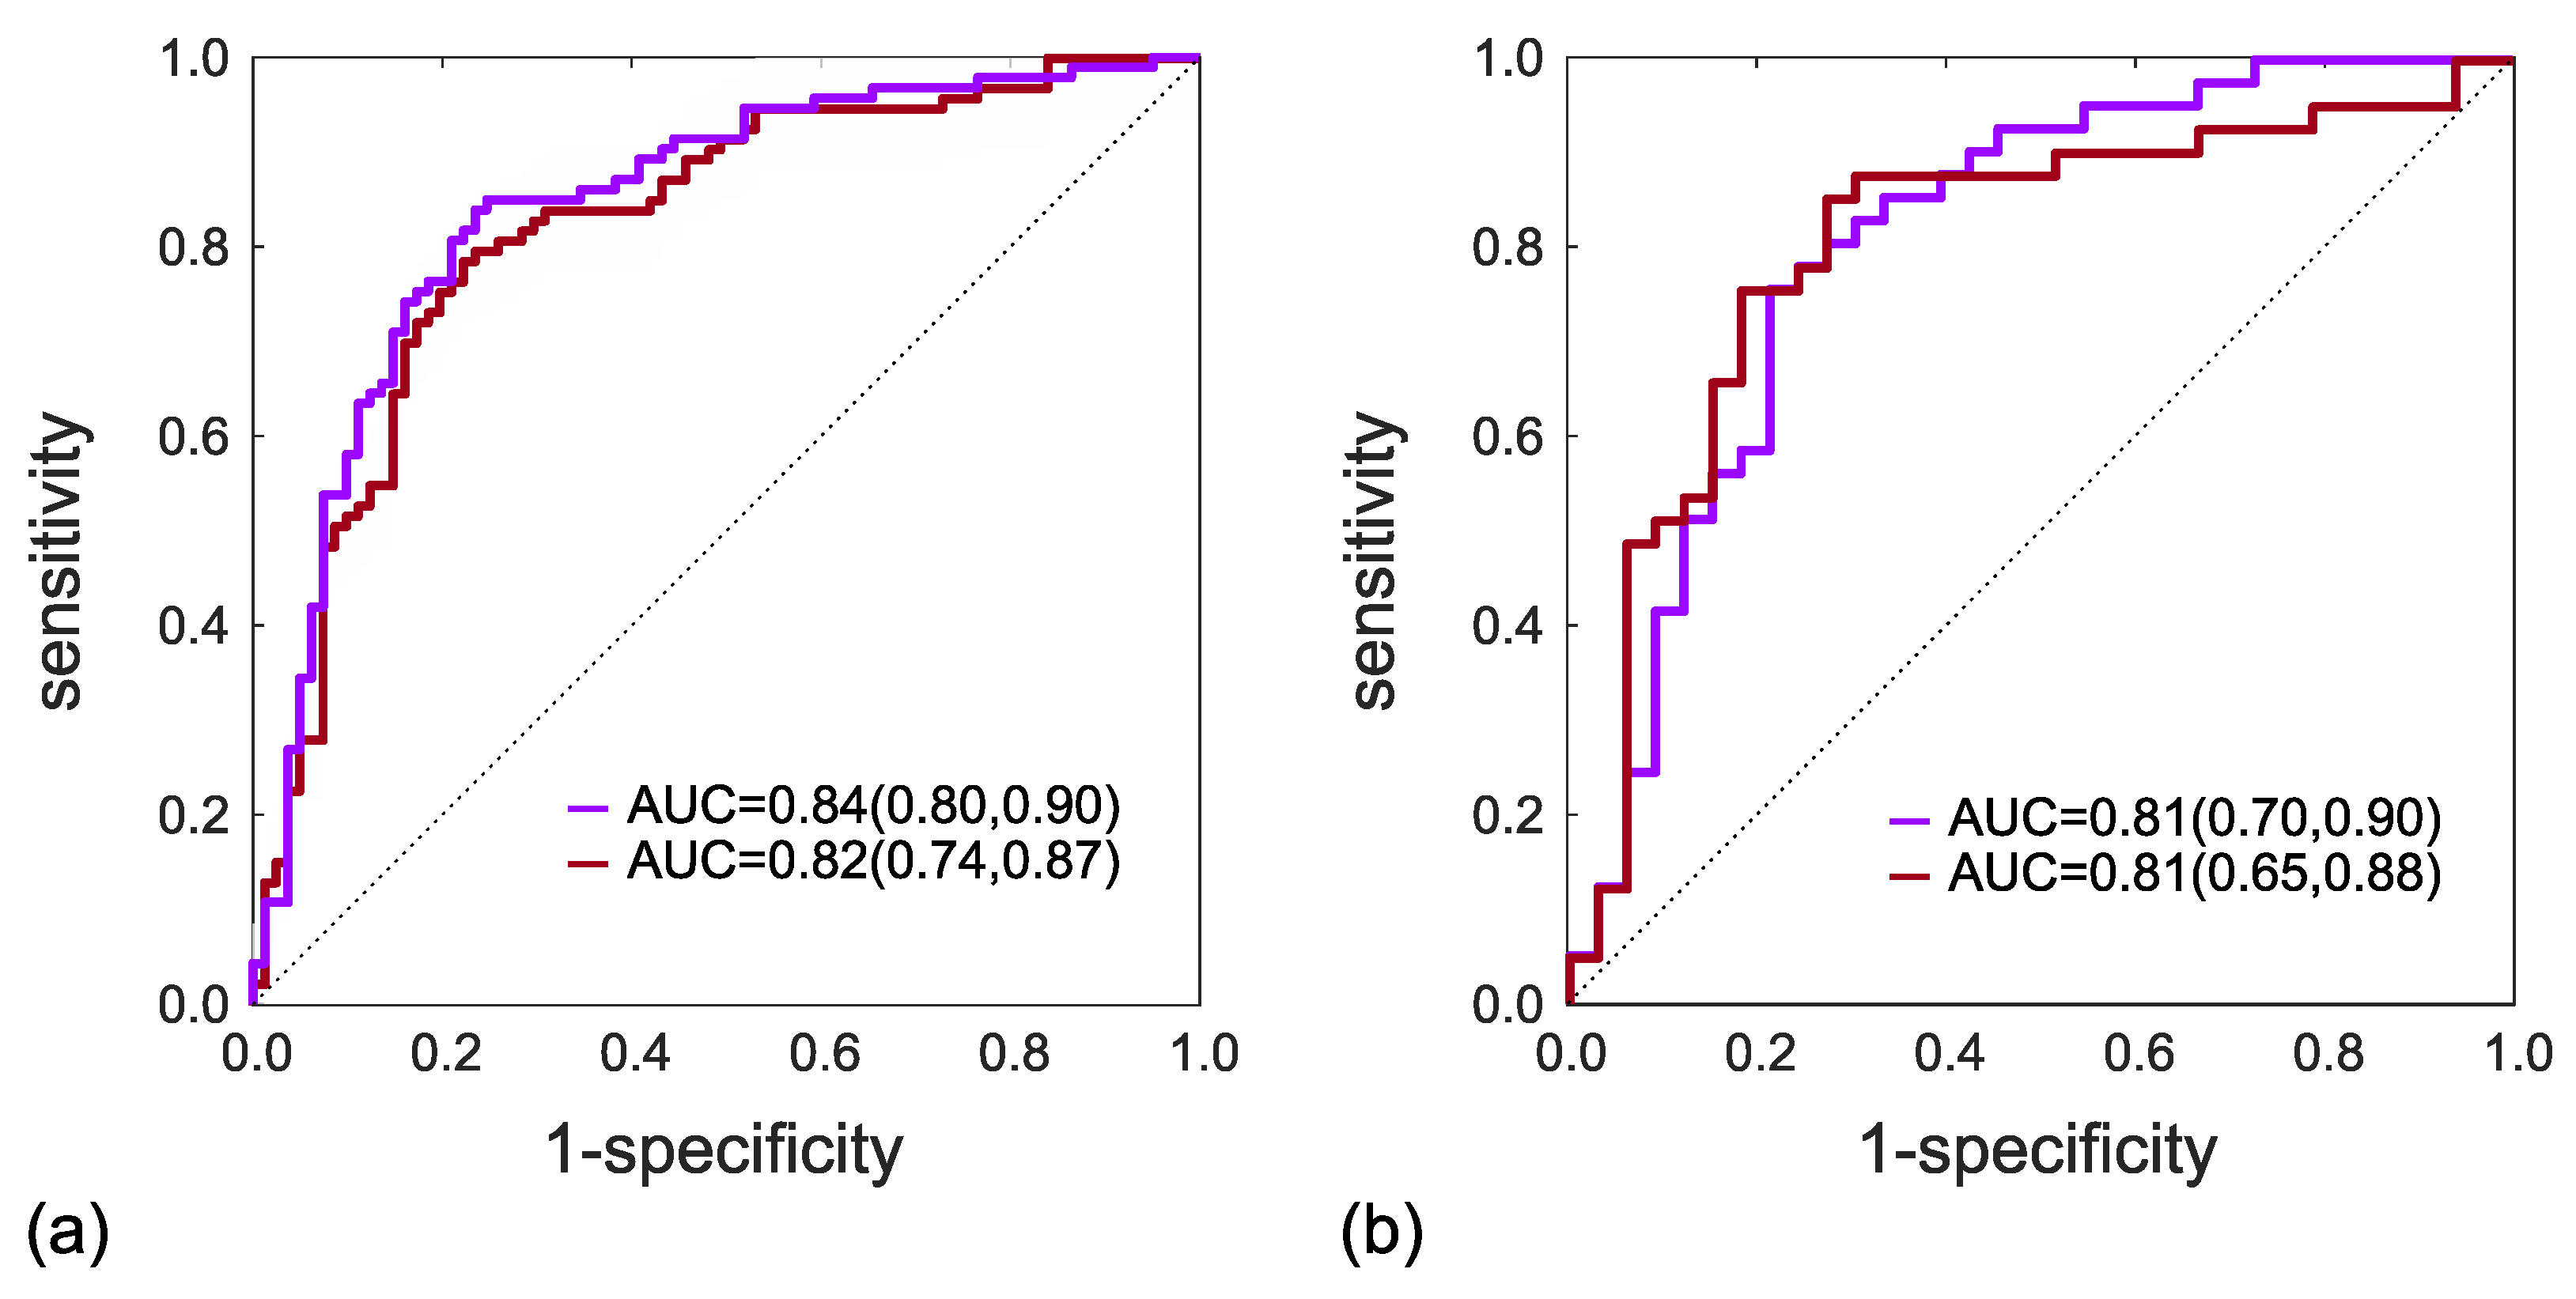
| RFs | SVM Kernel | Subset | AUC | FP/P | FN/N | SP | SN | Y.I. | PPV | NPV |
|---|---|---|---|---|---|---|---|---|---|---|
| RF[55-61-83-91] | Linear | Training | 0.82 | 18/93 | 20/81 | 78% | 78% | 0.56 | 80% | 76% |
| Test | 0.81 | 7/41 | 10/33 | 79% | 76% | 0.54 | 82% | 72% | ||
| RF[39-55-61-91] | 2nd-order | Training | 0.84 | 19/93 | 15/81 | 77% | 84% | 0.60 | 80% | 81% |
| polynomial | Test | 0.81 | 8/41 | 9/33 | 76% | 78% | 0.54 | 80% | 74% |
| Study | Series | Pz | PI-RADS 3 | PCa * | RFs | Test | AUC | SP (%) | SN (%) | Y.I. |
|---|---|---|---|---|---|---|---|---|---|---|
| 2020, Li et al. 2 [22] | mpMRI | 36 | 36 | 6 | 45 | yes | 0.94 | 100 | 80 | 0.80 |
| 2021, Giambelluca et al. 1 [21] | ADC | 43 | 46 | 19 | 6 | no | 0.82 | – | – | – |
| 2021, Lim et al. 2 [23] | T2w, ADC | 158 | 160 | 80 | 10 | yes | 0.68 | – | – | – |
| 2021, Brancato et al. 1,2 [24] | T2w | – | 41 | 26 | 2 | yes | 0.76 | 51 | 80 | 0.31 |
| 2023, Jin et al. 1,2 [25] | – | 463 | 80 3 | 26 3 | 3 | yes | 0.75 | 72 | 85 | 0.57 |
| our work 2 | ADC | 133 | 74 † | 41 | 4 | yes | 0.81 | 76 | 78 | 0.54 |
Disclaimer/Publisher’s Note: The statements, opinions and data contained in all publications are solely those of the individual author(s) and contributor(s) and not of MDPI and/or the editor(s). MDPI and/or the editor(s) disclaim responsibility for any injury to people or property resulting from any ideas, methods, instructions or products referred to in the content. |
© 2023 by the authors. Licensee MDPI, Basel, Switzerland. This article is an open access article distributed under the terms and conditions of the Creative Commons Attribution (CC BY) license (https://creativecommons.org/licenses/by/4.0/).
Share and Cite
Gaudiano, C.; Mottola, M.; Bianchi, L.; Corcioni, B.; Braccischi, L.; Taninokuchi Tomassoni, M.; Cattabriga, A.; Cocozza, M.A.; Giunchi, F.; Schiavina, R.; et al. An Apparent Diffusion Coefficient-Based Machine Learning Model Can Improve Prostate Cancer Detection in the Grey Area of the Prostate Imaging Reporting and Data System Category 3: A Single-Centre Experience. Cancers 2023, 15, 3438. https://0-doi-org.brum.beds.ac.uk/10.3390/cancers15133438
Gaudiano C, Mottola M, Bianchi L, Corcioni B, Braccischi L, Taninokuchi Tomassoni M, Cattabriga A, Cocozza MA, Giunchi F, Schiavina R, et al. An Apparent Diffusion Coefficient-Based Machine Learning Model Can Improve Prostate Cancer Detection in the Grey Area of the Prostate Imaging Reporting and Data System Category 3: A Single-Centre Experience. Cancers. 2023; 15(13):3438. https://0-doi-org.brum.beds.ac.uk/10.3390/cancers15133438
Chicago/Turabian StyleGaudiano, Caterina, Margherita Mottola, Lorenzo Bianchi, Beniamino Corcioni, Lorenzo Braccischi, Makoto Taninokuchi Tomassoni, Arrigo Cattabriga, Maria Adriana Cocozza, Francesca Giunchi, Riccardo Schiavina, and et al. 2023. "An Apparent Diffusion Coefficient-Based Machine Learning Model Can Improve Prostate Cancer Detection in the Grey Area of the Prostate Imaging Reporting and Data System Category 3: A Single-Centre Experience" Cancers 15, no. 13: 3438. https://0-doi-org.brum.beds.ac.uk/10.3390/cancers15133438