1. Introduction
Triple-negative breast cancer (TNBC) is a subtype of breast cancer that lacks expression of estrogen receptor, progesterone receptor, and human epidermal growth factor receptor 2 (HER2). TNBC accounts for approximately 10% to 20% of all breast cancers but approximately 30% of breast cancer-related mortalities [
1]. Endocrine therapy, commonly used to treat estrogen receptor–positive and progesterone receptor–positive breast cancers, and HER2-targeted therapies, used to treat HER2-positive breast cancers, are ineffective against TNBC. Neoadjuvant systemic therapy (NAST) followed by surgery is a standard treatment strategy for TNBC despite high toxicity [
2]. Approximately 50% of patients with TNBC who receive NAST achieve a pathologic complete response (pCR), defined as no residual invasive disease in the surgical specimen. Patients with a pCR have a good prognosis with respect to long-term survival and other clinical outcomes. Unfortunately, patients who do not achieve a pCR after NAST have substantially higher recurrence and mortality rates [
3]. Early prediction of a pCR vs. a non-pCR to NAST can be helpful for clinical management. Patients predicted to have a non-pCR can be potentially triaged to alternative investigational therapies to minimize their exposure to the toxicities of an ineffective standard NAST. However, there is currently no reliable way of predicting in the clinic which patients undergoing NAST will have a pCR prior to or early during their NAST treatment.
Dynamic contrast-enhanced (DCE) MRI is a functional imaging modality that evaluates vascular and perfusional properties of tissue [
4,
5]. DCE MRI images can be analyzed semiquantitatively with parameter maps such as positive enhancement integral, signal enhancement ratio (SER), and maximum slope of increase. With proper modeling, DCE MRI can also be used to derive important pharmacokinetic tissue parameters, including blood volume, blood flow, and permeability constant [
6,
7,
8,
9,
10,
11,
12]. These semiquantitative and quantitative parameters have been investigated both for diagnostic purposes and for predicting the treatment response of different types of cancers, including breast cancer. Investigators have assessed whether changes in tumor properties on MRI (e.g., tumor size, diffusion parameters, and tumoral heterogeneity) at an early stage of treatment are correlated with pCR [
13,
14,
15,
16,
17,
18].
Volumetric measurements on MRI, including tumor volume (TV), enhanced TV (ETV), and functional TV (FTV), have been reported to be useful biomarkers for prediction of breast cancer response to NAST [
19,
20,
21,
22]. TV is the ellipsoidal volume of a tumor calculated by multiplying the anteroposterior, craniocaudal, and transverse tumor dimensions. The ETV is the volume occupied by voxels that show enhancement at a specific time after contrast agent injection. The FTV is the subset of the ETV that corresponds to the enhanced voxels demonstrating percentage enhancement (PE) and SER above preset PE and SER thresholds [
19]. By convention, PE is the change in signal intensity from a pre-contrast phase to an early post-contrast phase relative to the pre-contrast phase of the DCE image series. PE provides a measure of the signal enhancement due to the wash-in of contrast agent in tumors. SER is defined as the ratio of the change in signal intensity between the early post-contrast phase and the pre-contrast phase to the change in signal intensity between a late post-contrast phase and the pre-contrast phase [
23]. SER is particularly helpful in identifying tissues with fast wash-out of contrast agent [
24,
25]. The FTV incorporates the active tumor regions that usually show rapid gain and rapid loss of enhancement on DCE MRI after the injection of contrast agent. Several studies have assessed the utility of FTV as a predictor of response to NAST using early-phase DCE images acquired at 1 min, 1.5 min, 2 min, and 2.5 min post-contrast agent injection after the first, third, and fourth cycles of NAST [
13,
21,
22,
26,
27,
28].
The objective of this study is to compare the performance of FTVs after 2 cycles and 4 cycles of therapy as predictors of response to NAST in patients with TNBC.
2. Materials and Methods
2.1. Patient Population
A total of 256 patients with stage I-III TNBC enrolled in a prospective clinical trial (NCT02276443) approved by the Institutional Review Board were considered for inclusion in the study. Written informed consent was obtained from all study participants. TNBC was defined from standard pathologic assays as negative for ER and PR (<10% tumor staining) and negative for HER2 (immunohistochemistry (IHC) score < 3, gene copy number not amplified). Patients with stage IV disease prior to the initiation of chemotherapy, or who have had a prior excisional biopsy of the primary invasive breast cancer, or who are not eligible for taxane and/or anthracycline-based chemotherapy regimens, were excluded from this study. Of the 256 patients, 154 did not have DCE MRI images at C2 and/or C4 and were thus excluded. Additionally, 1 patient was excluded due to a technical problem with the MR images and another patient was excluded due to the lack of a pathology report. Therefore, the study population consisted of the remaining 100 patients who received NAST and had MRI scans at baseline, after 2 cycles of NAST (C2), and after 4 cycles of NAST (C4). NAST consisted of dose-dense doxorubicin and cyclophosphamide-based chemotherapy for 4 cycles followed by paclitaxel every 2 weeks for 4 cycles or weekly for 12 doses. NAST was followed by surgery with a definitive pathological assessment of residual disease. pCR was defined as no residual invasive disease in the breast or in the resected axillary lymph nodes [
21].
2.2. Image Acquisition
MRI scans were performed on a GE 3.0 T MR750w whole body scanner (Waukesha, WI) with a bilateral 8-channel phased array coil. The patients were placed in a prone and feet-in-first position for imaging. The imaging protocol included a T2-weighted series and a DCE MRI series based on differential subsampling with cartesian ordering (DISCO) sequence. Typical MRI scan parameters used for the DISCO acquisition were as follows: field of view = 34 × 34 cm, slice thickness = 3.0 mm, slice spacing = −1.5 mm, flip angle = 12°, repetition time = 7.6 ms, echo time 1/echo time 2 = 1.1/2.3 ms, total acquisition time = 7 min, matrix = 320 × 320, number of acquired slices = 60−115, in-plane spatial resolution = 0.6−0.8 mm, temporal resolution of DISCO series = 8−15.5 s, receiver bandwidth = ±166.7 kHz, and number of excitations = 0.69. At the start of the DCE MRI scan, a single bolus of gadobutrol (Gadovist, Bayer Health Care) contrast agent was injected (0.1 mL/kg at ~2 mL/second followed by saline flush) after obtaining at least one pre-contrast phase.
2.3. DCE MRI Analysis
Pre-contrast, early (1 min and 2.5 min)-, and late (7 min)-phase DCE MRI images at BL, C2, and C4 were obtained using the imaging protocol and parameters described in
Section 2.2. DCE subtraction images were obtained by subtracting the pre-contrast images from the early- and late-phase images.
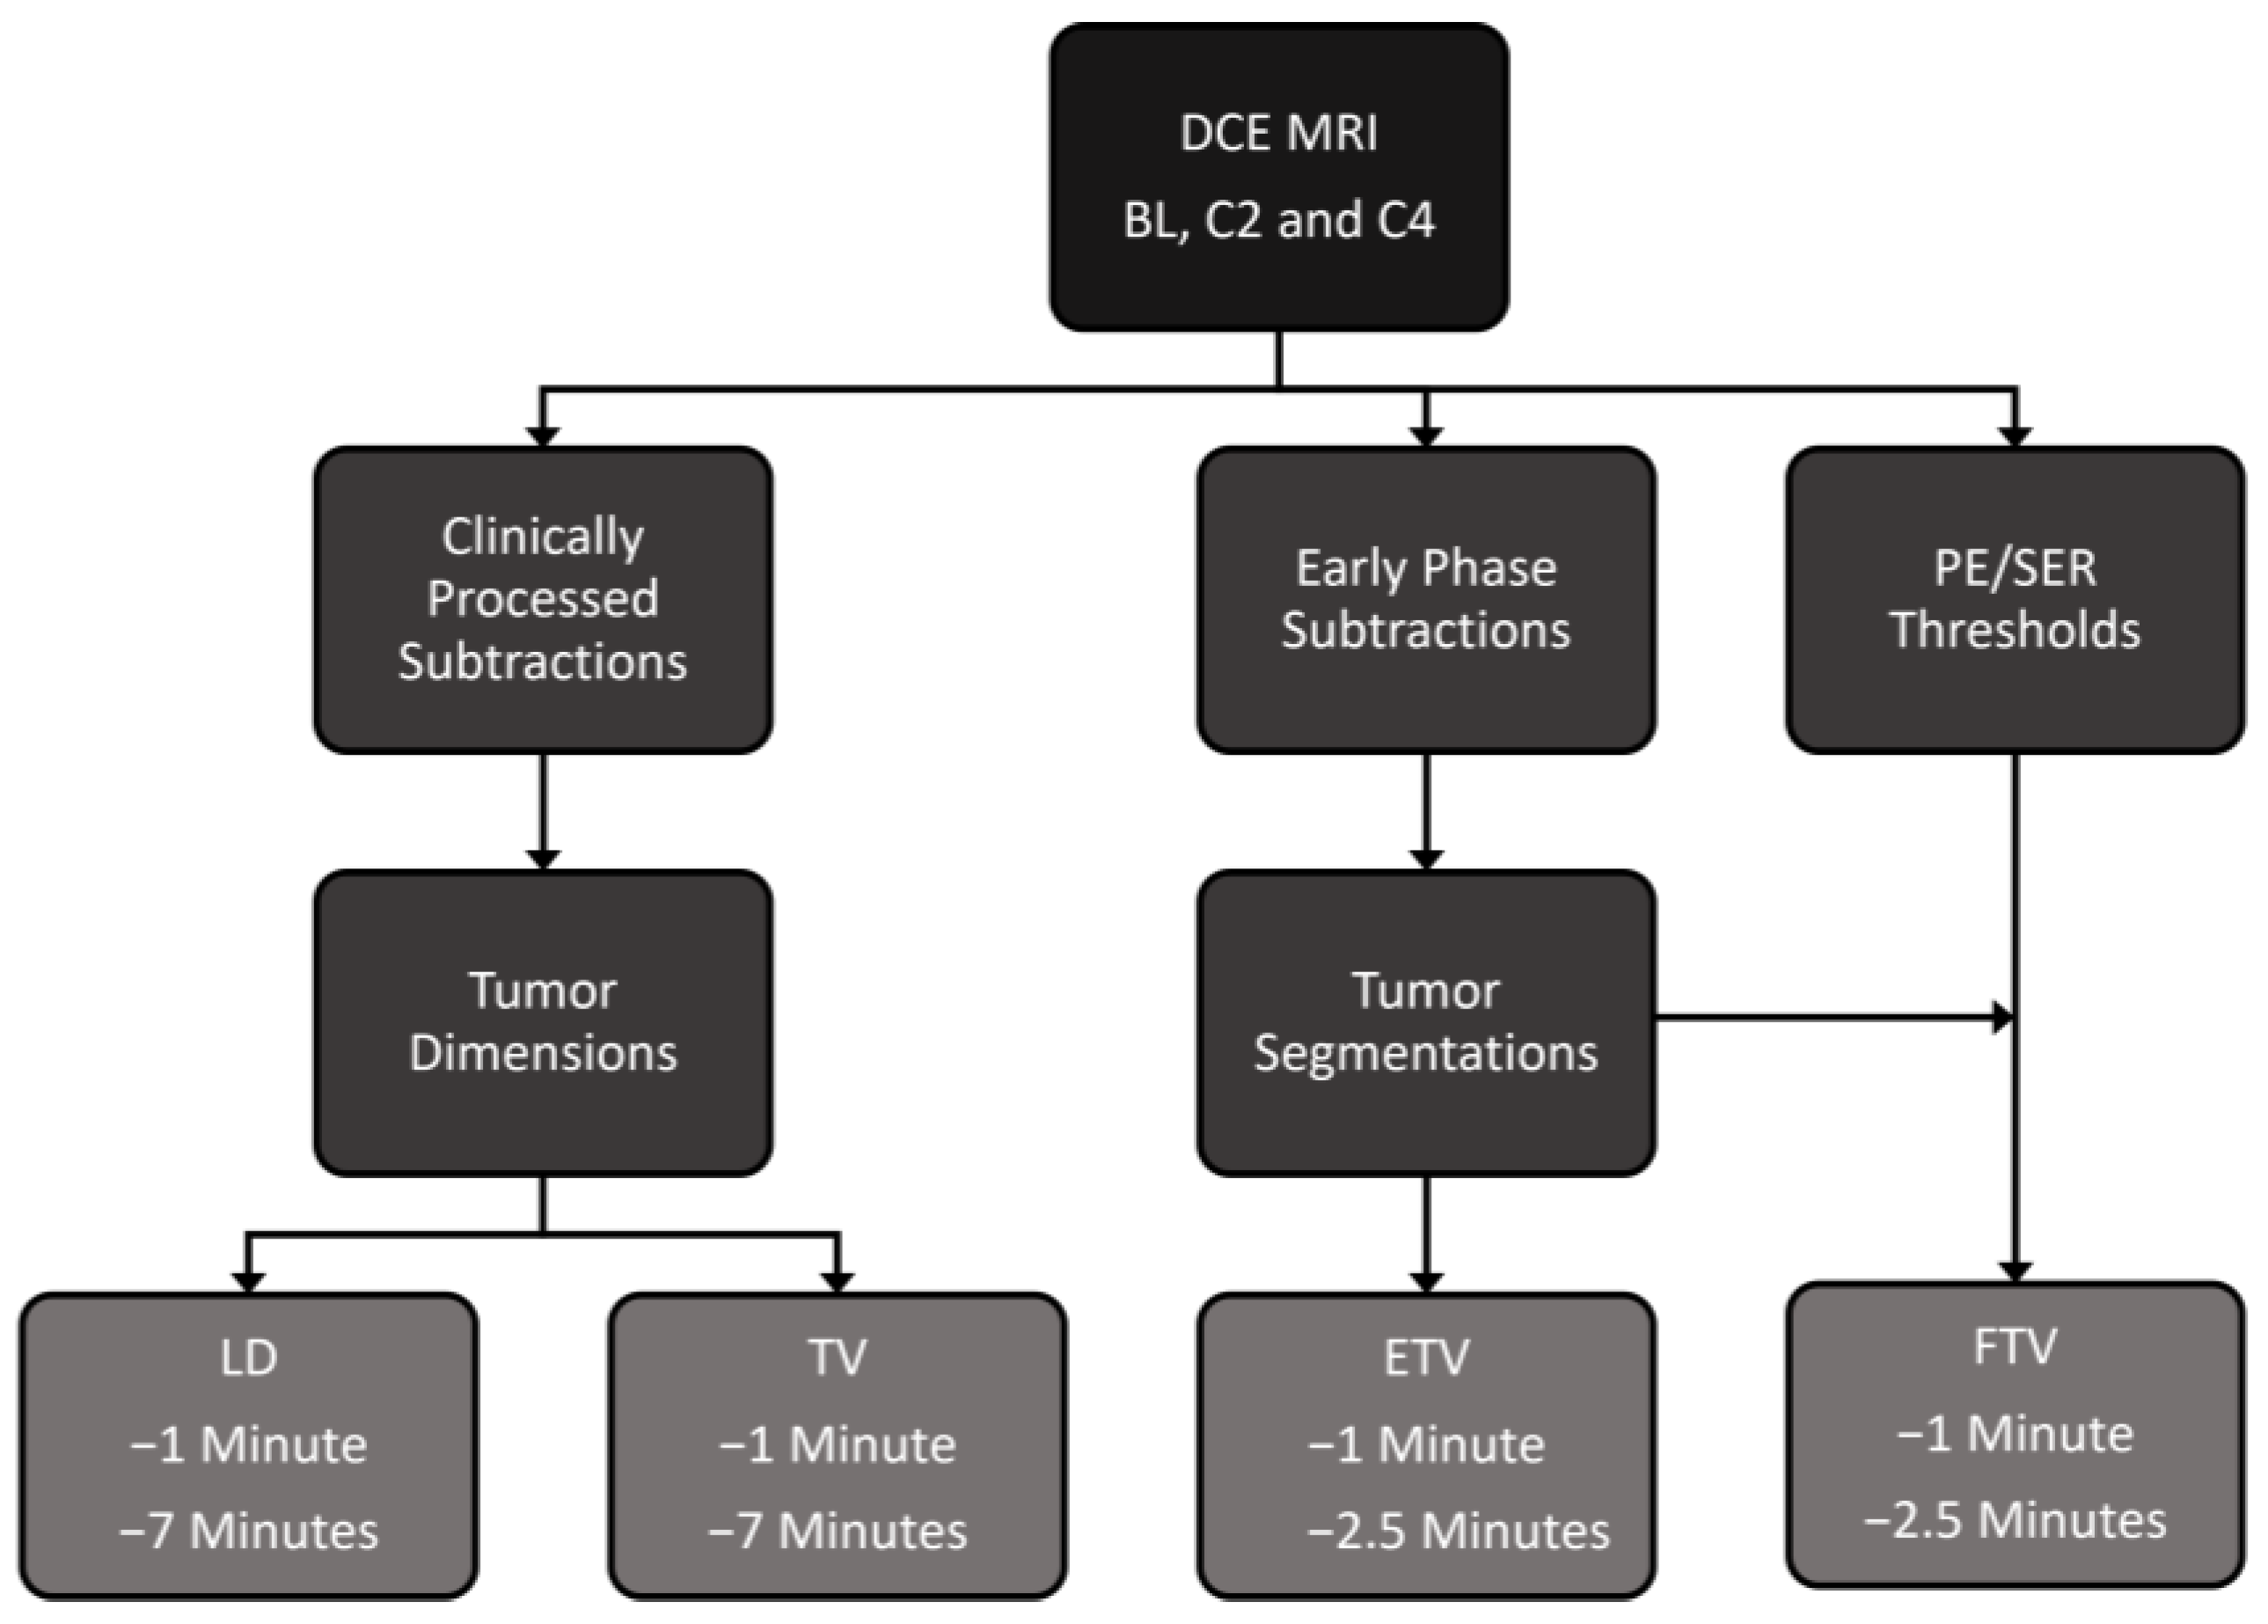
Figure 1 shows the workflow from acquisition of DCE-MR images to tumor segmentation and measurement.
Tumor dimensions along the anteroposterior, craniocaudal, and transverse directions were measured on DCE subtraction images acquired 1 min and 7 min after contrast agent injection, with the LD determined from these orthogonal measurements. TV at 1 min and then at 7 min were calculated as follows:
For ETV and FTV measurements, the phases at 1 min and 2.5 min after contrast agent injection were chosen as the early phases on the basis of previous studies by Musall et al. [
28] and Hylton et al. [
27], whereas the final phase of the DCE scan, at 7 min after contrast agent injection, was chosen as the late phase. Tumor contouring was performed by 2 breast fellowship-trained radiologists with 8 years and 4 years of experience, respectively, on the DCE subtraction images at baseline, C2, and C4 using an in-house image analysis software program (Image-I) [
28]. Image-I offers a platform for the automated import/export of images and for manual as well as semiautomatic contouring of the regions of interest. The entire tumor volume from the 3D images was first manually segmented on a slice-by-slice basis, followed by semiautomatic refinement using the histogram thresholding feature of Image-I.
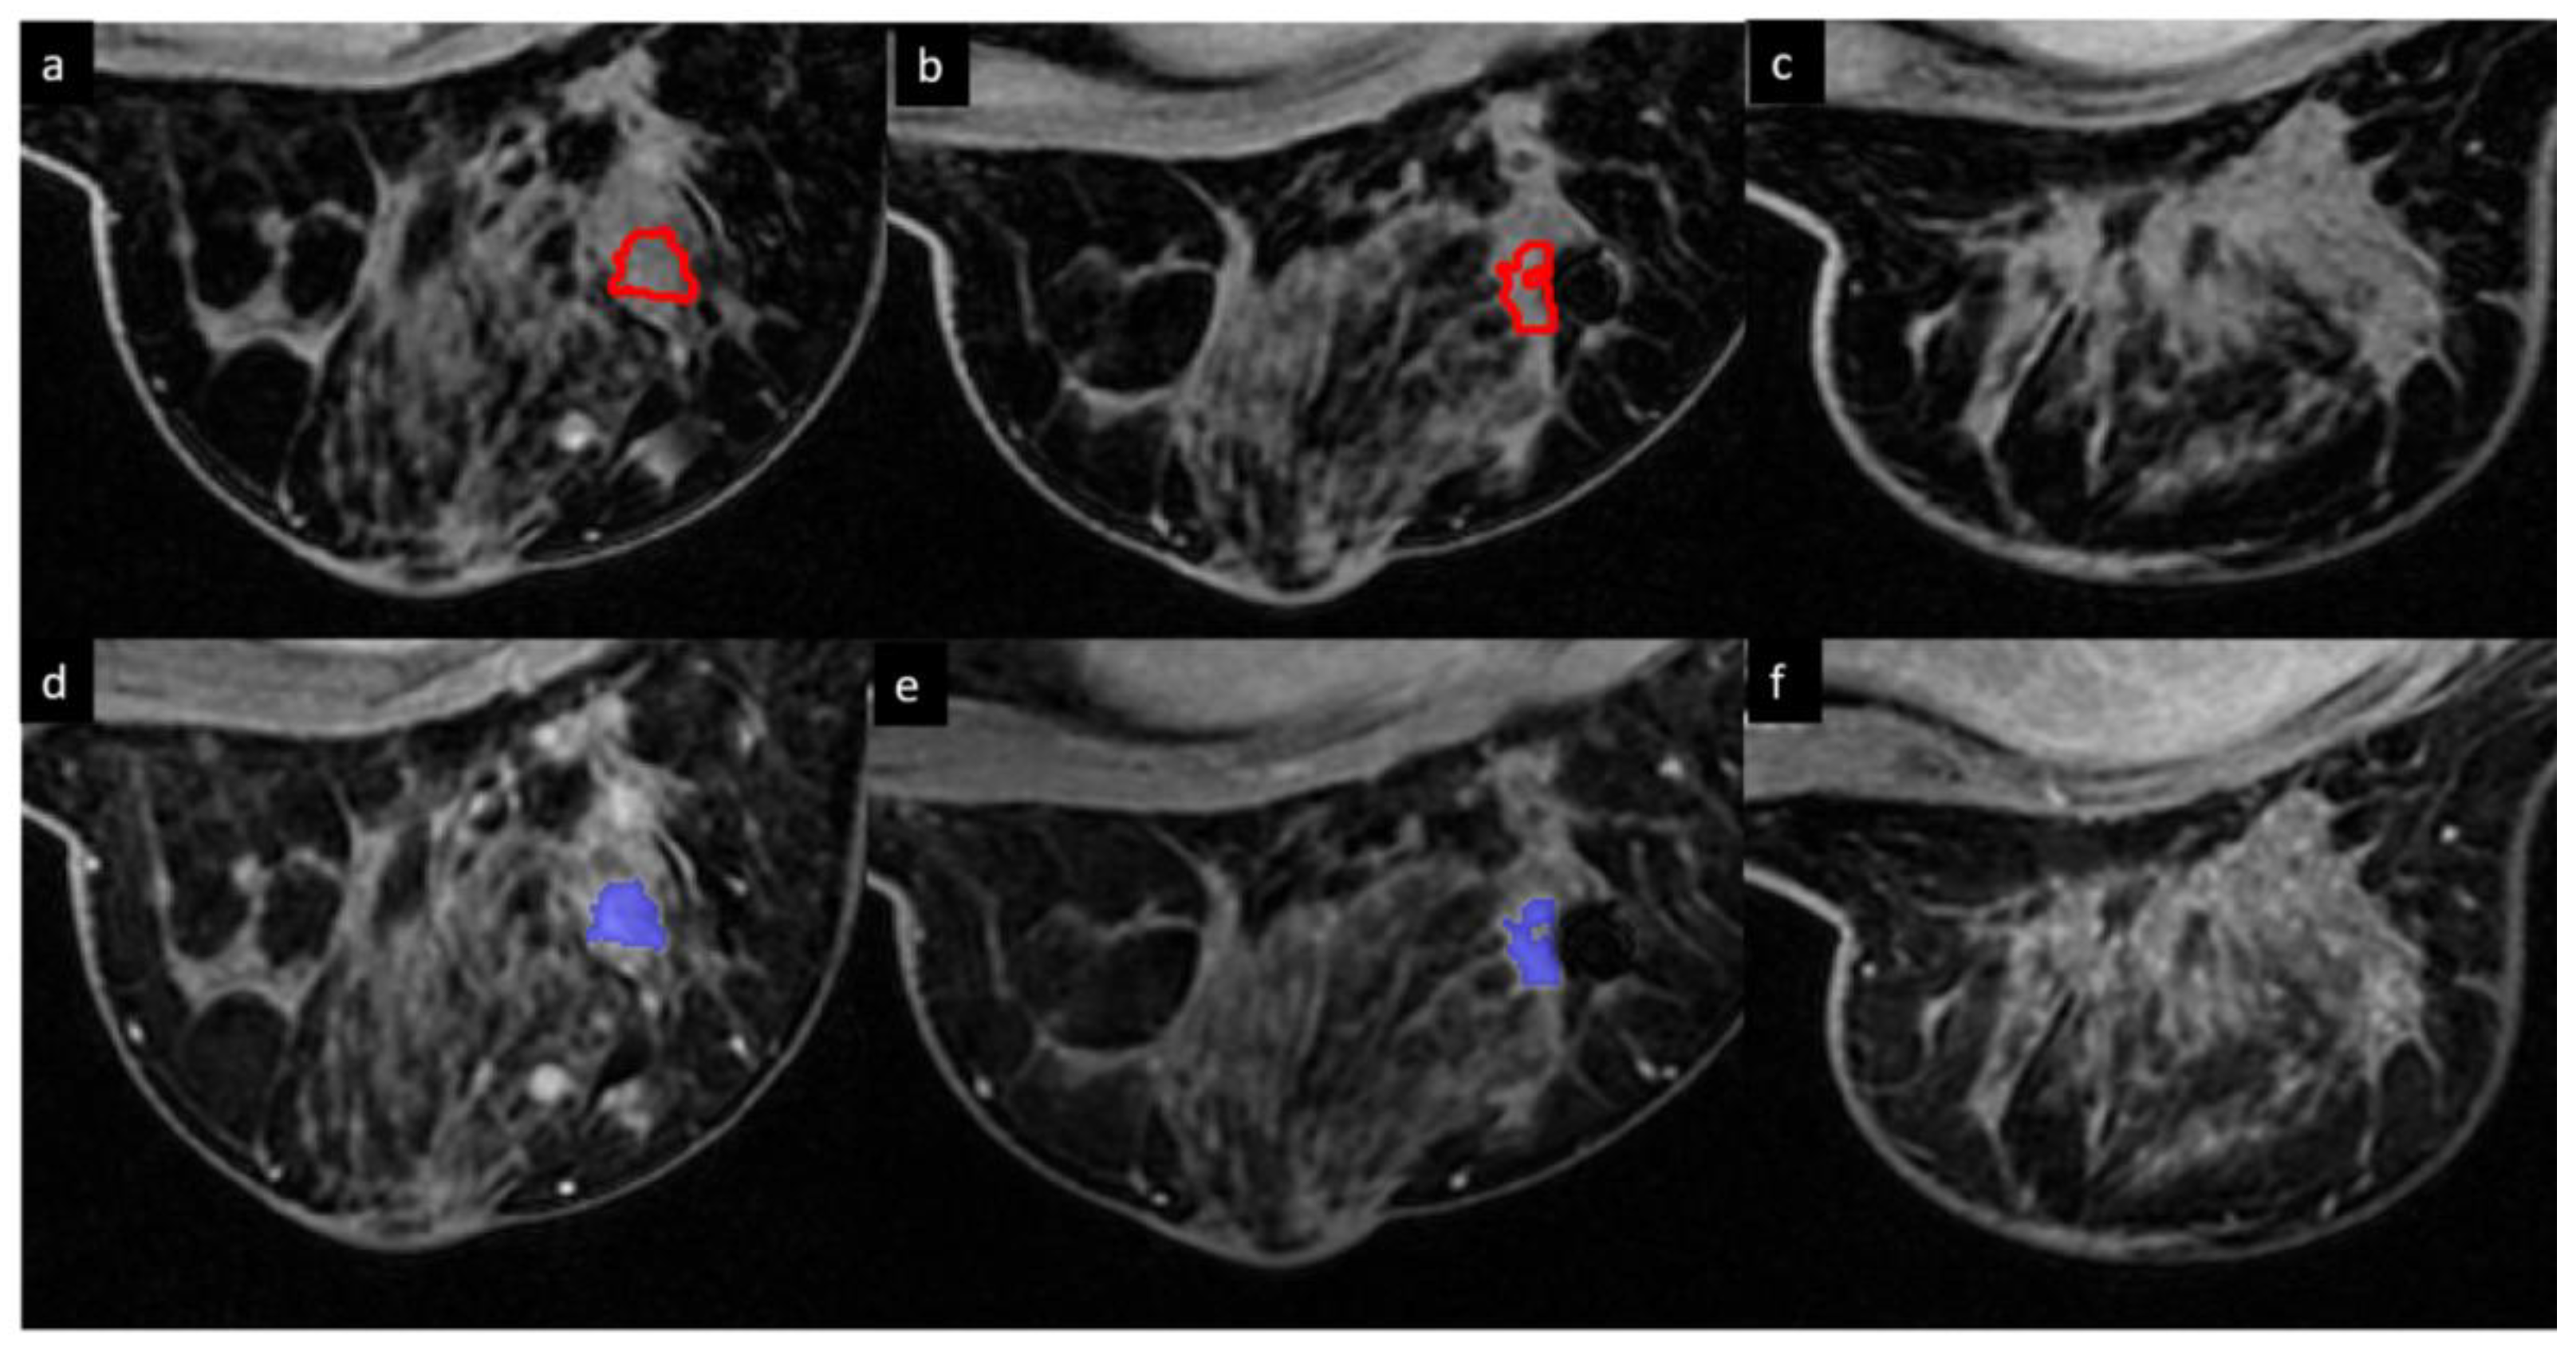
Figure 2 shows ETVs and FTVs of a representative tumor at baseline, C2, and C4.
The ETVs at the different phases (e.g., 1 min and 2.5 min) were calculated as follows:
For calculation of the FTV, the PE and the SER were defined as:
where S
Early, S
Pre-contrast, and S
Late are the pixel intensity of the early-phase (1 min or 2.5 min after contrast agent injection), pre-contrast-phase (before contrast agent injection), and late-phase (7 min after contrast agent injection) images, respectively [
29].
PE thresholds (from 0% to 220% in increments of 5%) and SER thresholds (from 0 to 2 in increments of 0.05) were predefined. For each combination of PE and SER thresholds, the number of ETV voxels with PE and SER above the threshold values was determined and multiplied by voxel volume to calculate FTV at 1 min and at 2.5 min:
For LD, TV, ETV, and FTV, relative changes between baseline and C2 (%C2/BL) were calculated as follows:
where C2 = measured values of LD, TV, ETV, or FTV after 2 cycles of NAST and BL = measured values of LD, TV, ETV, or FTV at baseline before NAST.
Similarly, relative changes between baseline and C4 (%C4/BL) were calculated for LD, TV, ETV, and FTV as follows:
where C4 = measured values of LD, TV, ETV, or FTV after 4 cycles of NAST and BL = measured values of LD, TV, ETV, or FTV at baseline before NAST.
2.4. Statistical Analysis
Volumetric measurements and LDs were compared between patients with pCR and patients with non-pCR by using the Mann–Whitney test and Fisher’s exact test. Analyses were conducted separately for baseline, C2, C4, %C2/BL, and %C4/BL measurements. For LD, TV, and ETV, area under the receiver operating characteristic curve (AUC) was measured to assess the performance in predicting pCR status. For FTV, 3D contour plots of the AUC by PE and SER were generated, and for each plot, the PE threshold and SER threshold corresponding to the maximum AUC were chosen as the optimal thresholds. For the cases with the maximum AUC corresponding to multiple PE and SER pairs, the pair with the minimum PE and SER values was chosen. FTV values corresponding to the optimal thresholds were then reported. The Mann–Whitney test was repeated to determine the statistical significance of the difference in the predictive performance of FTV at C2 and C4. p-values less than 0.05 were considered statistically significant. Statistical analysis was performed using R (version 4.0.3, R Development Core Team, Vienna, Austria).
3. Results
Patient characteristics are summarized in
Table 1. All patients had their largest primary tumor diameter greater than 1.5 cm. The mean (standard deviation (SD)) largest primary tumor diameter was 3.4 cm (1.6 cm), and the median (range) largest primary tumor diameter was 2.8 cm (1.2−9.6 cm). Of the 100 patients included in the study, 51 (51%) had non-pCR and 49 (49%) had pCR.
LD, TV, and ETV measurements are summarized in
Table 2 and FTV measurements are summarized in
Table 3.
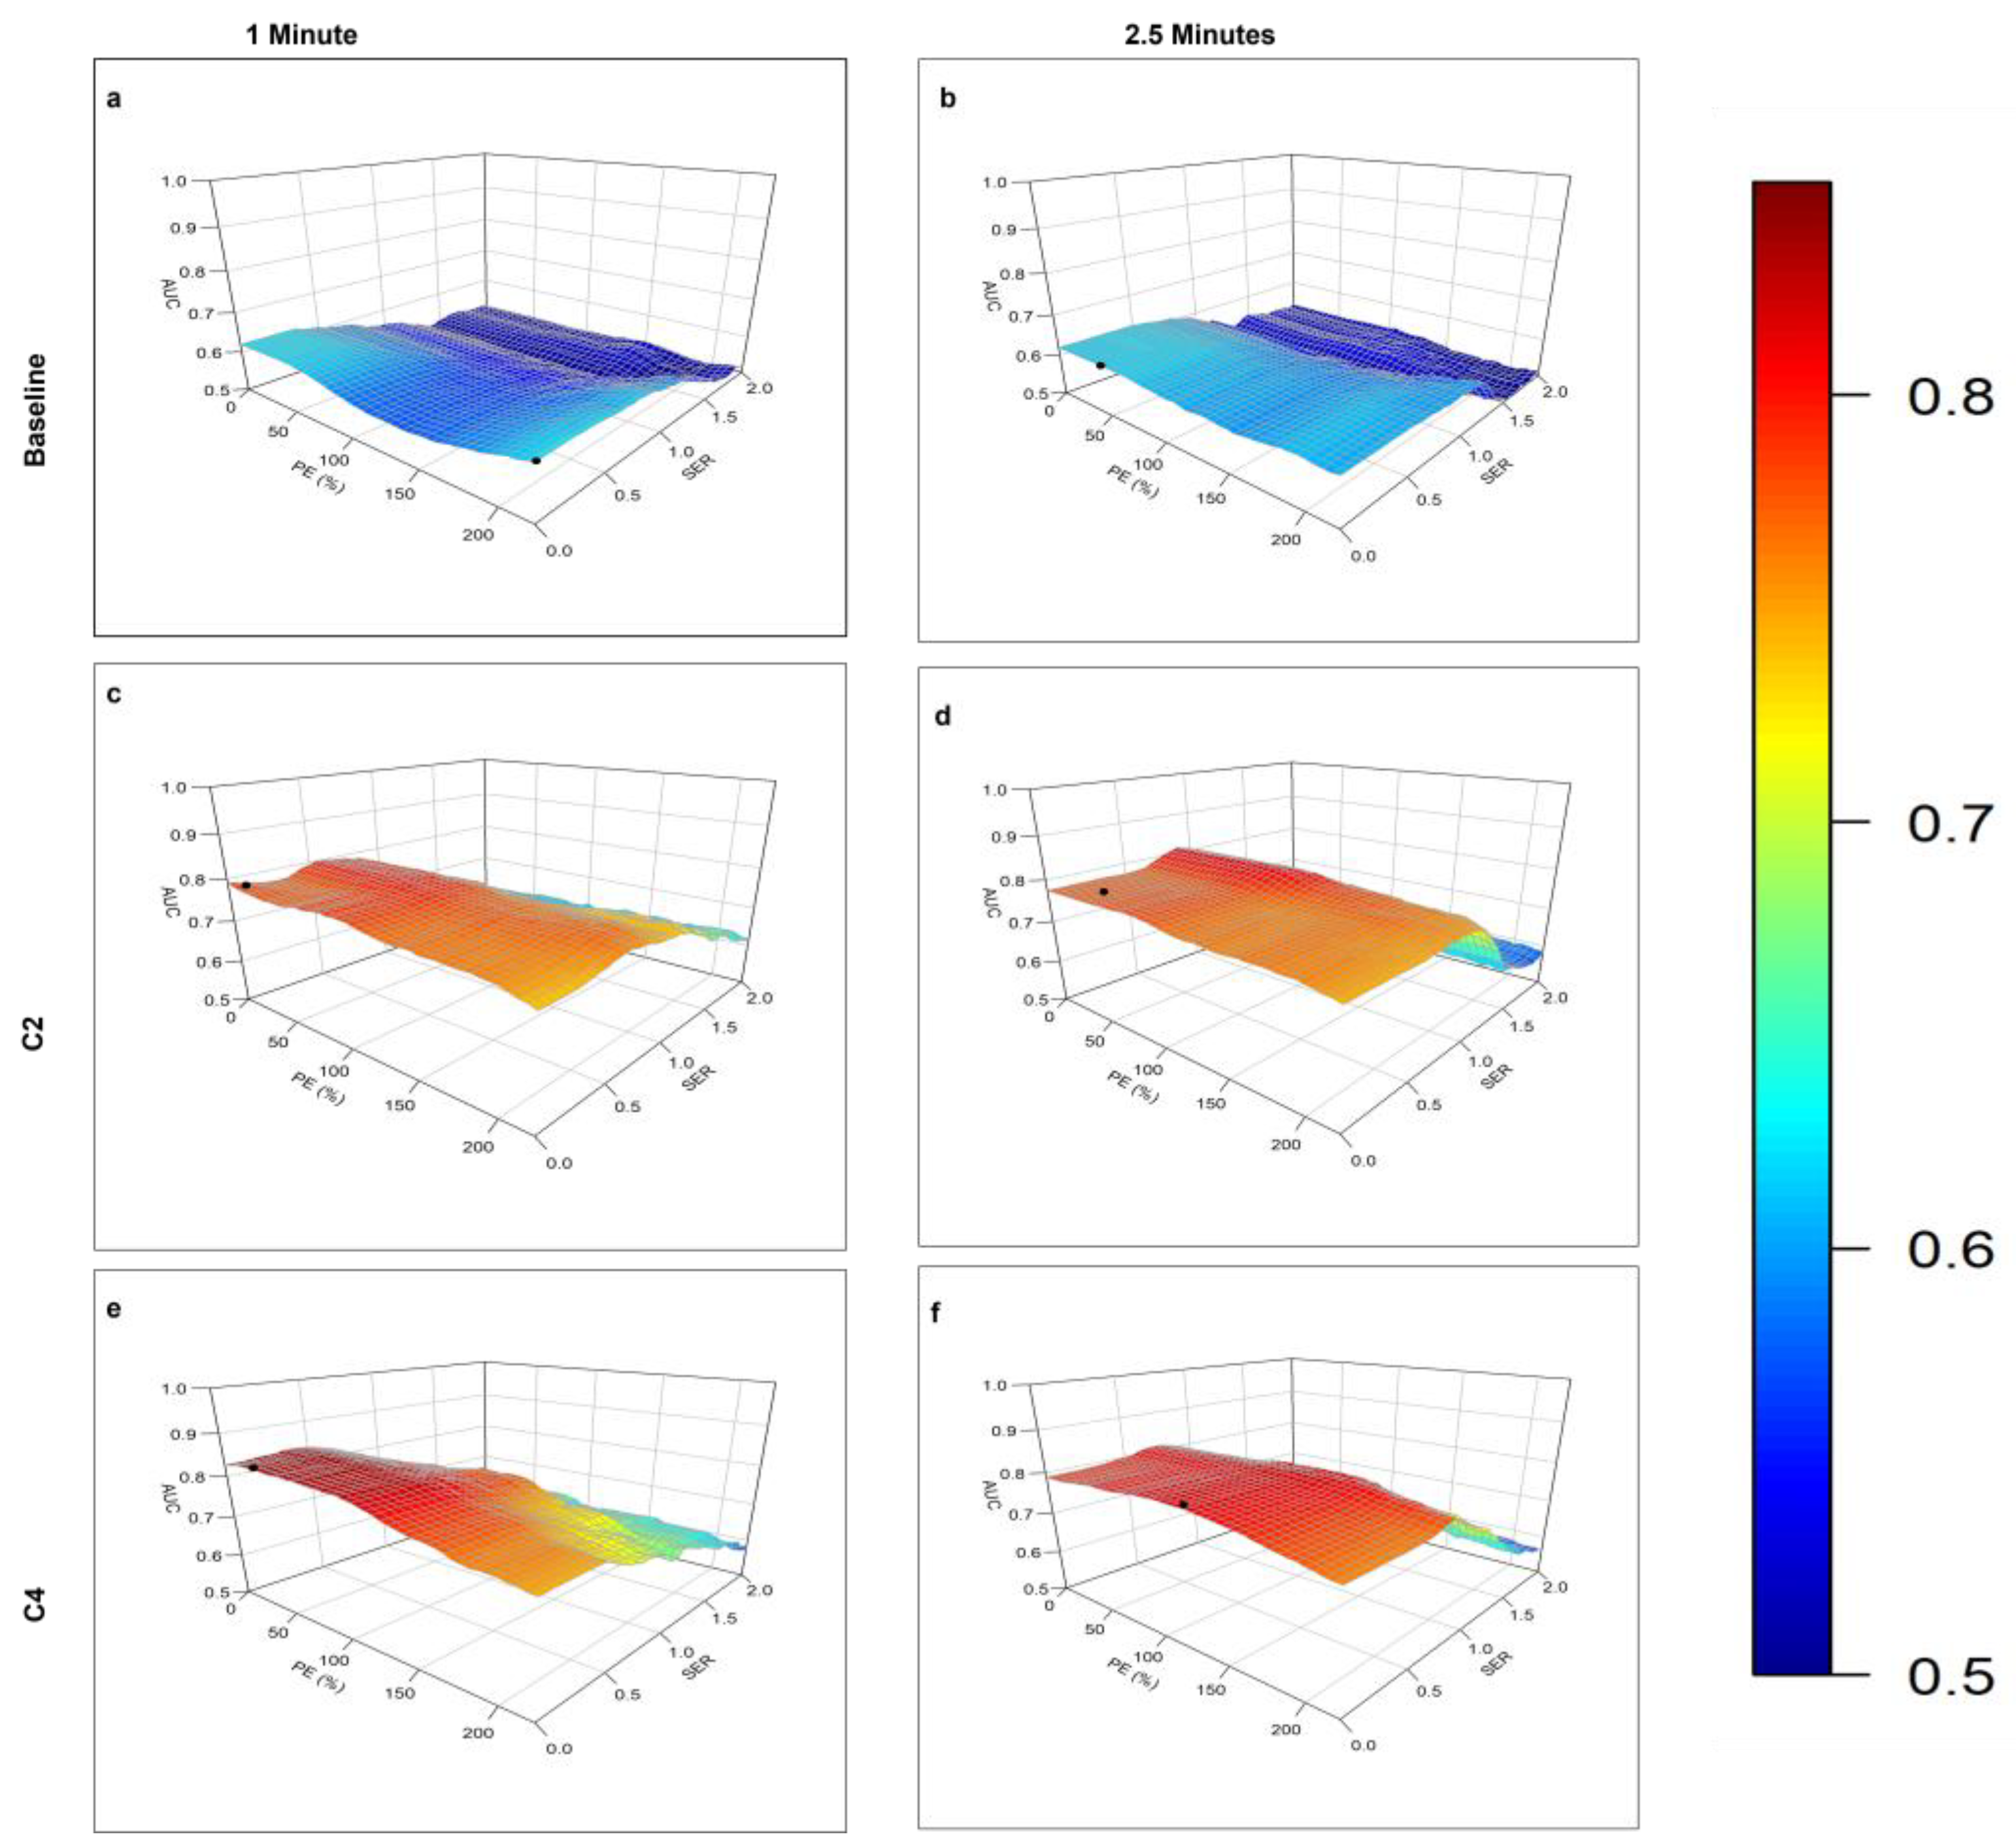
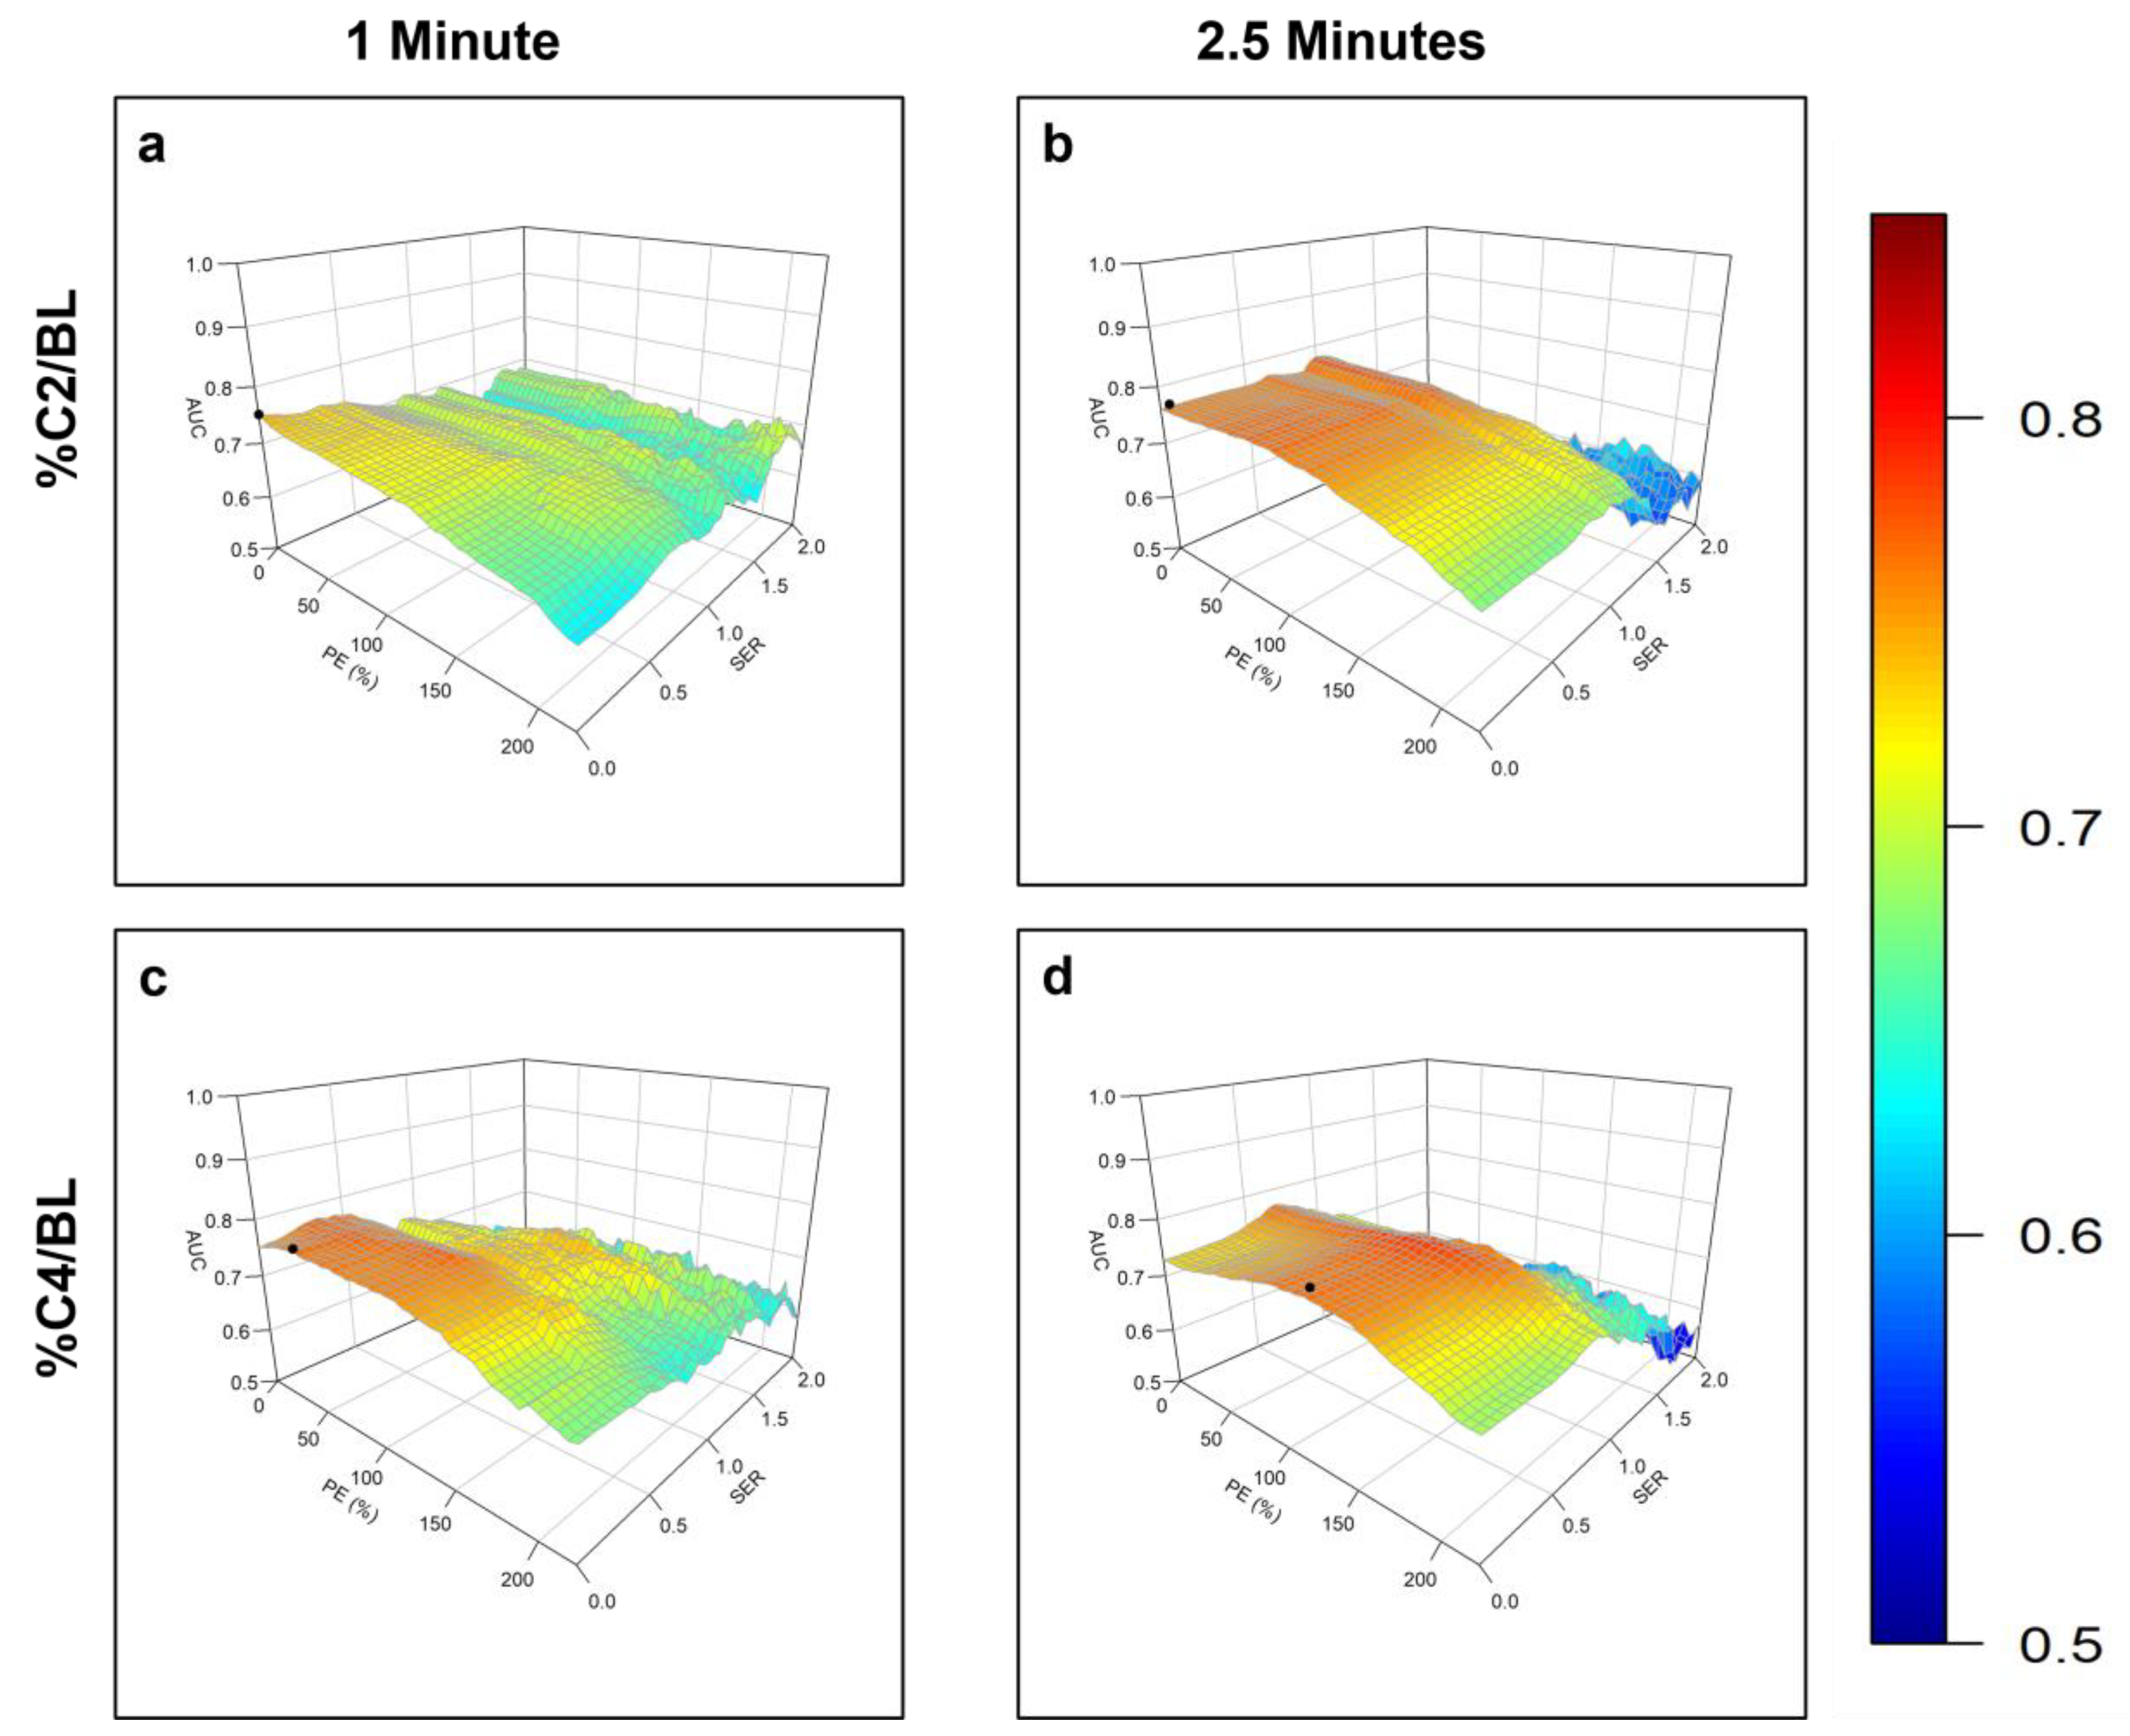
The contour plots of AUC vs. PE and SER for identification of the optimal PE and SER thresholds at different stages of NAST and for %C2/BL and %C4/BL are shown in
Figure 3 and
Figure 4.
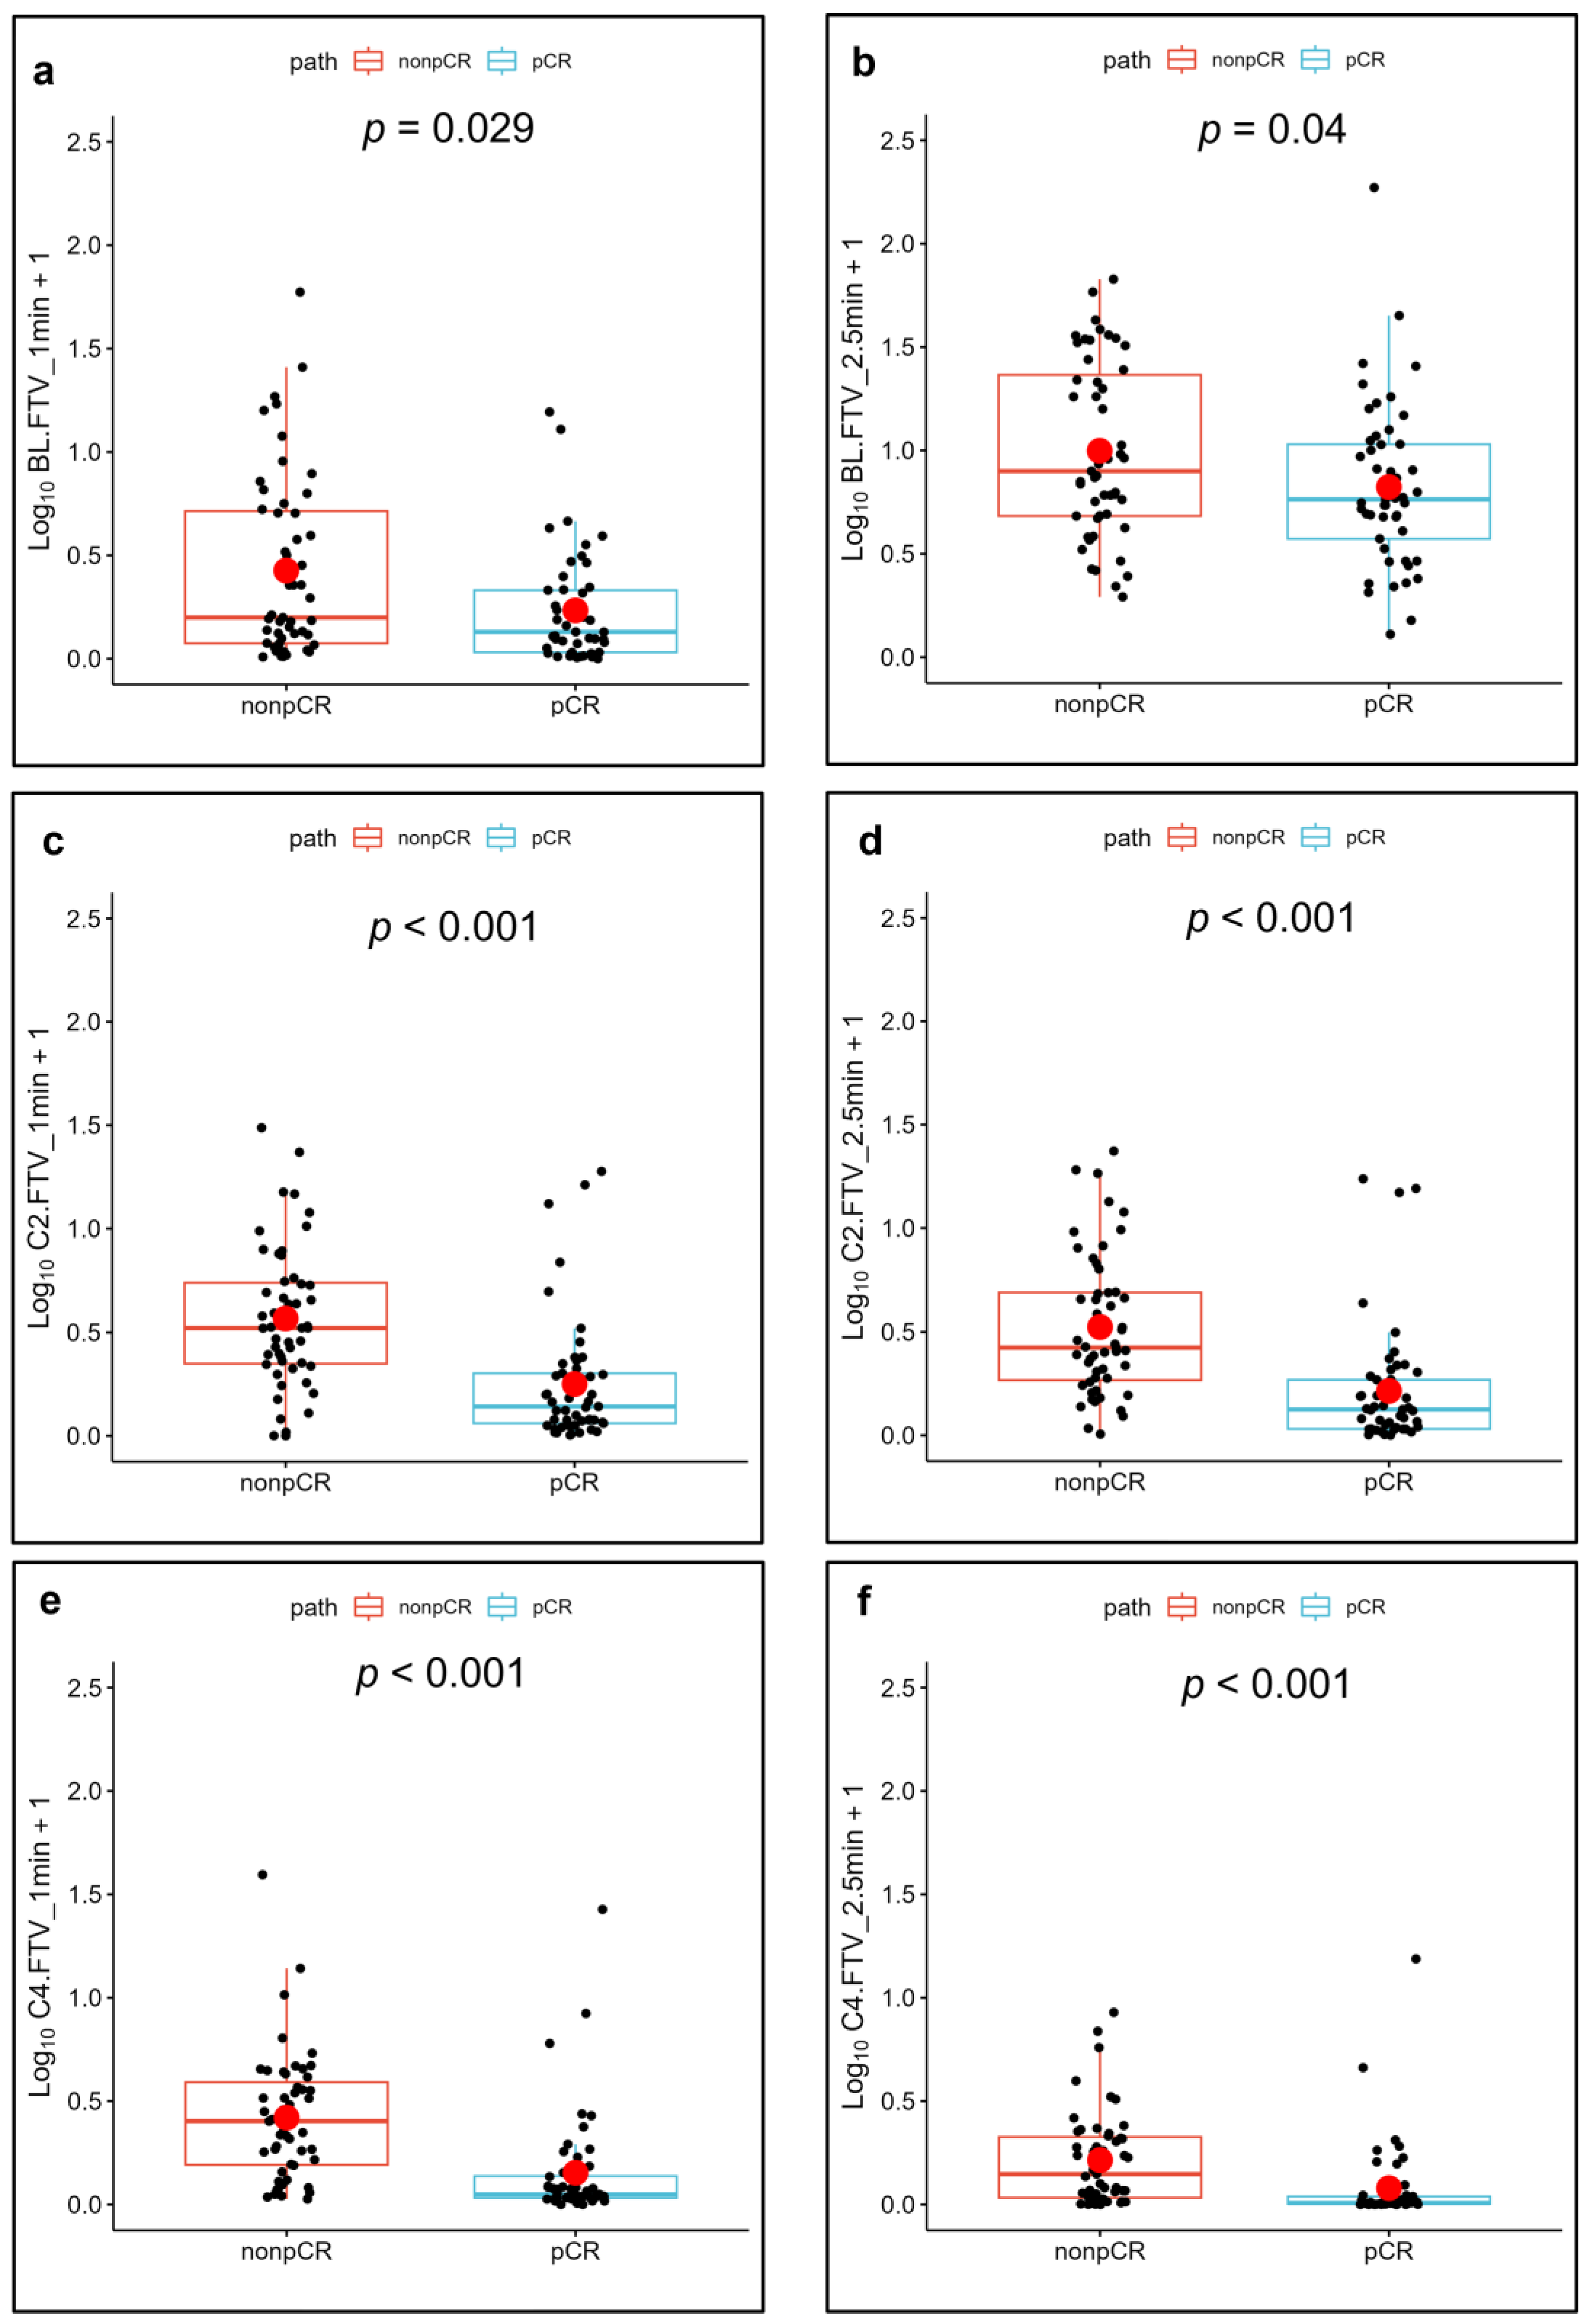
At baseline, all AUC measurements for LD, TV, ETV, and FTV were less than 0.70 (p value > 0.001, 95% confidence interval with minimum p value of 0.029 for FTV at 1 min). Thus, none of the measured parameters at baseline were statistically significant predictors of pCR. At C2 and C4, all the measured parameters along with their changes relative to baseline had AUCs greater than 0.70 (p < 0.001).
The best AUC at C2 was achieved with FTV at 2.5 min at threshold PE and SER values of 60% and 0.90, respectively (AUC = 0.82, p < 0.001). The best AUC at C4 was achieved with FTV at 1 min with PE and SER thresholds of 30% and 0.40, respectively (AUC = 0.84, p < 0.001).
The ETV measurement at 1 min at C4 yielded the highest AUC of 0.82. Among all the measurements of LD, TV, ETV, and FTV, the highest AUC of 0.84 (p < 0.001) was achieved by FTV at 1 min at C4 with PE and SER thresholds of 30% and 0.40, respectively.
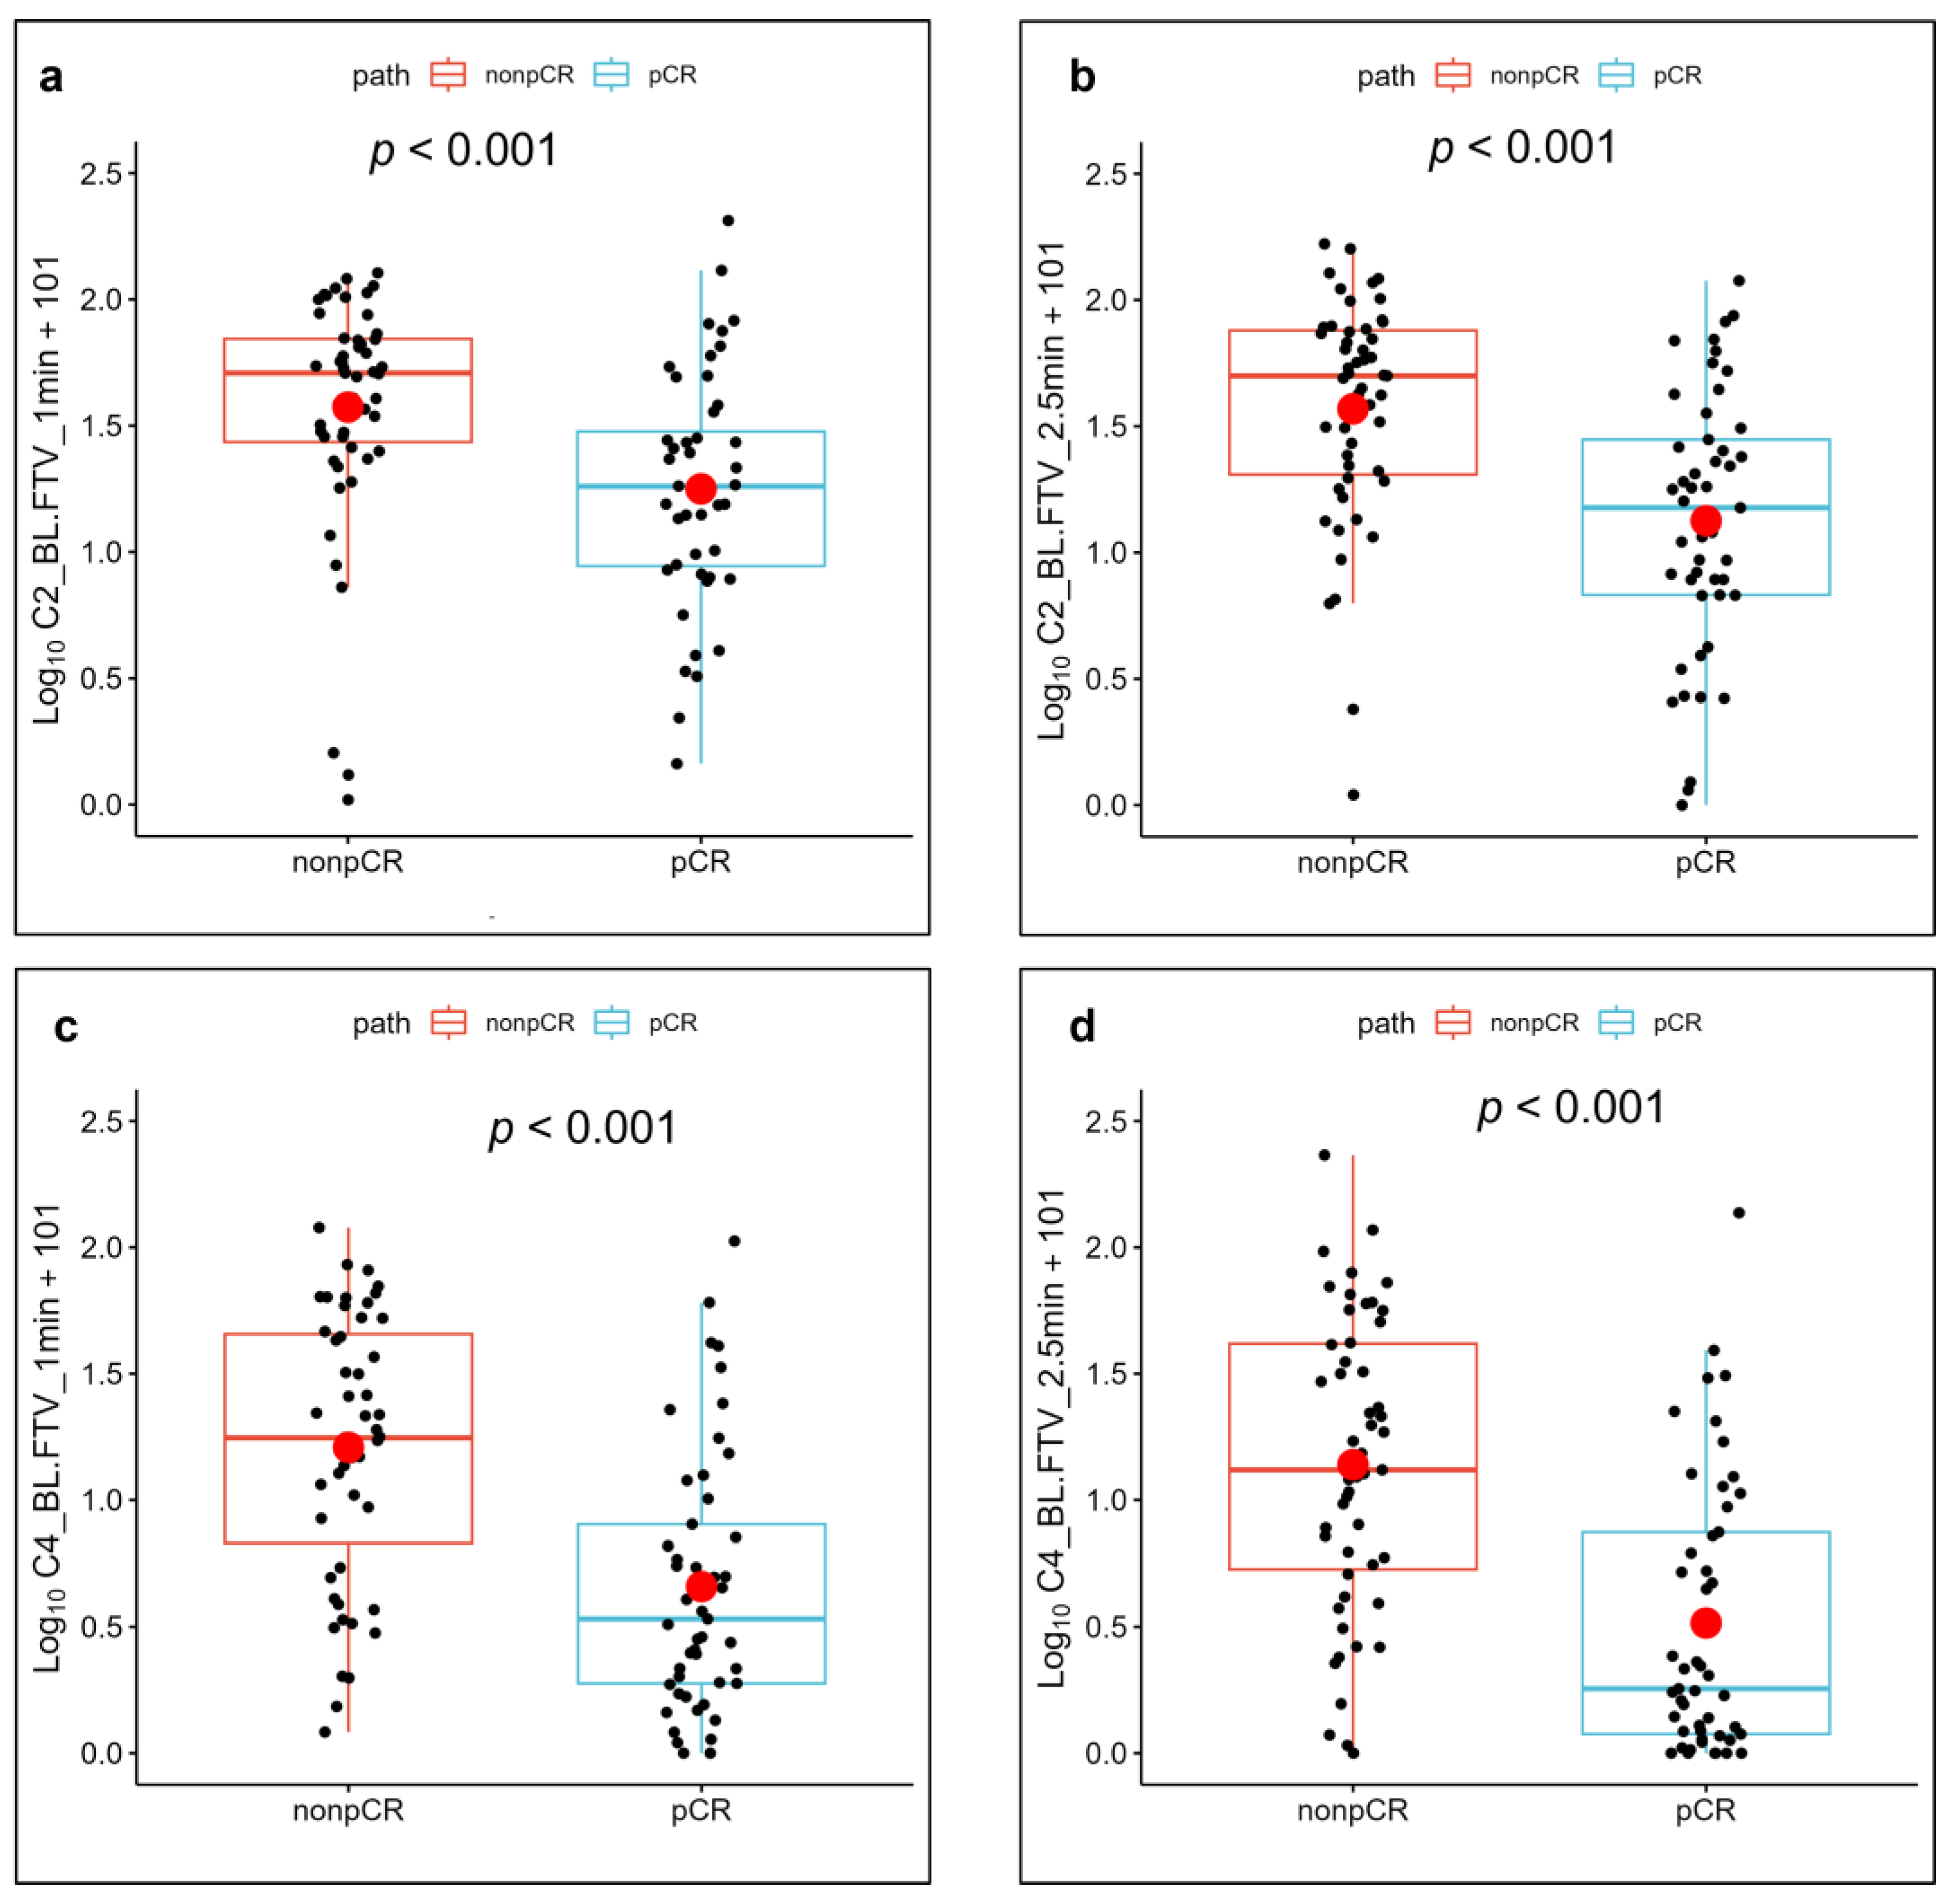
Figure 5 and
Figure 6 show the FTV measurements of the patients with a pCR and a non-pCR with their corresponding
p values.
Even though the measured AUC values for LD and TV were slightly higher for 1 min than for 7 min (
Table 2), the AUC values did not differ significantly between the 1 min and 7 min phases. Similarly, the AUC values for FTV did not differ significantly between the 1 min and 2.5 min phases (
Table 3).
Comparisons of the predictive performances of LD, TV, ETV, and FTV at C2 and C4 by using the Mann–Whitney test revealed no significant differences in the pCR predictions between C2 and C4 (p > 0.001, 95% CI, minimum p value of 0.063 for TV at 7 min).
4. Discussion
In our study, FTVs based on longitudinal DCE MRI at C2 and C4 were found to successfully differentiate patients with pCR from those with non-pCR among TNBC patients undergoing NAST. This study demonstrates that all the measured parameters—LD, TV, ETV, and FTV—showed a good correlation with treatment response at C2 and C4 and for %C2/BL and %C4/BL. Among all the volume measurements (TV, ETV, and FTV), FTV exhibited higher values of AUCs at most time points. Furthermore, the predictive performance of the volume measurements at C2 was similar to their performance at C4. In comparison, the volume measurements and LDs measured at BL were unable to predict the treatment response. This study also showed that the early time phases 1 min and 2.5 min measurements were not statistically significantly different in their predictive performances.
The importance of early prediction of treatment response and the role of MRI in assessing tumoral characteristics before and during different stages of treatment are well known. ETV and FTV measurements have been demonstrated to be important biomarkers in the assessment of response to NAST and the prediction of recurrence-free survival [
20,
21,
22,
28,
30]. However, we could find no published study comparing FTV after 2 cycles of NAST (early-on treatment) and after 4 cycles of NAST (mid treatment) as a treatment response predictor.
On the basis of the findings from the ACRIN 6657 trial in 230 patients with hormone receptor HR-positive/HER2-negative, HER2-positive, and HR-negative/HER2-negative (TNBC) breast cancer, Hylton et al. and Jafri et al. first reported FTV as an important biomarker in NAST treatment response assessment [
20,
21,
30]. Li et al. showed the effect of imaging contrast thresholds in the prediction of breast cancer response to NAST [
27]. For the 30 TNBC patients in their study, an AUC of 0.85 was reported for %C4/BL for FTV at 2.5 min with PE and SER threshold values of 140% and 0.0, respectively. In comparison, our study had a slightly lower AUC than that of Li et al. and showed a maximal AUC for %C4/BL for FTV at 2.5 min of 0.79 at threshold values of 125% and 0.70, respectively. Our study utilized a patient cohort approximately three times larger than that by Li et al., which could have contributed to the difference in AUCs observed in the results. Henderson et al. reported that the interim changes in ETV after 3 cycles of treatment exhibited better prediction of pathologic response than the interim changes in FTV [
22]. Our study found that FTV and the relative changes in FTV showed a higher AUC than ETV and the relative changes in ETV for most of the measurements. However, the difference observed in ETV and FTV was not statistically significant. In addition to the differences in patient populations, the differences in the results may be due to the fact that Henderson et al. used a single PE of 50% in calculating FTV, whereas we established and used an optimal set of PE and SER thresholds to produce a maximum AUC. Our results showed different PE and SER thresholds corresponding to the maximum AUC for different timepoints and parameters. The exact cause for the variation of PE and SER threshold corresponding to the maximum AUC and its clinical significance are unclear and may require further investigation. One plausible contributing factor is the change in tumor vascularity at different time points from the neoadjuvant systemic treatment. Musall et al. performed a study in 60 TNBC patients to analyze the predictive performances of LD, TV, ETV, and FTV calculated using DCE MRI images acquired 1 min and 2.5 min after contrast agent injection at baseline and C4 [
28]. The study reported FTV as the best performer among all the volume measurements, with an AUC of 0.85 (95% CI) for FTV at 1 min at C4. In addition, Musall et al. found that the early-phase timing of 1 min after contrast agent injection showed improved performance for predicting NAST response in TNBC in comparison to the early-phase timing of 2.5 min. There was an overlap of 17 (17%) study subjects between the patient population of Musall et al. and the patient population used in our study. Our results are in general agreement with the findings of the Musall study. However, we found that the FTV measurements at the early-phase timings of 1 min and 2.5 min after contrast agent injection had similar performance in predicting the response, even though the optimal thresholds of PE and SER were slightly different (
Table 3). More importantly, our study revealed that DCE MRI acquired at C2 and DCE MRI acquired at C4 predicted the response with similar high performance (
Table 3). Being able to predict patients’ response earlier in their treatment has the obvious advantage of enabling earlier changes in treatment, which may provide significant benefits to patients.
Our study has some limitations. First, the total size of our study population was limited which attenuated the power of the statistical analysis. We did, though, have 100 patients with TNBC who completed MRI at all three time points and underwent surgery with a pathologic confirmation of their treatment response. Second, our study was performed in a single institution and on a single MRI scanner platform. Therefore, our findings need to be validated for their robustness across different scanner platforms and in a multi-institution setting. Finally, the quantitative TV measurements relied on manual tumor segmentation by radiologists. The effect of inter-reader agreement in tumor segmentation and its impact on the predictive performances of LD, TV, ETV, and FTV was not investigated in this study.
Our study was limited to three time points—baseline, C2, and C4. The appreciable differences observed in the results between baseline and at C2 implies that it is not only the drug-induced mutation resistance, but rather the presence of a significant number of pre-existing cells resistant to the NAST, that influences the patient’s treatment response. Future work may include the analysis of images obtained after a single cycle of NAST.
5. Conclusions
FTV measurements from DCE MRI are useful biomarkers for discriminating TNBC patients with pCR and non-pCR to NAST. In particular, FTVs by DCE MRI after 2 cycles of treatment are able to predict the treatment response with high performance similar to that of FTVs after 4 cycles of treatment, thus providing an earlier opportunity for modifying the patient’s treatment course if warranted. Furthermore, both early phases—1 min and 2.5 min—showed similar predictive performances.
Author Contributions
Conceptualization, B.P., J.M. and G.M.R.; Data curation, B.E.A. and R.P.C.; Formal analysis, B.P., M.B., H.C., R.M.M., B.C.M., S.P., J.B.S., Z.X., J.M. and G.M.R.; Investigation, B.P., J.M. and G.M.R.; Methodology, B.P., B.E.A., R.P.C., M.S.G., M.B., R.M.M., B.C.M., S.P., J.B.S., Z.X., J.M. and G.M.R.; Supervision, J.M. and G.M.R.; Writing—original draft preparation, B.P.; Writing—review and editing, B.E.A., R.P.C., M.S.G., C.Y., K.K.H., L.H., K.-P.H., A.K., D.L.L., H.C.L.-P., J.W.T.L., J.K.L., M.M.P., F.P., A.T., V.V., P.W., J.W., L.P., D.T., W.Y., J.M. and G.M.R. All authors have read and agreed to the published version of the manuscript.
Funding
This study was supported by the NIH/NCI under award number P30CA016672.
Institutional Review Board Statement
The study was conducted in accordance with the Declaration of Helsinki and approved by the Institutional Review Board of The University of Texas M D Anderson Cancer Center (Protocol code: 2014-0185 and date of approval: 16 July 2014).
Informed Consent Statement
Written informed consent was received from all patients.
Data Availability Statement
Data are available from the corresponding author upon request.
Acknowledgments
Resources from the Department of Biostatistics Resource Group were used to conduct this research. We acknowledge the support from MD Anderson’s Moon Shots Program and the Robert D. Moreton Distinguished Chair Funds in Diagnostic Radiology. We thank Stephanie Deming, senior scientific editor, Research Medical Library, for editing the manuscript.
Conflicts of Interest
We would like to make the following disclosures: K.K.H. serves on the medical advisory boards for ArmadaHealth and AstraZeneca and receives research funding from Cairn Surgical, Eli Lilly and Company, and Lumicell. K.H. is currently receiving research funding from Siemens Healthineers and has received research funding from GE Healthcare. J.K.L. received grant or research support from Novartis, Medivation/Pfizer, Genentech, GSK, EMD-Serono, AstraZeneca, Medimmune, Zenith, and Merck; participated in the Speaker’s Bureau for MedLearning, Physicians’ Education Resource, Prime Oncology, Medscape, Clinical Care Options, and Medpage and receives royalty from UpToDate. The spouse of A.T works for Eli Lilly and Company. D.T. declares research contracts with Pfizer, Novartis, and Ployphor and is a consultant of AstraZeneca, GlaxoSmithKline, OncoPep, Gilead, Novartis, Pfizer, Personalis, and Sermonix. W.Y. receives royalties from Elsevier. J.M. is a consultant of C4 Imaging L.L.C. and an inventor of United States’ patents licensed to Siemens Healthineers and GE Healthcare. G.M.R. receives research funding from GE Healthcare. No conflicts of interest were declared for the remaining authors. The funders had no role in the design of the study; in the collection, analyses, or interpretation of data; in the writing of the manuscript; or in the decision to publish the results.
References
- Kumar, P.; Aggarwal, R. An overview of triple-negative breast cancer. Arch. Gynecol. Obstet. 2016, 293, 247–269. [Google Scholar]
- Samphao, S.; Eremin, J.; El-Sheemy, M.; Eremin, O.; Eremin, J.M. Treatment of established breast cancer in post-menopausal women: Role of aromatase inhibitors. Surgeon 2009, 7, 42–55. [Google Scholar] [CrossRef] [PubMed]
- Liedtke, C.; Mazouni, C.; Hess, K.R.; André, F.; Tordai, A.; Mejia, J.A.; Symmans, W.F.; Gonzalez-Angulo, A.M.; Hennessy, B.; Green, M. Response to neoadjuvant therapy and long-term survival in patients with triple-negative breast cancer. J. Clin. Oncol. 2008, 26, 1275–1281. [Google Scholar] [CrossRef]
- Mus, R.D.; Borelli, C.; Bult, P.; Weiland, E.; Karssemeijer, N.; Barentsz, J.O.; Gubern-Mérida, A.; Platel, B.; Mann, R.M. Time to enhancement derived from ultrafast breast MRI as a novel parameter to discriminate benign from malignant breast lesions. Eur. J. Radiol. 2017, 89, 90–96. [Google Scholar] [CrossRef]
- Arasu, V.A.; Chen, R.C.; Newitt, D.N.; Chang, C.B.; Tso, H.; Hylton, N.M.; Joe, B.N. Can signal enhancement ratio (SER) reduce the number of recommended biopsies without affecting cancer yield in occult MRI-detected lesions? Acad. Radiol. 2011, 18, 716–721. [Google Scholar] [CrossRef]
- Onishi, N.; Sadinski, M.; Hughes, M.C.; Ko, E.S.; Gibbs, P.; Gallagher, K.M.; Fung, M.M.; Hunt, T.J.; Martinez, D.F.; Shukla-Dave, A. Ultrafast dynamic contrast-enhanced breast MRI may generate prognostic imaging markers of breast cancer. Breast Cancer Res. 2020, 22, 1–13. [Google Scholar] [CrossRef]
- Turnbull, L.W. Dynamic contrast-enhanced MRI in the diagnosis and management of breast cancer. NMR Biomed. 2009, 22, 28–39. [Google Scholar] [CrossRef]
- Heldahl, M.G.; Bathen, T.F.; Rydland, J.; Kvistad, K.A.; Lundgren, S.; Gribbestad, I.S.; Goa, P.E. Prognostic value of pretreatment dynamic contrast-enhanced MR imaging in breast cancer patients receiving neoadjuvant chemotherapy: Overall survival predicted from combined time course and volume analysis. Acta Radiol. 2010, 51, 604–612. [Google Scholar] [CrossRef]
- Ah-See, M.-L.W.; Makris, A.; Taylor, N.J.; Harrison, M.; Richman, P.I.; Burcombe, R.J.; Stirling, J.J.; d’Arcy, J.A.; Collins, D.J.; Pittam, M.R. Early changes in functional dynamic magnetic resonance imaging predict for pathologic response to neoadjuvant chemotherapy in primary breast cancer. Clin. Cancer Res. 2008, 14, 6580–6589. [Google Scholar] [CrossRef]
- Padhani, A.R.; Hayes, C.; Assersohn, L.; Powles, T.; Makris, A.; Suckling, J.; Leach, M.O.; Husband, J.E. Prediction of clinicopathologic response of breast cancer to primary chemotherapy at contrast-enhanced MR imaging: Initial clinical results. Radiology 2006, 239, 361–374. [Google Scholar] [CrossRef]
- Heldahl, M.G.; Lundgren, S.; Jensen, L.R.; Gribbestad, I.S.; Bathen, T.F. Monitoring neoadjuvant chemotherapy in breast cancer patients: Improved MR assessment at 3 T? J. Magn. Reson. Imaging 2011, 34, 547–556. [Google Scholar] [CrossRef]
- Cho, N.; Im, S.-A.; Park, I.-A.; Lee, K.-H.; Li, M.; Han, W.; Noh, D.-Y.; Moon, W.K. Breast cancer: Early prediction of response to neoadjuvant chemotherapy using parametric response maps for MR imaging. Radiology 2014, 272, 385–396. [Google Scholar] [CrossRef]
- Partridge, S.C.; Gibbs, J.E.; Lu, Y.; Esserman, L.J.; Tripathy, D.; Wolverton, D.S.; Rugo, H.S.; Hwang, E.S.; Ewing, C.A.; Hylton, N.M. MRI measurements of breast tumor volume predict response to neoadjuvant chemotherapy and recurrence-free survival. Am. J. Roentgenol. 2005, 184, 1774–1781. [Google Scholar] [CrossRef]
- Fangberget, A.; Nilsen, L.; Hole, K.H.; Holmen, M.; Engebraaten, O.; Naume, B.; Smith, H.-J.; Olsen, D.R.; Seierstad, T. Neoadjuvant chemotherapy in breast cancer-response evaluation and prediction of response to treatment using dynamic contrast-enhanced and diffusion-weighted MR imaging. Eur. Radiol. 2011, 21, 1188–1199. [Google Scholar] [CrossRef]
- Woolf, D.K.; Padhani, A.R.; Taylor, N.J.; Gogbashian, A.; Li, S.P.; Beresford, M.J.; Ah-See, M.-L.; Stirling, J.; Collins, D.J.; Makris, A. Assessing response in breast cancer with dynamic contrast-enhanced magnetic resonance imaging: Are signal intensity–time curves adequate? Breast Cancer Res. Treat. 2014, 147, 335–343. [Google Scholar] [CrossRef]
- Parikh, J.; Selmi, M.; Charles-Edwards, G.; Glendenning, J.; Ganeshan, B.; Verma, H.; Mansi, J.; Harries, M.; Tutt, A.; Goh, V. Changes in primary breast cancer heterogeneity may augment midtreatment MR imaging assessment of response to neoadjuvant chemotherapy. Radiology 2014, 272, 100–112. [Google Scholar] [CrossRef]
- Henderson, S.; Purdie, C.; Michie, C.; Evans, A.; Lerski, R.; Johnston, M.; Vinnicombe, S.; Thompson, A.M. Interim heterogeneity changes measured using entropy texture features on T2-weighted MRI at 3.0 T are associated with pathological response to neoadjuvant chemotherapy in primary breast cancer. Eur. Radiol. 2017, 27, 4602–4611. [Google Scholar] [CrossRef]
- Jahani, N.; Cohen, E.; Hsieh, M.-K.; Weinstein, S.P.; Pantalone, L.; Hylton, N.; Newitt, D.; Davatzikos, C.; Kontos, D. Prediction of treatment response to neoadjuvant chemotherapy for breast cancer via early changes in tumor heterogeneity captured by DCE-MRI registration. Sci. Rep. 2019, 9, 1–12. [Google Scholar] [CrossRef]
- Newitt, D.C.; Aliu, S.O.; Witcomb, N.; Sela, G.; Kornak, J.; Esserman, L.; Hylton, N.M. Real-time measurement of functional tumor volume by MRI to assess treatment response in breast cancer neoadjuvant clinical trials: Validation of the Aegis SER software platform. Transl. Oncol. 2014, 7, 94–100. [Google Scholar] [CrossRef]
- Hylton, N.M.; Blume, J.D.; Bernreuter, W.K.; Pisano, E.D.; Rosen, M.A.; Morris, E.A.; Weatherall, P.T.; Lehman, C.D.; Newstead, G.M.; Polin, S. Locally advanced breast cancer: MR imaging for prediction of response to neoadjuvant chemotherapy—Results from ACRIN 6657/I-SPY TRIAL. Radiology 2012, 263, 663–672. [Google Scholar] [CrossRef]
- Hylton, N.M.; Gatsonis, C.A.; Rosen, M.A.; Lehman, C.D.; Newitt, D.C.; Partridge, S.C.; Bernreuter, W.K.; Pisano, E.D.; Morris, E.A.; Weatherall, P.T. Neoadjuvant chemotherapy for breast cancer: Functional tumor volume by MR imaging predicts recurrence-free survival—Results from the ACRIN 6657/CALGB 150007 I-SPY 1 TRIAL. Radiology 2016, 279, 44–55. [Google Scholar] [CrossRef] [Green Version]
- Henderson, S.A.; Muhammad Gowdh, N.; Purdie, C.A.; Jordan, L.B.; Evans, A.; Brunton, T.; Thompson, A.M.; Vinnicombe, S. Breast cancer: Influence of tumour volume estimation method at MRI on prediction of pathological response to neoadjuvant chemotherapy. Br. J. Radiol. 2018, 91, 20180123. [Google Scholar] [CrossRef]
- Li, K.L.; Henry, R.G.; Wilmes, L.J.; Gibbs, J.; Zhu, X.; Lu, Y.; Hylton, N.M. Kinetic assessment of breast tumors using high spatial resolution signal enhancement ratio (SER) imaging. Magn. Reson. Med. 2007, 58, 572–581. [Google Scholar] [CrossRef] [PubMed]
- Li, K.L.; Partridge, S.C.; Joe, B.N.; Gibbs, J.E.; Lu, Y.; Esserman, L.J.; Hylton, N.M. Invasive breast cancer: Predicting disease recurrence by using high-spatial-resolution signal enhancement ratio imaging. Radiology 2008, 248, 79–87. [Google Scholar] [CrossRef] [PubMed]
- Jones, E.F.; Sinha, S.P.; Newitt, D.C.; Klifa, C.; Kornak, J.; Park, C.C.; Hylton, N.M. MRI enhancement in stromal tissue surrounding breast tumors: Association with recurrence free survival following neoadjuvant chemotherapy. PLoS ONE 2013, 8, e61969. [Google Scholar] [CrossRef]
- Luo, J.; Johnston, B.S.; Kitsch, A.E.; Hippe, D.S.; Korde, L.A.; Javid, S.; Lee, J.M.; Peacock, S.; Lehman, C.D.; Partridge, S.C.; et al. Ductal Carcinoma in Situ: Quantitative Preoperative Breast MR Imaging Features Associated with Recurrence after Treatment. Radiology 2017, 285, 788–797. [Google Scholar] [CrossRef]
- Li, W.; Arasu, V.; Newitt, D.C.; Jones, E.F.; Wilmes, L.; Gibbs, J.; Kornak, J.; Joe, B.N.; Esserman, L.J.; Hylton, N.M. Effect of MR imaging contrast thresholds on prediction of neoadjuvant chemotherapy response in breast cancer subtypes: A subgroup analysis of the ACRIN 6657/I-SPY 1 TRIAL. Tomography 2016, 2, 378–387. [Google Scholar] [CrossRef]
- Musall, B.C.; Abdelhafez, A.H.; Adrada, B.E.; Candelaria, R.P.; Mohamed, R.M.; Boge, M.; Le-Petross, H.; Arribas, E.; Lane, D.L.; Spak, D.A. Functional Tumor Volume by Fast Dynamic Contrast-Enhanced MRI for Predicting Neoadjuvant Systemic Therapy Response in Triple-Negative Breast Cancer. J. Magn. Reson. Imaging 2021, 54, 251–260. [Google Scholar] [CrossRef] [PubMed]
- Partridge, S.C.; Gibbs, J.E.; Lu, Y.; Esserman, L.J.; Sudilovsky, D.; Hylton, N.M. Accuracy of MR imaging for revealing residual breast cancer in patients who have undergone neoadjuvant chemotherapy. Am. J. Roentgenol. 2002, 179, 1193–1199. [Google Scholar] [CrossRef]
- Jafri, N.F.; Newitt, D.C.; Kornak, J.; Esserman, L.J.; Joe, B.N.; Hylton, N.M. Optimized breast MRI functional tumor volume as a biomarker of recurrence-free survival following neoadjuvant chemotherapy. J. Magn. Reson. Imaging 2014, 40, 476–482. [Google Scholar] [CrossRef] [Green Version]
Figure 1.
Flow chart shows the workflow of data acquisition, image processing, tumor segmentation, and measurement.
Figure 1.
Flow chart shows the workflow of data acquisition, image processing, tumor segmentation, and measurement.
Figure 2.
Enhanced tumor volumes (red) and functional tumor volumes (blue) in a 61-year-old patient with TNBC with a pathologic complete response at surgery. (a,d) Baseline. (b,e) After 2 cycles of neoadjuvant systemic therapy (NAST). (c,f) After 4 cycles of NAST. No segmentation was performed after 4 cycles since there was no residual tumor enhancement at that time. Functional tumor volume (bottom row) is the subset of enhanced tumor volume (top row), satisfying the PE and SER thresholds.
Figure 3.
Plots of the area under the receiver operating characteristic curve (AUC) for response prediction as a function of the percentage enhancement (PE) and signal enhancement ratio (SER) used to calculate the functional tumor volume on DCE MRI images obtained (a,b) at baseline, 1 min (a), and 2.5 min (b) after contrast agent injection; (c,d) after 2 cycles of neoadjuvant systemic therapy (NAST), at 1 min (c), and 2.5 min (d) after contrast agent injection; and (e,f) after 4 cycles of NAST, at 1 min (e), and 2.5 min (f) after contrast agent injection. In each case, the PE–SER combination with maximum AUC (black circle) was selected as the optimal threshold.
Figure 4.
Plots of the area under the receiver operating characteristic curve (AUC) for response prediction as a function of the percentage enhancement (PE) and signal enhancement ratio (SER) used to calculate the functional tumor volume for relative changes between baseline and after 2 cycles of neoadjuvant systemic therapy (C2) (%C2/BL), and between baseline and after 4 cycles of neoadjuvant systemic therapy (C4) (%C4/BL): (a) %C2/BL per the early phase at 1 min, (b) %C2/BL per the early phase at 2.5 min, (c) %C4/BL per the early phase at 1 min, and (d) %C4/BL per the early phase at 2.5 min after contrast agent injection. In each case, the PE–SER combination with maximum AUC (black circle) was selected as the optimal threshold.
Figure 5.
Functional tumor volume (FTV) plots and their mean (red circle) corresponding to optimal percentage enhancement (PE) and signal enhancement ratio (SER) for patients with pathologic complete response (pCR) and non-pCR. Plots correspond to images obtained (a,b) at baseline (BL), 1 min (a), and 2.5 min (b) after contrast agent injection; (c,d) after the second cycle of neoadjuvant systemic therapy (NAST) (C2), at 1 min (c), and 2.5 min (d) after contrast agent injection; and (e,f) after the fourth cycle of NAST (C4), at 1 min (e), and 2.5 min (f) after contrast agent injection.
Figure 6.
Relative changes in the functional tumor volume (FTV) measurements and their mean (red circle) corresponding to optimal percentage enhancement (PE) and signal enhancement ratio (SER) for patients with pathologic complete response (pCR) and non-pCR. Plots correspond to (a,b) changes in FTV from baseline (BL) to after the second cycle of neoadjuvant systemic therapy (NAST) (C2), measured on images obtained 1 min (a) and 2.5 min (b) after contrast agent injection; and (c,d) changes in FTV from baseline to after the fourth cycle of NAST (C4), measured on images obtained 1 min (c) and 2.5 min (d) after contrast agent injection.
Table 1.
Characteristics of the study patients with triple-negative breast cancer who received neoadjuvant systemic therapy.
Table 1.
Characteristics of the study patients with triple-negative breast cancer who received neoadjuvant systemic therapy.
| Characteristic | Value | p-Value |
|---|
| Age, years | Total (N = 100) | pCR (N = 49) | Non-pCR (N = 51) | 0.893 |
| Mean (SD) | 47.9 (10.8) | 47.5 (10.5) | 48.3 (11.2) | |
| Median (range) | 48 (23–77) | 48 (23–66) | 48 (31–77) | |
| Longest tumor diameter, cm | | | | |
| Mean (SD) | 3.4 (1.6) | 3.2 (1.8) | 3.6 (1.5) | N/A |
| Median (range) | 2.8 (1.2–9.6) | 2.7 (1.2–9.6) | 2.9 (1.6–7.9) | |
| Histologic type, n (%) | | | | 0.503 |
| Invasive ductal | 87 (87) | 45 (92) | 42 (82) | |
| Metaplastic | 10 (10) | 3 (6) | 7 (14) | |
| Poorly differentiated carcinoma | 1 (1) | 1 (2) | 0 | |
| Apocrine | 1 (1) | 0 | 1 (2) | |
| Invasive mixed ductal/lobular | 1 (1) | 0 | 1 (2) | |
| T category, n (%) | | | | 0.130 |
| T1 | 15 (15) | 11 (23) | 4 (8) | |
| T2 | 63 (63) | 30 (61) | 33 (65) | |
| T3 | 16 (16) | 6 (12) | 10 (19) | |
| T4 | 6 (6) | 2 (4) | 4 (8) | |
| N category, n (%) | | | | 0.052 |
| N0 | 64 (64) | 36 (74) | 28 (55) | |
| N1 | 20 (20) | 6 (12) | 14 (27) | |
| N2 | 4 (4) | 1 (2) | 2 (4) | |
| N3 | 12 (12) | 6 (12) | 7 (14) | |
| Overall clinical stage, n (%) | | | | 0.141 |
| I | 10 (10) | 7 (14) | 3 (6) | |
| II | 68 (68) | 34 (70) | 34 (67) | |
| III | 22 (22) | 8 (16) | 14 (27) | |
| Type of surgery, n (%) | | | | N/A |
| Total mastectomy | 45 (45) | 21 (43) | 24 (47) | |
| Breast-conserving surgery | 55 (55) | 28 (57) | 27 (53) | |
Table 2.
Longest tumor dimension (LD), tumor volume (TV), and enhanced tumor volume (ETV) measurements by neoadjuvant systemic therapy response status.
Table 2.
Longest tumor dimension (LD), tumor volume (TV), and enhanced tumor volume (ETV) measurements by neoadjuvant systemic therapy response status.
| Measurement | AUC [95% CI] | p-Value | Mean ± SD | Best Cutoff for ROC Curve |
|---|
| Non-pCR (N = 51) | pCR (N = 49) |
|---|
| LD at 1 min, cm | |
| BL | 0.58 [0.47–0.70] | 0.148 | 3.58 ± 1.54 | 3.24 ± 1.75 | 4.35 |
| C2 | 0.72 [0.61–0.82] | <0.001 | 2.92 ± 1.45 | 2.06 ± 1.34 | 1.45 |
| C4 | 0.76 [0.66–0.85] | <0.001 | 2.34 ± 1.41 | 1.74 ± 1.57 | 0.95 |
| %C2/BL | 0.75 [0.66–0.85] | <0.001 | −16.94 ± 21.88 | −36.12 ± 22.10 | −19.38 |
| %C4/BL | 0.77 [0.68–0.86] | <0.001 | −32.58 ± 27.78 | −67.88 ± 34.78 | −49.58 |
| LD at 7 min, cm | |
| BL | 0.58 [0.47–0.70] | 0.156 | 3.71 ± 1.51 | 3.39 ± 1.77 | 4.20 |
| C2 | 0.71 [0.61–0.81] | <0.001 | 3.11 ± 1.49 | 2.25 ± 1.33 | 2.45 |
| C4 | 0.76 [0.66–0.85] | <0.001 | 2.71 ± 1.72 | 1.39 ± 1.52 | 1.35 |
| %C2/BL | 0.76 [0.67–0.86] | <0.001 | −14.84 ± 21.46 | −31.24 ± 18.37 | −15.39 |
| %C4/BL | 0.75 [0.65–0.84] | <0.001 | −23.91 ± 47.09 | −58.85 ± 35.06 | −49.14 |
| TV at 1 min, cm3 | |
| BL | 0.61 [0.50–0.72] | 0.061 | 24.22 ± 32.09 | 15.14 ± 27.26 | 22.65 |
| C2 | 0.73 [0.63–0.83] | <0.001 | 12.80 ± 18.53 | 4.72 ± 8.02 | 4.42 |
| C4 | 0.77 [0.68–0.86] | <0.001 | 7.55 ± 15.63 | 2.20 ± 5.47 | 0.32 |
| %C2/BL | 0.77 [0.67–0.86] | <0.001 | −39.21 ± 39.23 | −69.29 ± 26.64 | −67.46 |
| %C4/BL | 0.77 [0.68–0.87] | <0.001 | −62.41 ± 39.34 | −86.94 ± 23.91 | −99.40 |
| TV at 7 min, cm3 | |
| BL | 0.60 [0.49–0.71] | 0.080 | 25.23 ± 32.61 | 16.62 ± 28.24 | 30.37 |
| C2 | 0.73 [0.63–0.83] | <0.001 | 13.65 ± 19.84 | 5.53 ± 8.98 | 4.21 |
| C4 | 0.77 [0.67–0.86] | <0.001 | 8.84 ± 17.45 | 2.69 ± 6.35 | 0.77 |
| %C2/BL | 0.75 [0.65–0.85] | <0.001 | −38.51 ± 35.95 | −66.41 ± 22.50 | −56.42 |
| %C4/BL | 0.76 [0.67–0.85] | <0.001 | −59.77 ± 40.96 | −85.73 ± 19.25 | −72.83 |
| ETV at 1 min, cm3 | |
| BL | 0.62 [0.51–0.73] | 0.038 | 12.98 ± 13.89 | 10.14 ± 23.64 | 13.55 |
| C2 | 0.80 [0.70–0.89] | <0.001 | 5.30 ± 6.07 | 2.09 ± 4.19 | 1.25 |
| C4 | 0.82 [0.73–0.90] | <0.001 | 2.75 ± 5.58 | 1.07 ± 3.82 | 0.54 |
| %C2/BL | 0.76 [0.66–0.86] | <0.001 | −45.60 ± 31.91 | −72.06 ± 26.00 | −69.14 |
| %C4/BL | 0.73 [0.62–0.83] | <0.001 | −71.15 ± 27.17 | −86.06 ± 21.81 | −87.58 |
| ETV at 2.5 min, cm3 | |
| BL | 0.62 [0.51–0.73] | 0.038 | 14.70 ± 15.44 | 11.20 ± 26.82 | 17.18 |
| C2 | 0.78 [0.68–0.87] | <0.001 | 6.26 ± 6.84 | 2.54 ± 4.59 | 1.99 |
| C4 | 0.79 [0.70–0.88] | <0.001 | 3.40 ± 6.73 | 1.13 ± 3.80 | 0.39 |
| %C2/BL | 0.74 [0.64–0.84] | <0.001 | −43.25 ± 35.44 | −69.60 ± 27.30 | −63.88 |
| %C4/BL | 0.72 [0.62–0.82] | <0.001 | −69.12 ± 31.05 | −87.36 ± 18.42 | −88.28 |
Table 3.
Functional tumor volume (FTV) measurements by neoadjuvant systemic therapy response status.
Table 3.
Functional tumor volume (FTV) measurements by neoadjuvant systemic therapy response status.
| Measurement | Optimal Threshold | AUC [95% CI] | p-Value | Mean ± SD (cm3) | Best Cutoff for ROC Curve |
|---|
| PE (%) | SER | Non-pCR (N = 51) | pCR (N = 49) | |
|---|
| FTV at 1 min | |
| BL | 220 | 0.25 | 0.63 [0.52−0.74] | 0.029 | 4.22 ± 9.30 | 1.25 ± 2.67 | 3.84 |
| C2 | 20 | 0.55 | 0.80 [0.70−0.89] | <0.001 | 4.22 ± 5.58 | 1.60 ± 3.69 | 1.40 |
| C4 | 30 | 0.40 | 0.84 [0.76−0.92] | <0.001 | 2.74 ± 5.58 | 1.05 ± 3.82 | 0.12 |
| %C2/BL | 0 | 0 | 0.75 [0.65−0.85] | <0.001 | −48.01 ± 34.09 | −64.94 ± 55.90 | −71.19 |
| %C4/BL | 35 | 0.35 | 0.78 [0.68−0.87] | <0.001 | −72.64 ± 27.11 | −90.56 ± 18.59 | −92.75 |
| FTV at 2.5 min | |
| BL | 0 | 0.30 | 0.62 [0.51−0.73] | 0.040 | 14.66 ± 15.43 | 11.16 ± 26.67 | 17.18 |
| C2 | 60 | 0.90 | 0.82 [0.73−0.90] | <0.001 | 3.76 ± 4.89 | 1.39 ± 3.55 | 0.56 |
| C4 | 125 | 0.75 | 0.82 [0.73−0.91] | <0.001 | 0.93 ± 1.48 | 0.49 ± 2.10 | 0.09 |
| %C2/BL | 0 | 1.00 | 0.78 [0.68−0.87] | <0.001 | −47.06 ± 39.97 | −76.96 ± 26.16 | −86.11 |
| %C4/BL | 125 | 0.70 | 0.79 [0.70−0.88] | <0.001 | −71.15 ± 39.99 | −92.07 ± 20.65 | −98.48 |
| Disclaimer/Publisher’s Note: The statements, opinions and data contained in all publications are solely those of the individual author(s) and contributor(s) and not of MDPI and/or the editor(s). MDPI and/or the editor(s) disclaim responsibility for any injury to people or property resulting from any ideas, methods, instructions or products referred to in the content. |
© 2023 by the authors. Licensee MDPI, Basel, Switzerland. This article is an open access article distributed under the terms and conditions of the Creative Commons Attribution (CC BY) license (https://creativecommons.org/licenses/by/4.0/).


 ,
, 


