1. Introduction
Raman spectroscopy, a form of vibrational spectroscopy, is presently considered a viable optical method for biomedical applications, mainly due to its non-destructive modality to analyse molecular composition, and is becoming progressively important in biomedical research, especially for its high biochemical specificity, low water sensitivity and capability to work in the near-infrared (NIR) region with fibreoptics. This technique provides precise identification and detailed information about molecular composition, quantification of a specific compound, characterization of structural arrangement, crystal symmetry and orientation, crystallinity degree and molecular interactions [
1,
2].
The main particularity of this technique is that when light arrives to an examined sample, a small part of it is scattered in several different directions. The larger part of the scattered photons has the same frequency as the incident photons, elastically scattered. However, a small fraction of light (approximately 1 in 10
7 photons) is scattered at optical frequencies different, and usually lower, than the frequency of the incident photons. The process causing this inelastic scatter is known as the Raman effect. If the sample or substance being investigated is illuminated by monochromatic radiation, such as a laser, the spectrum of the scattered light consists of a strong line of the same frequency as the incident illumination, together with weaker lines on either side. These are shifted from the strong line by frequencies varying from approximately 100 to about 3500 cm
−1 [
3,
4,
5,
6,
7].
Raman spectroscopy has shown to be a suitable and sensitive technique for the characterization of dental tissues, from caries detection to the evaluation of demineralization caused by acidic external agents [
1,
2,
8].
Tooth enamel is the most highly mineralized and hardest tissue in the human body and covers and protects the anatomic crown of the tooth. It resists to chewing forces and protects the internal layers, dentin, and pulp [
6,
7,
9]. The information on the crystalline state of the dental enamel can be provided by the determination of the depolarization ratio of the
v1 symmetric stretching band of phosphate (at 959 cm
−1), while the determination of the depolarization ratio of phosphate is achieved by acquiring, measuring, and comparing two different Raman measurements of the same region, obtained with parallel and cross-polarized configurations of the spectrometer [
1,
2,
5,
8,
10].
1.1. Raman Spectroscopy Applied to Dentistry
In a research study performed by Monteiro et al. [
8], the suitability of the analysis of the depolarization ratio has been demonstrated for the examination of carious dental tissues and mineral loss in depth by analysing tooth cross-sections. Samples of enamel and dentine, with carious lesions in different stages of progression, were assessed by comparing the depolarization ratio of the PO
43− symmetric stretching band at 959 cm
–1 in different sound and carious tissues carefully chosen by an expert and the selection criteria were represented by the presence of lesions, cavitated or not, including white spots.
Buchwald et al. [
4,
9,
11,
12] have recently performed several research studies to investigate the effectiveness of Raman spectroscopy technique in the determination of changes in chemical composition, structural arrangement, crystal rod orientation and/or morphology of human tooth enamel affected by caries, both natural and artificially induced. This has been accomplished by evaluating spectral parameters such as Raman band position, peak intensities obtained by using different excitation laser wavelengths, the full width at half maximum of the symmetric stretching vibrational mode assigned to the phosphate band [
4]. Additionally, they have also used the depolarization ratio (ρ959) and polarization anisotropy (A959). Moreover, Raman spectral maps with micro-level spatial resolution, allow the determination of local variations in enamel structure affected by caries [
4]. As the results have shown, the parameters ρ959 and A959 are not the only indicatives of enamel caries changes. Raman band spectral parameters, such as position and line shape, can also be employed. Likewise, it is possible to detect early caries by analysis of background in the Raman scattering spectrum related to the Rayleigh scattering and fluorescence emission.
Pankrushina et al. [
13] applied Raman spectroscopy to better understand the impact of the structure and composition of enamel and dentine layers on their chemical resistance, mechanical properties, protein alteration and the effects of de-/remineralization processes. Different types of tooth diseases were also investigated: teeth affected by hypoplasia lesions with different severity degrees, and then the authors compared these results with those obtained from eroded and intact sound teeth.
Prikule et al. [
14] presented comparative studies using scanning Raman micro-spectroscopy with several laser sources (wavelengths of 532, 785, and 1064 nm), obtaining different spectra of tooth enamel according to the used radiation, both in vivo and in vitro. It was shown that the intensity of Raman scattering of enamel can vary according to the enamel layer’ thickness.
1.2. MVA Methods Applied to RAMAN Spectroscopy
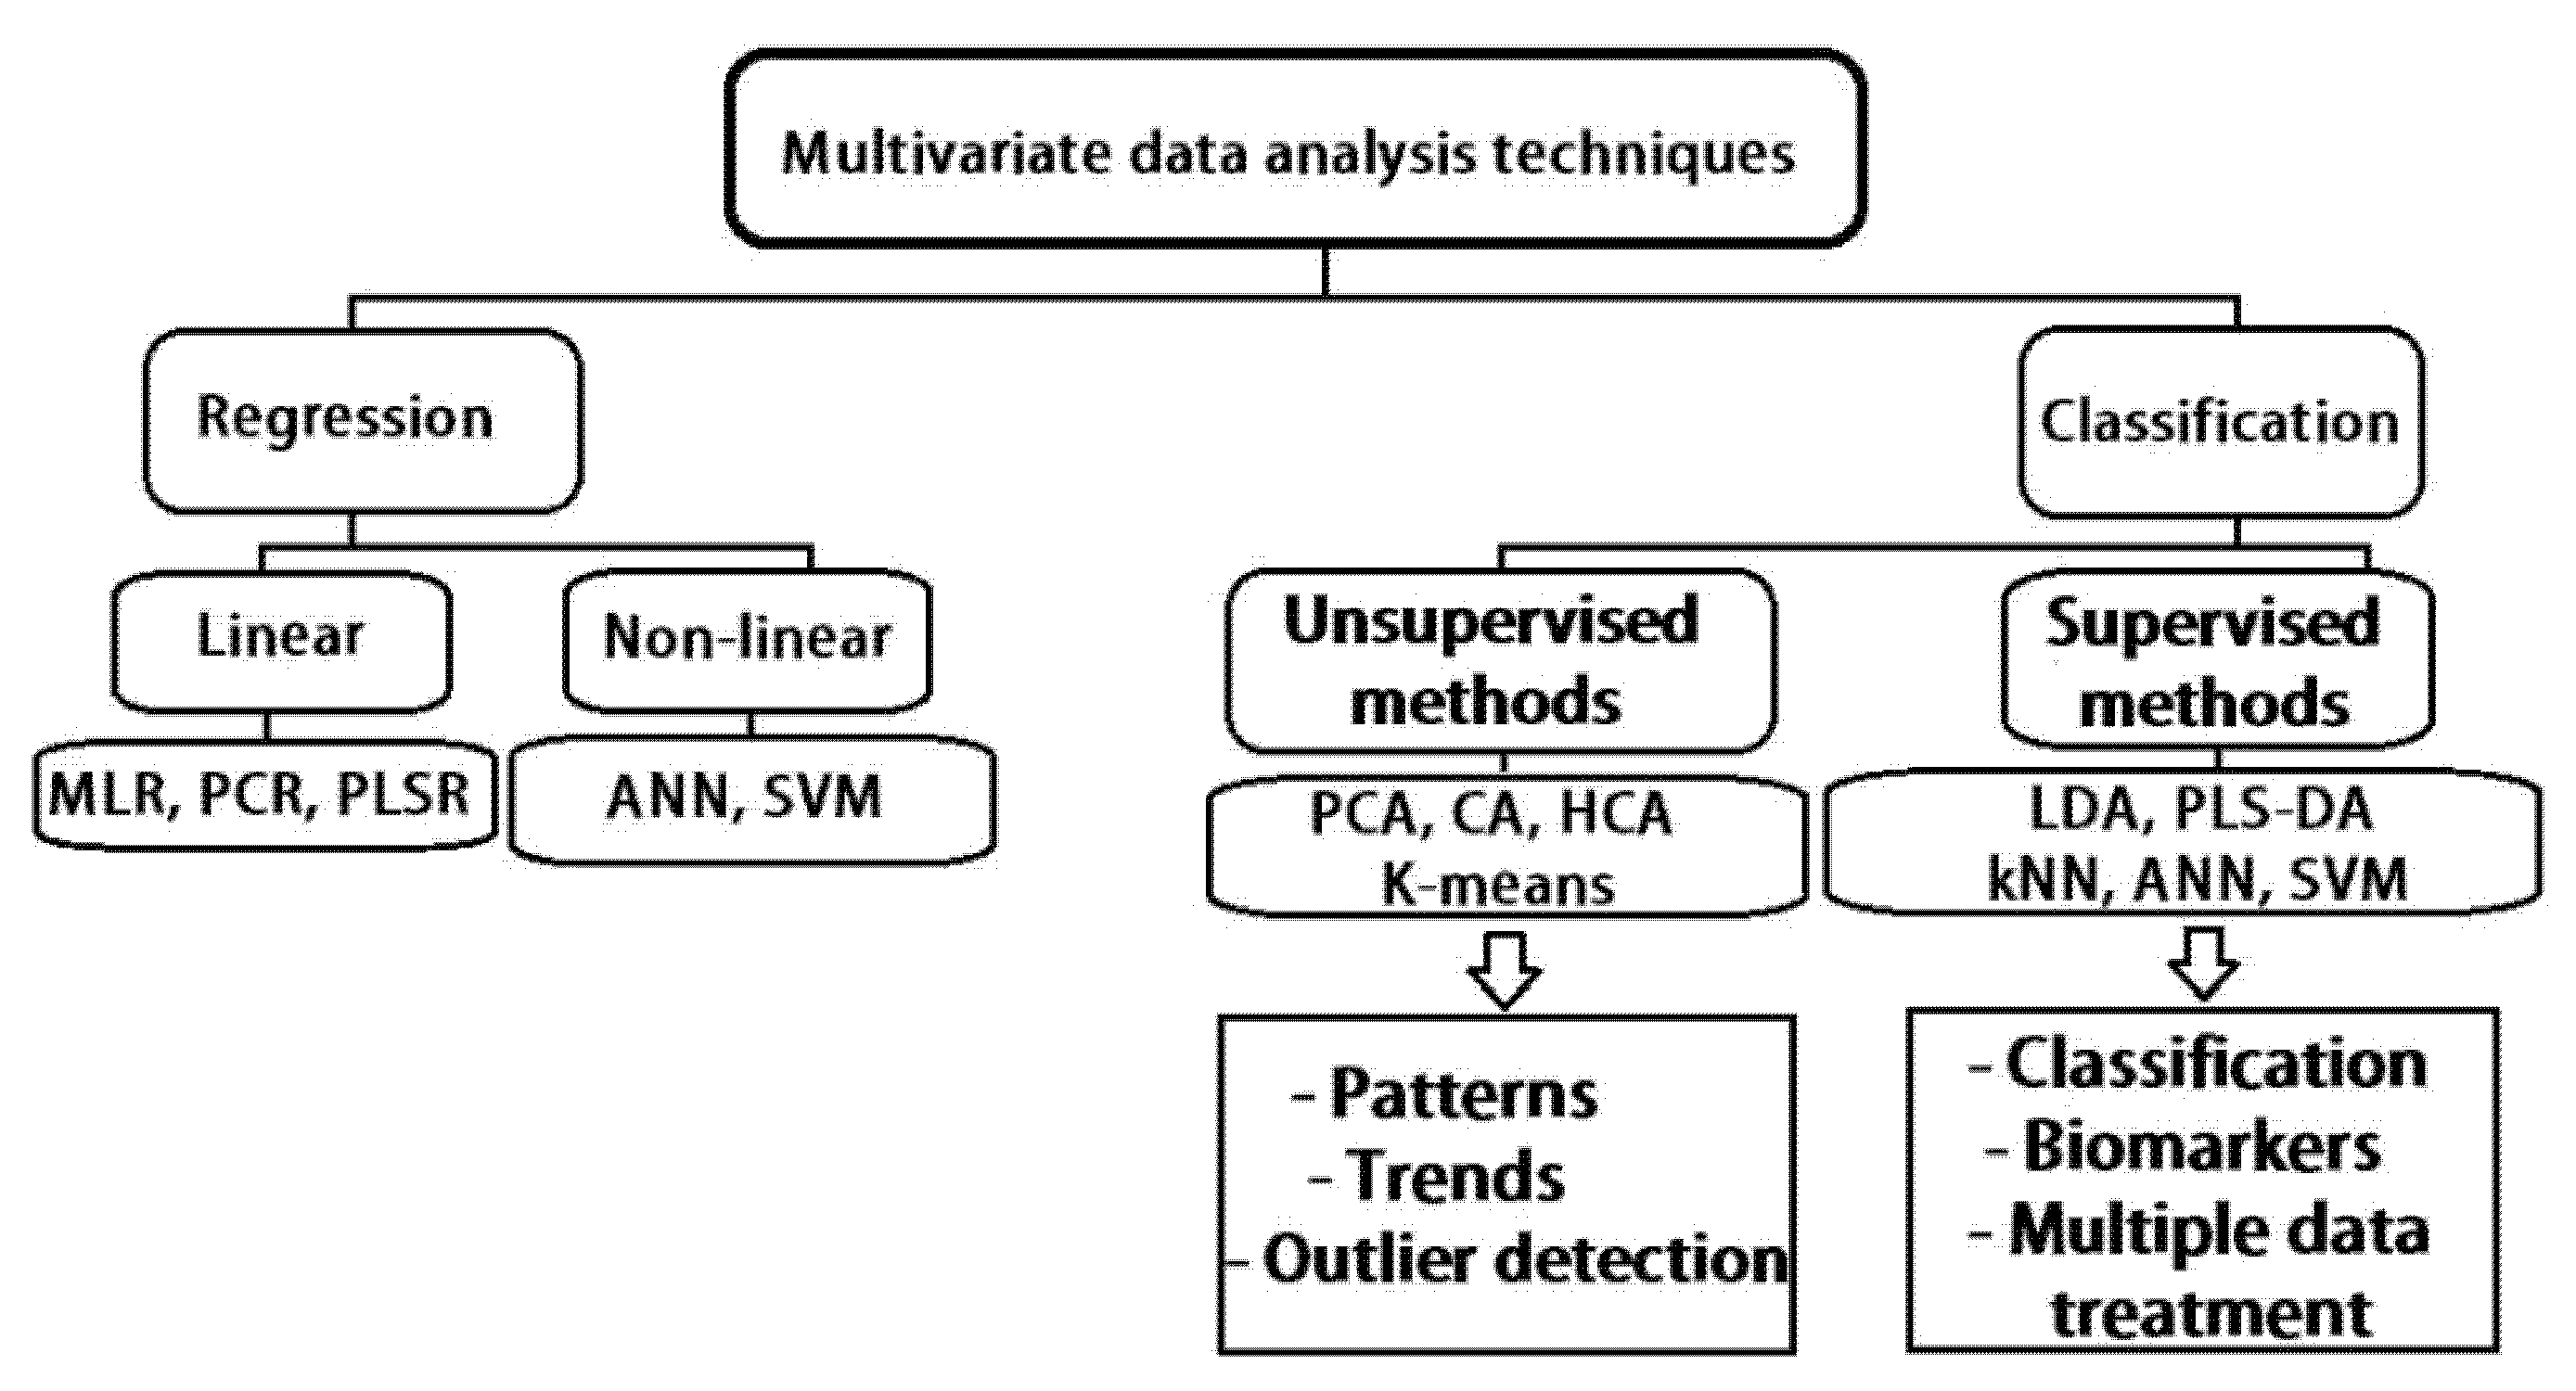
As revealed in the conference paper, all existent multivariate classification techniques, shown in
Figure 1, can be mainly separated into unsupervised methods and supervised learning procedures. Data compression method such as principal component analysis (PCA) is often employed to contribute to variability in the investigated data. PCA, considered a projection method, is a pre-processing statistical procedure that transforms several correlated variables into a lesser number of variables that are uncorrelated (called principal components) that still contain most of the information of the primary larger set. Consequently, analysis methods, for instance, hierarchical cluster analysis (HCA), linear discriminant analysis (LDA) and other types, have also been frequently used to create classification algorithms for normal healthy condition and disease differentiation [
6,
15].
Machine learning (ML) can include multivariate methods, which encompass several multivariate classification methods (also known as pattern recognition techniques) and multivariate regression. In unsupervised pattern recognition techniques, for example, PCA and cluster analysis (CA), any prior knowledge about the training set samples (in this case, represented by the acquired Raman spectra) is not required. Both referred statistical analysis methods are frequently applied to consider differences and/or similarities between spectra or image areas with the same features. Alternatively, supervised pattern recognition techniques, for instance, artificial neural networks (ANNS) and LDA necessitate minimal previous information from preceding experiences, for instance, undeniably detecting and identifying examined samples from disease or differentiating samples from healthy normal cases. In this manner, supervised learning methods result in a more precise and accurate identification and classification, while unsupervised methods are considered more useful for investigative studies and exploratory analysis of data [
15].
PCA represents an analysis method that is often used to reduce the dimensionality of very large data sets, by transforming and reducing a larger set of variables into a smaller one, that keeps most of the essential information in the larger set, preserving this way as much information as possible. Reducing the number of variables of a data set usually leads to a loss in accuracy, achieving instead a significant increase in simplicity. Therefore, smaller data sets are easier to explore, making it possible to analyse data much easier, simpler, and faster for machine learning algorithms, without irrelevant or uncorrelated variables to process. Generally, statistical methods applied to spectroscopic techniques, such as PCA, are based on the analysis of an entire given spectrum (comprising characteristic bands known as fingerprints) that is under examination. However, this approach does not provide valuable interpretations or explanations into the origins of the detected/identified changes. Additionally, statistical analysis methods usually presume a linear relationship between the spectral components belonging to a certain Raman spectrum. Therefore, an adequate selection of quantitative information about the source of the Raman specific spectral peak data can be often problematic due to the disorganized or, sometimes, unclear tissue type identification/classification or interference/overlay between different classes or varieties of spectroscopic characteristics (such as fluorescence, scattering, and absorption effects). Consequently, there is a tremendous need for developing quantitative models and quantifiable approaches that consider the investigated optical, structural, and biochemical properties of the examined tissue [
6,
15].
So far, the principal component analysis method represents the unsupervised multivariate statistical tool most extensively used, which is widely applied especially when vast spectral data must be transformed into a smaller number of independent variations known as principal components (PCs), while contributions of these components are known as scores, which are extensively used as parameters for classification. PCA algorithms are frequently applied directly to collected (Raman) spectra within a certain data set to reduce the original dimensionality into a linear combination of orthogonal basis spectra known as principal components (PCs), resulting afterwards in derived loading plots represented as plots of first three PCs as function of the wave number. Generally, the first PC is the most important and accounts for the spectral features with highest variation, while subsequent secondary and tertiary PCs represent features with progressively lower variance. PCA method is typically used to characterize and distinguish the Raman spectra of a specific “calibration set” of samples that contain at least two distinct features/chemical components, as determined by pathology under study. As already described, in the case of Raman measurements, PCs represent an orthogonal set of spectral data (with varying spectral parameters), a linear numerical combination of which can accurately provide valuable insights on each of the existent spectra in the sample set. By correlating the mentioned fitting coefficients “scores” of the analysed spectra in the data set with their established classifications, an accurate diagnostic algorithm can be easily obtained. However, its main disadvantage lies on the fact that PCs are pure mathematical concepts, without any direct physical significance or meaning [
6,
15].
1.3. MVA Applied to Raman Spectral Data Obtained from Dental Samples
When Raman spectroscopy is used in combination with PCA [
9,
16,
17,
18,
19,
20,
21] or other MVA [
9,
19,
20,
21,
22] methods, it is possible to obtain unique spectral characteristics extracted from raw acquired spectra, which can be used for the identification of similar areas, specific features, or certain types of samples, along with differentiation and classification of a different sample or tissue condition, according to the case. Raman spectroscopy and PCA can be used to distinguish control from treated enamel samples [
23], as well as to discriminate sound enamel from severe dental fluorosis samples with high levels of sensitivity and specificity [
16]. Furthermore, Raman spectroscopy and PCA can be used to differentiate healthy from demineralized enamel, as well as identify and assess enamel remineralization with different fluoride solutions [
17]. Raman spectroscopy-PCA method was also used for the analysis of human dental enamel surfaces from sound, affected (cavitated), and highly affected tooth samples, revealing that exists a predisposition in individual teeth to caries that can be directly correlated with the structural/compositional enamel changes that occur mainly along the main c-axis of hydroxyapatite crystals [
18].
Therefore, MVA unsupervised methods, such as PCA, applied to Raman technique can provide a baseline for methodological development designed for clinical diagnostics of different pathologic conditions, being of a great utility for data analysis in several relevant fields of dentistry diagnostics and research, as follows: (1) early detection and recognition of carious lesions; (2) identification and differentiation between normal and affected samples (by several conditions such as tooth decay, hypo-mineralization, fluorosis, Amelogenesis Imperfecta); (3) bleaching products performance; (4) assessment of dental pharmaceutical products; (5) demineralizing attack from acidic challenges, foods, and beverages; (6) proteomic differences between different types of human teeth; (7) remineralization agents and other related treatments.
The present paper represents an extended version of a previously published work in conference proceedings [
23] and aims at establishing the most suitable methodologies for the treatment of Raman spectra and evaluation of the collected data. Multivariate Analysis Methods were applied to Raman spectra, acquired in our laboratory, from enamel samples. Therefore, the main purpose of it is to continue and develop more the exposed ideas, results, and concepts, for a deeper understanding of the multivariate analysis methods applied to Raman spectra.
In order to establish the most efficient method of Raman data evaluation to distinguish between enamel sample groups, three different approaches were undertaken: A—Principal Components Analysis of the derived numerical parameters derived from Raman spectra deconvolution, namely, depolarization ratio, anisotropy, full width at half maximum and Raman shift for the symmetric stretching band of phosphate.; B—PCA of the average Raman spectra after baseline correction using polynomial function; and C—PCA of average raw Raman spectra. These three approaches were essayed on Control and Treatment group samples, before and after application of fluorinated varnish (treatment group) and acidic erosive cycle. Additionally, in order to assess the most suitable laser wavelength to be employed for the characterization of enamel samples, Hierarchical cluster and PCA were applied to numerical parameters derived from Raman spectra of the same enamel samples, acquired with two different lasers, 638 nm and 785 nm.
2. Materials and Methods
Principal component analysis represents the unsupervised multivariate statistical tool most widely used when large spectral data must be decomposed into a smaller number of independent variations known as principal components (PCs), while contributions of these components are known as scores, which are extensively used as parameters for classification. PCA algorithms are frequently applied directly to collected (Raman) spectra within a certain data set to reduce the original dimensionality into a linear combination of orthogonal basis spectra known as principal components (PCs), resulting afterwards in derived loading plots represented as plots of the first three PCs as a function of the wave number. Generally, the first PC is the most important and accounts for the spectral features with highest variation, while subsequent secondary and tertiary PCs represent features with progressively lower variance. In other words, to describe a given spectrum, a linear combination of PCs is used, with each PC weighed by an appropriate PC score. Usually, the values of these PC scores are used to determine the spectral features that can distinguish between normal and diseased tissues, contributing to diagnostic algorithms development. PCA method is typically used to characterize the Raman spectra of a specific “calibration set” of samples containing at least two distinct features/chemical components, as determined by pathology under study.
2.1. Evaluation of Different Approaches for Raman Data Analysis
2.1.1. Dental Samples
Two experimental groups of human dental enamel samples, control (C) and treatment (T), each containing 10 tooth samples, were subjected to an acid demineralization procedure, to test the protective effect of fluorinated varnish against erosion. Previously to the acidic attack, the T group was cleaned with Couto toothpaste and treated with Fluoride containing dental fluorinated varnish—VOCO Profluorid—while group C was only cleaned with Couto toothpaste.
2.1.2. Methodology
Raman spectra were acquired using a Horiba XploRA Raman Confocal Microscope employing a NIR laser diode source operating at a wavelength of 785 nm, using a 1200 lines/mm grating. This way, the spectral range investigated was from 300 cm
−1 to 1800 cm
−1, resulting in a spectral resolution of 4 cm
−1. Using an entrance slit of 200 μm, and a confocal hole of 300 μm, the scattered light collected by the objective was dispersed onto the air-cooled CCD array of an Andor iDus detector. A 100× objective (N.A. = 0.9) was used to focus on the surface of enamel, as well as a 50% neutral density filter (power on the sample 7.6 ± 0.3 mW (lasercheck
®, Edmund optics)). For each sample, an average of 20 measurements (10 different points with parallel polarization, always followed by other 10 with orthogonal polarization) were performed, with an exposure time for each measurement of 20 s with 4 accumulations. The following parameters were obtained and compared in each step of the study: depolarization ratio (ρ959), anisotropy, Raman shift wavenumber and full width at half maximum (FWHM) of the symmetric stretching band of phosphate (~959 cm
−1), according to Pessanha et al. [
24].
2.2. Evaluation of the Suitability of the Laser Wavelength for Raman Analysis
2.2.1. Dental Samples
Six human dental samples (premolars and upper molars) were selected from donors having as exclusion criteria the presence of superficial lesions observed employing a stereomicroscope (Meiji Techno EMZ 8RT, Japan).
2.2.2. Research Design and Methodology
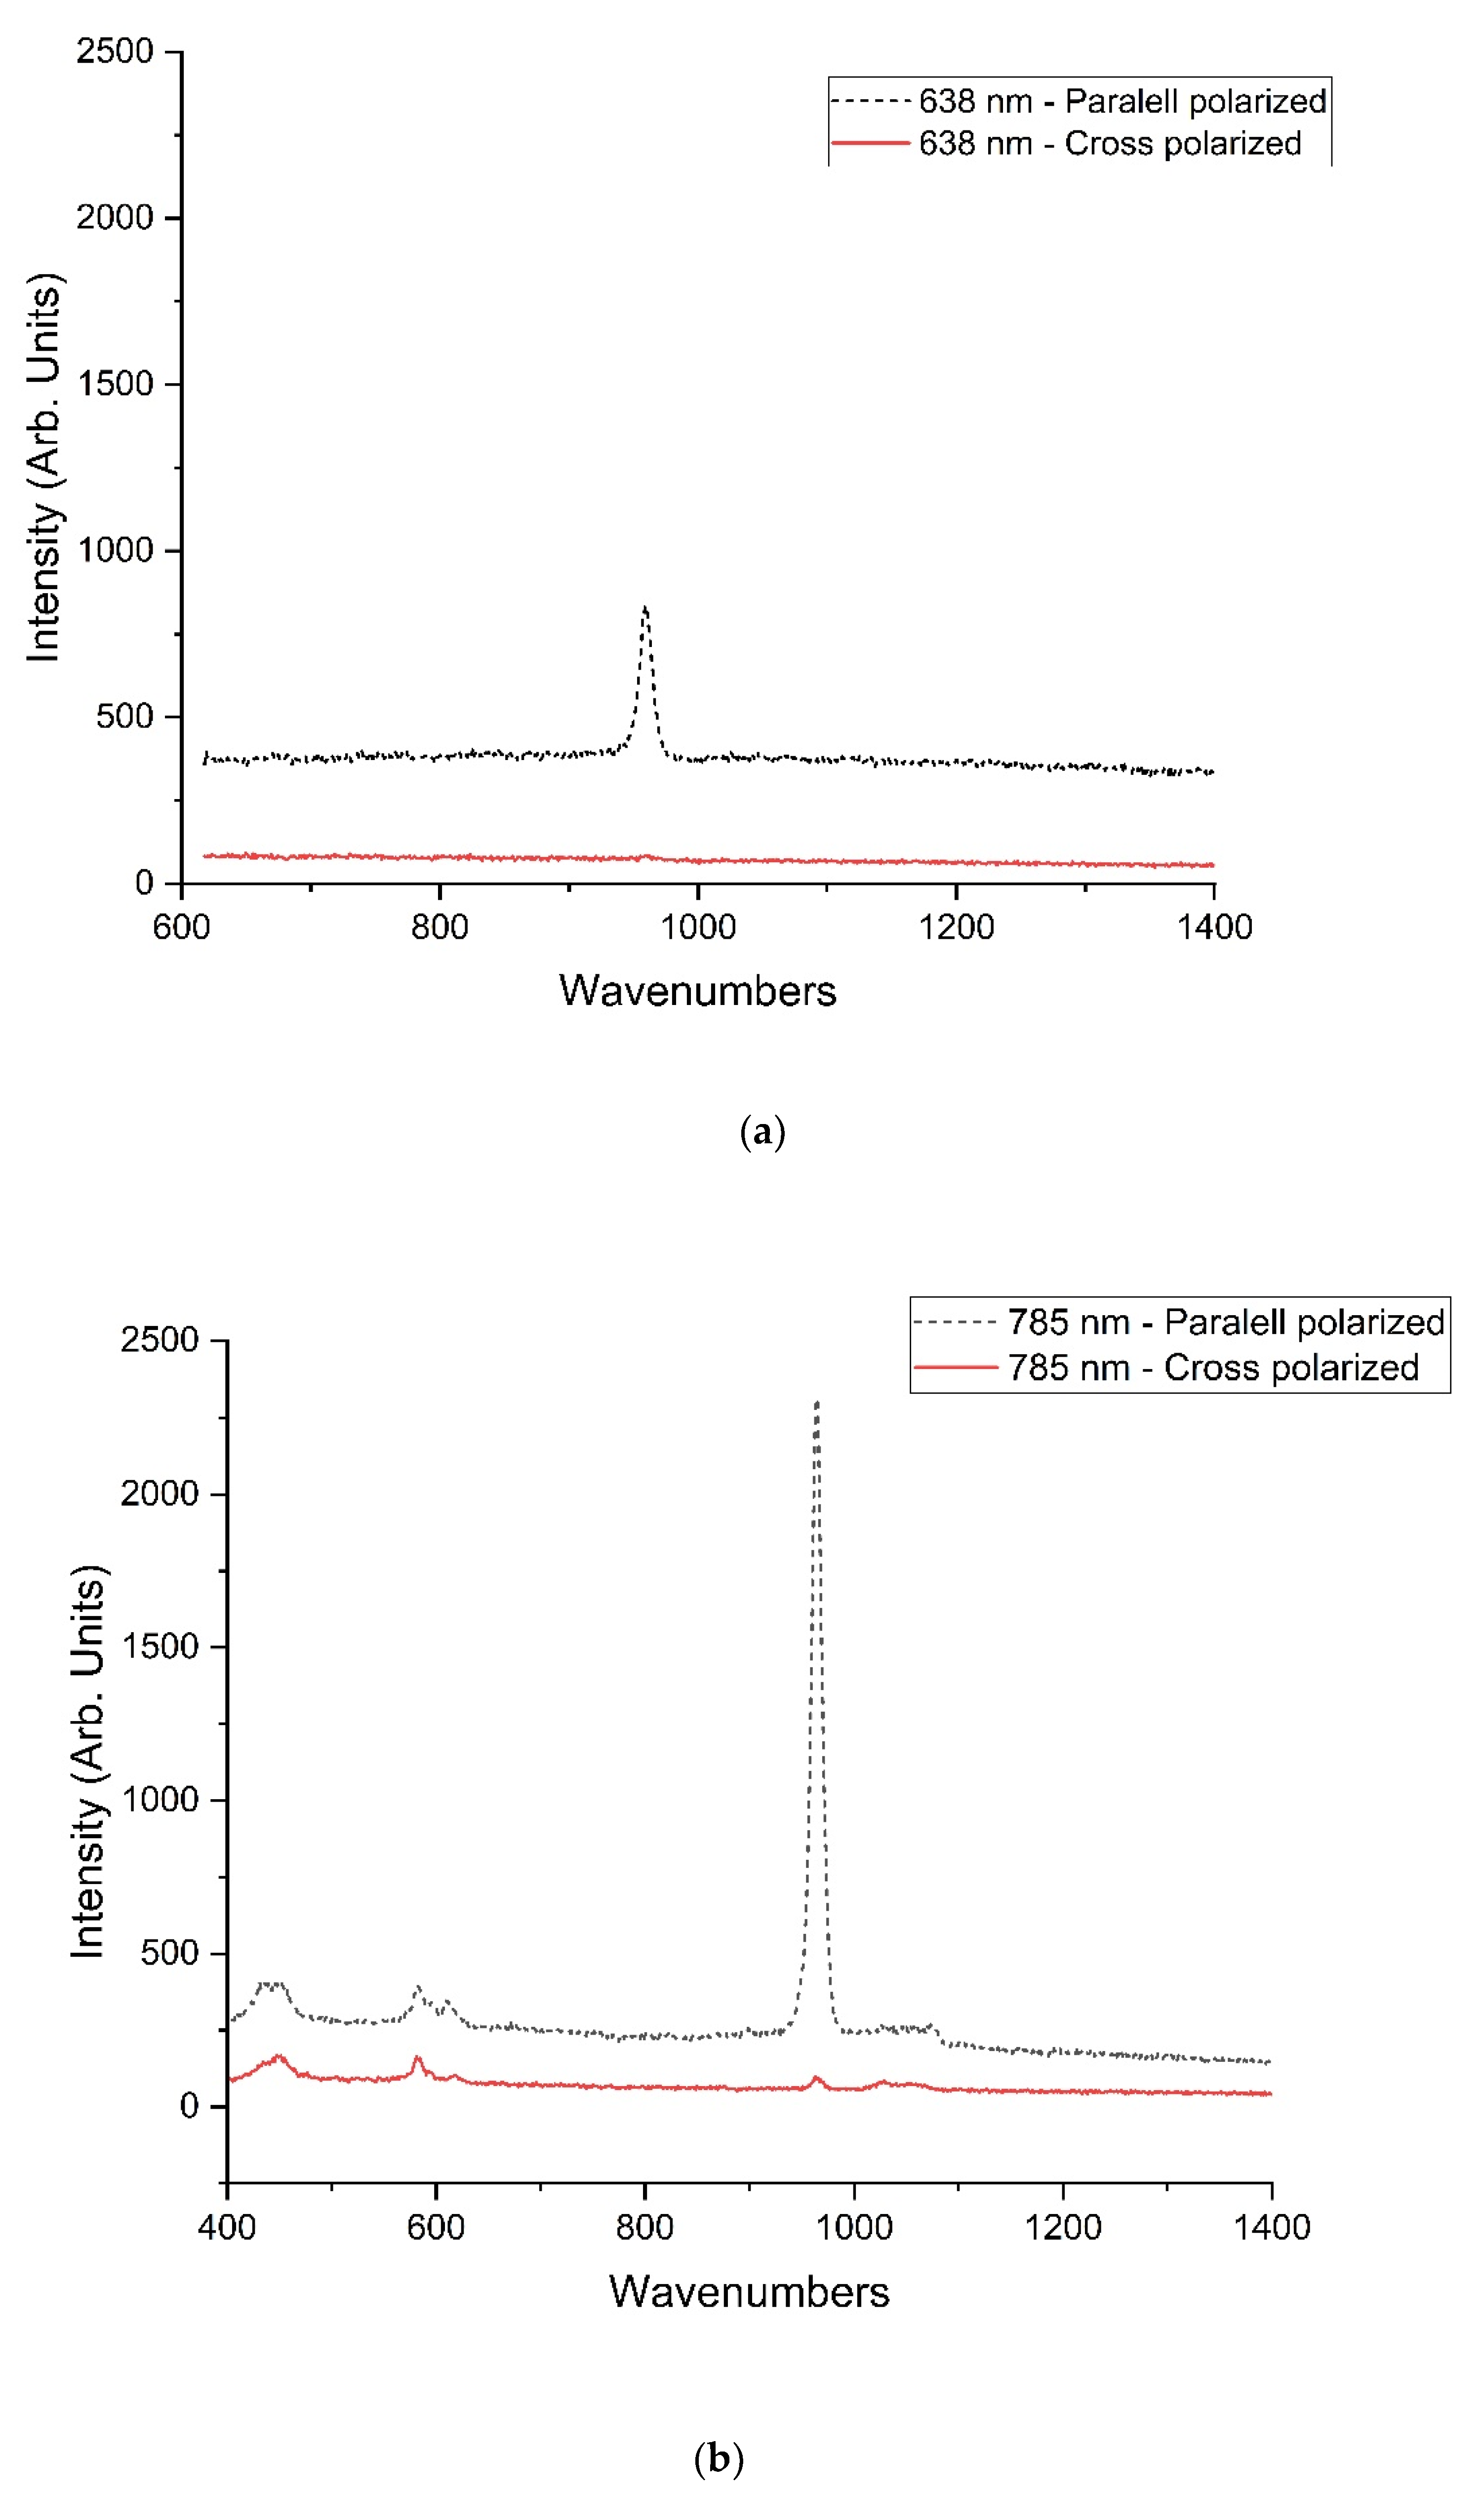
Raman spectra of samples were acquired using the same microscope, employing lasers with wavelengths of 785 nm (NIR) and 638 nm (R), with the main objective of acquiring spectra with parallel and orthogonal polarization (
Figure 1). During the spectra acquisition, the collection parameters, such as entrance slit, pinhole and objective were maintained as in the first study, while the laser power filtering and detection grating were optimized for each laser, for the 785 nm laser were used the same parameters as in the fist study, while for the 638 nm we used a 25% (power on the sample 1.8 ± 0.2 mW (lasercheck
®, Edmund optics)) intensity filter to avoid saturation of the detector. Regarding detection, the same grating (1200 grooves/mm) was used for the 785 nm laser, while for the 638 nm was chosen a 1800 grooves/mm grating. Raman (single point) measurements were performed on these samples (10 points per sample, with the same number of accumulations and collection duration). Parameters (Raman shift, FWHM, depolarization ratio, and anisotropy) were extracted from baseline corrected Raman spectra acquired with parallel and perpendicular polarization, and additionally, was calculated the intensity difference between spectral peaks recorded with parallel and cross-polarized configurations, before and after baseline correction. Examples of the obtained spectra are presented in
Figure 2.
3. Results and Discussion
3.1. Evaluation of PCA Approaches on Raman Spectroscopy Regarding the Protective Effect of Dental Varnish
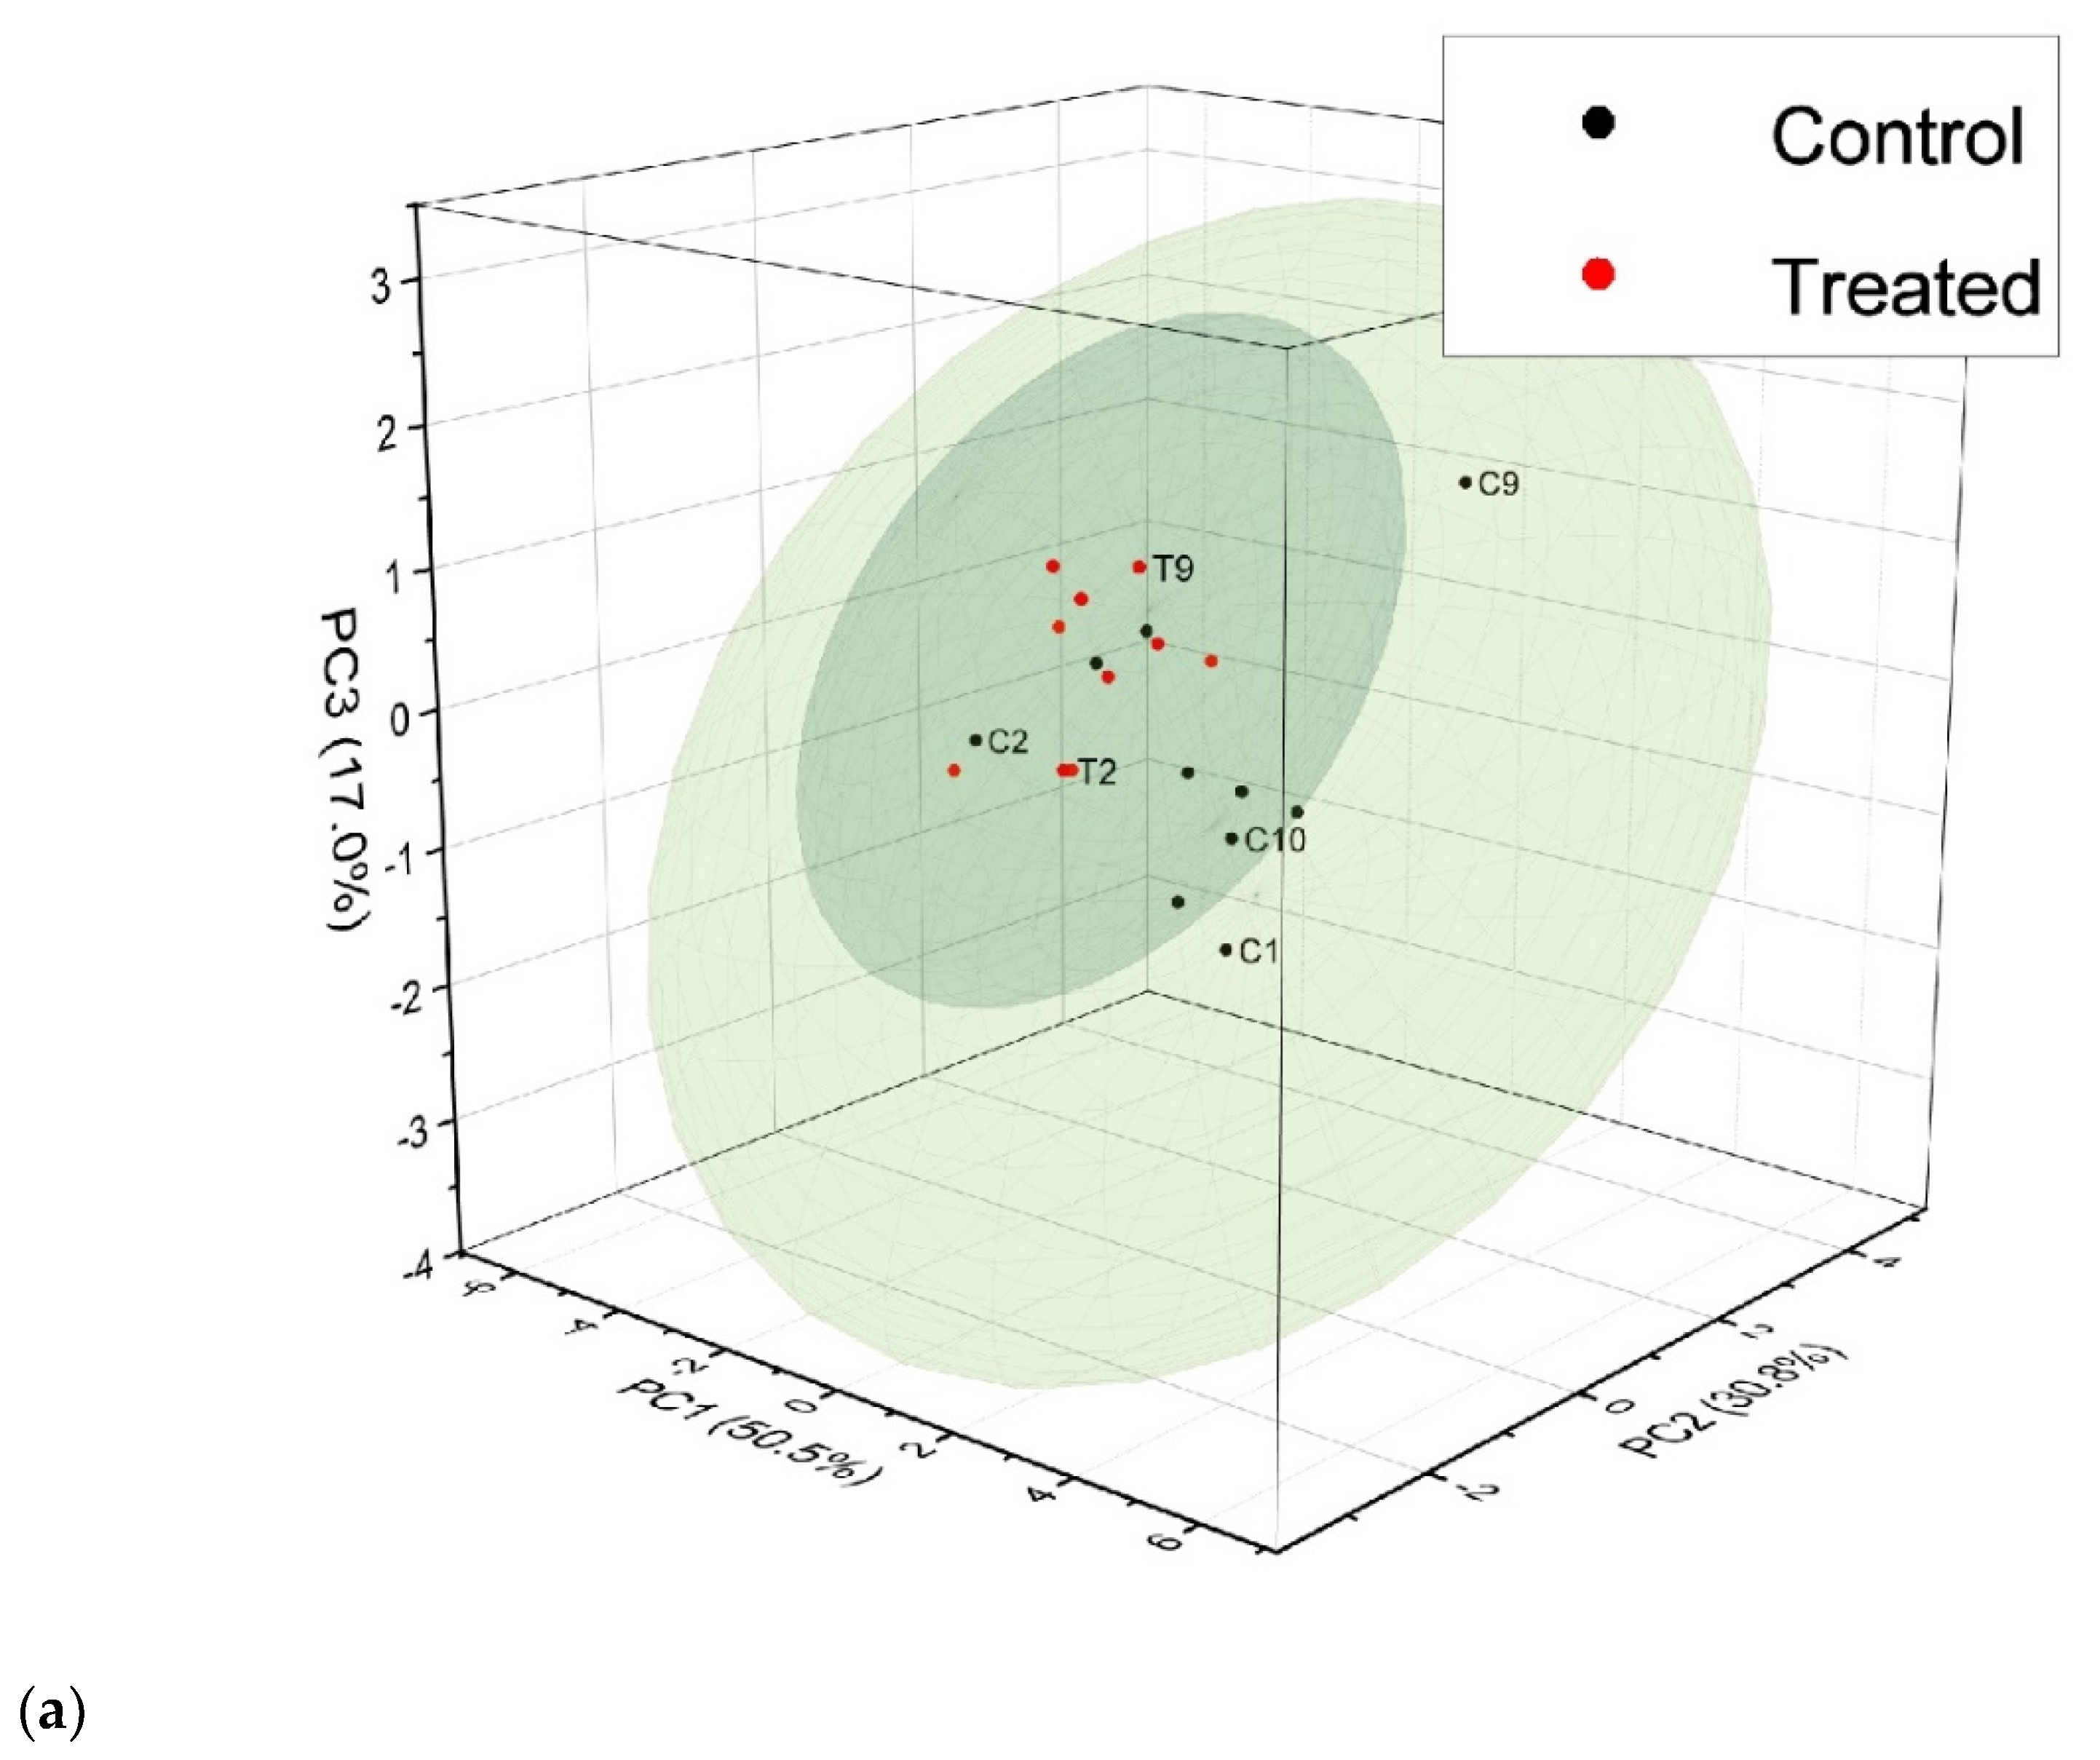
The score plots obtained for Approach A are represented in
Figure 3, the loading plots for Approach B are revealed in
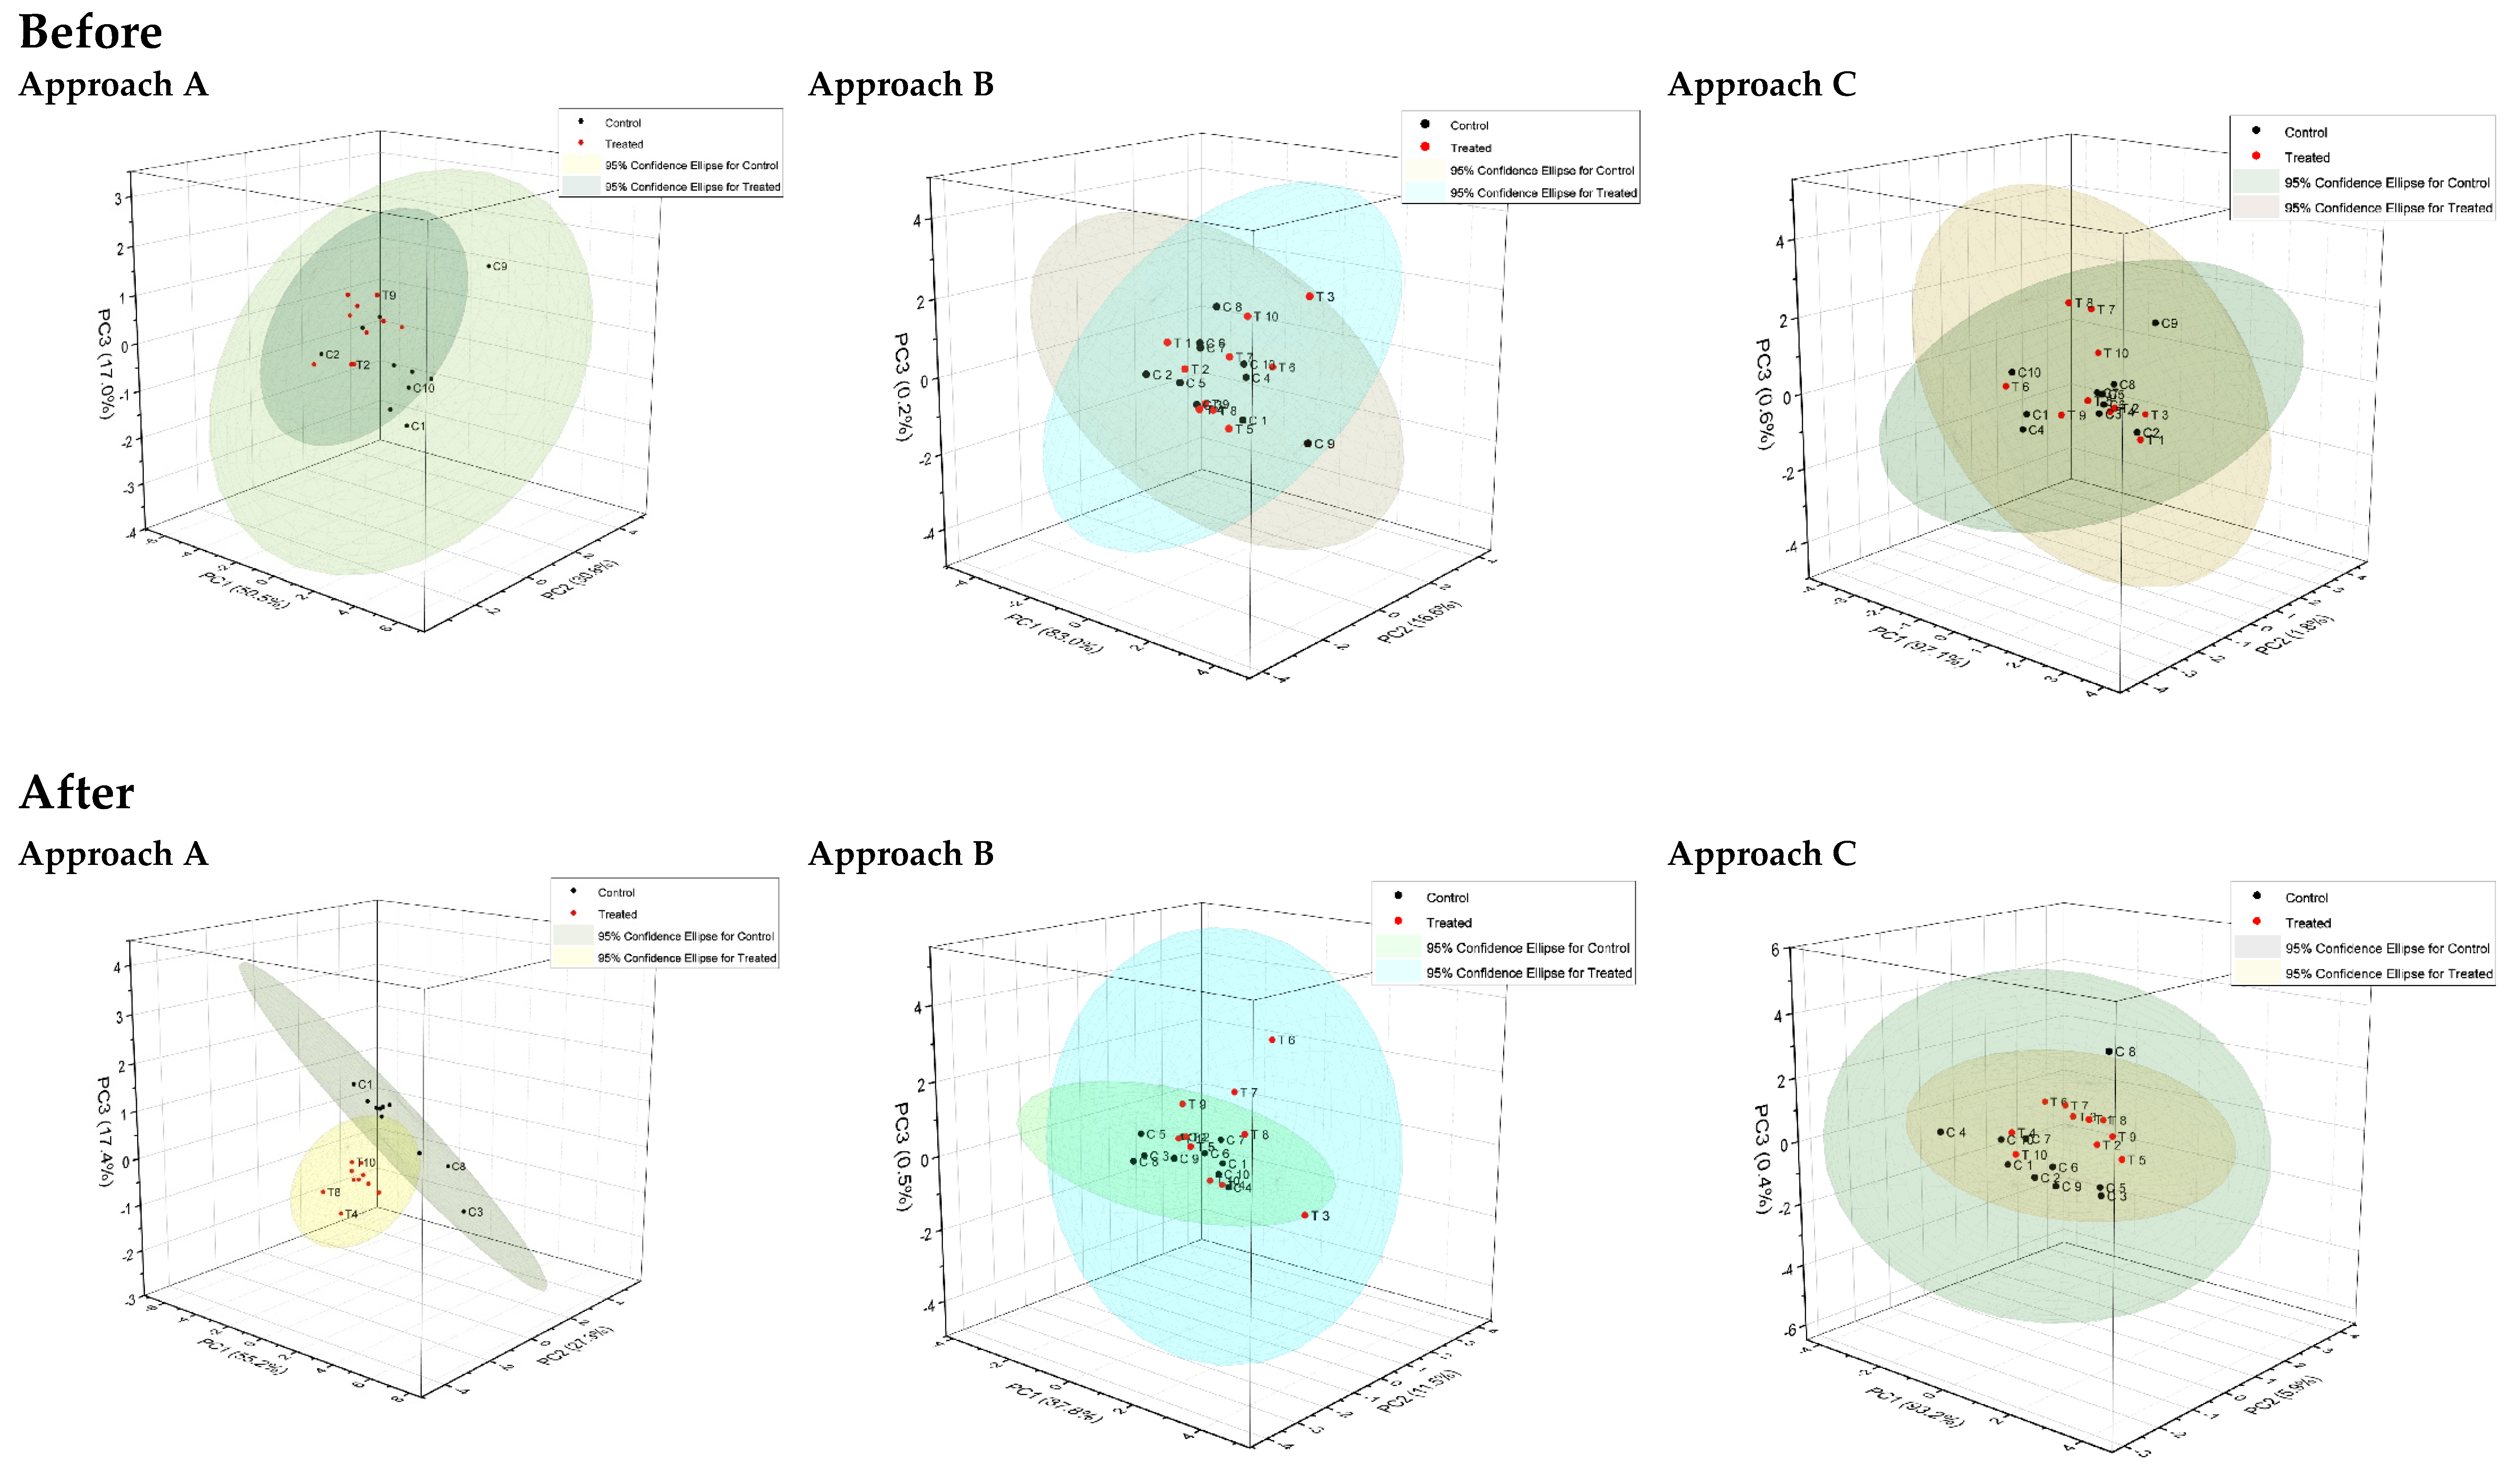
Figure 4, while the results of all three spectra evaluation approaches are shown in
Figure 5. These score plots were used to identify, distinguish, and categorize two small clusters: control and fluorinated varnish treated sample groups. Regarding approach A, making use of derived numerical parameters, PC1 scores account for the majority of variance within all analysed data sets, with proportions of 50.55% and 55.18% before and after an acidic attack, respectively.
As shown in
Figure 3, before treatment, the samples are randomly dispersed, indicating that there is no significant difference between the samples’ overall condition within and between groups initially. After acidic attack, there is a clear separation between the two groups, with the varnish treated samples getting spatially very close to each other, indicating that most of the varnish treated samples (8 out of 10) share almost the same biochemical characteristics, mineral content, and structural arrangement after undergoing the treatment and acid challenges, remaining equally affected.
The key meaning of the PC score, representing the sample distribution obtained with Approach A, is that all analysed spectral parameters, especially band position and depolarization ratio, are strongly influenced by the chemical environment, which has a great impact on hydroxyapatite chemical bonds, and inter- and intramolecular forces of outer enamel layers. These parameters will consequently influence dramatically the sample distribution and group separation [
23]. Regarding approach B, the obtained PC scores from the average Raman spectra were significantly different from those obtained in Approach A. The obtained proportions of the 1st PC were 97.1%, and 93.2% before and after acidic attack. Although the control specimens tend to separate from the treated ones, after acidic attack, we cannot observe anymore a clear separation between these two groups. The plot shows that the treated samples are partially overlaid with controls, and the distribution ellipse for treated group is entirely included in the distribution of control group. Therefore, approach B yielded different results from the previous (A), without showing a clear separation between the sample groups after the acid challenge, and indicating that before any treatment the treated samples show, from a statistical point of view, similar biochemical characteristics, mineral content, and/or structural arrangement from the control group, after undergoing the treatment, while after undergoing the erosive challenge the samples tend to share very similar, if not the same biochemical properties and mineral density. Furthermore, only Approaches B and C provided PC derived spectral loadings, which all carry the most relevant information extracted from average Raman spectra, as shown in
Figure 4. Since very minor numerical changes, such as slight alterations of the peak intensities or subtle shifts, are possible to identify and quantify in the loadings derived from baseline corrected spectra (Approach B), we considered that there is no need to represent the loadings obtained from raw spectra (Approach C).
Regarding Approach C (
Figure 5), the obtained scores were 83.0%, and 87.8% before and after an erosive attack. In this approach, no clear group separation or differentiation between samples was found. The exposed results, obtained by applying PCA in three different ways, reveal that the used approach, when the algorithm is applied directly to the average Raman spectra or separately on extracted spectral parameters, influences the capacity and ability of PCA method for distinguishing and separating two different sample groups, according to the main three PC scores, obtained from average spectra or spectral parameter analysis, with the 1st PC score accounting most. The main drawback could be the analysis of spectra without taking advantage of the polarization anisotropy of the symmetric stretching band of phosphate in hydroxyapatite as a sensitive marker for demineralization. In approaches B and C, while comparing spectra intensities, instrumental variations and sampling heterogeneity weights more in the evaluation of the spectra. It is known that different teeth or even different locations on one tooth can have different Raman scattering efficiency due to bio- heterogeneity, or layer thickness therefore, the measured Raman intensity could vary from person to person or even from tooth to tooth. In contrast, comparing peak ratios avoid these variations as the depolarization ratios respond solely to the underlying structure of enamel.
3.2. Evaluation of the Suitability of Laser Wavelength for Enamel Characterization
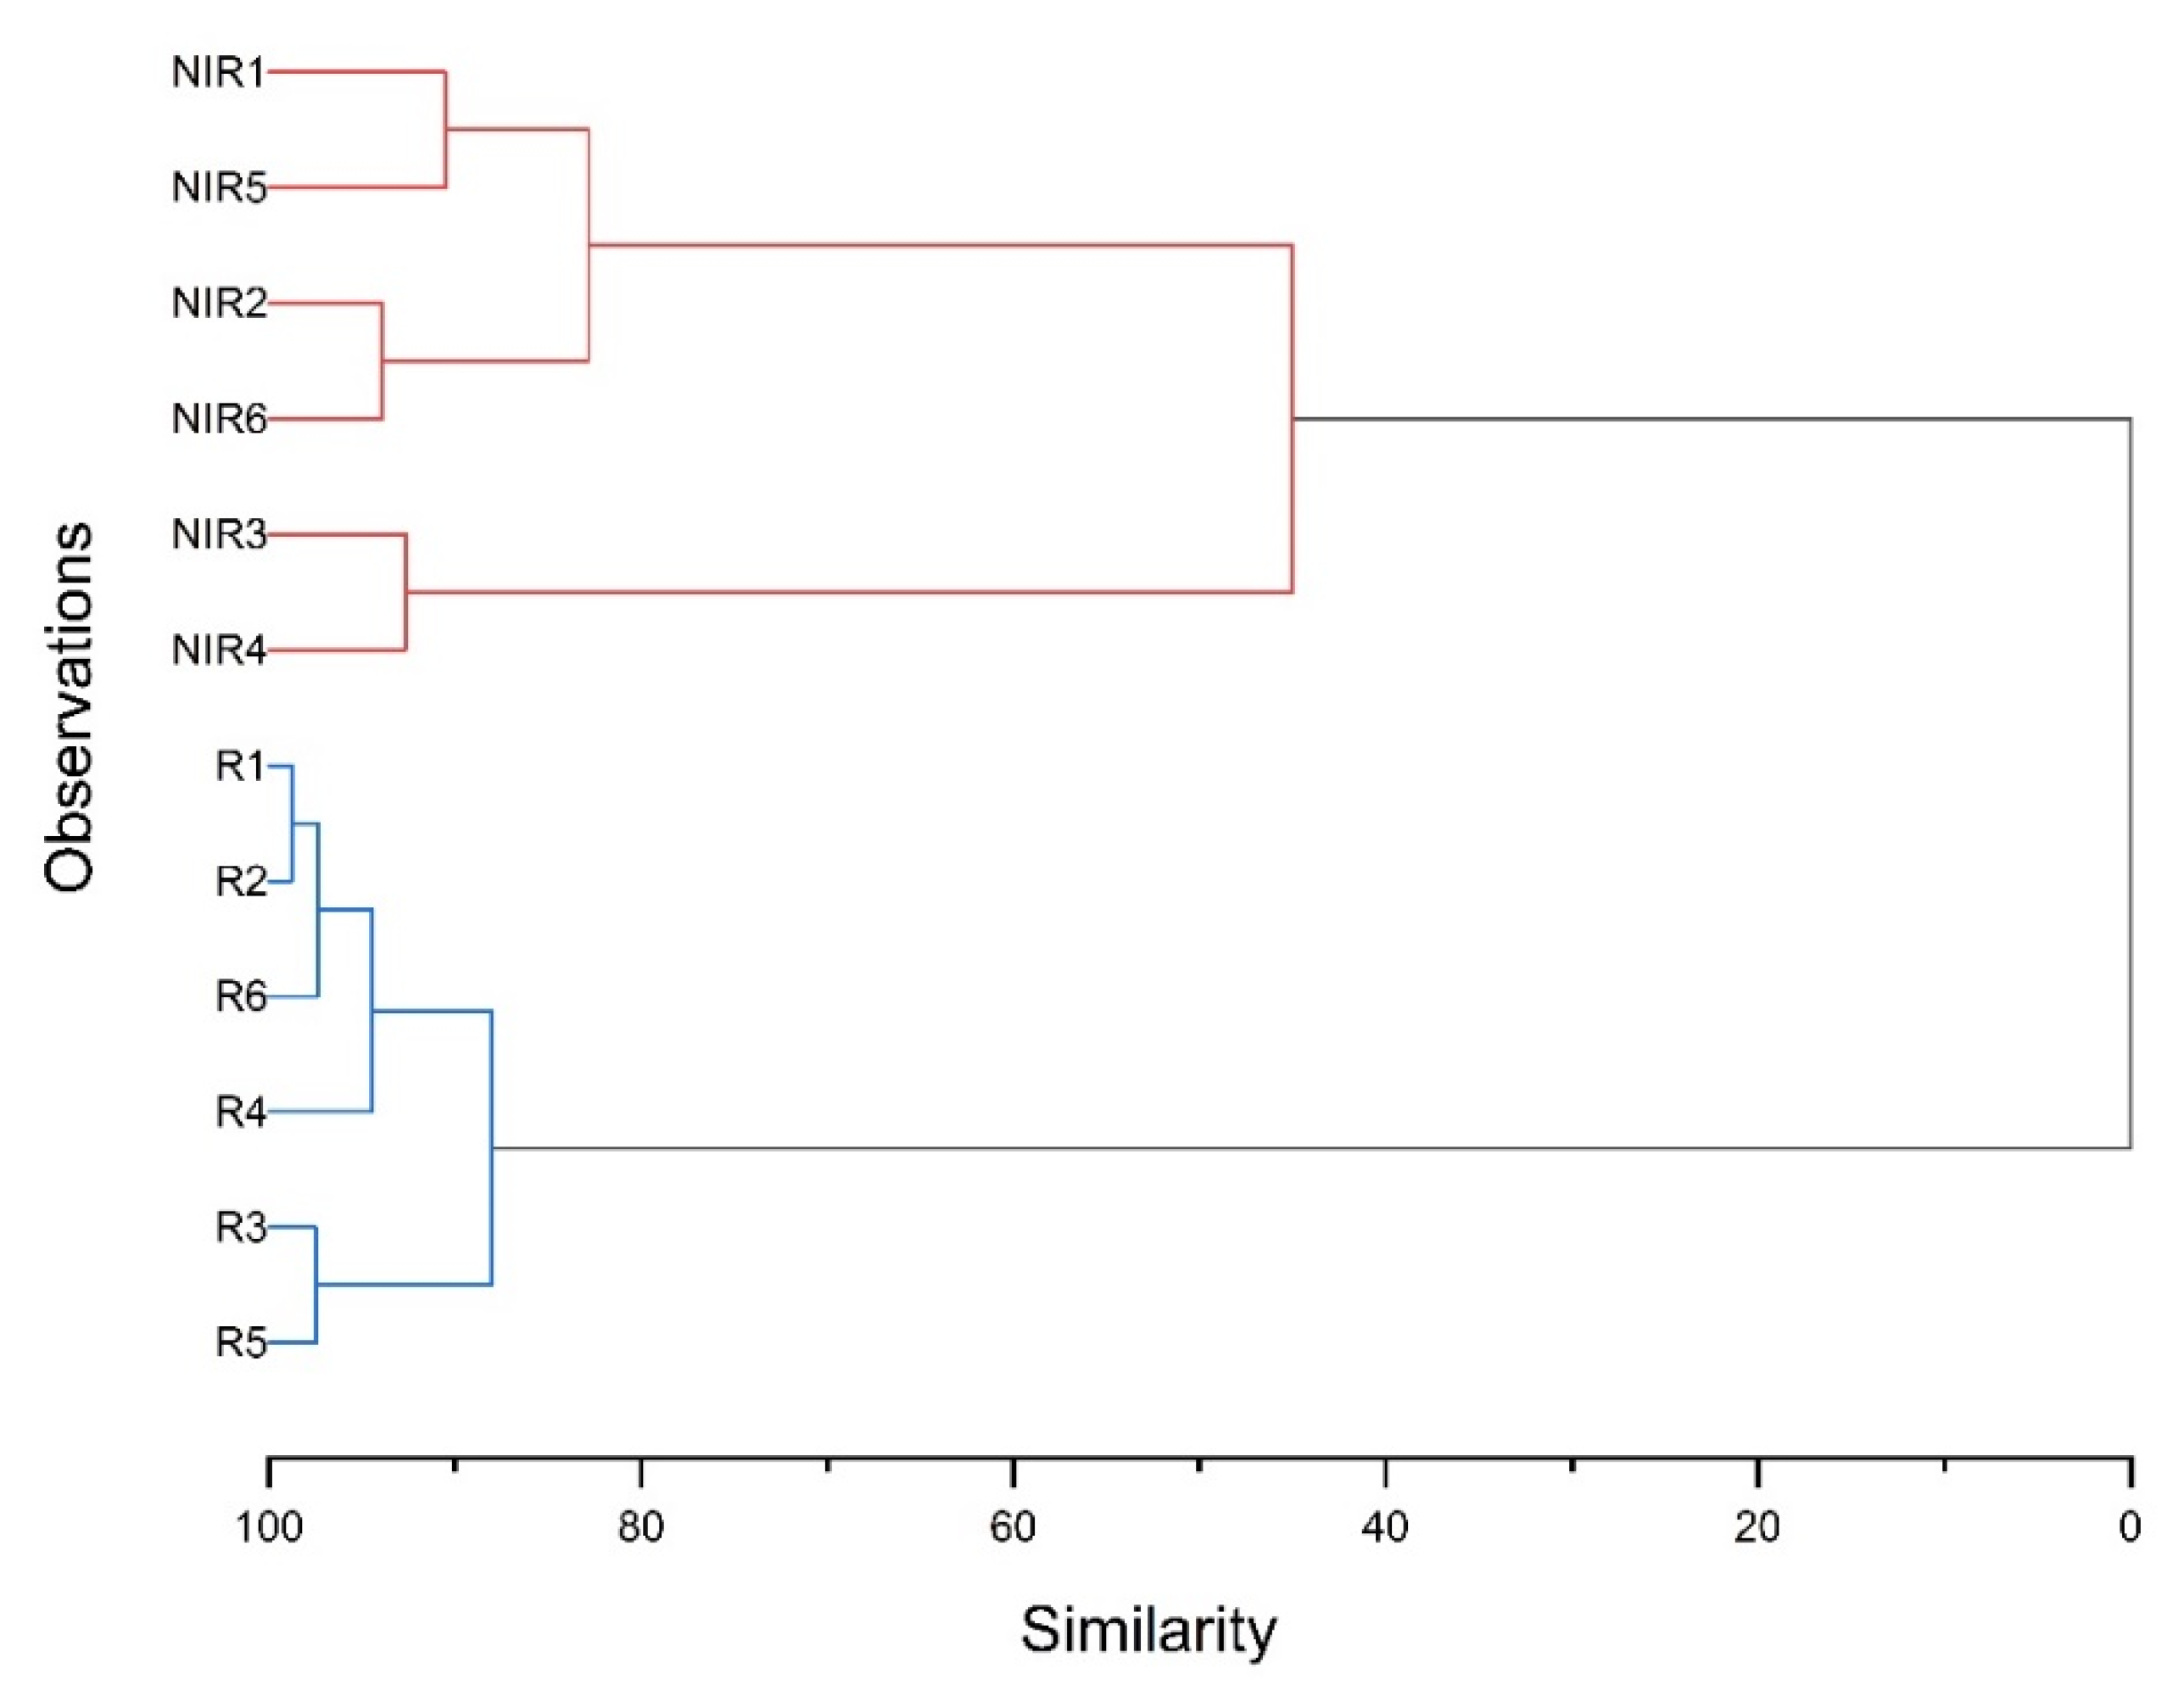
Figure 6 shows the dendrogram obtained from Hierarchical clustering unsupervised analysis applied to the parameters derived from Raman spectra and evaluations of the symmetric stretching band of phosphate (~959 cm
−1), namely, depolarization ratio, anisotropy, FWHM and Raman shift.
The results clearly show the sample identification and the data clusters differentiation according to the Hierarchical clustering method. As can be seen, the shown degree of similarity between the samples is higher when illuminated with a 638 nm laser. This fact indicates that Raman spectroscopic measurements of surface enamel are more precise, with improved quality when using the NIR laser. This allows for a better classification of the acquired results, revealing a greater parametric distance and decreased similarity degree between the examined samples within the same group, thus enhancing their overall characterization at a biomolecular level. This emphasises slightly more the discrepancy between the overall condition of the specimens, encompassing the structural arrangement and orientation of outer layers (sharper and well-defined peaks, not substantially shifted from 959 cm
−1), as well as hydroxyapatite quantity from thinner or thicker enamel layers (higher peak intensity) and mineral density, as mentioned in [
14].
The increase in precision is further highlighted by the determination of the depolarization ratio (ρ959), revealing lower uncertainties when using the 785 nm laser (
Table 1). The depolarization ratio is indicative of the soundness of teeth [
12], presenting increased values for demineralized enamel [
23,
24]. Although the results obtained with both lasers are in agreement, samples S2 and S6 present higher depolarization ratio, while samples 3, 4 and 5 are more difficult to differentiate; the higher uncertainties rendered by measurements with the red laser would not allow to distinguish between sound and demineralized enamel with the main purpose of performing such an analysis.
4. Conclusions and Future Work
Raman spectroscopy has confirmed to be a highly specific and sensitive analytical technique in the biomedical field, providing precise results and accurate specific spectral parameters that characterize the overall condition of the tooth (mineralization degree, caries and/or lesions presence, crystalline orientation and structural arrangement of both surface and inner morphologic layers).
Regarding the data evaluation approach, Approach C has revealed to be unsuitable for this kind of study, rendering sample distributions and group separations that cannot be discriminated or classified. Approach A showed a clear group separation at the end of the acidic challenge, while Approach B showed a clear group separation and sample differentiation after the treatment stage, distinguishing the control group from the varnish treated.
The obtained results must be considered preliminary, confirming, that the Raman-PCA technique has a strong capability to be a non-invasive real-time tool for (early) detection and monitoring evolution of dental caries and demineralization/remineralization processes. Therefore, PCA can be certainly used to recognize similar features within the analysed enamel samples, as well as to compare and differentiate between different spectral parameters for a precise distinction and classification of the sample groups under examination.
This study proves that the Raman spectroscopy technique combined with the PCA method has a strong potential to discriminate healthy teeth with sound enamel from demineralized ones, control from treated samples, as well as spectral measurements performed with different laser wavelengths, with good sensitivity and specificity levels. The Raman-PCA technique can certainly be employed to monitor the evolution of dental samples during different dental product applications and acid challenges, since it requires no or minimal sample preparation and can provide objective, accurate, real-time, specific, and fast results, reducing subjectivity to human error. There is a high probability that in the next few years, Raman spectroscopy could be routinely used in hospitals, applied particularly to in vivo examinations for diagnosing and surveying several diseases, producing each time quicker and more accurate results, decreasing waiting times and, subsequently, improving investigation efficiency, accuracy, and confidence, along with the efficacy of treatments.
Author Contributions
Conceptualization, I.O., S.P. and M.L.C.; methodology, S.P., V.V. and I.O.; software, I.O.; validation, S.P., V.V. and I.O.; formal analysis, I.O. and S.P.; investigation, I.O.; resources, J.P.S. and A.M.; data curation, J.S. and I.O.; writing—original draft preparation, I.O., J.S., V.V., A.M., M.L.C., J.P.S. and S.P.; writing—review and editing, S.P., V.V. and J.S.; visualization, I.O., S.P. and V.V.; supervision, A.M., S.P. and J.P.S.; project administration, S.P. and J.P.S.; funding acquisition, J.P.S. All authors have read and agreed to the published version of the manuscript.
Funding
LIBPhys funding UID/FIS/ 04559/2021 and I. Otel PhD grant PD/BDE/143107/2018.
Institutional Review Board Statement
Not applicable.
Informed Consent Statement
The study was presented to the Ethics committee of the Faculty of Dentistry, University of Lisbon and approval was waived for this study because the human specimen were duly anonymized (CEBD2021020).
Data Availability Statement
Data is contained within the article.
Acknowledgments
This work has been financially supported by Fundação para a Ciência e a Tecnologia through the LIBPhys funding UID/FIS/ 04559/2021 and I. Otel PhD grant PD/BDE/143107/2018.
Conflicts of Interest
There are no conflicts of interest between the authors of the present paper. The authors declare no conflict of interest.
References
- Ko, A.C.-T.; Hewko, M.; Sowa, M.G.; Dong, C.C.S.; Cleghorn, B.; Choo-Smith, L.-P. Early dental caries detection using a fibre-optic coupled polarization-resolved Raman spectroscopic system. Opt. Express 2008, 16, 6274–6284. [Google Scholar] [CrossRef] [Green Version]
- Vargas-Koudriavtsev, T.; Durán-Sedó, R.; Sáenz-Bonilla, P.; Bonilla-Mora, V.; Guevara-Bertsch, M.; Jiménez-Corrales, R.A.; Herrera-Sancho, O.A. Effect of tooth-bleaching agents on phosphate concentration in dental enamel by means of Raman spectroscopy. Rev. Odontológica Mex. 2015, 19, e228–e235. [Google Scholar] [CrossRef] [Green Version]
- Ramakrishnaiah, R.; Rehman, G.U.; Basavarajappa, S.; Al Khuraif, A.A.; Durgesh, B.H.; Khan, A.S.; Rehman, I.U. Applications of Raman Spectroscopy in Dentistry: Analysis of Tooth Structure. Appl. Spectrosc. Rev. 2015, 50, 332–350. [Google Scholar] [CrossRef]
- Buchwald, Z.; Okulus, Z.; Szybowicz, M. Raman spectroscopy as a tool of early dental caries detection-new insights. J. Raman Spectrosc. 2017, 48, 1094–1102. [Google Scholar] [CrossRef]
- Lussier, F.; Thibault, V.; Charron, B.; Wallace, G.; Masson, J.-F. Deep learning and artificial intelligence methods for Raman and surface-enhanced Raman scattering. TrAC Trends Anal. Chem. 2020, 124, 115796. [Google Scholar] [CrossRef]
- Nunes, A.; Magalhães, S. Raman Spectroscopy Applied to Health Sciences. In Raman Spectroscopy; IntechOpen, Headquarters IntechOpen Limited 5 Princes Gate Court: London, UK, 2018. [Google Scholar] [CrossRef] [Green Version]
- Vandenabeele, P. Practical Raman Spectroscopy: An Introduction; John Wiley & Sons: Hoboken, NJ, USA, 2013; ISBN 9781119961901. [Google Scholar]
- Monteiro, M.; Chasqueira, F.; Pessanha, S. Raman spectroscopy in the characterisation of carious dental tissues. Spectrosc. Eur. 2018, 30, 11–14. [Google Scholar]
- Buchwald, T.; Buchwald, Z. Assessment of the Raman spectroscopy effectiveness in determining the early changes in human enamel caused by artificial caries. Analyst 2019, 144, 1409–1419. [Google Scholar] [CrossRef] [PubMed]
- Kekkonen, J.; Finnilä, M.A.J.; Heikkilä, J.; Anttonen, V.; Nissinen, I. Chemical imaging of human teeth by a time-resolved Raman spectrometer based on a CMOS single-photon avalanche diode line sensor. Analyst 2019, 144, 6089–6097. [Google Scholar] [CrossRef] [PubMed] [Green Version]
- Buchwald, Z.; Okulus, Z. Determination of storage solutions influence on human enamel by Raman spectroscopy. Vib. Spectrosc. 2018, 96, 118–124. [Google Scholar] [CrossRef]
- Buchwald, T.; Buchwald, Z.; Daktera-Micker, A. The fluorescence background in Raman spectra of sound enamel. Vib. Spectrosc. 2021, 115, 103275. [Google Scholar] [CrossRef]
- Pankrushina, E.A.; Kiseleva, D.V.; Mandra, Y.V.; Ozhgikhina, N.V. Raman hypermapping of human teeth: Analysis and statistical approaches. In Proceedings of the 2nd International Conference on Physical Instrumentation and Advanced Materials 2019, Surabaya, Indonesia, 22 October 2019; Volume 2313, p. 050044. [Google Scholar]
- Prikule, D.; Kukushkin, V.; Mitronin, A.; Prikuls, V. Studying the Degree of Tooth Enamel Mineralization through Raman Spectroscopy in Various Spectral Ranges. Biophysica 2021, 1, 269–278. [Google Scholar] [CrossRef]
- Vo-Dinh, T. Biomedical Photonics Handbook; CRC Press: Boca Raton, FL, USA, 2003. [Google Scholar]
- González-Solís, J.L.; Martínez-Cano, E.; Magaña-López, Y. Early detection of dental fluorosis using Raman spectroscopy and principal component analysis. Lasers Med. Sci. 2014, 30, 1675–1681. [Google Scholar] [CrossRef]
- Barrera-Ortega, C.C.; Vázquez-Olmos, A.R.; Sato-Berrú, R.Y.; Araiza-Téllez, M.A. Study of Demineralized Dental Enamel Treated with Different Fluorinated Compounds by Raman Spectroscopy. J. Biomed. Phys. Eng. 2020, 10, 635–644. [Google Scholar] [CrossRef] [PubMed]
- Mihály, J.; Gombás, V.; Afishah, A.; Mink, J. FT-Raman investigation of human dental enamel surfaces. J. Raman Spectrosc. 2009, 40, 898–902. [Google Scholar] [CrossRef]
- Bērziņš, K.; Sutton, J.J.; Loch, C.; Beckett, D.; Wheeler, B.J.; Drummond, B.K.; Fraser-Miller, S.J.; Gordon, K.C. Application of low-wavenumber Raman spectroscopy to the analysis of human teeth. J. Raman Spectrosc. 2019, 50, 1375–1387. [Google Scholar] [CrossRef]
- Sharma, V.; Rastogi, S.; Bhati, K.K.; Srinivasan, A.; Roychoudhury, A.; Nikolajeff, F.; Kumar, S. Mapping the Inorganic and Proteomic Differences among Different Types of Human Teeth: A Preliminary Compositional Insight. Biomolecules 2020, 10, 1540. [Google Scholar] [CrossRef]
- Natarajan, A.K.; Fraser, S.J.; Swain, M.; Drummond, B.K.; Gordon, K.C. Raman spectroscopic characterisation of resin-infiltrated hypomineralised enamel. Anal. Bioanal. Chem. 2015, 407, 5661–5671. [Google Scholar] [CrossRef] [PubMed]
- Das Gupta, S.; Killenberger, M.; Tanner, T.; Rieppo, L.; Saarakkala, S.; Heikkilä, J.; Anttonen, V.; Finnilä, M.A.J. Mineralization of dental tissues and caries lesions detailed with Raman microspectroscopic imaging. Analyst 2021, 146, 1705–1713. [Google Scholar] [CrossRef] [PubMed]
- Otel, I.; Silveira, J.M.; Vassilenko, V.; Mata, A.; Pessanha, S. Application of Machine Learning Methods to Raman Spectroscopy Technique in Dentistry. In Doctoral Conference on Computing, Electrical and Industrial Systems; Camarinha-Matos, L.M., Ferreira, P., Brito, G., Eds.; Springer: Cham, Switzerland, 2021; Volume 626, pp. 339–348. [Google Scholar] [CrossRef]
- Cândido, M.; Silveira, J.; Mata, A.; Carvalho, M.; Pessanha, S. In vitro study of the demineralization induced in human enamel by an acidic beverage using X-ray fluorescence spectroscopy and Raman microscopy. X-ray Spectrom. 2019, 48, 61–69. [Google Scholar] [CrossRef] [Green Version]
| Publisher’s Note: MDPI stays neutral with regard to jurisdictional claims in published maps and institutional affiliations. |
© 2021 by the authors. Licensee MDPI, Basel, Switzerland. This article is an open access article distributed under the terms and conditions of the Creative Commons Attribution (CC BY) license (https://creativecommons.org/licenses/by/4.0/).


 ,
, 


