
Automated Detection of Improper Sitting Postures in Computer Users Based on Motion Capture Sensors


Faculty of Computer Science and Automation, Technical University of Varna, 1 Studentska Str., 9010 Varna, Bulgaria
*
Author to whom correspondence should be addressed.
Computers 2022, 11(7), 116; https://0-doi-org.brum.beds.ac.uk/10.3390/computers11070116
Submission received: 31 May 2022
/
Revised: 17 July 2022
/
Accepted: 18 July 2022
/
Published: 20 July 2022
(This article belongs to the Special Issue Advances of Machine and Deep Learning in the Health Domain)
Abstract
:Prolonged computer-related work can be linked to musculoskeletal disorders (MSD) in the upper limbs and improper posture. In this regard, we report on developing resources supporting improper posture studies based on motion capture sensors. These resources were used to create a baseline detector for the automated detection of improper sitting postures, which was next used to evaluate the applicability of Hjorth’s parameters—Activity, Mobility and Complexity—on the specific classification task. Specifically, based on accelerometer data, we computed Hjorth’s time-domain parameters, which we stacked as feature vectors and fed to a binary classifier (kNN, decision tree, linear SVM and Gaussian SVM). The experimental evaluation in a setup involving two different keyboard types (standard and ergonomic) validated the practical worth of the proposed sitting posture detection method, and we reported an average classification accuracy of up to 98.4%. We deem that this research contributes toward creating an automated system for improper posture monitoring for people working on a computer for prolonged periods.
1. Introduction
Computer-related activity is becoming a significant factor in the private and professional life of people around the world. In 2021, the average number of people who used computers and the internet for work-related tasks in the European Union was 58% of the workforce, with this percentage varying between 37% and 85% for the different member countries and an average total increase of 14% for the period 2012–2021 [1]. It was documented that prolonged computer use might be linked to a number of health problems, such as eyesight deterioration, weight gain and musculoskeletal disorders [2]. The development of musculoskeletal problems can be additionally highlighted, as it affects 47% of computer users [3], with problems manifesting most commonly as headaches, neck and shoulder problems and back pain. The most common causes of these health issues are incorrect and non-ergonomic work posture and environment, which can lead to neck–shoulder disorders [4,5,6] and discomfort of the upper limbs [7,8]. These conditions often result from static muscle load and awkward wrist position during keyboard operation [9].
Automated monitoring of the work environment and sitting postures during prolonged computer work is an essential component of efforts for musculoskeletal health safeguarding. Studies aimed at assessing workstation usage data [10] show that recordings of workstation behavioral patterns contain sufficient differences, allowing for the distinction of activities that lead to pain and fatigue or help avoid them. Based on these, different approaches for activity monitoring and assistance devices have been proposed. Among those are systems based on image processing techniques, which assess the correctness of the work posture [11,12,13], smart Internet of Things (IoT)-based office chairs, which classify the sitting postures [14], and wearable devices [15] and others. Machine-learning techniques are further employed in tasks such as estimating healthy sitting poses from posture data [16].
Specifically, assessing working posture based on image processing is a convenient approach to posture detection and classification. These solutions employ camera and imaging setups that record workers and access their work posture and the connected health risks. This approach can be used for computer-related office work [17] and physically demanding high-risk work, such as maintenance, handling and assembly [18]. Image processing algorithms are often combined with the application of neural networks [17,19,20], which results in high classification accuracy for both person-specific and general classification tasks. Specifically, the system presented in Ref [18] has a reported recognition rate of high-risk work postures comparable to the baseline assessment of an ergonomic expert. Overall, image-processing-based approaches provide a non-disruptive and accurate approach for classifying work postures, which do not require wearable sensors or devices and are most commonly employed for manufacturing or handling tasks. The main drawbacks of these types of systems are the required image capture setups and employees’ privacy concerns. An approach to addressing privacy concerns is examined by Li et al. [21] through the use of a non-contact wireless-based system for recognizing sitting postures.
When the use of cameras is unsuitable, for instance, due to security or privacy issues, the classification of sitting postures based on body positioned sensors or elements of the workplace environment is used. The studies on sitting posture classification using pressure sensors positioned on the chairs demonstrate a high level of accuracy; for instance, Zemp et al. [22] reported a classification success rate of 90.9%, achieved through several classifiers, including SVM, neural networks and random forest, on data recorded using 17 pressure sensors. Maximum classification accuracy of 84% was reported using the naïve Bayes classifier [23], while in Ref [24], Ma et al. reported accuracies higher than 99% achieved using J48, K-nearest neighbors (kNN), naïve Bayes, support vector machine (SVM) and multi-layer perceptron neural network (MLPNN) classifiers. In these reports, pressure sensor data were used. Similar high classification results were reported in studies where participant behavior was recorded using an accelerometer. Ma et al. [25] used a single three-axis accelerometer attached to the participants’ backs and reported a classification accuracy of 95.3% using the SVM classifier and 89.3% using K-means clustering. The comparable average accuracy of 95% using the SVM classifier combined with principal component analysis (PCA) feature reduction was reported again by Ma et al. [26], with data recorded using in-house-designed neckband-shaped earphones.
Prolonged computer-related work with an inappropriate keyboard might provoke improper sitting and hand positions related to musculoskeletal disorders in the upper limbs. Thus, several studies focused on analyzing the effects and differences in ergonomic keyboards reported that this might be the case. The earliest studies on the topic [27] measured wrist postures and reported reduced pain levels when operating on an alternative keyboard. Later studies on the topic also considered the position of the forearms [28] and again reported a more natural and less straining position of the arms when specialized keyboards were used. A study on six different keyboard types [29] conducted with 100 participants showed that a keyboard with a slope of 0°, opening angle of 12° and gable angle of 14° provided the most neutral position. When ergonomic keyboards are compared with standard keyboard configurations [30], significant differences in digit angles, angular velocity and angular acceleration are observed, particularly in the metacarpophalangeal joints of the left hand. The authors suggest that wrist position should be taken into account when keyboards are evaluated, but other factors and locations on the body should also be considered. This suggestion is supported by findings [31] showing that the different computer setups strongly affect neck and spine positions.
In the present study, we report on developing resources (a dataset and software) to support research on proper/improper postures detection considering scenarios characterized by prolonged computer work. Based on these resources, we created an automated detector of improper sitting postures based only on data from motion capture sensors. We used this baseline detector to evaluate the applicability of Hjorth’s parameters [32]—Activity, Mobility and Complexity—as feature vectors providing a compact representation of multisensory accelerometer data. An experimental evaluation of the applicability of these features, when combined with some well-known and widely used classifiers in setups involving two different keyboards (standard and ergonomic), was shown to provide accurate detection of improper sitting postures. The reported high recognition accuracy validates the applicability of the proposed method and the practical worth of the developed resources. We deem the current research contributes toward creating an automated system for preventing musculoskeletal disorders (MSD) during prolonged periods of computer work. The novel aspects reported in the current study are mainly in the developed resources, which we made publicly available, the validation of Hjorth parameters as features for accelerometer data and the demonstration of accurate automated detection of improper posture with the simple baseline classification methods. Here, we emphasize that Hjorth’s parameters were initially proposed for electroencephalographic (EEG) studies and later were also found helpful for the compact representation of peripheral physiological signals [33,34]. To the authors’ knowledge, Hjorth’s parameters were not studied for accelerometer data to this end.
In Section 2, “Materials and methods”, we present a detailed description of the methodology, experimental protocol and dataset used in the experimental evaluation. Section 3, “Data processing and evaluation”, provides information about the algorithms and approaches used to parameterize and classify the motion capture data. In Section 4, we report experimental results for recognizing three sitting postures. Finally, in Section 5, we discuss the experimental results and their implications, and in Section 6, concluding remarks and an outline of future research are presented.
2. Materials and Methods
The current research focused on posture recognition based on motion capture systems data. The overall workflow of data processing in the proposed method for automated posture detection is presented in Figure 1.
As shown in Figure 1, we rely on a purposely developed motion capture dataset consisting of multisensory measurements corresponding to proper and improper sitting postures when different keyboards are used (a detailed description of the dataset is provided in Section 2.1). Next, the data are subject to preprocessing, mainly consisting of average value removal for each sensor channel and removal of artefacts. Hjorth’s parameters—Activity, Mobility and Complexity—are then computed from the preprocessed data. The feature vectors, composed of the concatenation of Hjorth’s parameters computed for each sensor channel, are then fed to the classifier to make the final decision.
2.1. Dataset
A dataset of motion capture data, images, videos and models was created in an experimental setup that used the Perception Neuron motion-capture system and the Axis Neuron software tool. Specifically, in the current research, we consider three main recording scenarios:
- SK—regular working posture when using a standard keyboard;
- EK—regular working posture when using an ergonomic keyboard;
- EKC—correct working posture when using an ergonomic keyboard.
In the recording protocol, a regular posture is defined as the sitting posture that participants take naturally while working on a computer. For recording a proper work posture, we used a special sitting pillow, which required the sitting person to keep a balanced and proper working posture. A medical specialist in the field of MSD rehabilitation instructed each participant on how to keep a proper posture when sitting on the pillow. The recording context: with/without a pillow and standard/ergonomic keyboards were recorded with short breaks within a 45 min session.
The data recording protocol started with the placement and calibration of motion capture sensors, after which the participants were asked to type a pre-selected text on a computer with a standard 89-button keyboard. Each recording session included three sub-sessions—standard keyboard and usual posture (SK), ergonomic keyboard and usual posture (EK) and ergonomic keyboard and correct posture (EKC). The SK and EK recording sessions had an average length of 10 min, while the EKC sessions had an average length of 3 min. The recording of the participants’ physical activity was performed by using the motion-capture system perception neuron. The system included 59 sensors, of which 21 were placed on the body, and 39 were placed on the fingers of both hands. In total, ten persons were recorded (The Motion-Capture DataSet in support of MSD research (MCD-MSD) is publicly available at the ErgoResearch project website, URL: http://isr.tu-varna.bg/ergo/index.php/resursi, accessed on 30 May 2022). Specifically, we used only the motion capture data in the current study.
2.2. Initial Processing and Data Transformation
The motion capture recordings were preprocessed to facilitate the subsequent feature extraction process. The preprocessing was needed to segment the recordings of each of the three scenarios, validate the tags introduced during data collection sessions and discard episodes with artefacts associated with setup changes during the breaks. For that purpose, we used the functionality available in the axis neuron tool. Subsequently, we extracted only the data channels relevant to our study. Specifically, the following parametric descriptions of the motion capture data were exported: bone posture quaternion in bone coordinates, displacement; speed in ground coordinates; initial acceleration; gyro data in module coordinates. A result of the raw data used in our study contained each motion capture sensor positioned on the body. The following data were obtained:
- World coordinate displacement X indicates the changes in the position of each sensor. A total of three results per sensor are obtained—Xx, Xy, Xz—one for each dimension. The unit in which the obtained results are measured is the meter.
- Velocity V indicates the speed with which each sensor is displaced. A total of three results per sensor are obtained—Vx, Vy, Vz—one for each dimension. The unit in which the obtained results are measured is meters per second.
- World coordinate module’s posture data Q, four results per sensor are obtained—Qs, Qx, Qy, Qz.
- Module coordinate accelerated speed A, which measures the acceleration of each of the sensors, with three results obtained per sensor—Ax, Ay, Az. The unit in which the obtained results are measured is g.
- Module coordinate accelerated speed M, which measures the acceleration of each of the sensors, with three results obtained per sensor—Mx, My, Mz. The unit in which the obtained results are measured is radian per second.
A total of 16 parameters are calculated from the data recorded from each sensor. The data files were exported in csv format.
2.3. Mean Value Removal
In order to eliminate the average value of each sensor channel, we used mean computing with analysis of variance (ANOVA), as the sensor data roughly fitted the Gaussian distribution. The preprocessed data were separated into two subsets. The first subset contained data from 14 sensors positioned on the participants’ arms, heads and bodies in the experiments. The second contained data from 38 sensors positioned on the fingers of the participants. The one-way ANOVA approach was used to calculate the mean values, performed separately for each of the three classes (EK, EKC and SK). The preprocessed data were further used for feature extraction.
3. Data Processing and Evaluation
3.1. Feature Extraction
The preprocessing data were used to calculate Hjorth’s parameters [32]—Activity, Mobility and Complexity. Hjorth’s parameters were initially designed for EEG signal analysis; however, given that they provide information about the spectral characteristics of the signals and have found application in a broader range of fields, we postulated that they would be an elegant way to describe the accelerometer data collected here. We decided to evaluate the applicability of Hjorth’s parameters on the sitting posture recognition tasks, as they are easy to compute in the time domain and have a straightforward, intuitive meaning.
Precisely, a high or low value for Activity corresponds to the existence of high or low-frequency components in the analyzed signals:
where σ is the standard deviation of the examined signal.
The parameter Mobility represents the average frequency of the signal. This feature corresponds to the calculation of the standard deviation of a signal in the frequency domain:
where σd is the first temporal derivative of the standard deviation of the examined signal.
The parameter Complexity is a measure of details concerning the curve shape of the sine wave.
where σdd is the second temporal derivative of the standard deviation of the examined signal.
These parameters were extracted for segments of 1 s for each sensor channel. Hjorth’s parameters for a segment for all channels were concatenated to form the feature vector.
We formed three datasets. The first datasets contained features calculated only from data acquired from eight sensors positioned on the arms of the participants. The second dataset contained features calculated from data from six sensors positioned on the back and head of the participants. The third dataset contained features from 38 sensors positioned on the fingers of the participants’ left and right hands. Specifically, in the third case, where data from the finger sensors were used, the results for the World coordinate displacement (Xx, Xy, Xz) and Velocity (Vx, Vy, Vz) calculations are omitted. This is performed because the results obtained from the preprocessing of these parameters are zero. This is caused by the small values of displacement of the positions of the fingers due to the nature of the performed activity (typing on a keyboard). As a result of the omission, Hjorth’s parameters are calculated from 10 parameters (Qs, Qx, Qy, Qz, Ax, Ay, Az, Mx, My, Mz) per sensor.
In addition, for each of the three created datasets, seven subsets of feature data were formed, which are as follows:
- Activity-only dataset;
- Mobility-only dataset;
- Complexity-only dataset;
- Activity- and Mobility-only dataset;
- Activity- and Complexity-only dataset;
- Mobility- and Complexity-only dataset;
- Activity, Mobility and Complexity dataset.
The total length of the feature vector for different cases can be calculated as the number of sensors multiplied by the number of parameters calculated from each sensor and the number of features in the subset. The resulting feature vector lengths for the three datasets are as follows:
- Hands: 8 sensors with 16 parameters calculated per sensor = 128 to 384 features;
- Back: 6 sensors with 16 parameters calculated per sensor = 96 to 288 features;
- Fingers: 38 sensors with 10 parameters calculated per sensor = 380 to 1140 features.
In some cases, during the recording period, no changes in the position of the sensor for over a second occur. This causes the recording of a single, constant value for the entire period, which leads to an inability to correctly calculate features. In these scenarios, the result for the previous (or following) second is used for the second during which a calculation cannot be performed.
3.2. Feature Ranking
Feature ranking with the ReliefF algorithm was used to evaluate the relevance of each feature. ReliefF operates by evaluating the worth of a given attribute by repeatedly sampling an instance and comparing the attribute’s value with its nearest instances from both the same and different classes [35]. The subsets containing a combination of all the features (Activity, Mobility and Complexity) for each of the three classes (EK, EKC, SK) were used in the ranking. The feature vectors were analyzed using the WEKA machine-learning toolbox [36]. For the ranking of the features, 10-fold cross-validation was performed. During the 10-fold cross-validation, the datasets were randomly separated, and different data sections were used to train and evaluate each validation iteration. After the process is repeated 10 times, a final result is obtained. This approach avoids overfitting and selection bias and provides a more generalized model behavior.
3.3. Classification
For the evaluation of the applicability of the feature subsets defined in Section 3.1, we experimented with four well-known and well-understood classification algorithms, such as kNN [37], decision tree [38] and SVM [39], with linear and Gaussian kernels. The classification experiments were conducted using the Matlab Machine learning toolbox, where each classifier was fed with the same feature vectors. In all experiments, we followed the 10-fold cross-validation approach with an automated classifier parameter optimization as follows:
- Decision tree: Maximum number of splits and split criterion (Gini’s diversity index, Twoing rule, maximum deviance reduction).
- kNN: Number of neighbors (range 1–1000), distance metric (Euclidean, city block, Chebyshev, cubic, Mahalanobis, cosine, correlation, Spearman, Hamming, Jaccard), distance weight (equal, inverse, squared inverse) and data standardization.
- SVM (for both linear and Gaussian kernels): box constraint level and data standardization. The multiclass method chosen for both kernel types is “One-vs-All”.
4. Results
4.1. Average Mean Value Visualization and Analysis
Each participant’s data were split into two subsets—body and finger sensors. This operation was performed for each of the 10 participants in the datasets, and the results are averaged. This eliminates person-specific occurrences and allows for a general overview of the observed differences. The average mean values for each class are then subtracted, and three sets of results are obtained: (a) difference between EKC and EK setup; (b) difference between EKC and SK setup; (c) difference between EK and SK setup. This operation is performed for both body and fingers setups, and the results are presented in Figure 2, Figure 3, Figure 4, Figure 5, Figure 6 and Figure 7.
In these figures, it can be seen that a variation between the calculated mean values of the signals exists for different cases. These variations demonstrate specific characteristics for the cases where different keyboards are used and those where the posture is different, but the keyboard is unchanged. As expected, the slightest difference in the data from the sensors is between a common and correct working position when typing with an ergonomic keyboard. This means that a change in work habits is enough for a positive change in the working position—in some situations, even changing the keyboard could be a sufficient step toward improving the overall health condition before costly improvements in the work environment or the more difficult changes in behavior. However, in this case, the highest difference occurs on the sensors positioned along the spine regarding their acceleration. The differences in the position of body parts when using ergonomic and ordinary keyboards are significant, with substantial variation in the positions of the left and right hands. The differences become even more pronounced when a proper work posture is taken when using the ergonomic keyboard—the change can be measured in the displacement in the Y-axis along all of the sensors, with the highest difference observed in the sensor placed at the right forearm of the participants. The change caused by the proper posture also manifests as higher acceleration measurement in the left and right forearms of the participants.
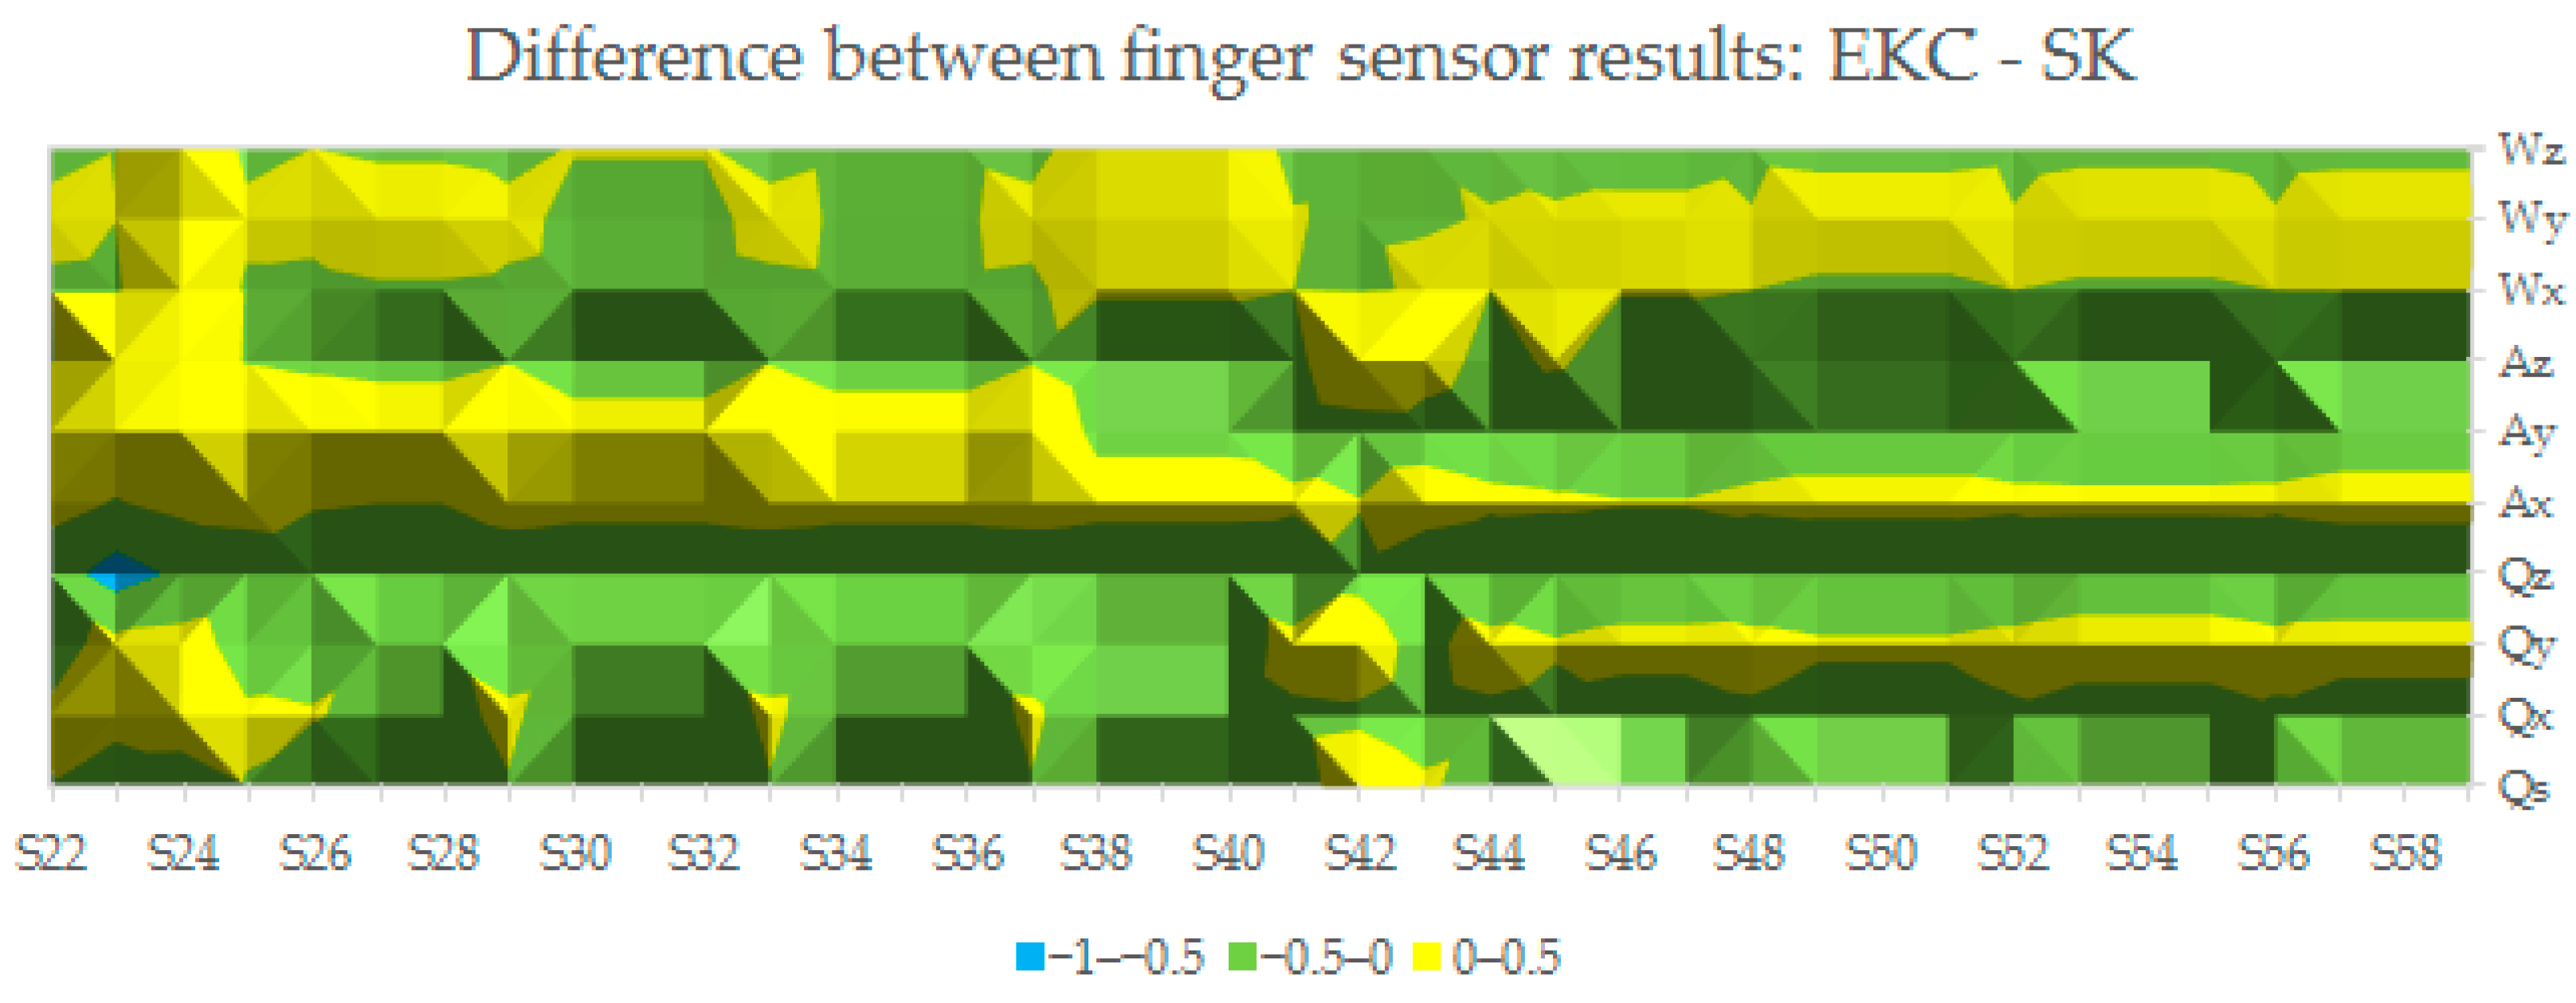
In Figure 5, Figure 6 and Figure 7, the data from the finger sensors presented as S22 to S40 denote sensors placed on the participants’ left hand, while S41 to S59 are sensors positioned on the participants’ right hand. In the case where the differences between having a regular and proper working pose when using an ergonomic keyboard are examined, there is a change in the position of the fingers, specifically, the pinkie on the left hand, regarding the Z-axis. Additionally, there is a visible change in the acceleration and position of the thumb of the left and right hands. The differences between the use of ordinary keyboard and ergonomic keyboard, regardless of the posture, are visible, although it can be seen that the amplitudes of change in the case of EKC and SK are higher than in the case of EK and SK. The differences in both cases are well pronounced along the sensors placed on the left hand of the participants.
4.2. Posture and Activity Classification
The averaged classification accuracy for each feature is presented in Table 1, Table 2 and Table 3, while the graphic representation of the results is provided in Figure 8, Figure 9 and Figure 10.
In Table 1 and Figure 8, the results obtained from the classification experiments using data obtained from sensors placed on participants’ arms are presented. The highest mean classification accuracy of 98.4% was obtained using SVM with linear kernel and the combination of Activity, Mobility and Complexity features. The lowest observed result is 71.5%, obtained using the decision tree classifier and the Complexity features alone. In general, using Mobility and Complexity as sole features leads to lower classification results than in cases where the Activity feature is also used. This effect is amplified in cases where decision tree and kNN classifiers are used—those setups tend to demonstrate lower mean classification accuracies and increased variation in the results of individual participants. The standard deviation for the experiments varies in the range of 1.1% to 6.7% depending on the used features and classifiers.
The observed relations between the extracted features and used classifiers are even more pronounced in the cases where data from the back and head are used. Averaged classification accuracies of 95.8–96.0% are observed when the Activity feature is used as the sole feature or combined with Complexity and Mobility, and the decision tree classifier is applied. Due to the standard deviation of ~3%, a single optimal approach cannot be highlighted. As pointed out, the limitations of the Mobility and Complexity features for this case are highlighted by the obtained mean classification results of under 83% and a standard deviation of 7–9% for those cases.
In Table 3 and Figure 11, we present the averaged classification accuracy for the experiments using data obtained from the sensors positioned on the fingers. Again, the highest accuracy is obtained in cases where the Activity feature is used with no single optimal combination of features. All of the previously discussed relations are observed here too. Although the mean classification accuracy is above 90%, the setup where data from the finger sensors are used demonstrates the lowest results for all the examined setups concerning maximum achieved accuracy.
4.3. Feature Ranking Results
In addition, feature ranking was performed. The feature subsets containing a combination of all three features were used. As in the classification task, three sensor data sets were examined—back, arms and fingers. After the ranking, the features ranked in the first quartile of the best performing features for different participants were compared. The results of the occurrence evaluation for the different sets are presented in Figure 11, Figure 12 and Figure 13, with the highest value for the occurrence frequency being 9. The difference in the span of the presented results is due to the differences in the length of the feature vectors constituting the three feature datasets. A detailed list of the features with the highest occurrence rate for each sensor group is provided in Appendix A.
The figures show that the most informative features are predominantly Mobility features. Combined with the classification results presented in Section 4.2, where Activity as a single feature demonstrated higher classification results than Mobility and Complexity, the ranking results suggest a high redundancy in the Mobility and Complexity features. Thus, their use in classification tasks aimed at computer work posture and activities should be combined with the feature selection procedure.
In addition, for each classification approach, features calculated from different representations of the raw signals demonstrate higher relevance. When data from the sensors positioned on the fingers are used, the coordinate module’s posture data parameter Qs demonstrate the highest relevance for Activity, Mobility and Complexity. The Qs parameter also demonstrates relevance when data from sensors positioned on the arms are used. In this case, however, the acceleration of the hands and arms and their general movement also play a significant role in the classification process. In the last case, where data from sensors positioned along the head and spine of participants are used, the most relevant features are those concerning the movement and displacement of the body.
5. Discussion
The experimental evaluations show that the classification of computer work postures and activities can be achieved using motion capture sensors positioned in different locations on the body. Although the changes in the position caused by taking a proper sitting posture are different for each separate individual, there are areas of the body where universal and identical effects are observed. One such location is the arms, with the position and movement of the arms being a clear indicator of not only the body posture but also the type of the performed activity and the used hardware. Examination and averaging of participant measurements show that the position of the right forearm is subject to a greater level of change than the spine when a proper sitting posture is assumed. These effects are also observed in the classification stage of the experiments, where the highest mean classification accuracy is achieved when features are extracted from data obtained from sensors positioned along the arms of the participants.
Another essential element of the classification process is the relation between the classification accuracy achieved by using different groups of features and their relevance to the observed states. As previously noted, significantly higher classification accuracies (in most cases between 5 and 10%) are achieved by using Activity as a sole feature than in the experiments where Mobility and Complexity features are used. This contrasts with the results observed for evaluating the relevance of the features where Activity features show lower relevance than Mobility and Complexity features. This demonstrates that the Activity features have a higher connection to the observed states than other examined features. As Activity is used as an indicator of the existence of high- or low-frequency components in the signals, this would suggest that one of the most defining differences for all of the parameters obtained from the raw motion sensor data is the intensity of the measured changes. This observation is indicative that the changes in work posture and the use of an ergonomic keyboard lead to a high difference in the intensity with which different activities are performed. In addition, the lower results of Mobility and Complexity show that the setup change does not significantly change the users’ workflow. The low results for the Mobility parameter indicate no significant change in the frequency variance—in the current case, intensity—with which the task is carried out. Similar conclusions can be made for the Complexity parameter, which indicates the degree to which the recorded signals are identical to a sine wave, indicating that the tasks are performed with a relatively similar periodicity. The high standard deviation between the results observed for Mobility and Complexity can also be attributed to these relations between the participants’ activities and the calculated features. During the recording sessions, the participants’ work patterns varied with the degree of prior experience with using ergonomic keyboards.
All of the observed results are well aligned with previous studies in the field, which indicate that the use of ergonomic keyboards and the work posture do not affect the quality of the work process and reduce the level of strain and exhaustion during work. Using parameters indicating the activity’s intensity during work provides the best approach for modeling and detecting work-related activities and correct work posture.
Future research will benefit from the knowledge accumulated for the applicability of Hjorth’s parameters toward creating an improper posture detector, which will be an essential component in a camera-less body position monitoring system. Novel developments in the smart (COST Action CA17107 -- CONTEXT: European Network to connect research and innovation efforts on advanced Smart Textiles, URL: https://www.context-cost.eu/, accessed on 30 May 2022) and recent commercial innovations will soon lead to smart clothes with integrated accelerometer sensors. These clothes can easily provide the sensor data for working posture assessment unobtrusively. Notifications and reminders could help the user correct body posture during prolonged hours of computer work to decrease the risk of musculoskeletal disorders without needing specialized sitting pillows.
6. Conclusions
In this article, we reported on developing a publicly available dataset containing images, videos, multisensory accelerometer data and motion capture models of ten participants that can potentially support future research on improper posture detection. We used the motion capture data only to demonstrate the applicability of Hjorth’s parameters as features for the automated classifying of computer-related work postures. In this regard, we reported that Hjorth’s time-domain features (Activity, Mobility and Complexity) can distinguish improper from proper sitting postures, with an average classification accuracy of 98.4%. Three experimental datasets containing data from smaller subsets of sensors positioned on the fingers, arms and back were tested, and for each group, the classification accuracy was above 92%.
Author Contributions
The research reported in this study was carried out by F.F., V.M. and T.G. Conceptualization, F.F., V.M. and T.G.; methodology, F.F. and V.M.; software, F.F.; validation, F.F.; formal analysis, F.F., V.M. and T.G.; investigation, F.F.; resources, V.M.; data curation, F.F.; writing—original draft preparation, F.F.; writing—review and editing, F.F., V.M. and T.G.; visualization, F.F.; supervision, V.M. and T.G.; project administration, V.M.; funding acquisition, V.M. and T.G. All authors have read and agreed to the published version of the manuscript.
Funding
This research was funded by Bulgarian National Science Fund (BNSF), under grant contract FNI No. KP-06-N37/1 from 6 December 2019, entitled “Ergonomic research on work-related health problems by innovative computer models with a focus on the prevention of Musculoskeletal Disorders”.
Institutional Review Board Statement
Not applicable.
Informed Consent Statement
Informed consent was obtained from all subjects involved in the study.
Data Availability Statement
All data has been presented in main text.
Conflicts of Interest
The authors declare no conflict of interest.
Appendix A
Table A1 shows the top 100 ranked features, calculated from sensors placed on the fingers, arms and back. The list includes the top quartile rankings of Hjorth’s parameters in descending order concerning the number of occurrences out of 10.

Table A1.
List of Hjorth’s features in the top quartile regarding the number of occurrences after relevance scoring of each sensor group (fingers, arms, back).
Table A1.
List of Hjorth’s features in the top quartile regarding the number of occurrences after relevance scoring of each sensor group (fingers, arms, back).
| Fingers | Arms | Back | |||
|---|---|---|---|---|---|
| Features | Number of Occurrences | Features | Number of Occurrences | Features | Number of Occurrences |
| MobAzS22 | 9 | MobWyS9 | 9 | MobWxS19 | 9 |
| MobAyS23 | 9 | MobXxS10 | 9 | MobWxS20 | 9 |
| MobAzS25 | 9 | MobVyS10 | 9 | MobWxS21 | 9 |
| MobAzS29 | 9 | MobWzS10 | 9 | MobWzS17 | 8 |
| MobAzS33 | 9 | MobAyS11 | 9 | MobAxS18 | 8 |
| MobAzS37 | 9 | MobAyS14 | 9 | MobAxS19 | 8 |
| MobAzS41 | 9 | MobWxS14 | 9 | MobAxS20 | 8 |
| MobAyS42 | 9 | MobVyS15 | 9 | MobAyS21 | 8 |
| MobAzS43 | 9 | MobVyS9 | 8 | MobAzS21 | 8 |
| MobWzS43 | 9 | MobVzS9 | 8 | MobWzS16 | 7 |
| MobAzS44 | 9 | MobWzS9 | 8 | MobXzS17 | 7 |
| MobWyS45 | 9 | MobQsS10 | 8 | MobWxS18 | 7 |
| MobAzS48 | 9 | MobWxS10 | 8 | MobWyS18 | 7 |
| MobAzS52 | 9 | MobWxS11 | 8 | MobWyS19 | 7 |
| MobAzS56 | 9 | MobQsS13 | 8 | MobWyS20 | 7 |
| MobAyS22 | 8 | MobWzS13 | 8 | MobAxS21 | 7 |
| MobAzS23 | 8 | MobWzS14 | 8 | MobXzS16 | 6 |
| MobWxS23 | 8 | MobXxS15 | 8 | MobVzS16 | 6 |
| MobAyS24 | 8 | MobWxS15 | 8 | MobWxS16 | 6 |
| MobWxS24 | 8 | MobXxS9 | 7 | MobWxS17 | 6 |
| MobAxS25 | 8 | MobQsS9 | 7 | MobXzS18 | 6 |
| MobAyS25 | 8 | MobAzS9 | 7 | MobAyS18 | 6 |
| MobAxS29 | 8 | MobWxS9 | 7 | MobAyS19 | 6 |
| MobAyS29 | 8 | MobVzS10 | 7 | MobVyS20 | 6 |
| MobAzS30 | 8 | MobAyS10 | 7 | MobAyS20 | 6 |
| MobAzS31 | 8 | MobXxS11 | 7 | MobVyS21 | 6 |
| MobAzS32 | 8 | MobXxS13 | 7 | MobWyS21 | 6 |
| MobAyS33 | 8 | MobVzS13 | 7 | MobWzS21 | 6 |
| MobAzS34 | 8 | MobWxS13 | 7 | MobAxS16 | 5 |
| MobAzS35 | 8 | MobWyS13 | 7 | MobAxS17 | 5 |
| MobAzS36 | 8 | MobVyS14 | 7 | MobVyS19 | 5 |
| MobAyS37 | 8 | MobAzS14 | 7 | MobAzS19 | 5 |
| MobAyS38 | 8 | MobWyS14 | 7 | MobWzS19 | 5 |
| MobAyS39 | 8 | MobAzS15 | 7 | MobVxS20 | 5 |
| MobAyS40 | 8 | CmpWzS9 | 7 | MobAzS20 | 5 |
| MobWxS42 | 8 | CmpXxS10 | 7 | MobWzS20 | 5 |
| MobWzS42 | 8 | MobWzS8 | 6 | MobVxS21 | 5 |
| MobAyS43 | 8 | MobAyS9 | 6 | CmpAyS21 | 5 |
| MobWxS43 | 8 | MobAzS10 | 6 | ActAxS18 | 4 |
| ActSzS45 | 7 | MobWyS10 | 6 | ActAyS18 | 4 |
| MobAxS24 | 7 | MobAzS11 | 6 | ActAxS19 | 4 |
| MobWzS24 | 7 | MobWyS11 | 6 | ActAyS19 | 4 |
| MobAyS26 | 7 | MobVyS13 | 6 | ActAxS20 | 4 |
| MobAzS26 | 7 | MobXxS14 | 6 | ActAyS20 | 4 |
| MobWxS26 | 7 | MobVzS14 | 6 | MobVxS16 | 4 |
| MobWzS27 | 7 | MobQsS14 | 6 | MobVyS16 | 4 |
| MobWzS28 | 7 | MobWzS15 | 6 | MobAyS16 | 4 |
| MobAyS30 | 7 | CmpWyS9 | 6 | MobAzS16 | 4 |
| MobAyS31 | 7 | CmpVzS10 | 6 | MobWyS16 | 4 |
| MobAyS32 | 7 | CmpQsS14 | 6 | MobVyS17 | 4 |
| MobAxS33 | 7 | CmpWzS14 | 6 | MobAyS17 | 4 |
| MobAyS34 | 7 | ActAzS9 | 5 | MobAzS17 | 4 |
| MobWxS34 | 7 | ActWxS9 | 5 | MobWyS17 | 4 |
| MobAyS35 | 7 | ActXyS11 | 5 | MobAzS18 | 4 |
| MobWxS35 | 7 | ActXzS11 | 5 | MobWzS18 | 4 |
| MobAxS36 | 7 | ActAzS13 | 5 | MobXzS19 | 4 |
| MobAyS36 | 7 | ActWxS13 | 5 | MobXzS21 | 4 |
| MobWxS36 | 7 | MobXxS8 | 5 | MobQsS21 | 4 |
| MobAxS37 | 7 | MobVzS8 | 5 | MobQyS21 | 4 |
| MobAyS41 | 7 | MobWxS8 | 5 | CmpXzS16 | 4 |
| MobAxS43 | 7 | MobVyS11 | 5 | CmpXzS18 | 4 |
| MobAyS44 | 7 | MobVzS11 | 5 | CmpWxS18 | 4 |
| MobAxS45 | 7 | MobQsS11 | 5 | CmpWxS20 | 4 |
| MobAyS46 | 7 | MobWzS11 | 5 | CmpAxS21 | 4 |
| MobAyS47 | 7 | MobVzS12 | 5 | CmpWxS21 | 4 |
| MobAyS48 | 7 | MobWxS12 | 5 | MobVzS17 | 3 |
| MobWxS49 | 7 | MobWyS12 | 5 | MobVyS18 | 3 |
| MobAyS52 | 7 | MobWzS12 | 5 | MobVxS19 | 3 |
| MobAzS53 | 7 | MobQsS15 | 5 | MobXxS20 | 3 |
| MobAzS54 | 7 | MobAyS15 | 5 | MobXxS21 | 3 |
| MobAzS55 | 7 | CmpQsS9 | 5 | MobXyS21 | 3 |
| MobAyS56 | 7 | CmpWzS10 | 5 | CmpVzS16 | 3 |
| ActAxS23 | 6 | CmpXxS11 | 5 | CmpAzS16 | 3 |
| ActAxS38 | 6 | CmpWzS13 | 5 | CmpWxS16 | 3 |
| ActAxS39 | 6 | ActWxS15 | 4 | CmpWyS16 | 3 |
| ActAxS40 | 6 | MobVyS8 | 4 | CmpAzS17 | 3 |
| MobAxS22 | 6 | MobXxS12 | 4 | CmpWxS17 | 3 |
| MobAzS24 | 6 | MobAzS13 | 4 | CmpAxS18 | 3 |
| MobWxS25 | 6 | MobVzS15 | 4 | CmpXyS19 | 3 |
| MobWyS26 | 6 | CmpVyS9 | 4 | CmpAxS19 | 3 |
| MobWzS30 | 6 | CmpVyS10 | 4 | CmpWxS19 | 3 |
| MobWzS31 | 6 | CmpWzS11 | 4 | CmpXyS20 | 3 |
| MobAxS32 | 6 | CmpWxS13 | 4 | CmpAxS20 | 3 |
| MobWzS32 | 6 | CmpWyS13 | 4 | CmpXxS21 | 3 |
| MobAxS34 | 6 | CmpAyS14 | 4 | CmpXyS21 | 3 |
| MobAxS35 | 6 | CmpWxS14 | 4 | CmpVxS21 | 3 |
| MobWxS37 | 6 | ActAzS8 | 3 | CmpVyS21 | 3 |
| MobAxS38 | 6 | ActAyS9 | 3 | CmpQxS21 | 3 |
| MobAzS38 | 6 | ActSxS11 | 3 | CmpQyS21 | 3 |
| MobWxS38 | 6 | ActWxS11 | 3 | CmpQzS21 | 3 |
| MobAzS39 | 6 | ActSxS15 | 3 | ActXxS16 | 2 |
| MobWxS39 | 6 | ActAyS15 | 3 | ActAxS16 | 2 |
| MobAzS40 | 6 | MobAyS8 | 3 | ActAxS17 | 2 |
| MobWxS40 | 6 | MobWyS8 | 3 | ActAyS21 | 2 |
| MobWzS41 | 6 | MobVxS11 | 3 | MobXyS20 | 2 |
| MobAxS42 | 6 | MobVyS12 | 3 | MobXzS20 | 2 |
| MobAzS42 | 6 | MobQsS12 | 3 | MobVzS21 | 2 |
| MobWyS42 | 6 | MobAyS13 | 3 | MobQxS21 | 2 |
| MobWyS44 | 6 | MobWyS15 | 3 | CmpVyS16 | 2 |
| MobWzS44 | 6 | CmpVzS9 | 3 | CmpAxS16 | 2 |
References
- EUROSTAT. Use of Computers and the Internet by Employees. Available online: http://appsso.eurostat.ec.europa.eu/nui/show.do?dataset=isoc_ci_cm_pn2&lang=en (accessed on 20 June 2022).
- Ellahi, A.; Khalil, M.S.; Akram, F. Computer users at risk: Health disorders associated with prolonged computer use. J. Bus. Manag. Econ. 2011, 2, 171–182. [Google Scholar]
- Borhany, T.; Shahid, E.; Siddique, W.A.; Ali, H. Musculoskeletal problems in frequent computer and internet users. J. Fam. Med. Prim. Care 2018, 7, 337. [Google Scholar] [CrossRef]
- Gustafsson, E.; Thomée, S.; Grimby-Ekman, A.; Hagberg, M. Texting on mobile phones and musculoskeletal disorders in young adults: A five-year cohort study. Appl. Ergon. 2017, 58, 208–214. [Google Scholar] [CrossRef]
- Shin, G.; Zhu, X. User discomfort, work posture and muscle activity while using a touchscreen in a desktop PC setting. Ergonomics 2011, 54, 733–744. [Google Scholar] [CrossRef]
- Sundelin, G.; Hagberg, M. Effects of exposure to excessive drafts on myoelectric activity in shoulder muscles. J. Electromyogr. Kinesiol. 1992, 2, 36–41. [Google Scholar] [CrossRef]
- Carter, J.B.; Banister, E.W. Musculoskeletal problems in VDT work: A review. Ergonomics 1994, 37, 1623–1648. [Google Scholar] [CrossRef]
- Grieco, A.; Molteni, G.; Vito, G.D.; Sias, N. Epidemiology of musculoskeletal disorders due to biomechanical overload. Ergonomics 1998, 41, 1253–1260. [Google Scholar] [CrossRef]
- Swanson, N.G.; Galinsky, T.L.; Cole, L.L.; Pan, C.S.; Sauter, S.L. The impact of keyboard design on comfort and productivity in a text-entry task. Appl. Ergon. 1997, 28, 9–16. [Google Scholar] [CrossRef]
- Shein, M.M.; Hamilton-Wright, A.; Black, N.; Samson, M.; Lecanelier, M. Assessing ergonomic and postural data for pain and fatigue markers using machine learning techniques. In Proceedings of the 2015 International Conference and Workshop on Computing and Communication (IEMCON), Vancouver, BC, Canada, 15–17 October 2015; IEEE: Manhattan, NY, USA, 2015; pp. 1–6. [Google Scholar] [CrossRef]
- Jaimes, A. Sit straight (and tell me what I did today) a human posture alarm and activity summarization system. In Proceedings of the 2nd ACM Workshop on Continuous Archival and Retrieval of Personal Experiences, Singapore, 11 November 2005; pp. 23–34. [Google Scholar]
- Mallare, J.C.T.; Pineda, D.F.G.; Trinidad, G.M.; Serafica, R.D.; Villanueva, J.B.K.; Cruz, A.R.D.; Vicerra, R.R.P.; Serrano, K.K.D.; Roxas, E.A. Sitting posture assessment using computer vision. In Proceedings of the 2017 IEEE 9th International Conference on Humanoid, Nanotechnology, Information Technology, Communication and Control, Environment and Management (HNICEM), Manila, Philippines, 1–3 December 2017; IEEE: Manhattan, NY, USA, 2018; pp. 1–5. [Google Scholar] [CrossRef]
- Mu, L.; Li, K.; Wu, C. A sitting posture surveillance system based on image processing technology. In Proceedings of the 2010 2nd International Conference on Computer Engineering and Technology, Chengdu, China, 16–18 April 2010; IEEE: Manhattan, NY, USA, 2010; Volume 1, p. V1-692. [Google Scholar] [CrossRef]
- Prueksanusak, B.; Rujivipatand, P.; Wongpatikaseree, K. An ergonomic chair with Internet of thing technology using SVM. In Proceedings of the 2019 4th Technology Innovation Management and Engineering Science International Conference (TIMES-iCON), Bangkok, Thailand, 11–13 December 2019; IEEE: Manhattan, NY, USA, 2020; pp. 1–5. [Google Scholar] [CrossRef]
- Chopra, S.; Kumar, M.; Sood, S. Wearable posture detection and alert system. In Proceedings of the 2016 International Conference System Modeling & Advancement in Research Trends (SMART), Moradabad, India, 25–27 November 2016; IEEE: Manhattan, NY, USA, 2017; pp. 130–134. [Google Scholar] [CrossRef]
- Liu, B.; Li, Y.; Zhang, S.; Ye, X. Healthy human sitting posture estimation in RGB-D scenes using object context. Multimed. Tools Appl. 2017, 76, 10721–10739. [Google Scholar] [CrossRef]
- Kulikajevas, A.; Maskeliunas, R.; Damaševičius, R. Detection of sitting posture using hierarchical image composition and deep learning. PeerJ Comput. Sci. 2021, 7, e442. [Google Scholar] [CrossRef]
- Lin, P.C.; Chen, Y.J.; Chen, W.S.; Lee, Y.J. Automatic real-time occupational posture evaluation and select corresponding ergonomic assessments. Sci. Rep. 2022, 12, 2139. [Google Scholar] [CrossRef] [PubMed]
- Patalas-Maliszewska, J.; Halikowski, D.; Damaševičius, R. An automated recognition of work activity in industrial manufacturing using convolutional neural networks. Electronics 2021, 10, 2946. [Google Scholar] [CrossRef]
- Zhao, J.; Obonyo, E. Applying incremental Deep Neural Networks-based posture recognition model for ergonomics risk assessment in construction. Adv. Eng. Inform. 2021, 50, 101374. [Google Scholar] [CrossRef]
- Li, M.; Jiang, Z.; Liu, Y.; Chen, S.; Wozniak, M.; Scherer, R.; Damasevicius, R.; Wei, W.; Li, Z.; Li, Z. Sitsen: Passive sitting posture sensing based on wireless devices. Int. J. Distrib. Sens. Netw. 2021, 17, 15501477211024846. [Google Scholar] [CrossRef]
- Zemp, R.; Tanadini, M.; Plüss, S.; Schnüriger, K.; Singh, N.B.; Taylor, W.R.; Lorenzetti, S. Application of machine learning approaches for classifying sitting posture based on force and acceleration sensors. BioMed Res. Int. 2016, 2016, 5978489. [Google Scholar] [CrossRef] [Green Version]
- Meyer, J.; Arnrich, B.; Schumm, J.; Troster, G. Design and modeling of a textile pressure sensor for sitting posture classification. IEEE Sens. J. 2010, 10, 1391–1398. [Google Scholar] [CrossRef]
- Ma, C.; Li, W.; Gravina, R.; Fortino, G. Posture detection based on smart cushion for wheelchair users. Sensors 2017, 17, 719. [Google Scholar] [CrossRef]
- Ma, S.; Cho, W.H.; Quan, C.H.; Lee, S. A sitting posture recognition system based on 3 axis accelerometer. In Proceedings of the 2016 IEEE Conference on Computational Intelligence in Bioinformatics and Computational Biology (CIBCB), Chiang Mai, Thailand, 5–7 October 2016; IEEE: Manhattan, NY, USA, 2017; pp. 1–3. [Google Scholar] [CrossRef]
- Ma, S.Y.; Shim, H.M.; Lee, S.M. Classification of sitting position by IMU built in neckband for preventing imbalance posture. J. Rehabil. Welf. Eng. Assist. Technol. 2015, 9, 285–291. [Google Scholar]
- Nakaseko, M.; Grandjean, E.; Hüunting, W.; Gierer, R. Studies on ergonomically designed alphanumeric keyboards. Hum. Factors 1985, 27, 175–187. [Google Scholar] [CrossRef]
- Honan, M.; Serina, E.; Tal, R.; Rempel, D. Wrist postures while typing on a standard and split keyboard. In Proceedings of the Human Factors and Ergonomics Society Annual Meeting; Sage: Los Angeles, CA, USA, 1995; Volume 39, pp. 366–368. [Google Scholar] [CrossRef]
- Rempel, D.; Barr, A.; Brafman, D.; Young, E. The effect of six keyboard designs on wrist and forearm postures. Appl. Ergon. 2007, 38, 293–298. [Google Scholar] [CrossRef]
- Baker, N.A.; Cham, R.; Hale, E.; Cook, J.; Redfern, M.S. Digit kinematics during typing with standard and ergonomic keyboard configurations. Int. J. Ind. Ergon. 2007, 37, 345–355. [Google Scholar] [CrossRef]
- Szeto, G.P.; Lee, R. An ergonomic evaluation comparing desktop, notebook, and subnotebook computers. Arch. Phys. Med. Rehabil. 2002, 83, 527–532. [Google Scholar] [CrossRef] [PubMed]
- Hjorth, B. EEG analysis based on time domain properties. Electroencephalogr. Clin. Neurophysiol. 1970, 29, 306–310. [Google Scholar] [CrossRef]
- Feradov, F.; Ganchev, T.; Markova, V. Automated detection of cognitive load from peripheral physiological signals based on Hjorth’s parameters. In Proceedings of the 2020 International Conference on Biomedical Innovations and Applications (BIA), Varna, Bulgaria, 24–27 September 2020; pp. 85–88. [Google Scholar] [CrossRef]
- Feradov, F.; Ganchev, T.; Markova, V.; Kalcheva, N. EMD-based features for cognitive load and stress assessment from PPG signals. In Proceedings of the International Conference on Biomedical Innovations and Applications—BIA-2021, Varna, Bulgaria, 2–4 June 2022. [Google Scholar]
- Kira, K.; Rendell, L.A. A practical approach to feature selection. In Proceedings of the Ninth International Machine Learning Conference (ML92), Aberdeen, UK, 1–3 July 1992; pp. 249–256. [Google Scholar] [CrossRef]
- Witten, I.H.; Frank, E. Data mining: Practical machine learning tools and techniques with Java implementations. ACM Sigmod Rec. 2002, 31, 76–77. [Google Scholar] [CrossRef]
- Altman, N.S. An introduction to kernel and nearest-neighbor nonparametric regression. Am. Stat. 1992, 46, 175–185. [Google Scholar] [CrossRef] [Green Version]
- Breiman, L.; Friedman, J.H.; Olshen, R.A.; Stone, C.J. Classification and Regression Trees, 3rd ed.; Routledge: New York, NY, USA, 2017. [Google Scholar] [CrossRef]
- Cortes, C.; Vapnik, V. Support-vector networks. Mach. Learn. 1995, 20, 273–297. [Google Scholar] [CrossRef]
Figure 1.
Structure of the experimental workflow and steps of the presented study.

Figure 2.
Differences between mean values for ergonomic keyboard with proper work posture (EKC) and ergonomic keyboard with regular work posture (EK) recordings for sensors positioned on the body.
Figure 2.
Differences between mean values for ergonomic keyboard with proper work posture (EKC) and ergonomic keyboard with regular work posture (EK) recordings for sensors positioned on the body.

Figure 3.
Differences between mean values for ergonomic keyboard with proper work posture (EKC) and ordinary keyboard with regular work posture (SK) recordings for sensors positioned on the body.
Figure 3.
Differences between mean values for ergonomic keyboard with proper work posture (EKC) and ordinary keyboard with regular work posture (SK) recordings for sensors positioned on the body.

Figure 4.
Differences between mean values for ergonomic keyboard with regular work posture (EK) and ordinary keyboard with regular work posture (SK) recordings for sensors positioned on the body.
Figure 4.
Differences between mean values for ergonomic keyboard with regular work posture (EK) and ordinary keyboard with regular work posture (SK) recordings for sensors positioned on the body.

Figure 5.
Differences between mean values for ergonomic keyboard with proper work posture (EKC) and ergonomic keyboard with regular work posture (EK) recordings for sensors positioned on the body.
Figure 5.
Differences between mean values for ergonomic keyboard with proper work posture (EKC) and ergonomic keyboard with regular work posture (EK) recordings for sensors positioned on the body.

Figure 6.
Differences between mean values for ergonomic keyboard with proper work posture (EKC) and ordinary keyboard with regular work posture (SK) recordings for sensors positioned on the body.
Figure 6.
Differences between mean values for ergonomic keyboard with proper work posture (EKC) and ordinary keyboard with regular work posture (SK) recordings for sensors positioned on the body.

Figure 7.
Differences between mean values for ergonomic keyboard with regular work posture (EK) and ordinary keyboard with regular work posture (SK) recordings for sensors positioned on the body.
Figure 7.
Differences between mean values for ergonomic keyboard with regular work posture (EK) and ordinary keyboard with regular work posture (SK) recordings for sensors positioned on the body.

Figure 8.
Average classification results (accuracy and standard deviation) were obtained for the datasets consisting of features calculated from data from sensors positioned on the arms.
Figure 8.
Average classification results (accuracy and standard deviation) were obtained for the datasets consisting of features calculated from data from sensors positioned on the arms.

Figure 9.
Average classification results (accuracy and standard deviation) were obtained for the datasets consisting of features calculated from data from sensors positioned on the back.
Figure 9.
Average classification results (accuracy and standard deviation) were obtained for the datasets consisting of features calculated from data from sensors positioned on the back.

Figure 10.
Average classification results (accuracy and standard deviation) were obtained for the datasets consisting of features calculated from data from sensors positioned on the fingers.
Figure 10.
Average classification results (accuracy and standard deviation) were obtained for the datasets consisting of features calculated from data from sensors positioned on the fingers.

Figure 11.
The occurrence rate of features ranked in the first quartile after the feature ranking process for data obtained from finger sensors.
Figure 11.
The occurrence rate of features ranked in the first quartile after the feature ranking process for data obtained from finger sensors.

Figure 12.
The occurrence rate of features ranked in the first quartile after the feature ranking process for data obtained from arms sensors.
Figure 12.
The occurrence rate of features ranked in the first quartile after the feature ranking process for data obtained from arms sensors.

Figure 13.
The occurrence rate of features ranked in the first quartile after the feature ranking process for data obtained from back sensors.
Figure 13.
The occurrence rate of features ranked in the first quartile after the feature ranking process for data obtained from back sensors.

Table 1.
Averaged classification accuracy of the examined features and feature combinations for data calculated from accelerometers placed on the arms.
Table 1.
Averaged classification accuracy of the examined features and feature combinations for data calculated from accelerometers placed on the arms.
| Subset | Dec. Tree | SVM (Lin) | SVM (rbf) | kNN | Sub. Mean |
|---|---|---|---|---|---|
| A | 94.1% | 95.5% | 89.7% | 91.7% | 92.7% |
| M | 74.7% | 88.2% | 90.2% | 84.1% | 84.3% |
| C | 71.5% | 86.8% | 88.1% | 81.1% | 81.9% |
| AM | 97.4% | 97.8% | 96.3% | 96.9% | 97.1% |
| AC | 94.3% | 95.5% | 93.2% | 86.9% | 92.5% |
| MC | 89.3% | 95.6% | 95.4% | 90.9% | 92.8% |
| AMC | 97.0% | 98.4% | 96.5% | 96.7% | 97.1% |
| Class. Mean | 88.3% | 94.0% | 92.8% | 89.8% | 91.2% |
Table 2.
Averaged classification accuracy of the examined features and feature combinations for data calculated from accelerometers placed on the head and back.
Table 2.
Averaged classification accuracy of the examined features and feature combinations for data calculated from accelerometers placed on the head and back.
| Subset | Dec. Tree | SVM (Lin) | SVM (rbf) | kNN | Sub. Mean |
|---|---|---|---|---|---|
| A | 95.8% | 92.8% | 88.5% | 91.9% | 92.2% |
| M | 72.0% | 77.3% | 80.0% | 74.9% | 76.0% |
| C | 69.3% | 78.0% | 79.4% | 72.7% | 74.8% |
| AM | 96.0% | 94.6% | 92.5% | 92.7% | 93.9% |
| AC | 95.9% | 93.7% | 88.6% | 91.6% | 92.4% |
| MC | 72.6% | 83.1% | 82.9% | 75. 3% | 79.5% |
| AMC | 95.8% | 94.6% | 89.9% | 86.3% | 91.6% |
| Class. Mean | 85.3% | 87.7% | 86.0% | 85.0% | 86.0% |
Table 3.
Averaged classification accuracy of the examined features and feature combinations for data calculated from accelerometers placed on the fingers.
Table 3.
Averaged classification accuracy of the examined features and feature combinations for data calculated from accelerometers placed on the fingers.
| Subset | Dec. Tree | SVM (Lin) | SVM (rbf) | kNN | Sub. Mean |
|---|---|---|---|---|---|
| A | 92.3% | 90.8% | 87.1% | 83.9% | 88.5% |
| M | 71.7% | 84.3% | 85.8% | 77.6% | 79.8% |
| C | 70.2% | 81.8% | 82.8% | 74.5% | 77.3% |
| AM | 92.8% | 92.7% | 91.6% | 83.4% | 90.1% |
| AC | 92.0% | 91.8% | 90.5% | 78.0% | 88.1% |
| MC | 71.4% | 86.0% | 86.8% | 78.0% | 80.5% |
| AMC | 92.2% | 92.2% | 91.5% | 80.6% | 89.1% |
| Class. Mean | 83.2% | 88.5% | 88.0% | 79.4% | 84.8% |
Publisher’s Note: MDPI stays neutral with regard to jurisdictional claims in published maps and institutional affiliations. |
© 2022 by the authors. Licensee MDPI, Basel, Switzerland. This article is an open access article distributed under the terms and conditions of the Creative Commons Attribution (CC BY) license (https://creativecommons.org/licenses/by/4.0/).
Share and Cite
MDPI and ACS Style
Feradov, F.; Markova, V.; Ganchev, T. Automated Detection of Improper Sitting Postures in Computer Users Based on Motion Capture Sensors. Computers 2022, 11, 116. https://0-doi-org.brum.beds.ac.uk/10.3390/computers11070116
AMA Style
Feradov F, Markova V, Ganchev T. Automated Detection of Improper Sitting Postures in Computer Users Based on Motion Capture Sensors. Computers. 2022; 11(7):116. https://0-doi-org.brum.beds.ac.uk/10.3390/computers11070116
Chicago/Turabian StyleFeradov, Firgan, Valentina Markova, and Todor Ganchev. 2022. "Automated Detection of Improper Sitting Postures in Computer Users Based on Motion Capture Sensors" Computers 11, no. 7: 116. https://0-doi-org.brum.beds.ac.uk/10.3390/computers11070116
Note that from the first issue of 2016, this journal uses article numbers instead of page numbers. See further details here.