Article

On Predicting Soccer Outcomes in the Greek League Using Machine Learning

by
Marios-Christos Malamatinos
,
Eleni Vrochidou
and
George A. Papakostas
*
MLV Research Group, Department of Computer Science, International Hellenic University, 65404 Kavala, Greece
*
Author to whom correspondence should be addressed.
Submission received: 22 July 2022 / Revised: 24 August 2022 / Accepted: 30 August 2022 / Published: 31 August 2022
(This article belongs to the Special Issue Human Understandable Artificial Intelligence)

Abstract

:
The global expansion of the sports betting industry has brought the prediction of outcomes of sport events into the foreground of scientific research. In this work, soccer outcome prediction methods are evaluated, focusing on the Greek Super League. Data analysis, including data cleaning, Sequential Forward Selection (SFS), feature engineering methods and data augmentation is conducted. The most important features are used to train five machine learning models: k-Nearest Neighbor (k-NN), LogitBoost (LB), Support Vector Machine (SVM), Random Forest (RF) and CatBoost (CB). For comparative reasons, the best model is also tested on the English Premier League and the Dutch Eredivisie, exploiting data statistics from six seasons from 2014 to 2020. Convolutional neural networks (CNN) and transfer learning are also tested by encoding tabular data to images, using 10-fold cross-validation, after applying grid and randomized hyperparameter tuning: DenseNet201, InceptionV3, MobileNetV2 and ResNet101V2. This is the first time the Greek Super League is investigated in depth, providing important features and comparative performance between several machine and deep learning models, as well as between other leagues. Experimental results in all cases demonstrate that the most accurate prediction model is the CB, reporting 67.73% accuracy, while the Greek Super League is the most predictable league.

1. Introduction

The sports betting industry was evaluated at 76.75 billion USD in 2021 and by the end of 2022 is expected to reach 83.65 billion; it is expected to grow more, with an annual growing rate of 10.2% until 2030 [1]. In terms of sport type, soccer, or football as it is known in Europe, received the majority of the betting market compared to other forms of sport. Bookmakers list their odds for every possible outcome of the game including scores, goals, goal differences, league standings, etc. [2]. Currently, soccer accounts for more than 23% of the betting market share.
Soccer is a simple ball game played by two teams who compete against each other to put the ball inside the opposing team’s net. The final result for a team can either be a win, a draw or a loss. Each match is separated in two halves of 45 min each, plus added time determined by the referee. There are also rules that govern the game and penalize foul behaviors. In more than the 85% of played matches, the final outcome is either a draw or a win of a team by one to two goals [3].
Despite the relatively simple rules and objectives, the prediction of the final outcome of a soccer game is challenging. A complex mix of unpredictable factors may rule the game: red cards, injuries, penalties, weather conditions, players’ physical and phycological condition, ball bouncing, poor refereeing, behavior of spectators, media pressure, etc. Hill (1974) [4] and Reep and Benjamin (1968) [5] concluded that a soccer game outcome depends partly on luck and skill. Yet, the final outcome of a soccer game is not wholly random. Many research approaches have been proposed in the literature toward soccer outcome prediction based on statistical data of past matches. Sports analytics is a distinct research field focusing on data-driven performance analysis of teams and athletes [6]. Soccer can benefit from the disposal of high-frequency data collected during a match to interpret them and derive spatiotemporal performance features [7]. Robust models can then use these features to capture the patterns of unpredictable factors towards accurate predictions of match dynamics, such as goals, fouls, passes, players’ movements, etc. [8].
Soccer outcome prediction has been the subject of scientific research from the 1960s until now [4,5,9,10,11,12]. Various statistical techniques have been employed toward soccer outcome prediction: Poisson models [13], Bayesian models [2], rating systems [14] and, more recently, machine learning [15] and deep learning methods [16].
In this work, five different machine learning models were tested for the prediction of soccer match outcomes in the Greek Super League. Three prediction classes were assigned: Home Team Win (Home), Draw and Away Team Win (Away). The dataset consisted of six seasons (2014–2020). The two latest seasons were not considered, since the COVID-19 pandemic has greatly influenced soccer due to health issues and restrictions in most countries worldwide. A feature-based approach was employed to tackle the problem. Data analysis included data cleaning, Sequential Forward Selection (SFS) and feature engineering methods to introduce additional features and data augmentation. Results on the Greek Super League were compared with two other leagues, the English Premier League and the Dutch Eredivisie, for the same seasons (2014–2020). Extracted features were evaluated to conclude which were the most significant for the problem under study. Finally, tabular data were encoded to images, and five deep learning pretrained models were tested to derive comparative predictions on the same datasets.
The contribution of this work can be summarized as follows:
  • This is the first time a case study is focusing on data referring to the Greek Super League, which is considered as one of the most predictable leagues in terms of final match results and league standings. There have been studies that included the Greek league in a wider dataset of several leagues, but none of them focused solely on it.
  • The most important features that affect the final results of the Greek Super League and the ones that do not contribute to the final outcome were identified. Findings were applied to two other leagues, the English Premier League and the Dutch Eredivisie, to investigate their impact. This work includes extensive experiments using data from different leagues with different dynamics in terms of predictability. The results are compared to verify initial assumptions regarding the predictability of each league, export their main differences and evaluate their contribution to the final outcome.
  • Deep neural networks with transfer learning were also applied to test their prediction ability and compare it with the proposed machine learning models.
The rest of the paper is organized as follows: Section 2 reviews related work on soccer outcome prediction. In Section 3, materials and methods that were applied to predict the soccer match outcome are presented. Section 4 analyzes the dataset. Section 5 reports the experimental results. Section 6 summarizes the results and indicates potential future work towards a better predicting model. Finally, Section 7 concludes the paper.

2. Related Work

Statistical models have been used in the literature for soccer outcome prediction. One of the first research studies [5], by Reep and Benjamin (1968), extensively investigated parameters such as possession game, shooting attempts both on and off target and probabilities of scoring a goal. The authors came to the conclusion that chance can dominate a football match. Leaning in the same direction, Hill (1974) [4] suggested that soccer match outcomes are partly governed by luck and partly by skill. He also compared preseason forecasts that experts made at the time and compared them with the actual results to investigate their prediction effectiveness.
Maher (1982) [9] used the Poisson model combined with attack and defense strength parameters to describe scores in a soccer match. Dixon and Coles (1997) [10] implemented a parametric model and fitted it into three seasons of English league and World Cup. The technique was based on a Poisson regression model. Karlis and Ntoufras (2003) [13] proposed a bivariate Poisson regressor to model soccer data. Zebari et al. (2021) [17] also used the Poisson model to predict the soccer outcome, focusing on the Spanish Primera Division in 2016–2017.
Rue and Salvesen (2000) [2] suggested a Bayesian dynamic generalized linear model for the skill estimation of all teams during the season. They used data from the English Premier League and Division 1 League for the seasons 1993–1997. Goddard and Asimakopoulos (2004) [18] designed a Probit regression model using 10 years of data from the English League to predict end of season results. Results revealed that the involvement of a team in a cup competition and the geographical distance between the teams could affect the model’s performance, and that betting odds were inefficient during the final weeks of the season. Joseph et al. (2006) [19] focused on single team outcome prediction with the selection of Tottenham Hotspur from the English League. They used Bayesian Nets and compared their performance with other machine learning models. Another Bayesian approach was designed by Baio and Blagiardo (2010) [20]. They trained a Bayesian hierarchical model on Italian Series A for one season (1991–1992) and tested their model on a different season of the same league (2007–2008).
An additional approach for soccer outcome prediction is based on rating systems. Hvattum and Arntzen (2010) [14] examined the value of using ratings based on past team performance. They used Elo ratings as covariates in ordered logit regression models on matches of the English Premier League, and they suggested that these ratings were actually useful to encode information of past results. They also came to the conclusion that the best results were achieved by including as features the betting odds from the bookmakers. Constantinou (2019) [21] combined dynamic ratings with hybrid Bayesian networks to predict soccer outcomes from 52 leagues all over the world; the Greek Super League was predicted with a rank probability score (RPS) of 0.1868.
Recently, machine learning and deep learning methods have been introduced in soccer outcome prediction. Tsakonas et al. (2002) [22] used fuzzy rules, artificial neural networks and genetic algorithms to predict the results of soccer matches in the Ukrainian Championship. The best performance was achieved with the genetic programming approach. Rotshtein et al. (2005) [23] implemented a model for the prediction of soccer match results from previous outcomes of both teams in the Finnish League based on fuzzy and neural optimization techniques. Huang and Chang (2010) [15] adopted a neural network method to predict matches of the 2006 World Cup final stages with a back propagation multi-layer perceptron neural network. Another neural network approach was proposed by Arabzad et al. (2014) [24] on the Iranian Pro League. The authors used seven league seasons for training the model to make predictions for every result of each week. Tax and Youstra (2015) [25] tried to predict match results in the Dutch Football Competition using machine learning models and publicly available data. The highest performing model was a combination of LogitBoost and ReliefF on both public data and betting odds. Hubacek et al. (2018) [26] tried to predict the soccer results from relational data with the use of gradient boosted decision trees. Results showed that heterogeneity between the leagues does exist in terms of structure, play-styles and cards, and that regression performs poorly in this problem. Berrar et al. (2018) [3] applied two feature engineering methods, the recency feature extraction and the rating feature learning, combined with two machine learning models, a k-NN and an extreme gradient boosted tree (XGBoost), to predict a match outcome. Jain et al. (2021) [16] proposed a prediction system powered by recurrent neural networks (RNNs) and long short-term memories (LSTMs). Table 1 includes indicative information such as results, used features and models of different state-of-the-art methods from the referenced literature.

3. Materials and Methods

In this section, the proposed methodology is presented, and materials and methods are analyzed.

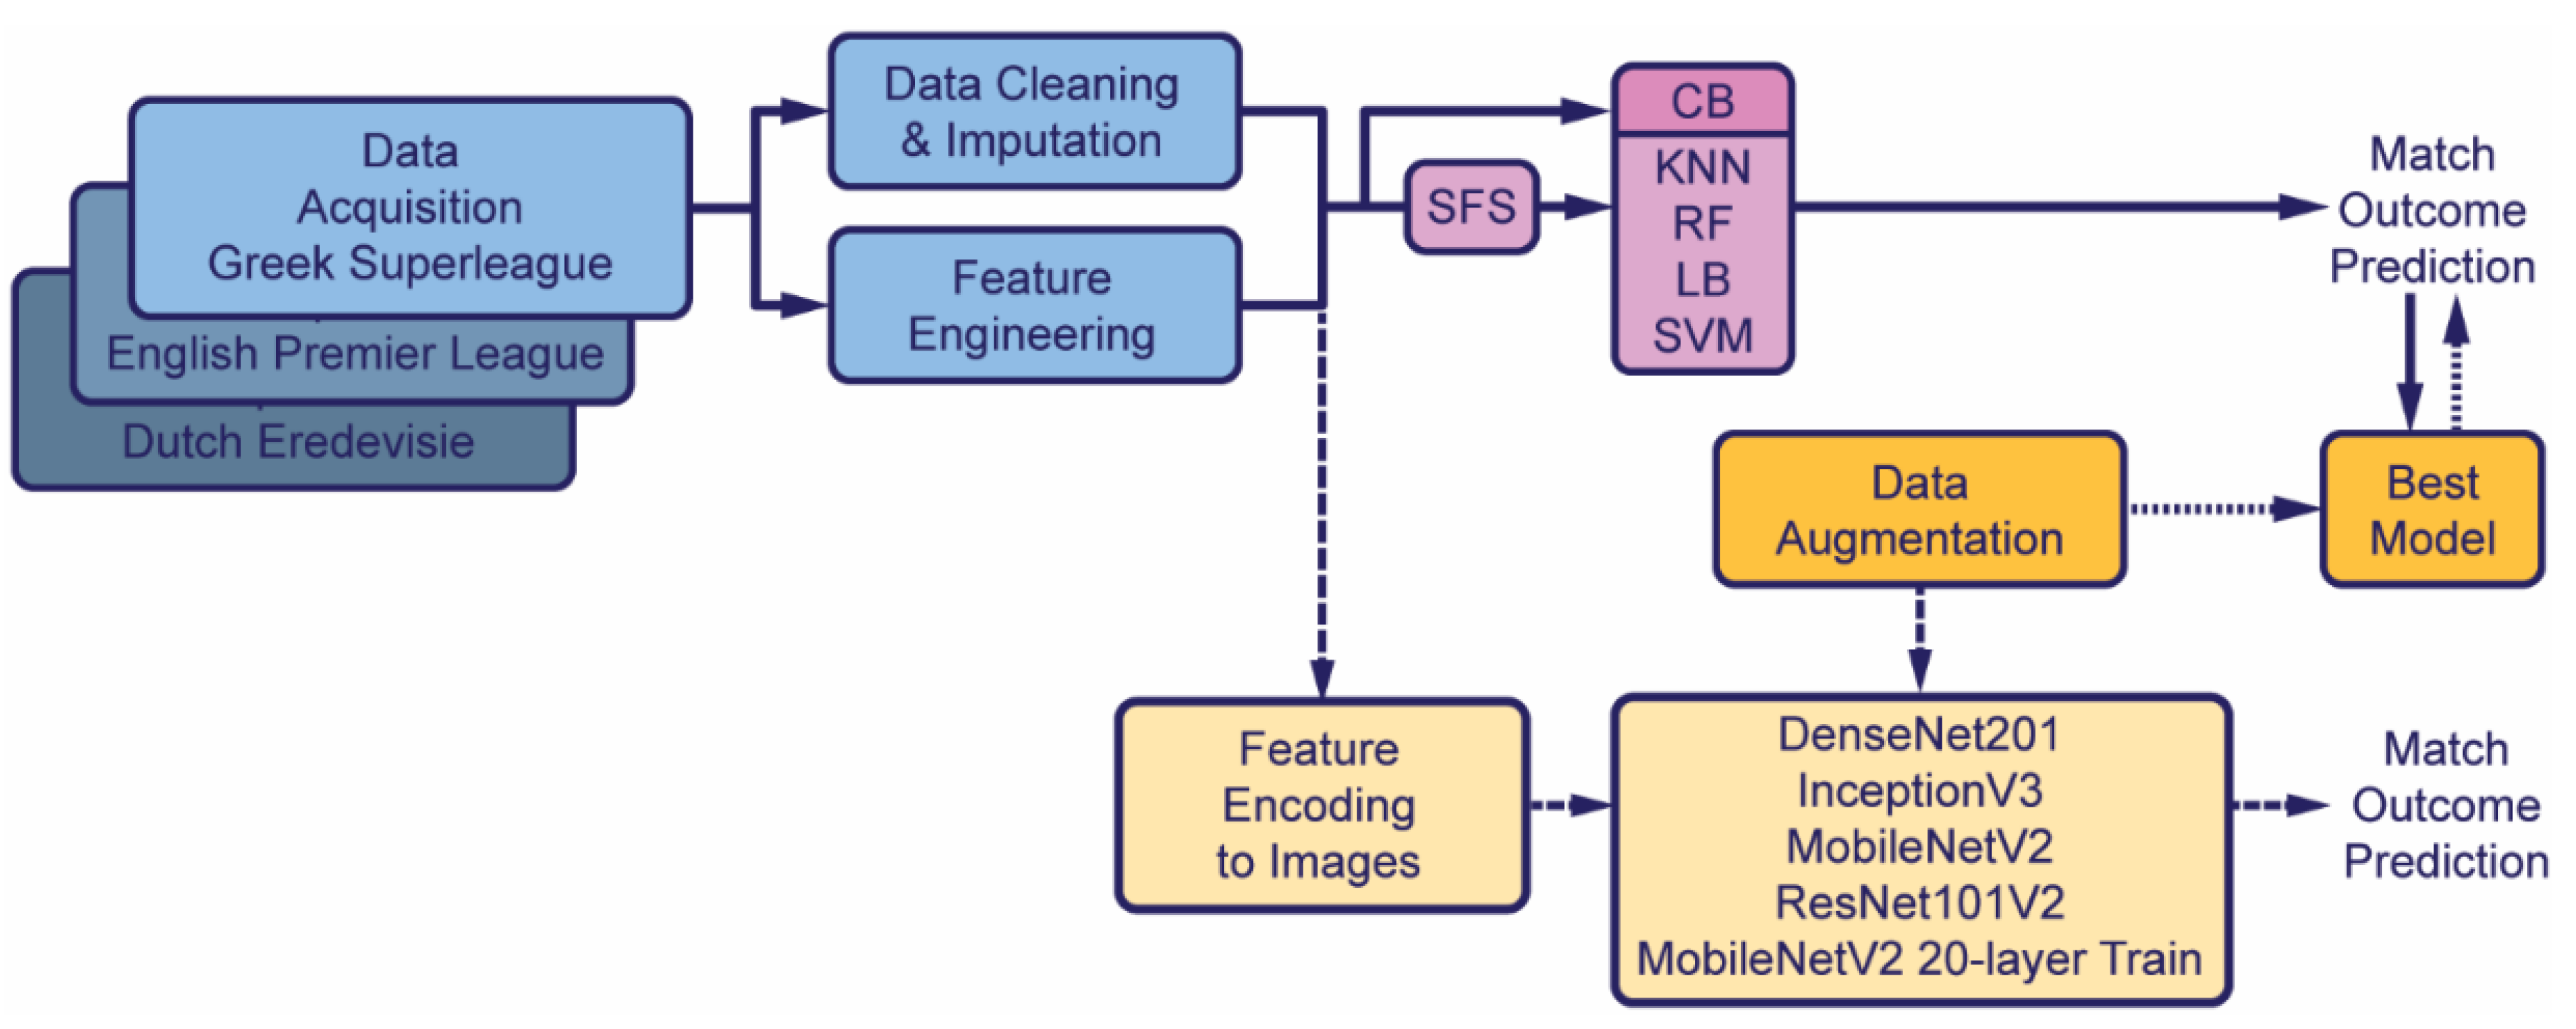
3.1. The Proposed Method

The proposed method is graphically illustrated in Figure 1. First, the originally acquired Greek Super League data were subjected to data cleaning and imputation. Additionally, feature engineering took place. Sequential Feature Selection was applied, and the set of final extracted features was used for model training. Five different machine learning models were initially tested with these features. Data analysis and initial results indicated an imbalanced dataset; therefore, data augmentation was also employed. Results were evaluated, and the model with the optimal performance was then tested on two different datasets, the English Premier League and the Dutch Eredivisie. Finally, the aforementioned tabular data were encoded and transformed into images to be fed in pretrained CNNs, and thus five deep learning architectures were also evaluated.

3.2. Data Acquisition

In recent years, soccer data statistics have covered a wide variety of different aspects for every individual match played. Due to technological advancements, these data are also widely and publicly available for commercial (betting companies) or individual use.
In this work, the dataset covered six seasons from 2014 until 2020. For the Greek Super League (First Division of Greek Soccer), original data included 1504 matches in total, 719 Home Team Wins, 399 Draws and 386 Away Team Wins. For the English Premier League, original data included 2280 matches, corresponding to 1042 Home Team Wins, 546 Draws and 692 Away Team Wins. Finally, for the Dutch Eredivisie, data included 1762 matches in total, 826 Home Team Wins, 402 Draws and 534 Away Team Wins.
The data were obtained from football-data.co.uk [27], which distributes data for leagues from all over the world from 1993–94 to date. Data of past match performances, league standings at the time of the match and bookmaker closing odds were considered. The bookmaker odds were incorporated into the problem due to their expertise in predicting outcomes and various aspects of the game. Moreover, they could be obtained prior to the match. In the data obtained from [27], teams’ budget data were also added for every season from 2014 until 2020. Teams’ budget related data, Home Team budget and Away Team budget were acquired from the website transfermarkt.de [28]. More general information about the League in focus, the Greek League, regarding structure and rules, can be found on the Greek Super League Home page [29].

3.3. Data Cleaning and Imputation

It should be noted that the more recent the season, the more data features were available. However, they could not be used, since only the same data features could be considered from all six seasons to train the machine learning models. For this reason, data cleaning was applied to all data to discard those features that were not consistent across all seasons. In the case of the Greek League, only the latest season (2019–2020) included more data features (e.g., specific bookmaker odds such as Bet365), while all previous seasons from 2014 had the same structure.
Moreover, in the remaining data, some values were missing completely at random (MCAR). Missing values were imputed for the data. Several imputation methods exist by using mean/median values, most frequent or zero/constant values, k nearest neighbors (k-NN), multivariance imputation by chained equation (MICE), deep learning (Datawig), stochastic regression, Hot-deck, etc. [30].
Imputation using the most frequent value is an efficient method for categorical features such as strings or numerical representation [31]. Therefore, in this work for the categorical features, the imputation was done by assigning the most frequent value in the missing field. As for the continuous missing values, they were replaced with the median value of the feature. Imputation using median values was selected due to the MCAR values, as an easy and fast method, considering that a only a small number of values was missing [31].

3.4. Feature Engineering

In order to train machine learning models on new tasks, it might be necessary to generate and use alternative features. Therefore, new features were formed from the original data. More specifically, new features were engineered from the already existing ones, such as: Home Team form (the Home Team’s form according to the last five matches performance of the team), Away Team form, Home Team league points (the points the Home Team has gained in the league for the corresponding season before the match is played), Away Team league points, Home Team previous match goals (the goals scored by the Home Team in the previous match played), Away Team previous match goals, Home Team previous half time match goals (the goals scored by the Home Team in the previous match until half time) and Away Team previous half time match goals.

3.5. Feature Selection

For feature selection, sequential feature selection (SFS) was applied to all initial models, except for CatBoost, which provides its own different types of feature importance calculation. SFS is a search algorithm that adds on each iteration, a feature in a new feature subspace, which maximizes the criterion function. In that way the generalization error is decreased by reducing noise and discarding irrelevant features. For CatBoost, feature importance was extracted, and less important features were discarded. The selected features for all models are summarized in Table 2.

3.6. Models

In the first step of the proposed methodology, five machine learning models were selected to study their performance on soccer outcome prediction. In the second step of our research methodology, additional deep learning models were also evaluated.
The five machine learning models that were used for the outcome prediction of the Greek Super League were:
  • k-Nearest Neighbor (k-NN): A non-parametric model that classifies data points in two or more distinguished classes by using majority voting or a distance/frequency-based weighting scheme for the k nearest points.
  • LogitBoost (L-Boost): A boosting algorithm that can be derived by applying to the Adaboost generalized additive model the cost function of logistic regression.
  • Support Vector Machine (SVM): It constructs a hyperplane, in an n-dimensional space, with the purpose of distinctively classifying data points. The objective is to find the hyperplane which has the maximum distance between the data points of the two classes.
  • Random Forest (RF): Multiple decision trees are trained to make a prediction. Each tree’s prediction is taken into account for the final prediction, which can be derived from the mode of the output class. Random decision forests correct the tendency of decision trees to overfit the training set.
  • CatBoost (CB): An ordered gradient boosting on decision trees algorithm [32]. It also has some algorithm advancements in regard to categorical classification and is computationally less intensive than other gradient boosting on decision trees algorithms. CatBoost has a very good vector representation of categorical data. It takes concepts of ordered boosting and applies the same to response coding. In response coding, we represent categorical features using the mean to the target values of the data points.
Moreover, to expand the above experiments, additional deep learning models were used to test their performance on the problem under study. More specifically, five convolutional neural network (CNN) architectures were selected: DenseNet201, InceptionV3, MobileNetV2, MobileNetV2 with 20-layers Training and ResNet101V2. Τhe best performing classifier was selected by using 10-fold cross-validation accuracy, after applying grid and randomized hyperparameter tuning.
The motivation was to combine several different models and compare their performances. k-NN was selected as a classic baseline model, a simple reference model for classification tasks; SVM and RF were selected due to their being very popular machine learning models reporting state-of-the-art classification accuracies, while LB and CB were selection because they are new generation ensemble boosting models. Regarding the deep learning selected architectures, the aim was to select a variety of well-known classical deep learning categories most referenced in the recent literature.
For all models, hyperparameter selection through fine tuning took place in order to achieve a better performance of the models but also so that a fair comparison could be established between them. All models’ setups and best tuning parameters are provided in the Experimental Results section.

3.7. Data Augmentation

To deal with the imbalanced data in the Greek League dataset (approximately 1/2 Home Team Wins, 1/4 Draws, 1/4 Away Team Wins) and to create more match data, a data augmentation technique was applied, the synthetic minority oversampling technique (SMOTE). SMOTE synthesizes data of the minority classes until the count of each class is equal, thus creating a balanced dataset [33]. After the data augmentation, the Greek Super League dataset included 2157 matches, 719 matches for each of the three classes (Home Win, Draw, Away Win). For the remaining two leagues, data augmentation resulted in 3126 matches for the English Premier League (1042 for each class) and 2478 matches for the Dutch Eredivisie (826 for each class).

3.8. Model Evaluation

Accuracy, precision, recall, F1-score and area under curve (AUC) metrics from the receiver operating characteristic (ROC) curve were used as performance metrics.
Accuracy aims to describe the performance of a model across all classes. In this work, three classes were considered (Home Win, Draw, Away Win). It is calculated as the ratio between the number of correct predictions to the total number of predictions:
Accuracy = True positive + True negative True positive + True negative + False positive + False negative
It should be noted that when data is imbalanced, then the accuracy metric may be deceptive, especially for multiclass problems; if most of the samples belong to one class, the accuracy will be higher for that specific class. However, the calculated accuracy is considered as an overall performance metric for any sample, regarding the class, which is not valid.
Precision is the ratio between the number of positive samples correctly classified to the total number of samples that were classified as positive:
Precision = True positive True positive + False positive
When precision is high, it indicates that a model is reliable when it claims a sample as positive.
Recall is the ratio of the number of positive samples correctly classified to the total number of positive samples. Therefore, it measures the ability of the model to detect positive samples.
Recall = True positive True positive + False negative
F1-score combines precision and recall, calculated as their weighted average:
F 1 score = 2 Recall Precision Recall + Precision
F1-score is a more useful evaluation metric in problems of uneven class distribution. The overall performance of a classifier to separate positive and negative samples is calculated from the ROC curve, created by plotting recall against the false positive rate (Equation (5)) at various threshold settings.
False   positive   rate = False positive False positive + True negative
A model performance is determined by the area under the ROC curve (AUC); being close to 1, it means that the model could better separate classes.
The decision on which metric to use depends on the type of problem being solved. In this work, all metrics are provided for comparative reasons towards an overall evaluation view; however, the final evaluation is based on accuracy, since it is the most common evaluation metric for classification models due to its simplicity and interpretation, especially for a problem with finite target classes as in our case.
As mentioned above, when data are imbalanced, then accuracy for multi-class problems may be misleading. Moreover, imbalanced data may lead to overfitting issues. Overfitting and imbalanced data are the most common challenges to overcome when developing machine learning models.
Overfitting occurs when a model fits the training data too well, resulting in difficulties in accurately predicting unseen testing data. Overfitting occurs mainly due to:
  • Inaccurate/imbalanced/noisy data. The model learns on the data, and when new unseen data are introduced, the accuracy of the model decreases, and variance increases.
  • Small training data. In general, the more the data, the better the learning. Small datasets result in low learning ability of the model.
  • Complex models. When the predictive function of a model is complex, the model tends to overfit the data.
In order to avoid overfitting, the following measures were taken in this work:
  • Data cleaning to remove outliers.
  • Imputation to handle missing values.
  • Data augmentation to increase training samples and deal with the imbalanced data.
  • Hyperparameter tuning so as to limit model complexity such as the depth, etc. In general, many regularization methods exist in order to prevent machine learning model overfitting [34].
It should be noted that in this work, the above-mentioned measures were effective in dealing with imbalanced data and preventing overfitting, since there was no reported case of such behavior of the models in any case.

4. Data Analysis

In what follows, Greek Super League data analysis took place. In Figure 2 are shown the three teams with the most appearances in the Greek Super League during the examined periods, namely, Olympiakos, PAOK and Panathinaikos. These teams were consistently in the first tier league of the Greek football. In contrast, Ergotelis, Niki Volos and NPC Volos were the teams with the least appearances in the first tier of Greek football, and more precisely, they participated for only one season.
These teams are representative examples of both higher and lower dynamic teams. In terms of results, it is obvious from Figure 3 that higher dynamic teams tended to win almost all their matches when playing as a Home Team. On the contrary, for lower dynamic teams, even though they were playing on their Home ground, the percentage of winning was low while the percentage of losing was higher. Furthermore, it can be observed that draws were more possible for the high dynamic teams than for the lower dynamic teams.
When the same teams were playing Away, as can be seen from Figure 4, for the higher dynamic teams, the percentage of winning (the green count) was significantly lower than the percentage as Home Teams. At the same time, draws were also having an increased percentage, contrary to what was shown previously in Figure 3. For the lower dynamic teams playing Away, we can see that for Niki Volos and Volos NFC all their matches were losses. Almost the same thing happened with Ergotelis; instead of losing all the Away matches, they managed to win some when playing Away.
Regarding the final time results for whole six seasons, it is illustrated in Figure 5 that the Home Win results were almost the same amount as the sum of the Draw and Away results. The Draw and Away win counts did not have significant differences. Therefore, it can be concluded that the used data referring to the Greek Super League are imbalanced, leaning significantly towards the Home results. This is the reason why data augmentation is applied.
Regarding the team budget feature, as can be clearly seen in Figure 6, most of the teams had a budget between 5 and 20 million euros, while the maximum budget of a team in the six-season period was 110 million.
Figure 7 and Figure 8 demonstrate the correlation between budget and match result. As can be observed, the teams with higher budgets tended to win more matches and lose fewer times compared to the teams within the budget of 5–20 million euros. This tendency seemed to be consistent with either Home or Away Teams.
Betting odds accumulated by the bookmakers can be a very descriptive feature towards match prediction problem. Odds are generated by experts in the specific sport and tend to be very accurate regarding favorable results [25].
Figure 9, Figure 10 and Figure 11 demonstrate the distributions for each final time result. The most Home odd values (Figure 9) tended to be around 2. As for the Draw odds (Figure 10), most of them were around 3.5. In contrast to the Home odds, most Away odd values (Figure 11) were lying around 4. These figures revealed that the most probable outcome is the Home result regardless of the condition of any team, with the Draw result coming second in terms of probabilities.
Combining all the aforementioned findings, it could be concluded that teams with higher budgets and with low Home odds are almost certain winners, while teams with low budgets and low Away odds are almost certain losers. Moreover, the odds are efficient features, since they seem to connect to the final time result.

5. Experimental Results

Initially, the performance of the five machine learning models was tested in order to benchmark them and choose the best performing one. The proposed pipeline was applied in the Greek Super League dataset. Initial results are summarized in Table 3.
Then, the best model was tested with two other leagues, the English Premier League and the Dutch Eredivisie. Comparisons were made regarding results and the feature importance of all methods. Except for the accuracy metric, in order to evaluate the problem, precision, recall, F1-score and area under the ROC Curve (AUC) were reported.

5.1. Initial Experiments

The first model tested was the k-NN classifier. After hyperparameter tuning and SFS application, it was found that the best predictive accuracy was achieved by setting the k neighbors equal to three (k = 3) and by choosing the best three features, which were the Home Team Form, Previous Half Match Goals for the Home Team and the Maximum Away Odds. Based on the above, the best predictive reported accuracy with 10-fold cross-validation was 50.13%.
The same process was followed for all remaining models except for CB. For the RF model, the best parameters were: n estimators equal to 400, minimum samples split equal to two, min samples leaf equal to four, maximum depth equal to 40 and bootstrap set to True. These hyperparameters were chosen with Randomized Search instead of Grid Search due to the high computational burden. The features that were selected from SFS were the Home Team form, the previous half match goals both for Home and Away Team, the max and average Home Team odds, the average Draw odds, the Asian handicap line and the average Home odds for the corresponding Asian handicap line. RF predictive accuracy was much better than k-NN, achieving 56.38% accuracy with 10-fold cross-validation.
For LB, after hyperparameter tuning with Grid Search, it was found that best configuration parameters were: number of estimators equal to 1400, learning rate equal to 0.1, bootstrap set to True and weight trim quantile equal to 0.25. The best result was obtained by using the SFS algorithm and 10-fold cross-validation with predictive accuracy of 55.65%, compared to 53.52% prior to the SFS algorithm. Six features were used for the best performance: the Home Team form, the Away Team form, league points the Home Team has gathered, the match goals scored by the Away Team in their previous match, the Asian handicap line and the Asian handicap odds for the Home Team.
For SVM, the hyperparameter tuning was applied through Randomized Search. The best parameters were: C equal to 1, kernel set to ‘rbf’, and gamma set to ‘scale’. These parameters resulted in 54.07% accuracy with 10-fold cross validation. Recall, precision and F1-score were 0.4258, 0.4414 and 0.3876, respectively, which were the lower compared to other model results.
The CB model, after experimentations with hyperparameter tuning and with default parameters, resulted in optimal performance by using default ones. It should be mentioned that SFS could not be applied in CB due to implementation issues with the software libraries at hand. Thus, the CB model was trained on the whole feature set. However, feature selection was also investigated in regard to feature importance, but with the augmented data incorporated in a forthcoming step.
Default parameters were auto configured by the model, reporting 56.59% accuracy with 10-fold cross-validation, while with hyperparameter tuning it achieved 56.38%, which was in the same range of accuracy as accomplished with the RF. Unfortunately, with every method applied, the model found it difficult to find accurately the Draw results, as can be seen in Table 3. Draw recall reports the most unpredictable and random results. Since CatBoost is optimized with categorical features, the categorical features of the dataset can be set as input, towards optimized results. The categorical features are the Home Team, Away Team, Home Team form and Away Team form features for CB, as seen in Table 2. Additionally, CB provides feature importance, which is dependent and calculated from the model’s loss function named ‘Multiclass’. The best parameters for the CB model were: l2 leaf reg equal to three, learning rate equal to 0.0705410, depth equal to six and max leaves equal to 64.
Initial experimental results, summarized in Table 3, revealed that the best performance was achieved without the Sequential Feature Selection step, with the CatBoost model. Results for the Greek Super League data with CB are included in Table 4, providing detailed metrics per class.
In what follows, CatBoost, being the best model, was used for further experimentation.

5.2. Further Experiments

Further experiments included data augmentation and testing of the best model of the initial experiments (CB).
As already seen, the Greek Super League dataset was imbalanced, and thus the model was biased towards the classes that appeared more; indicatively, Home Wins were 50% of the whole dataset. Therefore, SMOTE was employed to resolve the problem. After the application of SMOTE, data for the Draw and Away results were augmented from the past records, and the total number of data was raised from 1504 to 2157. The latter resulted in target classes equally distributed, having 719 records each. As it can be seen from the results summarized in Table 5, by applying the augmented data to the CatBoost model for training, the predictive accuracy with default hyperparameters reached 66.76%, while when combined with hyperparameter tuning it resulted in a minor improvement, reporting 67.31% accuracy. The best model parameters were: l2 leaf reg = 3, learning rate = 0.1, depth = 8. It should be noted that recall for the Draw result class greatly improved, reaching approximately 0.63 with default parameters and 0.67 with hyperparameter tuning (Table 5). Applying scaling to the data resulted in an improvement of 0.5% with the usage of hyperparameter tuning, while with the default ones, an accuracy improvement of approximately 0.02% was achieved.
In conclusion, the highest accuracy of 67.73% was reported by using SMOTE with scaling on the data and hyperparameter tuning, with best parameters: l2 leaf reg = 9, learning rate = 0.3, depth = 6. The most important features that contributed to this accuracy were the Home Team, Away Team, Home Team form, Away Team form and league points home.
Results of Table 5 also included experiments with CB after the exclusion of low importance features. More specifically, it is well-known that when training a model, many used features are less important and contribute less to the model’s predictions or maybe even deteriorate its performance. To explore this case, features with importance of 2 or less were excluded. The CB model was then retrained with the remaining features. This approach resulted in a drop in the predictive accuracy to 65.97%, as seen in Table 5. Therefore, it was shown that excluded features were significant and played a vital role in the match outcome prediction.

5.3. Comparison with Other Leagues

In order to evaluate the predictive ability of the proposed method for the Greek Super League, leagues with different characteristics were incorporated into the study. These characteristics included difficulty of prediction, budgets of the teams participating in the leagues, league structure and matches played in the whole season. Therefore, the English Premier League was selected as one of the most competitive leagues across the world, and the Dutch Eredivisie, which has similar characteristics with the Greek Super League, in the sense of having teams of the mid-lower table with low budgets and also due to the significant gap between top and bottom half teams. Comparative results of all leagues are included in Table 5, Table 6 and Table 7.
After applying the same preprocessing steps to prepare the English Premier League data, the CB model was trained by using all the feature set with the default hyperparameters defined from the model. With the default hyperparameters, it achieved 54.65% predictive accuracy, and, similarly to the predictions for the Greek Super League, the model found it difficult to predict Draw results, with recall for the specific class being even lower at about 1%. From feature importance extraction it was found that the most important features were the Home Team, Away Team, Home Team form and Away Team form that were also the inputs of the categorical feature set. By applying hyperparameter tuning, the accuracy remained the same, but the Draw class recall was increased by 2%. By using data augmentation with SMOTE, the best predictive accuracy was 61.42% with Grid Search hyperparameter tuning and standard scaling of the feature data. The best model parameters were: depth = 6, l2 leaf reg = 3, learning rate = 0.1. The features that contributed the most to this optimal result were: Home Team, Away Team, Home Team form and Away Team budget. Results of the English Premier League data are summarized in Table 6.
Next, the Dutch Eredivisie league was investigated. Dutch Eredivisie consists of 26 teams participating across six seasons from 2015 to 2020 and of 1762 matches played overall. The dataset includes historic teams that have performed well across the entire history of the league (domestically and internationally), such as Ajax FC, PSV Eindhoven and Feyenoord, and teams with lower dynamics as a result of their budgets. The latter dataset resembles that of the Greek Super League. However, in the Dutch Eredivisie, budget numbers are higher. The same setup with the CatBoost model was also applied to the same data. It should be noted that the Dutch Eredivisie dataset, similarly to the Greek Super League dataset, was imbalanced. After training with its default hyperparameters, the CatBoost model achieved 56.47% accuracy using 10-fold cross-validation. The recall of the Draw results was very low at 0%. This verified the fact that models struggle to predict accurate results when depending on such imbalanced data, and that the Draw result is the most unpredictable of all. After applying hyperparameter tuning using Grid Search, the accuracy of the CB model was raised to 56.98% with the following best parameters: depth = 6, l2 leaf reg = 8, learning rate = 0.15. Unfortunately, the recall of the Draw class did not improve and remained 0%. In both cases, the most important features (based on feature importance extraction) were similar to the previous experiment of the English Premier League: Home Team, Away Team, Home Team form and Away Team form contributed more to the results. By incorporating data augmentation into the problem, the best result was again achieved by combining Grid Search hyperparameter tuning. More specifically, the CatBoost model achieved 66.39% 10-fold cross-validation, with the best parameters being: depth = 8, l2 leaf reg = 3, learning rate = 0.15. The most important features that contributed to the predictions were: Away Team, Home Team, Away Team form and Home Team budget features. Results of the Dutch Eredivisie data are summarized in Table 7.

5.4. Training Experimentation

To experiment further with all the available data, additional experiments involving the CB model and the best performing methodology from the previous three league experiments were carried out. First tested was the case when CB was trained with all match data, and second, when CB was trained with one league and tested with the rest of the leagues.
It is clear that data augmentation, due to the imbalanced nature of the data, contributed a lot to reach a higher performance accuracy. Therefore, at this stage of experimentation, all data along with the augmented records were used to train the CatBoost model. The used model hyperparameters were extracted through Grid Search, and the used categorical features were encoded the same way as described previously. Based on the team’s budgets, features were encoded with a number from one (lowest budget within the league) to the maximum number of the league’s teams (highest budget within the league). For example, the highest budgets for all six seasons were held by Olympiacos for the Greek Super League (encoded with number 25), Ajax for the Dutch Eredivisie (encoded with number 25) and Manchester City for the English Premier League (encoded with number 30). Moreover, the lowest budget teams within the data period were encoded with the number one. Results are summarized in Table 8. The best parameters for the model were: l2 leaf reg = 3, learning rate = 0.2, depth = 6. As shown in Table 8, with 10-fold cross-validation, the accuracy reached 64.31%, which is approximately the mean of the highest accuracy of all previous experiments. The Draw recall metric was the lowest of all metrics in this experiment with 59.8%, which validates once again the fact that the Draw result is the most difficult to predict.
In order to distinguish how much the different attributes and properties of each league affect predictability, an additional experiment was performed; the CatBoost model was trained in one of the aforementioned leagues, and the aim was to predict match results of the other two leagues. The models used were those trained in previous sections with augmented data and hyperparameter tuning. As it can be seen from the results presented in Table 9, the model struggled to accurately predict results for leagues on which data was not trained.
The latter indicated that indeed each league has peculiarities of their own, which are necessary for the match outcome prediction procedure. More specifically, the model trained on Greek Super League data achieved 47.84% accuracy on Dutch Eredivisie match predictions and 46.22% on English Premier League data. It should be noted here that the Greek model’s recall metrics for both predictions were below 1%. Therefore, the Greek model did not accomplish finding almost any Draw results for the other two leagues. The model trained with Eredivisie data achieved 42.60% accuracy on Greek Super League data and 41.59% on English Premier League data. Similarly, the Draw recall metric when testing on Greek data was 0.0691, in contrast with English data, which reported 0.3821. Finally, the English-trained model achieved 49.60% on Greek data and 46.70% on Dutch data.

5.5. CNNs and Transfer Learning

To expand the above experiments with deep neural networks, the aforementioned tabular data were encoded and transformed to images in order to be fed into pretrained CNNs.
CNNs are a specific type of artificial neural network that are similarly comprised of neurons that self-optimize through learning [35]. CNNs are used mostly for analyzing image data due to the ability of encoding image features into their architecture.
Here, the latter was accomplished by initially converting categorical variables Home Team, Away Team, Home Team form and Away Team form into dummy/indicator variables and then applying Min–Max scaling with a range from 0 to 1. Finally, the RGB channel dimension was added by repeating those images three times (for each RGB channel). An example of the generated images is shown in Figure 12.
The selected pretrained models were: DenseNet201, InceptionV3, MobileNetV2 and ResNet101V2, which are all available through Keras Applications and the TensorFlow library. The rest of the methodology was the same as in all previous experiments regarding the preprocessing of the match data. Experiments were limited on augmented data with SMOTE and to no feature selection method due to optimal reported results of this case, as already shown. For all trained CNN models, one layer, the last, was only trained on the problem of interest. Moreover, the last 20 layers of the best-performing CNN model, the mobilenetv2, were unfrozen and trained in order to investigate the performance gain. The last layer of every model is a dense one with three outputs, one for each match outcome (Home Win, Draw, Away Win). The softmax activation function was used, which is also known as a normalized exponential function and is mostly used for multi-class classification. The Adam optimizer was used as an efficient stochastic gradient descend method with adaptive learning rate with little memory requirements [36]. Early stopping of training the CNN was also added in order to avoid overfitting and to obtain the best model across all trained epochs. Finally, 10-fold cross-validation was used to extract the performance metrics, as in all previous experiments, and the model was trained for 100 epochs per fold. Results involved all three leagues, which were first examined separately, and then the best model was trained on all leagues’ data.
By using CNNs to predict the match outcome in the Greek Super League dataset, the highest achieved accuracy was 58.27% by using MobileNetV2 and freezing all layers except the last 20. The InceptionV3 seemed to be the lowest performing model together with ResNet101V2, reporting accuracies of 50.62% and 53.82%, respectively, as shown in Table 10. Compared to the previous experiments, a decline in all metrics was noticed. More specifically, by using CatBoost, we achieved 67.73% with SMOTE, hyperparameter tuning through Grid Search and scaling of the data, which translated to approximately 15% of a difference in accuracy between the two experimental approaches. In general, all metrics were decreased by approximately 10% compared to previous CatBoost experiments. The results are summarized in Table 10.
By using the English Premier League’s dataset, the metric results were similar to those extracted in the Greek Super League by using CNNs. Similarly, there was a drop in all metrics, and the highest achieved accuracy, 53.29%, was reported with the MobileNetV2 model with the last 20 layers trained. Yet, reported results with the CNNs were lower compared to the corresponding results from the previous experiments without the usage of data augmentation. Regarding the AUC metric, the highest performance was again by the MobileNetV2 model with the last 20 layers trained, reaching 0.6899. The lower performing models were the same as in the experiment with the Greek Super League, InceptionV3, with an accuracy of 50.38%, and ResNet101V2, with 50.28%. The results are summarized in Table 11.
In the case of the Dutch Eredivisie dataset, the results were similar. Once again, the highest achieved accuracy was 56.21% with MobileNetV2 with the last 20 layers trained as well as the highest achieved recall metric of 0.4402. As a conclusion, it should be noted that training more layers seems to be profitable for performance metrics. However, it comes with a computational cost. The general decrease in all metric values, compared with CB with SMOTE, is in the range of 10% to 15%. The worst performing models were again ResNet101V2 with an accuracy of 51.33% and InceptionV3 with an accuracy of 48.54%. The results are summarized in Table 12.
According to the flow of the proposed method, the CNN model with the best performance was further investigated with training on the entire dataset of leagues along with the augmented records through SMOTE. Training was performed with the MobileNetV2 with training on the last 20 layers and the same hyperparameters as previously. Regarding encoding of categorical features, the teams’ budgets were employed. The highest reported accuracy was 52.99%, much lower compared to the same experiment by using CB, which was 64.31%. Precision dropped approximately 10% and recall almost 20%, while the AUC metric went from 0.8333 to 0.6991. Results are included in Table 13.

6. Discussion

This work is the first case study of soccer outcome prediction of the Greek Super League. Experimental results revealed that due to the imbalanced nature of the data and their limited number, the models were highly obstructed to predict most home results were and unable to predict the Draw results, which was evident from the reported recall metrics. Data augmentation, and more specifically SMOTE methodology, was able to deal with this problem. Further experimental results revealed a general improvement by almost 10% of the initial results by using the original data.
Moreover, imbalanced data may lead to overfitting issues. Overfitting and imbalanced data are the most common issues when building machine learning models. In order to avoid overfitting, apart from data augmentation, data cleaning to remove outliers, imputation to handle missing values in the dataset and hyperparameter tuning were also applied. Therefore, this work followed a certain methodology in order to deal with the problem of overfitting in the presence of class imbalance by inspecting the models’ behaviors and evaluating comparatively their performance. Results indicated that basic pre-processing techniques towards the latter direction could help to substantially improve machine learning model performance and could help to gain a better understanding of the models under different training scenarios.
Initial experiments indicated the CatBoost model as the most accurate model for predicting soccer outcome, which is a gradient boosting on decision trees algorithm. The latter can be attributed to the ability of CB to handle categorical features and convert them into numbers directly without encoding. It should be noted that feature importance algorithms indicated categorical features as the most important features for outcome prediction of the Greek Super League. The main advantages of CB over the remaining examined machine learning models are its easy implementation, and its categorical features not requiring any preprocessing, therefore making computations quicker and providing increased prediction accuracy while avoiding overfitting.
Further experiments with CNN architectures by encoding the preexisting tabular data into images and then feeding them into pretrained models did not report the expected results. The latter may be attributed either to insufficient data or to the inability of CNNs to perform well when data is encoded and used by pretrained models. However, it should be noted that when more layers of the CNN pretrained model MobileNetV2 were trained, then all metrics improved, yet not enough to reach the performance of the CatBoost model. By unfreezing layers, more weights are updated, and therefore better results can be obtained; however, the latter requires more data for training. Future work should focus on the relation between the size of the dataset and the impact of training more layers. Yet, since the use of a larger dataset and the training of many layers is computationally expensive and will take longer, system requirements regarding GPU memory for speeding the process also need to be considered. Future work should also investigate the encoding of the tabular data into images. New approaches need to be considered that are capable of maintaining all classes’ information.
Interpreting the results, it seems that the Greek Super League is the more predictable league compared to the other two, reporting 67.73% accuracy with CB, the usage of augmented data, hyperparameter tuning and scaling. The latter is mainly due to weak competition in the Greek Super League, since the differences in budgets between the top teams and the remaining ones are noticeably large. Therefore, results indicated that match outcome prediction in the Greek Super League is to some extent possible. In contrast, the most difficult league to predict with the same methodology and maximum accuracy of 61.42% was the English Premier League. Results indicate that teams with different dynamics in terms of predictability cannot be handled either with the same models or by using the same features.
When the training process included all league data, accuracy reached 64.31%, which is an insignificant improvement compared to the experimental results for each individual league. When training the CB model on one league and testing on the other two, a decrease of 10% to 20% was reported. The latter strongly indicates that each league has its own properties and particularities that need to be considered separately for an accurate prediction.

7. Conclusions

This work constitutes the first case study for soccer outcome prediction based on data referring solely to the Greek Super League. The conducted research managed to identify the most important features that affect the final results of the Greek Super League by using several machine learning and deep learning models, pointing out the Home Team Form and the Away Team Form as the two most important features for most of the examined models. Comparison with two other leagues with different dynamics in terms of predictability, aimed towards comparative conclusions, indicated the Greek Super League as the most predictable league of all in terms of final match results and league standings, reporting 67.73% of accuracy with CB, the usage of augmented data, hyperparameter tuning and scaling. Comparative results on training the models with one league and testing them with another indicated a decrease in performance, revealing that each league has its own properties and particularities that need to be considered separately for an accurate prediction.
Although the proposed methodology achieved high predictive accuracy for the problem at hand, there is much room for improvement in terms of match data acquisition and encoding of features to describe better the factors that most affect the match outcome. Limitations regarding match data acquisition could be surpassed if a way was found for incorporating multiple leagues and extracting features that could distinguish properly each league’s unique properties. Additionally, more feature selection methods could be tested to identify if, eventually, feature selection can have a significant improvement in the predictive accuracy.

Author Contributions

Conceptualization, G.A.P.; methodology, M.-C.M.; software, M.-C.M.; validation, M.-C.M. and G.A.P.; formal analysis, M.-C.M.; investigation, M.-C.M. and E.V.; resources, M.-C.M.; data curation, M.-C.M.; writing—original draft preparation, M.-C.M. and E.V.; writing—review and editing, M.-C.M., E.V. and G.A.P.; visualization, G.A.P.; supervision, G.A.P.; project administration, G.A.P. All authors have read and agreed to the published version of the manuscript.

Funding

This research received no external funding.

Institutional Review Board Statement

Not applicable.

Informed Consent Statement

Not applicable.

Data Availability Statement

The match statistics-related data were obtained from publicly archived datasets at football-data.co.uk (accessed on 10 July 2022) [27]. Teams’ budget related data were acquired from the website transfermarkt.de (accessed on 10 July 2022) [28].

Conflicts of Interest

The authors declare no conflict of interest.

References

  1. Grand View Research (GVR). Sports Betting Market Size, Share & Trends Analysis by Platform, by Type, by Sports Type (Football, Basketball, Baseball, Horse Racing, Cricket, Hockey, Others), by Region, and Segment Forecasts, 2022–2030. Available online: https://www.grandviewresearch.com/industry-analysis/sports-betting-market-report (accessed on 10 July 2022).
  2. Rue, H.; Salvesen, O. Prediction and Retrospective Analysis of Soccer Matches in a League. J. R. Stat. Soc. Ser. 2000, 49, 399–418. [Google Scholar] [CrossRef]
  3. Berrar, D.; Lopes, P.; Dubitzky, W. Incorporating domain knowledge in machine learning for soccer outcome prediction. Mach. Learn. 2019, 108, 97–126. [Google Scholar] [CrossRef]
  4. Hill, I.D. Association Football and Statistical Inference. Appl. Stat. 1974, 23, 203. [Google Scholar] [CrossRef]
  5. Reep, C.; Benjamin, B. Skill and Chance in Association Football. J. R. Stat. Soc. Ser. 1968, 131, 581. [Google Scholar] [CrossRef]
  6. Singh, N. Sport Analytics: A Review. Int. Technol. Manag. Rev. 2020, 9, 64. [Google Scholar] [CrossRef]
  7. Fernández, J.; Bornn, L. SoccerMap: A Deep Learning Architecture for Visually-Interpretable Analysis in Soccer. In Lecture Notes in Computer Science (Including Subseries Lecture Notes in Artificial Intelligence and Lecture Notes in Bioinformatics); Springer: Cham, Switzerland, 2021; pp. 491–506. ISBN 9783030676698. [Google Scholar]
  8. Gudmundsson, J.; Horton, M. Spatio-Temporal Analysis of Team Sports. ACM Comput. Surv. 2018, 50, 1–34. [Google Scholar] [CrossRef]
  9. Maher, M.J. Modelling association football scores. Stat. Neerl. 1982, 36, 109–118. [Google Scholar] [CrossRef]
  10. Dixon, M.J.; Coles, S.G. Modelling Association Football Scores and Inefficiencies in the Football Betting Market. J. R. Stat. Soc. Ser. Appl. Stat. 1997, 46, 265–280. [Google Scholar] [CrossRef]
  11. Angelini, G.; De Angelis, L. PARX model for football match predictions. J. Forecast. 2017, 36, 795–807. [Google Scholar] [CrossRef]
  12. Rahman, M.A. A deep learning framework for football match prediction. SN Appl. Sci. 2020, 2, 165. [Google Scholar] [CrossRef] [Green Version]
  13. Karlis, D.; Ntzoufras, I. Analysis of sports data by using bivariate Poisson models. J. R. Stat. Soc. Ser. 2003, 52, 381–393. [Google Scholar] [CrossRef]
  14. Hvattum, L.M.; Arntzen, H. Using ELO ratings for match result prediction in association football. Int. J. Forecast. 2010, 26, 460–470. [Google Scholar] [CrossRef]
  15. Huang, K.-Y.; Chang, W.-L. A neural network method for prediction of 2006 World Cup Football Game. In Proceedings of the The 2010 International Joint Conference on Neural Networks (IJCNN), Barcelona, Spain, 18–23 July 2010; IEEE: New York, NY, USA, 2010; pp. 1–8. [Google Scholar]
  16. Jain, S.; Tiwari, E.; Sardar, P. Soccer Result Prediction Using Deep Learning and Neural Networks. In Lecture Notes on Data Engineering and Communications Technologies; Springer: Singapore, 2021; pp. 697–707. [Google Scholar]
  17. Mustafa Zebari, G.; Zeebaree, S.; Sadeeq, M.M.; Zebari, R. Predicting Football Outcomes by Using Poisson Model: Applied to Spanish Primera División. J. Appl. Sci. Technol. Trends 2021, 2, 105–112. [Google Scholar] [CrossRef]
  18. Goddard, J.; Asimakopoulos, I. Forecasting football results and the efficiency of fixed-odds betting. J. Forecast. 2004, 23, 51–66. [Google Scholar] [CrossRef]
  19. Joseph, A.; Fenton, N.E.; Neil, M. Predicting football results using Bayesian nets and other machine learning techniques. Knowl.-Based Syst. 2006, 19, 544–553. [Google Scholar] [CrossRef]
  20. Baio, G.; Blangiardo, M. Bayesian hierarchical model for the prediction of football results. J. Appl. Stat. 2010, 37, 253–264. [Google Scholar] [CrossRef]
  21. Constantinou, A.C. Dolores: A model that predicts football match outcomes from all over the world. Mach. Learn. 2019, 108, 49–75. [Google Scholar] [CrossRef]
  22. Tsakonas, A.; Dounias, G.; Shtovba, S.; Vivdyuk, V. Soft computing-based result prediction of football games. In Proceedings of the First International Conference on Inductive Modelling (ICIM’2002), Lviv, Ukraine, 20–25 May 2002; pp. 1–8. [Google Scholar]
  23. Rotshtein, A.P.; Posner, M.; Rakityanskaya, A.B. Football Predictions Based on a Fuzzy Model with Genetic and Neural Tuning. Cybern. Syst. Anal. 2005, 41, 619–630. [Google Scholar] [CrossRef]
  24. Arabzad, S.M.; Tayebi Araghi, M.E.; Sadi-Nezhad, S.; Ghofrani, N.; Araghi, M.E.T.; Sadi-Nezhad, S.; Ghofrani, N. Football Match Results Prediction Using Artificial Neural Networks, The Case of Iran Pro League. Int. J. Appl. Res. Ind. Eng. 2014, 1, 159–179. [Google Scholar]
  25. Tax, N.; Joustra, Y. Predicting The Dutch Football Competition Using Public Data: A Machine Learning Approach. Trans. Knowl. Data Eng. 2015, 10, 1–13. [Google Scholar]
  26. Hubáček, O.; Šourek, G.; Železný, F. Learning to predict soccer results from relational data with gradient boosted trees. Mach. Learn. 2019, 108, 29–47. [Google Scholar] [CrossRef]
  27. Football-Data Football-Data.co.uk. Available online: https://www.football-data.co.uk/ (accessed on 10 July 2022).
  28. Transfermarkt Transfer Markt. Available online: https://www.transfermarkt.de/ (accessed on 10 July 2022).
  29. SUPER LEAGUE Super League Greece. Available online: https://www.slgr.gr/en/ (accessed on 10 July 2022).
  30. Emmanuel, T.; Maupong, T.; Mpoeleng, D.; Semong, T.; Mphago, B.; Tabona, O. A survey on missing data in machine learning. J. Big Data 2021, 8, 140. [Google Scholar] [CrossRef] [PubMed]
  31. Jamshidian, M.; Mata, M. Advances in Analysis of Mean and Covariance Structure when Data are Incomplete. In Handbook of Latent Variable and Related Models; Elsevier: Amsterdam, The Netherlands, 2007; pp. 21–44. ISBN 9780444520449. [Google Scholar]
  32. Prokhorenkova, L.; Gusev, G.; Vorobev, A.; Dorogush, A.V.; Gulin, A. CatBoost: Unbiased boosting with categorical features. Adv. Neural Inf. Process. Syst. 2018, 31, 1–11. [Google Scholar]
  33. Chawla, N.V.; Bowyer, K.W.; Hall, L.O.; Kegelmeyer, W.P. SMOTE: Synthetic Minority Over-sampling Technique. J. Artif. Intell. Res. 2002, 16, 321–357. [Google Scholar] [CrossRef]
  34. dos Santos, C.F.G.; Papa, J.P. Avoiding Overfitting: A Survey on Regularization Methods for Convolutional Neural Networks. ACM Comput. Surv. 2022, 3510413. [Google Scholar] [CrossRef]
  35. Milosevic, N. Introduction to Convolutional Neural Networks; Apress: Berkeley, CA, USA, 2020; ISBN 978-1-4842-5648-0. [Google Scholar]
  36. Kingma, D.P.; Ba, J. Adam: A Method for Stochastic Optimization. arXiv 2014, arXiv:1412.6980. [Google Scholar]
Figure 1. Flow diagram of the proposed methodology.
Computers 11 00133 g001
Figure 2. Team appearances as a Home Team in the six-season period.
Computers 11 00133 g002
Figure 3. Results for teams playing as Home Teams.
Computers 11 00133 g003
Figure 4. Results for teams playing as Away Teams.
Computers 11 00133 g004
Figure 5. Final time result counts for the whole dataset.
Computers 11 00133 g005
Figure 6. Budget distribution of all the teams that participated in the Greek Super League in the six-season period.
Computers 11 00133 g006
Figure 7. Final time result counts for the whole dataset: Win (Green), Draw (Blue) and Loss (Red) distributions of all Greek Super League teams playing as a Home team, according to their budgets.
Computers 11 00133 g007
Figure 8. Win (Green), Draw (Blue) and Loss (Red) distributions of all Greek Super League teams playing as an Away team, according to their budgets.
Computers 11 00133 g008
Figure 9. Maximum Home odds (BbMxH) distribution.
Computers 11 00133 g009
Figure 10. Maximum Draw odds (BbMxD) distribution.
Computers 11 00133 g010
Figure 11. Maximum Away odds (BbMxA) distribution.
Computers 11 00133 g011
Figure 12. Match data frame at index 0 of Greek Super League.
Computers 11 00133 g012
Table 1. Indicative results of different methods of the referenced literature on soccer outcome prediction.
Ref.LeagueModelResultMetricFeatures
[14]Four divisions of English league system (Premiership, Championship, League One, League Two), 93/94 to 07/08Ordered logit regression models1.491Informational
Loss (L)
ELO ratings, team performance parameters, betting odds, past match results
[13]Italian series A, 1991–1992,
and Champions League, 2000–2001
Bivariate Poisson regression model0.85p-valueNumber of games, goals scored by Home and Away team, offensive and defensive performance, Home effect parameter
[2]Premier League and Division 1 matches, 1993–1997Bayesian dynamic generalized linear model0.357—Premier League
0.372—Division 1
Normalized
Pseudo-likelihood
Match results, attacking and defending
parameters, goals scored, time variations
[18]Ten seasons of first four divisions in English Football (Premier League, Division 1, Division 2, Division 3)Ordered Probit
regression
0.365Normalized
Pseudo-likelihood
Team quality indicators, recent performance indicators, status variable (whether team able to be promoted, relegated or win the Championship), elimination parameter, geographical distance coefficient
[19]Premier League (only Tottenham Hotspur matches), 1995–1997Expert constructed Bayesian network59.21%AccuracyAttack parameter, overall quality of team, quality of opposing team, performance indicator (depending on team quality and quality of the opposition), presence/absence of players, venue, playing positions
[22]10 seasons of the Ukrainian ChampionshipGenetic programming model76%AccuracyNumber of traumatized and disqualified players of host team and Away Team, difference of dynamics profile, difference of ranks, host factor, personal score (goal difference for all the games of the teams involved)
[23]1056 matches of the Finland Championship, 1994–2001Fuzzy model with neural optimization techniques86%AccuracyDifference of goals scored and goals conceded
[15]2006 World Cup Stage MatchesMulti-layer perceptron with back-propagation76.90% excluding draw results (3 matches out of 16)AccuracyGoals, shots, shots on goal, corner kicks, direct free kicks to goal, indirect free kicks to goal, ball possession, fouls suffered
[24]2068 matches Iranian Premier LeagueArtificial neural network62.5%AccuracyTeams, team form, average of obtained points in the league, quality of opponents in last matches, week of match, match result
[25]Dutch Eredivisie League, 2007–2013Hybrid model of LogitBoost and ReliefF56.05%AccuracyTeams, average goals scored/conceded, previous 5 matches results, several statistics about players teams and earlier encounters, odds from several bookers and Asian handicaps
[26]200,000 matches from 52 leagues around the world (2017 Soccer Prediction Challenge)Gradient boosting decision trees0.2063RPSHistorical strength, current form,
pi-ratings, page rank, match importance, league
[3]200,000 matches from 52 leagues around the world (2017 Soccer Prediction Challenge)Extreme gradient boosting decision trees (XGBoost)0.2023RPSAttacking strength, defensive strength, Home advantage feature group, strength of opposition, attacking weakness, defensive weakness, recent performance
[21]200,000 matches from 52 leagues around the world (2017 Soccer Prediction Challenge)Hybrid Bayesian networks0.2082RPSCase (which team is favorite), league, match date, teams, team ratings, rating difference
Table 2. Most important used features (original from [27] (1) or from [28] (2) and engineered (E)) for CatBoost and for the rest of the models after SFS.
k-NN.RFLBSVMCB
Home Team form (E)Home Team form (E)Home Team form (E)Previous half match goals (E)Home Team form (E)
Previous half match goals for Home Team (E)Previous half match goals both for Home Team (E)Away Team form (E)Previous match goals Away (E)Away Team form (E)
Max Away Team odds (1)Previous half match goals both for Away Team (E)Previous half match goals both for Away Team (E)Asian handicap line (1)Home Team (1)
Average Home Team odds (1)League points the Home Team has gathered (E)Max Home odds for the corresponding Asian handicap line (1)Away Team (1)
Asian handicap line (1)Asian handicap line (1)
Average Home odds for the corresponding Asian handicap line (1)Average Home odds for the corresponding Asian handicap line (1)
Max Home Team odds (1)
Average Draw odds (1)
Table 3. Best initial experimental performance of all models (higher accuracy is marked in bold).
ModelAccuracyPrecisionRecallF1-ScoreAUC
k-NN50.13%0.46650.46640.46640.5998
RF56.38%0.51160.49750.49250.6974
LB55.65%0.51060.49620.49620.6913
CB56.59%0.51230.49470.47740.7361
SVM54.07%0.42580.44140.38760.5474
Table 4. Best initial experimental performance of all models.
Metric.ValueMetricValue
Home precision0.5978Home F1-score0.6944
Draw precision0.3653Draw F1-score0.2018
Away precision0.5738Away F1-score0.5361
Home recall0.8308AUC0.7361
Draw recall0.1426Accuracy56.59%
Away recall0.5107
Table 5. Further experimental results by class with CatBoost for the Greek Super League (higher accuracy is marked in bold).
MethodAccuracyHome
Precision
Draw
Precision
Away
Precision
Home
Recall
Draw
Recall
Away
Recall
Home F1-ScoreDraw F1-ScoreAway F1-ScoreAUC
Default56.59%0.59780.36530.57380.83080.14260.51070.69440.20180.53610.7361
Tuned56.26%0.61390.32410.55490.84140.13770.48200.70920.18850.50940.7231
SMOTE66.76%0.64520.63660.73170.65790.63700.70780.64920.63600.71800.8534
SMOTE and scaled66.80%0.64890.62720.73600.64540.63420.72450.64580.63000.72840.8603
SMOTE, scaled and tuned67.73%0.67500.64320.72260.64960.68150.70080.66080.66070.70990.8572
SMOTE and tuned67.31%0.67270.64340.71080.62460.67860.71620.64640.66000.71200.8571
Without low importance65.97%0.65350.61960.71310.60240.63840.73840.62480.62800.72370.8448
Table 6. Further experimental results by class with CatBoost for the English Premier League (higher accuracy is marked in bold).
MethodAccuracyHome
Precision
Draw
Precision
Away
Precision
Home
Recall
Draw
Recall
Away
Recall
Home F1-ScoreDraw F1-ScoreAway F1-ScoreAUC
Default54.65%0.55050.61670.54690.83780.00550.53890.66400.10500.54150.6954
Tuned54.65%0.55500.50870.54040.81950.02560.54630.66120.46300.54070.6999
SMOTE59.28%0.58220.57750.62160.60170.56620.61040.59110.57110.61510.7981
SMOTE and scaled59.24%0.57640.58330.62470.60460.57390.59880.58880.57770.61020.7968
SMOTE, scaled and tuned61.42%0.59300.61610.63630.60070.59590.64590.59610.60510.64010.8056
SMOTE and tuned61.03%0.59570.58990.64670.59120.58730.65260.59270.58810.64870.8005
Without low importance61.23%0.60430.60170.63580.57400.61320.64960.58800.60600.64090.7998
Table 7. Further experimental results by class with CatBoost for the Dutch Eredivisie (higher accuracy is marked in bold).
MethodAccuracyHome
Precision
Draw
Precision
Away
Precision
Home
Recall
Draw
Recall
Away
Recall
Home F1-ScoreDraw F1-ScoreAway F1-ScoreAUC
Default56.47%0.59051.00000.51760.82080.00000.59370.68610.00000.55070.7015
Tuned56.98%0.59070.90000.53060.83780.00000.58440.92200.00000.55420.6971
SMOTE65.09%0.62030.68210.66470.69860.59200.66230.65510.63280.66140.8352
SMOTE and scaled63.68%0.61390.64490.65720.62480.59930.68650.61670.62030.66980.8293
SMOTE, scaled and tuned66.27%0.63320.68100.67890.63560.64900.70350.63310.66330.69020.8410
SMOTE and tuned66.96%0.62720.69190.69270.64780.65500.70590.63640.67170.69890.8485
Without low importance65.34%0.62560.65360.68680.64050.62360.69620.63000.63700.68990.8360
Table 8. Performance of CB by class when trained with all leagues’ data with SMOTE.
MetricValueMetricValue
Home precision0.6139Home precision0.6139
Draw precision0.6556Draw precision0.6556
Away precision0.6648Away precision0.6648
Home recall0.6718Home recall0.6718
Draw recall0.5980Draw recall0.5980
Away recall0.6595
Table 9. Further experimental results by class with CatBoost by training with one league and testing with another.
MethodAccuracyHome
Precision
Draw
Precision
Away
Precision
Home
Recall
Draw
Recall
Away
Recall
Home F1-ScoreDraw F1-ScoreAway F1-ScoreAUC
Default47.84%0.44750.53320.52920.83040.01690.58790.58150.03220.55690.6959
Tuned46.22%0.45090.42490.48020.73720.03950.61000.55950.07190.53730.6530
SMOTE42.60%0.50670.27950.40410.47710.06910.73170.49120.11040.52050.6043
SMOTE and scaled41.58%0.48360.35690.40640.51590.38210.34980.49870.36890.37540.6029
SMOTE, scaled and tuned49.60%0.52840.39730.55010.65160.34980.48660.58360.37090.51540.6923
SMOTE and tuned46.70%0.44200.34700.53390.81720.05680.52690.57360.09690.53030.6783
Without low importance47.84%0.44750.53320.52920.83040.01690.58790.58150.03220.55690.6959
Table 10. CNN performances on Greek Super League (higher accuracy is marked in bold).
CNN ModelAccuracyPrecisionRecallAUC
DenseNet20155.86%0.60120.38980.7142
InceptionV350.62%0.52250.37180.6561
MobileNetV255.86%0.57160.43530.7141
ResNet101V253.82%0.56570.40420.6919
MobileNetV2
20-layer Train
58.27%0.60760.47560.7346
Table 11. CNN performances on English Premier League (higher accuracy is marked in bold).
CNN ModelAccuracyPrecisionRecallAUC
DenseNet20152.59%0.55890.36140.6735
InceptionV350.38%0.52760.35630.6550
MobileNetV251.15%0.54160.37130.6658
ResNet101V250.28%0.52880.37680.6533
MobileNetV2
20-layer Train
53.29%0.56990.40360.6899
Table 12. CNN performances on Dutch Eredivisie (higher accuracy is marked in bold).
CNN ModelAccuracyPrecisionRecallAUC
DenseNet20154.03%0.56730.39140.6846
InceptionV348.54%0.50270.34340.6363
MobileNetV254.43%0.56330.43010.6933
ResNet101V251.33%0.53210.37360.6700
MobileNetV2
20-layer Train
56.21%0.59100.44020.7087
Table 13. Best model performance when trained with all league data with SMOTE.
CNN ModelAccuracyPrecisionRecallAUC
MobileNetV2
20-layer Train
52.99%0.57770.39620.6991
Publisher’s Note: MDPI stays neutral with regard to jurisdictional claims in published maps and institutional affiliations.

