Article

A Deep Learning Network with Aggregation Residual Transformation for Human Activity Recognition Using Inertial and Stretch Sensors

by
Sakorn Mekruksavanich
1 and
Anuchit Jitpattanakul
2,3,*
1
Department of Computer Engineering, School of Information and Communication Technology, University of Phayao, Phayao 56000, Thailand
2
Department of Mathematics, Faculty of Applied Science, King Mongkut’s University of Technology North Bangkok, Bangkok 10800, Thailand
3
Intelligent and Nonlinear Dynamic Innovations Research Center, Science and Technology Research Institute, King Mongkut’s University of Technology North Bangkok, Bangkok 10800, Thailand
*
Author to whom correspondence should be addressed.
Submission received: 2 June 2023 / Revised: 9 July 2023 / Accepted: 14 July 2023 / Published: 17 July 2023
(This article belongs to the Special Issue Machine and Deep Learning in the Health Domain)

Abstract

:
With the rise of artificial intelligence, sensor-based human activity recognition (S-HAR) is increasingly being employed in healthcare monitoring for the elderly, fitness tracking, and patient rehabilitation using smart devices. Inertial sensors have been commonly used for S-HAR, but wearable devices have been demanding more comfort and flexibility in recent years. Consequently, there has been an effort to incorporate stretch sensors into S-HAR with the advancement of flexible electronics technology. This paper presents a deep learning network model, utilizing aggregation residual transformation, that can efficiently extract spatial–temporal features and perform activity classification. The efficacy of the suggested model was assessed using the w-HAR dataset, which included both inertial and stretch sensor data. This dataset was used to train and test five fundamental deep learning models (CNN, LSTM, BiLSTM, GRU, and BiGRU), along with the proposed model. The primary objective of the w-HAR investigations was to determine the feasibility of utilizing stretch sensors for recognizing human actions. Additionally, this study aimed to explore the effectiveness of combining data from both inertial and stretch sensors in S-HAR. The results clearly demonstrate the effectiveness of the proposed approach in enhancing HAR using inertial and stretch sensors. The deep learning model we presented achieved an impressive accuracy of 97.68%. Notably, our method outperformed existing approaches and demonstrated excellent generalization capabilities.

1. Introduction

As wearable devices such as smartwatches and bracelets become more prevalent, it becomes possible to effortlessly record and analyze the daily movements of the human body without any limitations imposed by the surrounding environment [1]. The issue of recognizing human behavior using wearable sensors has been extensively studied. The main goal is to differentiate between various types of physical activities performed by individuals by analyzing time series data collected from these sensors [2]. A considerable amount of research has been conducted to develop advanced data processing methods, classification techniques, and machine learning (ML) models for implementing human activity recognition (HAR) in human-to-human interactions, human-to-machine interfaces, and automated systems [3].
Applications that recognize human activity are valuable for monitoring elderly healthcare, tracking fitness, and aiding patient rehabilitation. To identify user activity, applications of HAR require ongoing sensor data, and recent advancements in sensor technology have facilitated the widespread use of HAR applications in daily life. Previous literature indicates that HAR can be categorized into two main types: video-based and sensor-based activity recognition [4,5].
Video-based HAR (V-HAR) involves extracting features of human activity from images and video streams captured by cameras placed in the environment where humans are present [6]; although this approach provides a more intuitive understanding of the complexities involved in the task at hand, its applicability is limited to specific scenarios and cannot be used in unstructured environments due to its heavy reliance on external factors such as lighting and camera placement [7]. To overcome these limitations, sensor-based human activity recognition (S-HAR) has been developed. This approach utilizes data from multiple wearable sensors to identify, understand, and evaluate human behavior. Initially, sensor technology was mainly used to analyze human gait and joint movements for healthcare diagnosis and rehabilitation purposes [8,9]. However, advancements in sensor technology have resulted in significant improvements in key aspects such as accuracy, size, and production costs [10].
The use of inertial sensors in HAR has proven to be effective [11]. However, wearable devices incorporating these sensors face several limitations [12]. The inclusion of inertial sensors often results in bulky devices that do not fit well on the skin and are uncomfortable due to rigid materials used in their construction. Additionally, the accuracy of these sensors in identifying activities heavily relies on motion velocity. To address these challenges, researchers have focused on developing flexible sensors made from lightweight and pliable materials that are less affected by motion velocity [13]. One example is the stretch sensor, which shows promise for application in wearable technology. These sensors can be attached to garments to collect data related to body movements, respiration, and cardiac activity [14,15].
In S-HAR, conventional approaches involve using ML techniques to manually extract characteristics from sensor data [16]. These characteristics typically consist of mathematical or fundamental measurements, such as means, medians, and standard deviations. However, selecting the most relevant set of features requires domain-specific expertise and knowledge. However, these methods have limited recognition performance, as they rely on handcrafted features that depend on human experts [17]. To address this limitation, deep learning (DL) approaches have been proposed to automatically extract informative features from raw sensor data. The contribution of this work is following:
  • To overcome this challenge, we propose a DL network with aggregation residual transformation called the ResNeXt model that can classify human activities based on inertial and stretch sensor data with satisfactory results.
  • The experiment also revealed that utilizing data from the stretch sensor yields improved recognition of various human actions compared to utilizing the initial sensor.
The rest of this article is organized as follows. Section 2 introduces recent related works. Section 3 describes the details of the proposed model. Section 4 shows our experimental results. Research findings are discussed in Section 5. Finally, Section 6 draws a conclusion of this work and shows challenging future works.

2. Related Works

This section covers a review of prior research on sensor-based HAR and DL methods that are relevant to the topic.

2.1. HAR Using Wearable Sensors

Research on sensor-based action recognition has made remarkable advancements in recent times, garnering increasing attention across various disciplines and application domains. These domains include smart living, healthcare, and well-being monitoring [18]. HAR aims to observe and analyze human behavior by examining data gathered from motion sensors such as accelerometers, gyroscopes, and other measuring devices. Initially, the conventional approach involved utilizing temporal features in combination with ML techniques. This approach commonly involved using basic signal statistics (e.g., mean and variance of time series) [19] and spectral power. However, these features needed to be improved in their ability to capture the intricacies of complex activities and reduce the computational cost [20]. DL technology has since emerged, automatically extracting features by constructing deep models. Compared to traditional methods, DL provides a comprehensive temporal representation learned directly from annotated data. CNNs and RNNs are particularly unique architectures used in HAR, demonstrating the effectiveness of DL in this field [21].
Nonetheless, the effectiveness of models continues to be predominantly influenced by the caliber and quantity of annotations. When only a minuscule number of sequences are annotated, deep networks tend to underperform due to overfitting. Consequently, it is crucial to investigate strategies for effectively utilizing limited labeled data to train a deep network in the context of HAR.

2.2. S-HAR with Wearable Sensors

S-HAR involves the use of sensor data to identify and analyze the activities performed by an individual. By utilizing wearable devices that collect data from sensors placed on the human body, S-HAR can provide valuable insights into human behavior, leading to improved assistance services and a higher quality of life. Recent advancements in sensor technology have resulted in increased interest and research in S-HAR. Commonly used sensors for HAR include inertial sensors such as accelerometers and gyroscopes, as well as flexible and pressure sensors that collect data used for feature extraction and activity classification.
In their study, Margarito et al. [22] utilized accelerometers attached to participants’ wrists to gather acceleration data. They employed a template-matching technique to classify eight common sports activities. In a separate investigation, Tan et al. [23] proposed an ensemble learning algorithm (ELA) that utilizes signals from smartphone sensors to identify actions. Qin et al. [24], on the other hand, introduced a novel approach to convert measurements from inertial sensors into a visual representation. They then applied a residual network (ResNet) to analyze the encoded heterogeneous data and extract significant features of human behavior. Cha and colleagues [25] developed a gait identification system that integrated a flexible sensor into a garment. The flexible sensor was seamlessly embedded within the fabric. This system demonstrated effective recognition of gait patterns and successfully distinguished between stationary standing and sitting movements. Numerous studies have consistently shown that utilizing sensors for recognition can greatly improve the accuracy of identifying human behavior. In this particular study, the researchers employed S-HAR along with the proposed ResNeXt model, aiming to enhance the recognition of human activities.

2.3. Sensor-Based HAR Using DL Approaches

Many research studies on S-HAR have emphasized the importance of utilizing different DL techniques for accurately recognizing human actions, and have also evaluated the effectiveness of these methods.
In recent years, there have been numerous advancements in utilizing convolutional neural networks (CNNs) for automated feature extraction in HAR. Hammerla et al. [26] explored deep neural networks (DNNs), CNNs, and recurrent neural networks (RNNs), conducting empirical evaluations on three publicly available datasets. Their results showed that the CNN-based approach was most suitable for analyzing running and walking activities. In another study, Coelho et al. [27] proposed a HAR system based on CNNs to classify six different activities, including running, walking, walking upstairs and downstairs, standing, and being seated, using accelerometer data. This approach achieved high levels of accuracy and precision, reaching 94.89% and 95.78%, respectively. Additionally, Lee et al. [28] introduced an approach for HAR that employed a one-dimensional CNN and utilized three-axis accelerometer data from mobile devices. The use of DL models in HAR has shown promising results, as they are capable of classifying a wide range of human activities, particularly in complex scenarios. In line with this, the ResNeXt model proposed in this study was specifically designed with CNN-based components to enhance its effectiveness in recognizing and categorizing various human activities.

2.4. Available HAR Datasets

Datasets incorporating stretch sensor data in the field of HAR are relatively rare, and the range of behaviors covered by such datasets is limited. However, this subject remains compelling due to the integration of stretch sensors in modern gadgets [29]. In situations where other HAR sensors are unavailable, stretch sensors can operate independently. Furthermore, it is possible to enhance the accuracy of comprehension outcomes by combining the aforementioned HAR sensors with other sensors, presenting an additional approach.
The IS-Data dataset, introduced in publication [14], was obtained through self-collection using a six-axis inertial sensor and a stretch sensor. In this study, six individuals had two stretch sensors installed on their knees while wearing knee protectors to ensure proper placement on the central region of the kneecap. Additionally, the researchers attached three six-axis inertial sensors to the wrist, hips, and ankle joint. These sensors utilized Bluetooth Low Energy (BLE) technology and the BLE protocol to gather data, which were then transferred to a smartphone and saved in a document. The accelerometer and gyroscope output data were configured with a dynamic range of ±8 g and ±2000 dps. Both types of sensors had a sampling frequency of 50 Hz. Following this setup, a cohort of six mature individuals, with an average age of 26 years, wore the aforementioned sensors and performed six distinct actions: strolling, sitting, standing, stepping in location, running in location, and leaping. Unfortunately, the IS-Data dataset is not publicly accessible.
Washington State University has made available the w-HAR dataset [30], which serves as an additional existing dataset for HAR. In this dataset, an IMU (Inertial Measurement Unit) was attached to the participant’s right ankle, whereas a stretch sensor was sewn onto a knee sleeve. The study involved a sample of 22 participants, aged between 20 and 45 years, consisting of 14 males and 8 females. These participants were instructed to perform eight distinct actions, including leaping, lying down, sitting down, strolling downstairs and upstairs, walking, standing, and transitions among actions. The data collected from the IMU sensors included acceleration and angular velocity, and were sampled at a frequency of 250 Hz. The stretch sensor data, on the other hand, were sampled at a frequency of 25 Hz. The w-HAR dataset was exclusively used in the current investigation due to its public accessibility for research purposes.

3. Sensor-Based HAR Framework

The framework used in this work for sensor-based human activity recognition involves four main processes, namely data acquisition, data preprocessing, model training, and evaluation. This is illustrated in Figure 1.

3.1. w-HAR Dataset

The dataset known as w-HAR [30] includes information from wearable sensors, specifically the Invensense-9250 IMU and stretch sensors, collected from 22 individuals (14 men and 8 women) while they performed seven different movements (Jump, Lie down, Sit, Stairs down, Stairs up, Stand, Walk). The dataset also includes labels for transitions between activities. The data are divided into seven channels, with six channels ( A x , A y , A z , G x , G y , G z ) from the IMU on the right ankle and one channel (Stretch value) from the stretch sensor on the right knee. The IMU data were collected at a frequency of 250 Hz while the stretch sensor data were collected at 25 Hz. The researchers used all six channels from the IMU, which consists of a tri-axial accelerometer and a tri-axial gyroscope, as the focus of their study was on designing low-power wearable devices for locomotion activities. Figure 2 displays certain instances of the accelerometer’s inertial data, whereas Figure 3 presents selected samples of the gyroscope’s inertial data. Figure 4 illustrates some examples of the stretch data.
The visual representation depicted in Figure 2 illustrates exemplary signal visuals obtained from an accelerometer sensor. These visuals capture the values along the x, y, and z axes over a specific time span for each action recorded in the w-HAR dataset. The data reveal that static actions like sitting, standing, and lying down are characterized by significantly lower values on all three axes (x, y, and z). In contrast, locomotive actions such as walking, ascending stairs, and descending stairs exhibit a more pronounced periodic pattern. It is important to note that when individuals climb stairs, they may introduce variations in their pace or take breaks, leading to different periods of rest. Consequently, the acceleration profile during stair ascent may vary depending on factors like fatigue or individual preferences. Similar to ascending stairs, the acceleration pattern during stair descent follows a cyclic pattern but with a shorter duration. Finally, the act of jumping requires greater exertion and muscular force compared to locomotive activities, as it involves intensified contractions in the relevant muscles.
Figure 3 showcases sample signal visuals representing the x, y, and z axes information captured by a gyroscope sensor over a specific time period for each action recorded in the w-HAR dataset. The gyroscope is employed to measure the angular velocity of a wearable electronic device, which can be visualized along the x, y, and z axes. The velocity data are measured in radians per second (rad/s). Noteworthy patterns emerge for different activities. The patterns observed in the accelerometer data differ from those observed in the previous context. During the jumping action, there is increased variability in the initial transitional phase, followed by convergence towards a zero value. In contrast, static actions like sitting, standing, and lying down exhibit negligible angular velocity values across all three axes, indicating that the sensor remains stationary and does not undergo rotational movement. Therefore, it may be challenging to differentiate between static actions when provided with only a limited gyroscope message. In the case of locomotive actions such as walking and ascending and descending stairs, the gyroscope data demonstrate greater periodicity compared to the accelerometer data. The synchronization of the three axes is improved.
Figure 4 showcases sample signal visuals depicting the stretch capacitance measurements obtained from a stretch sensor over a specific time period for seven operations recorded in the w-HAR dataset. The data captured by the stretch sensor reveal periodic patterns that align with locomotive actions, including walking, ascending stairs, and descending stairs. On the other hand, the accelerometer data exhibit smooth trends for static actions such as sitting, standing, and lying down.

3.2. Data Preprocessing

To preprocess the raw sensor data, two steps were taken: noise removal and data normalization. The preprocessing procedure commenced with denoising and smoothing. Raw data underwent filtering via a moving average filter with a window length of eight samples to achieve a smoother output. The filtered data were then normalized using the min–max normalization method to minimize the influence of any anomalous samples. When sensor-based systems are utilized in real-world environments, it becomes essential to dynamically segment the sensor data streams. This segmentation enables the extraction of relevant features and facilitates accurate recognition of ongoing activities [31]. Subsequently, the normalized data were segmented utilizing fixed-width sliding windows spanning 2 s and with an overlapping ratio of 50%.

3.3. The ResNeXt Model

In theory, the performance of a DL model should improve as the number of layers in its network increases. However, in practice, increasing the number of layers can lead to problems such as the gradient disappearing or exploding, which ultimately results in poor recognition performance. Despite this, the ResNeXt structure is designed in a way that allows it to improve accuracy without making the model more complex in terms of parameters. This is achieved by stacking blocks of the same topology in parallel, which is different from the three-layer convolution block of the original ResNet. This modification leads to improved accuracy without significantly increasing the parameter count, and also reduces the number of hyperparameters due to the same topology. As a result, the ResNeXt structure is convenient for model porting. Figure 5 demonstrates the effectiveness of this approach.
In order to enhance the performance of the ResNeXt network model and identify the most distinctive features, an attention mechanism has been incorporated into the model. This mechanism helps to uncover the relationships between features by assigning greater importance to certain features during the feature assembly process. The attention mechanism is a popular technique used in DL and is frequently employed in a range of applications including speech recognition, image recognition, and natural language processing. By assigning higher weights to specific features, the network parameters are reduced while the discriminative capability of the features is enhanced.
The ResNeXt network, which is suggested in this paper, is a complete DL model that is constructed using convolutional blocks and multi-kernel residual blocks with a deep residual structure. The overall design of this proposed model is illustrated in Figure 5.
The ResNeXt model uses convolutional blocks (ConvB) to capture low-level characteristics from raw sensor data. ConvB consists of four layers: 1D-convolutional (Conv1D), batch normalization (BN), exponential linear unit (ELU), and max-pooling (MP), which are illustrated in Figure 5. The Conv1D layer employs multiple trainable convolutional kernels to extract specific features, resulting in a feature map for each kernel. To facilitate and stabilize the training process, the BN layer is utilized. The ELU layer is employed to improve the expressiveness of the model. The MP layer is utilized to compress the feature map while preserving its most important elements. The multi-kernel Blocks (MK) incorporate convolutional kernels of various sizes (1 × 3, 1 × 5, and 1 × 7) and have three components. To decrease the complexity of the proposed network and the number of parameters, each component uses 1 × 1 convolutions while employing these kernels.
The Global Average Pooling (GAP) algorithm and flattened layers are used to convert the averages of each feature map into a 1D vector in the classification block. The outcome of the fully connected layer is then transformed into probabilities using the Softmax function. The cross-entropy loss function, which is commonly used in classification tasks, is employed to calculate the network’s losses.
The comprehensive hyperparameters of the proposed ResNeXt network can be found in Table 1.

3.4. Cross-Validation

The k-fold cross-validation (k-CV) technique involves calculating multiple hold-out estimators that correspond to different data partitions and then averaging them [32]. This methodology entails dividing a dataset, derived from either one or multiple individuals, into k distinct and non-overlapping subsets of approximately equal sizes. Each subset is then used to evaluate the performance of a classification model generated from the remaining k 1 subsets. The average effectiveness is subsequently calculated by averaging the performance indicators, including accuracy, precision, recall, and F-measure, obtained from k-CV [33]. However, one potential limitation of this approach is its computational burden, especially when dealing with large sample sizes and high values of k. In this study, we employ the k-CV technique to assess the effectiveness of the models. Specifically, a value of k = 10 is chosen, as depicted in Figure 6.

3.5. Performance Measurement

In order to assess how well the DL model being suggested performs, four commonly used evaluation measures, namely accuracy, precision, recall, and F-measure, are computed during a 10-CV process. The mathematical equations for these four metrics are provided below:
A c c u r a c y = T P + T N T P + T N + F P + F N
P r e c i s i o n = T P T P + F P
R e c a l l = T P T P + F N
F - m e a s u r e = 2 × P r e c i s i o n × R e c a l l P r e c i s i o n + R e c a l l
The four evaluation metrics discussed here are the most commonly used indicators of S-HAR’s performance. Recognition is defined as correctly identifying the considered class as a true positive (TP) and correctly identifying all other classes as true negatives (TN). Misclassifying sensor data from one class as belonging to another creates a false positive (FP) recognition of that class, whereas misclassifying activity sensor data from another class as belonging to the considered class creates a false negative (FN) recognition of that class.

4. Experimental Results

This section outlines the experimental setup and presents the results of the experiments conducted to evaluate the efficacy of the proposed model for low-power HAR using data from accelerometers and gyroscopes.

4.1. Experimental Setting

All the experiments conducted in this study are performed on the Google Colab Pro platform, utilizing a Tesla-V100 GPU. The programming language used is Python and the libraries used include TensorFlow, Keras, Scikit-Learn, Numpy, and Pandas. The proposed ResNeXt model is evaluated and compared to baseline DL neural networks in the conducted experiments.
To investigate the benefits of utilizing both inertial and stretch sensor data for S-HAR, three different scenarios were explored in this study. Five DL models, namely CNN, long short-term memory (LSTM), bidirectional LSTM (BiLSTM), gated recurrent unit (GRU), and bidirectional GRU (BiGRU), were trained and tested using different sets of data in each scenario. The proposed ResNeXt model was also included in these experiments, as outlined in Table 2.

4.2. Experimental Results

The data used in this study were generated using a 5-fold CV protocol. A series of experiments were conducted to assess the recognition performance of both the baseline DL models and the proposed ResNeXt model. The recognition performance was evaluated using various metrics, such as accuracy, precision, recall, and F-measure, and the results are presented in Table 3, Table 4 and Table 5.
The experimental results presented in Table 3, Table 4 and Table 5 demonstrate that the ResNeXt model performs better than other DL models in all experimental scenarios. Table 5 specifically shows that combining inertial and stretch sensors improves recognition performance, resulting in the highest accuracy of 97.68% and the highest F1-measure of 95.87%.
Figure 7, Figure 8 and Figure 9 present the confusion matrices of the ResNeXt model on the w-HAR dataset. The results reveal that the inertial sensor has high misclassification rates for sit and stand activities. On the other hand, using only stretch data leads to confusion between dynamic activities such as jumping and walking. Nonetheless, training the ResNeXt model with both inertial and stretch sensor data reduces the level of confusion.

5. Discussion

5.1. Comparison with Baseline Models

Figure 10 shows a box plot visualization to compare results of median accuracy of DL models and the proposed ResNeXt model on the w-HAR dataset. The median accuracy results obtained from Scenario I, which used only the initial sensor data, provided a moderately high median accuracy (around 80–86%) for various DL models, including the proposed ResNeXt model. However, in Scenario II, where the experiment was employed with stretch sensor data, it was found that the median accuracy of all DL models increased significantly. Additionally, when both the initial sensor and stretch sensor were utilized for activity recognition, it was observed that the highest accuracy was achieved among all the models. Specifically, the proposed model delivered the highest median accuracy of 97.65%.
Therefore, based on this case, using data from both initial and stretch sensors can enhance activity recognition with the highest median accuracy. This differs from utilizing data solely from one sensor independently. Including the proposed model, it can provide the highest median accuracy in every scenario.
All scenario comparison results of the median F-measure of DL models and the proposed ResNeXt model on the w-HAR dataset are shown in Figure 11. The trend suggests that the obtained results will be similar to the accuracy results. Using data from both the initial sensor and the stretch sensor, the median F-measure value is higher than using only a single sensor. In addition, the experiment found that using data from the stretch sensor provides better recognition of various human activities than using the initial sensor. The results from this experiment also indicate that the proposed model achieves the highest median F-measure on the w-HAR dataset, with the highest values in all three scenarios.

5.2. Comparison Results with State-of-the-Art Methods

To demonstrate the effectiveness of our proposed ResNeXt model, we conducted a thorough comparison with state-of-the-art DL models in the field of HAR using inertial and stretch sensor data. Firstly, we evaluated the neural network with the design space exploration (NN-DSE) model [30]. Secondly, we considered the Two-Channel Residual-GRU-ECA (TCR-GRU-ECA) model [14], which combines residual blocks, efficient channel attention (ECA), and the GRU. Lastly, we examined the CNN-BiLSTM model [34], a hybrid architecture that utilizes convolutional layers and BiLSTM units to extract informative features automatically.
To ensure a fair comparison of recognition performances, we conducted experiments on the same w-HAR dataset. The dataset was divided into a training set (70%) and a validation set (30%). The results of our comparative analysis are summarized in Table 6. Notably, our proposed model achieved superior F-measure values compared to the state-of-the-art models.

5.3. Ablation Studies

The ablation study is primarily used in the context of neural networks [35]. It refers to observing a model’s performance by systematically modifying specific components [36]. In this regard, we conducted an investigation into the effects of ablation on our proposed model, considering three distinct study cases. By modifying various blocks and layers, we aimed to evaluate their impact within the proposed architecture [37]. Upon completing all the study cases, we identified the best-performing configuration of our proposed ResNeXt model, which exhibited the highest recognition performances.

5.3.1. Effect of Multi-Kernel Blocks

To assess the effects of integrating multi-kernel blocks on the model’s performance, we performed ablation experiments on the w-HAR dataset. These experiments involved the use of inertial and stretch sensor data. Our goal was to examine the influence of incorporating multi-kernel blocks on the overall performance of the model.
For this experiment, we employed a baseline architecture of a simple CNN without multi-kernel blocks. The results of this experiment can be found in Table 7. The CNN exhibited the lowest recognition performance, possibly due to information leakage hindering the seamless capture of spatial relationships. On the other hand, we achieved improved performance by incorporating multi-kernel blocks into the model. With the w-HAR dataset, the F-measure increased from 90.06% to 95.87%.

5.3.2. Effect of the Convolutional Block

To assess the efficacy of the convolutional block in capturing spatial features in time series, we conducted an additional ablation experiment on our proposed ResNeXt model. In this experiment, we utilized a modified ResNeXt architecture without a convolutional block as the baseline. The outcomes of this experiment are presented in Table 8. Notably, the proposed ResNeXt model, which incorporated the convolutional block, showcased superior recognition performance, yielding an increase in F-measure of approximately 0.36%.

5.3.3. Effect of the GAP Layer

In this study, the proposed ResNeXt model incorporates a GAP layer instead of a flatten layer to establish a connection between the feature maps from the multi-kernel blocks and the final classification output. To assess the effectiveness of the GAP layer, we conducted an ablation experiment using a modified ResNeXt model that employs a flatten layer as the baseline. The results of the ablation experiment, displayed in Table 9, illustrate that the proposed ResNeXt model, utilizing the GAP layer, achieves significantly better recognition performance, with an increase in F-measure of approximately 9.64%.
In summary, the ResNeXt model utilizes a combination of convolutional blocks, multi-kernel blocks, and a GAP layer to extract optimal features from the inertial and stretch sensor data. This approach effectively enhances the clarity and coherence of the extracted features.

5.3.4. Computational Complexity

Based on ablation studies, the proposed ResNeXt model demonstrates superior overall effectiveness. To assess the efficiency of the models, their complexity is evaluated by comparing their mean prediction times. This evaluation is performed by feeding a collection of test data samples into the Tensorflow Lite models and calculating the resulting mean prediction time. The mean prediction times are then compared in Table 10 for further analysis and comparison.
Table 10 presents the results of the experiment, displaying the mean prediction time in seconds required to process a single window of the DL models on the w-HAR dataset. The comparative analysis reveals variations in mean prediction times due to the inclusion of convolutional blocks and multi-kernel blocks. Notably, the multi-kernel blocks necessitate more computational time compared to the convolutional blocks. The proposed ResNeXt model showcases a mean prediction time of 1.1567 ms, demonstrating its efficiency in processing the dataset.

5.4. Explainability

In this section, on explainability, we examine the outcomes achieved using the proposed ResNeXt network on the w-HAR dataset. We utilize the suggested T-distributed Stochastic Neighbor Embedding (t-SNE) visualization to analyze the learned features. The results are carefully analyzed and interpreted to highlight the effectiveness of t-SNE in detecting bias issues and identifying mislabeled samples [38]. t-SNE is a highly powerful method for reducing dimensionality, particularly for visualization purposes. It allows the projection of information onto low-dimensional regions, making it suitable for large datasets [39]. The visualization also demonstrates ResNeXt’s ability to generalize and distinguish between different activities, as well as its limitations when applied to various sensor data.
To assess the performance of the ResNeXt model being considered, we utilized t-SNE plots to evaluate its ability to generalize and accurately represent data in a high-dimensional feature space. The practical implications of employing t-SNE were demonstrated in Figure 12, where a well-distributed example set is depicted, with examples of the same class clustered together. In contrast, Figure 13 showed the sample prior to applying t-SNE, revealing a cluttered and intricate arrangement that poses challenges for identification. The effectiveness of the recommended ResNeXt model in segregating the feature dimension was demonstrated by the clear and distinct boundaries observed among each category. Moreover, Figure 14 showed the t-SNE visualization of the proposed ResNeXt model that was modified by removing some modules.
To gain further insights, we utilized t-SNE plots to visualize the proposed ResNeXt model based on ablation studies. Specifically, we investigated the effects of removing the convolutional block and multi-kernel blocks. The visualization revealed that the multi-kernel blocks play a crucial role in the exceptional performance of the proposed ResNeXt model.
Our explainability studies have revealed several key insights. Firstly, we found that the combination of inertial and stretch sensor data can significantly enhance recognition performance. This highlights the importance of leveraging both types of sensors in the proposed approach. Secondly, our analysis demonstrates that the superior performance of the proposed ResNeXt model can be attributed to the inclusion of multi-kernel blocks. These blocks play a crucial role in achieving better results.

5.5. Limitation

This article’s research is subject to a particular limitation. Specifically, the DL algorithms employed in this study were trained and tested using laboratory data. It is worth noting that previous studies have indicated that the performance of learning algorithms may not accurately reflect real-life performance under laboratory conditions [40]. Given this limitation, future work will focus on addressing this concern by collecting a new HAR dataset. This new dataset aims to provide more generalized and robust results for the classification model. To achieve this, the dataset will include inertial and stretch data, as well as data from other low-energy sensors. Additionally, it will encompass a wide range of simple and complex activities, various sampling frequencies, diverse sensor types, and different sensor localizations.

6. Conclusions and Future Works

This study examines the practicality of utilizing DL algorithms and the proposed ResNeXt model to recognize human activity with stretch sensors, either alone or in combination with inertial sensors. The results indicate that stretch sensors are more effective in identifying activities that involve human joints than inertial sensors. Furthermore, the outcomes of this experiment demonstrate that the suggested model attains the utmost accuracy and F-measure on the w-HAR dataset, demonstrating the highest values across all three scenarios. By combining both types of sensors, not only can wearable sensors be more comfortable and versatile, but recognition accuracy can also be improved.
Future research could involve testing the proposed DL models with datasets of varying sliding window sizes to extract different human activity patterns. Improvements in performance could be achieved by developing more sophisticated and efficient lightweight DL networks and innovative data representations using time-frequency analysis.

Author Contributions

Conceptualization, S.M. and A.J.; methodology, S.M.; software, A.J.; validation, A.J.; formal analysis, S.M.; investigation, S.M.; resources, A.J.; data curation, A.J.; writing—original draft preparation, S.M.; writing—review and editing, A.J.; visualization, S.M.; supervision, A.J.; project administration, A.J.; funding acquisition, S.M. and A.J. All authors have read and agreed to the published version of the manuscript.

Funding

This research was funded by Thailand Science Research and Innovation Fund; University of Phayao (Grant No. FF66-UoE001); National Science, Research and Innovation Fund (NSRF); and King Mongkut’s University of Technology North Bangkok with Contract no. KMUTNB-FF-66-07.

Institutional Review Board Statement

Not applicable.

Informed Consent Statement

Not applicable.

Data Availability Statement

All data were presented in the main text.

Conflicts of Interest

The authors declare no conflict of interest.

References

  1. Gu, F.; Chung, M.H.; Chignell, M.; Valaee, S.; Zhou, B.; Liu, X. A Survey on Deep Learning for Human Activity Recognition. ACM Comput. Surv. 2021, 54, 177. [Google Scholar] [CrossRef]
  2. Zhang, S.; Li, Y.; Zhang, S.; Shahabi, F.; Xia, S.; Deng, Y.; Alshurafa, N. Deep Learning in Human Activity Recognition with Wearable Sensors: A Review on Advances. Sensors 2022, 22, 1476. [Google Scholar] [CrossRef]
  3. Nweke, H.F.; Wah, T.Y.; Mujtaba, G.; Al-garadi, M.A. Data fusion and multiple classifier systems for human activity detection and health monitoring: Review and open research directions. Inf. Fusion 2019, 46, 147–170. [Google Scholar] [CrossRef]
  4. Yadav, S.K.; Tiwari, K.; Pandey, H.M.; Akbar, S.A. A review of multimodal human activity recognition with special emphasis on classification, applications, challenges and future directions. Knowl.-Based Syst. 2021, 223, 106970. [Google Scholar] [CrossRef]
  5. Ramanujam, E.; Perumal, T.; Padmavathi, S. Human Activity Recognition With Smartphone and Wearable Sensors Using Deep Learning Techniques: A Review. IEEE Sens. J. 2021, 21, 13029–13040. [Google Scholar] [CrossRef]
  6. Sanchez-Caballero, A.; Fuentes-Jimenez, D.; Losada-Gutiérrez, C. Real-time human action recognition using raw depth video-based recurrent neural networks. Multimed. Tools Appl. 2022, 82, 1–23. [Google Scholar] [CrossRef]
  7. Chung, S.; Lim, J.; Noh, K.J.; Kim, G.; Jeong, H. Sensor Data Acquisition and Multimodal Sensor Fusion for Human Activity Recognition Using Deep Learning. Sensors 2019, 19, 1716. [Google Scholar] [CrossRef] [Green Version]
  8. Issa, M.E.; Helmi, A.M.; Al-Qaness, M.A.A.; Dahou, A.; Abd Elaziz, M.; Damaševičius, R. Human Activity Recognition Based on Embedded Sensor Data Fusion for the Internet of Healthcare Things. Healthcare 2022, 10, 1084. [Google Scholar] [CrossRef]
  9. Zahin, A.; Tan, L.T.; Hu, R.Q. Sensor-Based Human Activity Recognition for Smart Healthcare: A Semi-supervised Machine Learning. In Artificial Intelligence for Communications and Networks; Springer: Cham, Switerland, 2019; pp. 450–472. [Google Scholar]
  10. Zhang, Y.; Tian, G.; Zhang, S.; Li, C. A Knowledge-Based Approach for Multiagent Collaboration in Smart Home: From Activity Recognition to Guidance Service. IEEE Trans. Instrum. Meas. 2020, 69, 317–329. [Google Scholar] [CrossRef]
  11. Sousa Lima, W.; Souto, E.; El-Khatib, K.; Jalali, R.; Gama, J. Human Activity Recognition Using Inertial Sensors in a Smartphone: An Overview. Sensors 2019, 19, 3213. [Google Scholar] [CrossRef] [Green Version]
  12. Yunas, S.U.; Ozanyan, K.B. Gait Activity Classification Using Multi-Modality Sensor Fusion: A Deep Learning Approach. IEEE Sens. J. 2021, 21, 16870–16879. [Google Scholar] [CrossRef]
  13. Yin, W.; Reddy, C.; Zhou, Y.; Zhang, X. A Novel Application of Flexible Inertial Sensors for Ambulatory Measurement of Gait Kinematics. IEEE Trans. Hum.-Mach. Syst. 2021, 51, 346–354. [Google Scholar] [CrossRef]
  14. Wang, X.; Shang, J. Human Activity Recognition Based on Two-Channel Residual–GRU–ECA Module with Two Types of Sensors. Electronics 2023, 12, 1622. [Google Scholar] [CrossRef]
  15. Hoai Thu, N.T.; Han, D.S. An Investigation on Deep Learning-Based Activity Recognition Using IMUs and Stretch Sensors. In Proceedings of the 2022 International Conference on Artificial Intelligence in Information and Communication (ICAIIC), Jeju Island, Republic of Korea, 21–24 February 2022; pp. 377–382. [Google Scholar] [CrossRef]
  16. Li, F.; Shirahama, K.; Nisar, M.A.; Köping, L.; Grzegorzek, M. Comparison of Feature Learning Methods for Human Activity Recognition Using Wearable Sensors. Sensors 2018, 18, 679. [Google Scholar] [CrossRef] [Green Version]
  17. Wang, J.; Chen, Y.; Hao, S.; Peng, X.; Hu, L. Deep learning for sensor-based activity recognition: A survey. Pattern Recognit. Lett. 2019, 119, 3–11. [Google Scholar] [CrossRef] [Green Version]
  18. Chen, L.; Hoey, J.; Nugent, C.D.; Cook, D.J.; Yu, Z. Sensor-Based Activity Recognition. IEEE Trans. Syst. Man Cybern. Part C (Appl. Rev.) 2012, 42, 790–808. [Google Scholar] [CrossRef]
  19. Vepakomma, P.; De, D.; Das, S.K.; Bhansali, S. A-Wristocracy: Deep learning on wrist-worn sensing for recognition of user complex activities. In Proceedings of the 2015 IEEE 12th International Conference on Wearable and Implantable Body Sensor Networks (BSN), Cambridge, MA, USA, 9–12 June 2015; pp. 1–6. [Google Scholar] [CrossRef]
  20. Gómez-Carmona, O.; Casado-Mansilla, D.; Kraemer, F.A.; de Ipiña, D.L.; García-Zubia, J. Exploring the computational cost of machine learning at the edge for human-centric Internet of Things. Future Gener. Comput. Syst. 2020, 112, 670–683. [Google Scholar] [CrossRef]
  21. Han, C.; Zhang, L.; Tang, Y.; Huang, W.; Min, F.; He, J. Human activity recognition using wearable sensors by heterogeneous convolutional neural networks. Expert Syst. Appl. 2022, 198, 116764. [Google Scholar] [CrossRef]
  22. Margarito, J.; Helaoui, R.; Bianchi, A.M.; Sartor, F.; Bonomi, A.G. User-Independent Recognition of Sports Activities from a Single Wrist-Worn Accelerometer: A Template-Matching-Based Approach. IEEE Trans. Biomed. Eng. 2016, 63, 788–796. [Google Scholar] [CrossRef]
  23. Tan, T.H.; Wu, J.Y.; Liu, S.H.; Gochoo, M. Human Activity Recognition Using an Ensemble Learning Algorithm with Smartphone Sensor Data. Electronics 2022, 11, 322. [Google Scholar] [CrossRef]
  24. Qin, Z.; Zhang, Y.; Meng, S.; Qin, Z.; Choo, K.K.R. Imaging and fusing time series for wearable sensor-based human activity recognition. Inf. Fusion 2020, 53, 80–87. [Google Scholar] [CrossRef]
  25. Cha, Y.; Kim, H.; Kim, D. Flexible Piezoelectric Sensor-Based Gait Recognition. Sensors 2018, 18, 468. [Google Scholar] [CrossRef] [PubMed] [Green Version]
  26. Hammerla, N.Y.; Halloran, S.; Plötz, T. Deep, Convolutional, and Recurrent Models for Human Activity Recognition Using Wearables. In Proceedings of the Twenty-Fifth International Joint Conference on Artificial Intelligence, IJCAI’16, New York, NY, USA, 9–15 July 2016; AAAI Press: Washington, DC, USA, 2016; pp. 1533–1540. [Google Scholar]
  27. Coelho, Y.; Rangel, L.; dos Santos, F.; Frizera-Neto, A.; Bastos-Filho, T. Human Activity Recognition Based on Convolutional Neural Network. In Proceedings of the XXVI Brazilian Congress on Biomedical Engineering, Rio de Janeiro, Brazil, 21–25 October 2018; pp. 247–252. [Google Scholar]
  28. Lee, S.M.; Yoon, S.M.; Cho, H. Human activity recognition from accelerometer data using Convolutional Neural Network. In Proceedings of the 2017 IEEE International Conference on Big Data and Smart Computing (BigComp), Jeju, Republic of Korea, 13–16 February 2017; pp. 131–134. [Google Scholar] [CrossRef]
  29. Chander, H.; Burch, R.F.; Talegaonkar, P.; Saucier, D.; Luczak, T.; Ball, J.E.; Turner, A.; Kodithuwakku Arachchige, S.N.K.; Carroll, W.; Smith, B.K.; et al. Wearable Stretch Sensors for Human Movement Monitoring and Fall Detection in Ergonomics. Int. J. Environ. Res. Public Health 2020, 17, 3554. [Google Scholar] [CrossRef] [PubMed]
  30. Bhat, G.; Tran, N.; Shill, H.; Ogras, U.Y. w-HAR: An Activity Recognition Dataset and Framework Using Low-Power Wearable Devices. Sensors 2020, 20, 5356. [Google Scholar] [CrossRef]
  31. Bermejo, U.; Almeida, A.; Bilbao-Jayo, A.; Azkune, G. Embedding-based real-time change point detection with application to activity segmentation in smart home time series data. Expert Syst. Appl. 2021, 185, 115641. [Google Scholar] [CrossRef]
  32. Wong, T.T. Performance evaluation of classification algorithms by k-fold and leave-one-out cross validation. Pattern Recognit. 2015, 48, 2839–2846. [Google Scholar] [CrossRef]
  33. Bragança, H.; Colonna, J.G.; Oliveira, H.A.B.F.; Souto, E. How Validation Methodology Influences Human Activity Recognition Mobile Systems. Sensors 2022, 22, 2360. [Google Scholar] [CrossRef]
  34. Nafea, O.; Abdul, W.; Muhammad, G.; Alsulaiman, M. Sensor-Based Human Activity Recognition with Spatio-Temporal Deep Learning. Sensors 2021, 21, 2141. [Google Scholar] [CrossRef]
  35. Montaha, S.; Azam, S.; Rafid, A.K.M.R.H.; Ghosh, P.; Hasan, M.Z.; Jonkman, M.; De Boer, F. BreastNet18: A High Accuracy Fine-Tuned VGG16 Model Evaluated Using Ablation Study for Diagnosing Breast Cancer from Enhanced Mammography Images. Biology 2021, 10, 1347. [Google Scholar] [CrossRef]
  36. de Vente, C.; Boulogne, L.H.; Venkadesh, K.V.; Sital, C.; Lessmann, N.; Jacobs, C.; Sánchez, C.I.; van Ginneken, B. Improving Automated COVID-19 Grading with Convolutional Neural Networks in Computed Tomography Scans: An Ablation Study. arXiv 2020, arXiv:2009.09725. [Google Scholar]
  37. Meyes, R.; Lu, M.; de Puiseau, C.W.; Meisen, T. Ablation Studies in Artificial Neural Networks. arXiv 2019, arXiv:1901.08644. [Google Scholar]
  38. Aquino, G.; Costa, M.G.F.; Filho, C.F.F.C. Explaining and Visualizing Embeddings of One-Dimensional Convolutional Models in Human Activity Recognition Tasks. Sensors 2023, 23, 4409. [Google Scholar] [CrossRef] [PubMed]
  39. Cai, T.T.; Ma, R. Theoretical Foundations of t-SNE for Visualizing High-Dimensional Clustered Data. J. Mach. Learn. Res. 2022, 23, 13581–13634. [Google Scholar]
  40. Gyllensten, I.C.; Bonomi, A.G. Identifying Types of Physical Activity with a Single Accelerometer: Evaluating Laboratory-trained Algorithms in Daily Life. IEEE Trans. Biomed. Eng. 2011, 58, 2656–2663. [Google Scholar] [CrossRef]
Figure 1. The HAR framework based on IMU and stretch sensors used in this work.
Computers 12 00141 g001
Figure 2. Some accelerometer samples of inertial data from the w-HAR dataset.
Computers 12 00141 g002
Figure 3. Some gyroscope samples of inertial data from the w-HAR dataset.
Computers 12 00141 g003
Figure 4. Some samples of stretch data from the w-HAR dataset.
Computers 12 00141 g004
Figure 5. The ResNeXt architecture used in this work.
Computers 12 00141 g005
Figure 6. 10-fold cross-validation.
Computers 12 00141 g006
Figure 7. The confusion matrix of the proposed ResNeXt model trained using inertial sensor data.
Computers 12 00141 g007
Figure 8. The confusion matrix of the proposed ResNeXt model trained using stretch sensor data.
Computers 12 00141 g008
Figure 9. The confusion matrix of the proposed ResNeXt model trained using inertial and stretch sensor data.
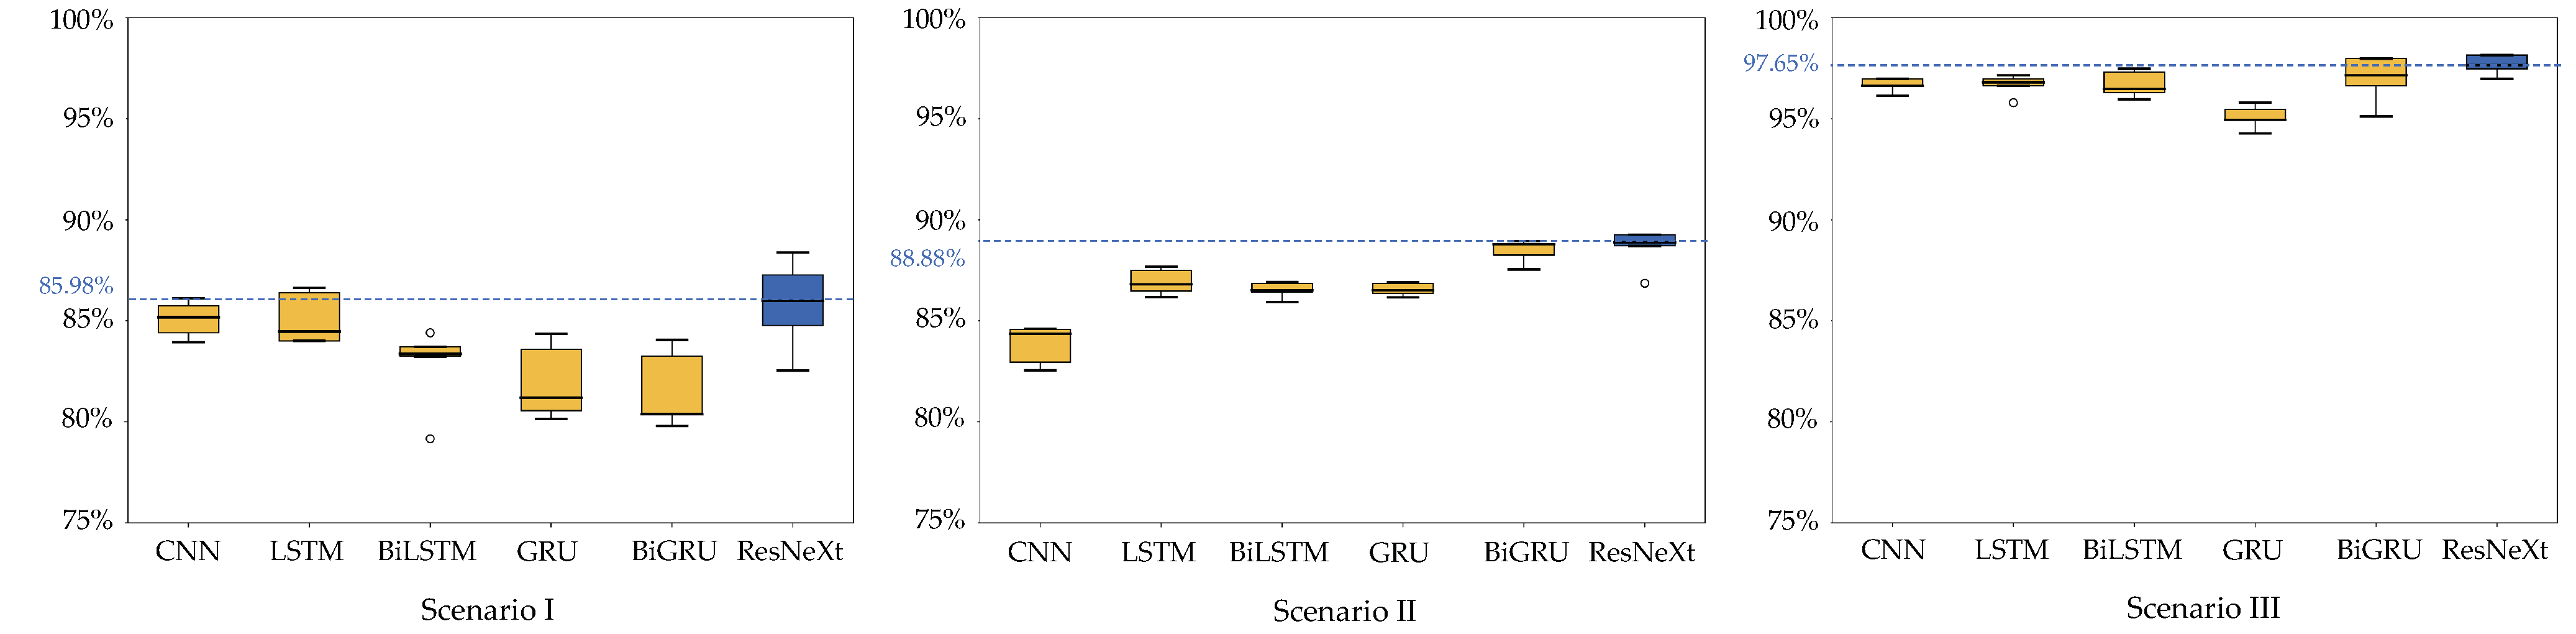
Computers 12 00141 g009
Figure 10. All scenario comparison results of the median accuracy of DL models and the proposed ResNeXt model on the w-HAR dataset.
Computers 12 00141 g010
Figure 11. All scenario comparison results of the median F-measure of DL models and the proposed ResNeXt model on the w-HAR dataset.
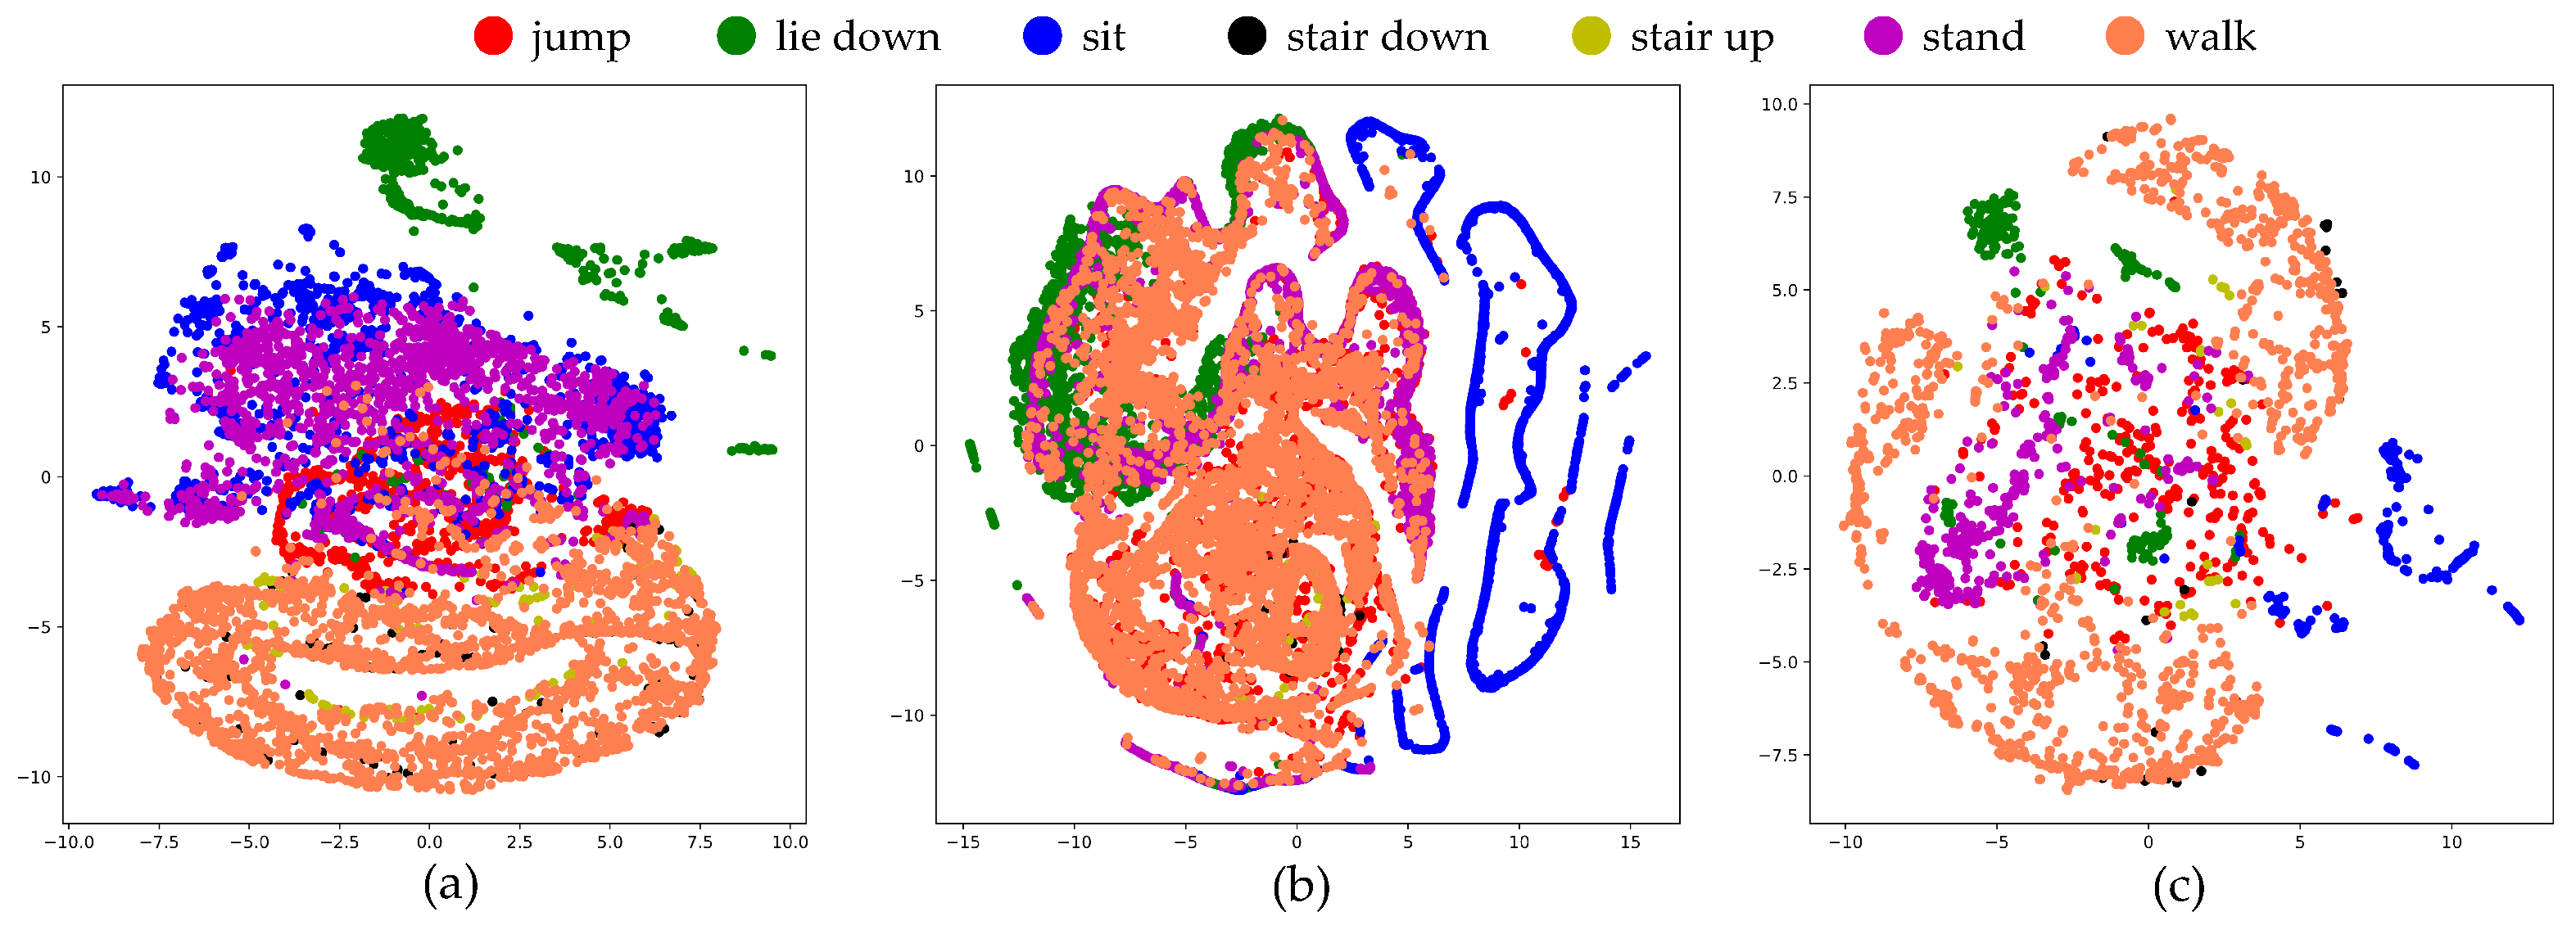
Computers 12 00141 g011
Figure 12. The t-SNE visualization of the testing data in two dimensions, prior to training the proposed ResNeXt model with various sensor data types: (a) motion sensor, (b) stretch sensor, and (c) a combination of motion and stretch sensors.
Computers 12 00141 g012
Figure 13. A two-dimensional t-SNE visualization of the testing data following the acquisition of representations by the proposed ResNeXt model, employing different sensor data types: (a) motion sensor, (b) stretch sensor, and (c) a combination of motion and stretch sensors.
Computers 12 00141 g013
Figure 14. A two-dimensional t-SNE visualization of the testing data following the acquisition of representations by the proposed ResNeXt model that was modified by removing some modules: (a) ResNeXt without the multi-kernel blocks, (b) ResNeXt without the convolutional block, and (c) the proposed ResNeXt.
Computers 12 00141 g014
Table 1. The summary of hyperparameters of the ResNeXt used in this work.
StageHyperparametersValues
Convolutional blockConvolutional Block
Multi-kernel block × 3Conv1DKernel Size5
Filters64
Batch Normalization -
Activation ReLU
Max Pooling 2
Branch-1-1
Conv1DKernel Size1
Filters16
Conv1DKernel Size3
Filters16
Branch-1-2
Conv1DKernel Size1
Filters16
Conv1DKernel Size5
Filters16
Branch-1-3
Conv1DKernel Size1
Filters16
Conv1DKernel Size7
Filters16
Branch-1
Conv1DKernel Size1
Stride1
Filters64
Branch-2
Conv1DKernel Size1
Stride1
Filters64
Classification blockGlobal Average Pooling -
Flatten -
Dense 128
TrainingLoss Function Cross-entropy
Optimizer Adam
Batch Size 64
Number of Epochs 200
Table 2. A list of detailed experiments used in this work.
ScenarioDescription
IOnly inertial sensor data
IIOnly stretch sensor data
IIIInertial and stretch sensor data
Table 3. Recognition effectiveness of baseline DL models and the proposed ResNeXt model from Scenario I.
ModelRecognition Effectiveness
AccuracyLossF-Measure
CNN85.07% (±0.807%)0.37 (±0.023)84.58% (±1.359%)
LSTM82.10% (±6.612%)0.49 (±0.177)77.84% (±16.350%)
BiLSTM82.77% (±1.851%)0.40 (±0.018)81.79% (±4.511%)
GRU81.96% (±1.690%)0.39 (±0.017)81.93% (±2.228%)
BiGRU81.57% (±1.729%)0.41 (±0.040)81.00% (±3.661%)
ResNeXt85.78% (±2.027%)0.35 (±0.027)86.75% (±1.989%)
Table 4. Recognition effectiveness of baseline DL models and the proposed ResNeXt model from Scenario II.
ModelRecognition Effectiveness
AccuracyLossF-Measure
CNN83.80% (±0.876%)0.46 (±0.028)78.30% (±1.282%)
LSTM86.92% (±0.577%)0.43 (±0.011)84.92% (±1.660%)
BiLSTM86.53% (±0.351%)0.40 (±0.014)84.45% (±1.485%)
GRU86.55% (±0.282%)0.39 (±0.010)83.32% (±1.137%)
BiGRU88.47% (±0.520%)0.42 (±0.037)87.19% (±0.710%)
ResNeXt88.59% (±0.896%)0.35 (±0.018)87.61% (±1.450%)
Table 5. Recognition effectiveness of baseline DL models and the proposed ResNeXt model from Scenario III.
ModelRecognition Effectiveness
AccuracyLossF-Measure
CNN96.67% (±0.306%)0.14 (±0.016)90.06% (±2.247%)
LSTM96.67% (±0.470%)0.19 (±0.034)94.16% (±1.464%)
BiLSTM96.70% (±0.590%)0.14 (±0.032)92.98% (±2.437%)
GRU95.09% (±0.516%)0.17 (±0.033)86.24% (±6.100%)
BiGRU96.97% (±1.060%)0.15 (±0.034)94.15% (±3.516%)
ResNeXt97.68% (±0.444%)0.10 (±0.020)95.87% (±0.954%)
Table 6. Results of comparison between the proposed ResNeXt and state-of-the-art models using the w-HAR dataset.
ActivityF1-Measure (%)
NN-DSE [30]TCR-GRU-ECA [14]CNN-BiLSTM [34]The Proposed ResNeXt
Jump94.6%96.7%92.9%96.8%
Lie down99.8%100.0%99.7%100.0%
Sit96.4%99.3%99.1%99.4%
Stair down96.2%94.9%77.2%96.3%
Stair up96.3%87.3%86.5%97.4%
Stand95.1%98.1%97.2%98.7%
Walk94.5%99.1%98.4%99.1%
Table 7. Effects of multi-kernel blocks.
ModelRecognition Effectiveness
AccuracyLossF-Measure
CNN without multi-kernel blocks96.67% (±0.306%)0.14 (±0.016)90.06% (±2.247%)
Our model using multi-kernel blocks97.68% (±0.444%)0.10 (±0.020)95.87% (±0.954%)
Table 8. Effects of the convolutional block.
ModelRecognition Effectiveness
AccuracyLossF-Measure
ResNeXt without the convolutional block97.37% (±0.494%)0.11 (±0.015)95.51% (±0.977%)
Our model using the convolutional block97.68% (±0.444%)0.10 (±0.020)95.87% (±0.954%)
Table 9. Effects of the GAP layer.
ModelRecognition Effectiveness
AccuracyLossF-Measure
ResNeXt using a flatten layer95.86% (±1.424%)0.33 (±0.165)86.23% (±7.032%)
Our model using the GAP layer97.68% (±0.444%)0.10 (±0.020)95.87% (±0.954%)
Table 10. Comparison of mean prediction times obtained from ResNeXt-based models with or without the convolution block and multi-kernel blocks.
Convolutional BlockMulti-Kernel BlockMean Prediction Time (ms)
-0.2250
-0.6581
1.1567
Disclaimer/Publisher’s Note: The statements, opinions and data contained in all publications are solely those of the individual author(s) and contributor(s) and not of MDPI and/or the editor(s). MDPI and/or the editor(s) disclaim responsibility for any injury to people or property resulting from any ideas, methods, instructions or products referred to in the content.

