Article

A Rule-Based Algorithm and Its Specializations for Measuring the Complexity of Software in Educational Digital Environments

by
Artyom V. Gorchakov
*,
Liliya A. Demidova
* and
Peter N. Sovietov
Institute of Information Technologies, Federal State Budget Educational Institution of Higher Education, MIREA—Russian Technological University, 78, Vernadsky Avenue, 119454 Moscow, Russia
*
Authors to whom correspondence should be addressed.
Submission received: 12 February 2024 / Revised: 5 March 2024 / Accepted: 7 March 2024 / Published: 11 March 2024
(This article belongs to the Special Issue Best Practices, Challenges and Opportunities in Software Engineering)

Abstract

:
Modern software systems consist of many software components; the source code of modern software systems is hard to understand and maintain for new developers. Aiming to simplify the readability and understandability of source code, companies that specialize in software development adopt programming standards, software design patterns, and static analyzers with the aim of decreasing the complexity of software. Recent research introduced a number of code metrics allowing the numerical characterization of the maintainability of code snippets. Cyclomatic Complexity (CycC) is one widely used metric for measuring the complexity of software. The value of CycC is equal to the number of decision points in a program plus one. However, CycC does not take into account the nesting levels of the syntactic structures that break the linear control flow in a program. Aiming to resolve this, the Cognitive Complexity (CogC) metric was proposed as a successor to CycC. In this paper, we describe a rule-based algorithm and its specializations for measuring the complexity of programs. We express the CycC and CogC metrics by means of the described algorithm and propose a new complexity metric named Educational Complexity (EduC) for use in educational digital environments. EduC is at least as strict as CycC and CogC are and includes additional checks that are based on definition-use graph analysis of a program. We evaluate the CycC, CogC, and EduC metrics using the source code of programs submitted to a Digital Teaching Assistant (DTA) system that automates a university programming course. The obtained results confirm that EduC rejects more overcomplicated and difficult-to-understand programs in solving unique programming exercises generated by the DTA system when compared to CycC and CogC.

1. Introduction

Growing demand for automation and digitalization leads to the rapid development of software. With the increase in the capabilities of software systems, the time required for the delivery of new features also increases. According to [1], software developers spend more than a half of their working time on program comprehension. Aiming to simplify the development and maintenance of large and complex software systems, researchers and practitioners have proposed a number of guidelines and recommendations for writing clear and maintainable code, known as software design patterns [2,3,4]. As is shown in [5], the use of software design patterns with the aim of decomposing and refactoring a software system can reduce the complexity of the system. As described in [6], an anti-pattern is an ineffective and counterproductive solution to a common problem, so the maintainability of a software system improves with the elimination of anti-patterns.
Static source code analyzers are widely used in development environments, allowing the improvement of the quality of software systems by automating bug detection [7], bug correction, the detection of code snippets suitable for parallelization [8], and anti-pattern detection [9] with support for automatic code refactoring. In [9], the authors introduced a rule-based method for detecting anti-patterns in abstract syntax trees (ASTs) in Python programs. The tool developed in [9] facilitated automatically finding code snippets that violated Python programming idioms, and the found code snippets were automatically refactored [9] with their idiomatic versions in order to improve the code readability, maintainability, and performance. Many modern integrated development environments (IDEs) such as IntelliJ IDEA™ 2023.3.4 from JetBrains® and Visual Studio™ 2022 17.9.2 from Microsoft® support rule-based automatic refactoring for programming languages that are widely used in industry.
However, an IDE is unable to automatically detect and refactor an anti-pattern based on the preconfigured rules, as, during the software development process, developers face unique problems and often propose novel solutions and algorithms. Therefore, modern research in software design pattern and anti-pattern detection is focused on the development of intelligent static source code analyzers that are able to learn from examples [10,11,12] and on the development of source code metrics that can numerically characterize code snippets. As is shown in [13,14,15,16], many intelligent static analysis problems can be reduced to the algorithm detection problem. One of the first mentions of the algorithm detection problem is in [16], where the authors used code metrics for feature extraction and applied a decision tree model to source code classification. Code-metric-based intelligent source code analysis algorithms were successfully applied to the method name prediction problem [13] and to the design pattern detection problem [10,11].
Moreover, code metrics can be used for a quick quality assessment of a code snippet during software development or code review. The simplest code metrics include the number of lines of code (NLOC) metric and its variants [17,18], the number of methods and the number of fields [10]. In [19], researchers annotated a collection of code snippets by manually assigning subjective readability assessments to programs. Then, the decisions made by the researchers were compared to the values of different simple code metrics. The results show that such metrics as the count of identifiers in a program, maximum identifier length, and average numbers of logical operators, conditionals, and loops correlate with code readability. The obtained findings show that neither the NLOC nor the number of methods and fields metrics are sufficient for readability assessment of a code snippet. The widely used code metrics that allow us to numerically characterize the readability and maintainability of a code snippet are the Halstead index [20,21] and Cyclomatic Complexity (CycC) [22]. Snippets that are characterized by a high CycC value and a high Halstead index value are considered anti-patterns. Recent research introduced the Cognitive Complexity (CogC) metric [23], which was developed at SonarSource™; the CogC metric is a successor to the CycC metric that better reflects source code readability aspects [24].
However, the existing source code complexity metrics are specialized and are not easily extendable, so in this research, we propose a rule-based algorithm and its specializations for measuring the complexity of Python programs, the specializations of the rule-based algorithm support Python 3.12.2. We express such program complexity metrics as CycC and CogC by means of the proposed algorithm and its specializations. In addition, we propose a new code complexity metric for use in educational courses (EduC) which is at least as strict as the CycC and CogC metrics are and includes additional checks that are based on definition-use graph analysis of a program. We evaluate the CycC, CogC, and EduC metrics using programs submitted to a Digital Teaching Assistant (DTA) system [25]; the DTA system supports automatic generation and checking of unique programming exercises of different types [26]. The obtained results confirm that EduC rejects more overcomplicated and difficult-to-understand programs solving unique programming exercises generated by the DTA system when compared to CycC and CogC. The results also show that the proposed rule-based algorithm can be easily configured to conform to domain-specific requirements.
The paper is structured as follows. Section 2 briefly reviews the existing source code complexity metrics. Section 3 describes the rule-based algorithm for source code complexity assessment, as well as its specializations developed to express such code metrics as CycC and CogC. Section 4 describes the new EduC metric and reports the results of the experimental evaluation. Section 5 presents a discussion regarding the obtained results and highlights areas of future research.

2. Related Work

One of the well-known code quality metrics that analyzes the control flow graph of a program is Cyclomatic Complexity (CycC), proposed by T.J. McCabe in [22]. For the control flow graph G = V , E of a program, the value of the CycC metric can be computed as
CycC G = E V + 2 p ,
where p denotes the count of the connected components in the control flow graph G , V is the set of vertices of the graph G , and E is the set of edges of the graph G .
A simple Python function computing factorial is shown in Figure 1a. The AST [27] of the function is shown in Figure 1c, and the control flow graph is shown in Figure 1b. The graphs were visualized using Graphviz [28]. As is shown in Figure 1b, the control flow graph of the considered program has 8 edges, 8 nodes, and 1 connected component. According to (1), the CycC metric value for the function shown in Figure 1a is equal to 2.
As T.J. McCabe showed in [22,29], the CycC of a program with one entry point and one exit point is equal to the number of decision points in the program plus one, and such decision points include conditional operators and loops. Hence, the CycC metric value can be computed during the traversal of an AST (see, for example, Figure 1c). For example, the “radon” library [30] computes CycC by traversing the AST and increasing the CycC value when an AST node with particular properties is encountered. Known applications of the CycC metric include refactoring prediction [31], malware detection [32], software testing [33], and test case reduction [34]. CycC is widely used in linters of programming languages, allowing them to quickly provide feedback to a programmer if a function or a method becomes too complex and hard to understand and maintain. Modified versions of the CycC metric exist [35,36], such as the pseudo path metric model. This model assigns different weights to different control structures of a program. The recommended maximum value of the CycC metric is 10 [22,30]. According to [22], the main motivation behind the empirically selected threshold is the aim of facilitating easy testing of all the independent parts of a software component. Since the invention of CycC [22], a threshold value equal to 10 (CycC 10) is widely used in industry [30,37] when assessing the complexity of methods or functions.
However, as is shown in [23,38], the CycC metric does not increase penalties for nested structures that break the linear control flow, such as nested loops and nested conditional operators that complicate readability. Aiming to resolve this, a novel Cognitive Complexity (CogC) metric was proposed in [23] and integrated into SonarSource™ analyzers. The CogC metric takes nesting levels into account and multiplies increments for control flow breakers by their nesting levels. This encourages developers to write simpler code with low nesting. According to the comprehensive study conducted in [24], CogC correlates with the time it takes a developer to understand the source code and with subjective ratings of the code’s understandability. The results published in [39] indicate that CycC, CogC, and other code complexity metrics are correlated with each other.
The CycC metric was formulated in a FORTRAN environment in 1976 [22], so the CogC metric was introduced to address syntactic structures in modern languages, such as the try catch blocks, lambdas, and decorators available in such languages as C++, C#, Python, Java, JavaScript, and others [23,24]. The CycC metric increases the source code complexity by 1 for each syntactic structure that breaks the linear control flow of a program. The CogC metric, in contrast, is based on three different types of increments, including a simple increment, a nesting increment, and a nesting level increase.
A comparison of the CycC metric [22] and the CogC [23] metric on a sample Python program ported from Java (see the code snippet on p. 9 in [23]) is shown in Table 1.
The highlighted Python programming language tokens in Table 1 are such tokens that receive a complexity increment from either the CycC or CogC.
As is shown in Table 1, the CycC metric increments the complexity for each syntactic structure that breaks the linear control flow of a program, including such syntactic elements as Try, If, For, and While. As is shown in line 1 of Table 1, the CycC metric starts the function complexity analysis with its value equal to 1. According to (1), the CycC metric counts the decision points in a program, so conditional operators, loops, and exception handlers cause complexity increments.
The CogC metric starts with 0 (see line 1 in Table 1) and does not increment the complexity for a Try block [23]. Instead, CogC increments its value for each Except statement in a Try block (see line 7 in Table 1). In addition, CogC increases the nesting level for such syntactic elements as If, For, and While. Nesting increments in CogC use the current nesting level as a multiplier (see lines 4, 5, and 8 in Table 1). As a result, the CogC metric value for a program with many nested loops and conditionals is higher than the value of the CycC metric. According to [23], nested syntactic structures increase the mental demand of understanding the code, so the CogC metric increment sizes depend on the current nesting level. A complete definition of the CogC metric is available in [23].
The demand on software developers is increasing with ongoing digitalization, and this results in an increase in the burden on academic workers. University programming courses and massive open online courses (MOOCs) widely adopt specialized software for automated assessment of the solutions to programming exercises [25,40,41]. The CycC code metric is commonly used for checking the complexity of programs submitted by students to autograding systems [25,40] with the intention of encouraging students to write not only syntactically correct code solving a given task but also simple, readable, and maintainable code. For example, in the autograding system described in [25], student submissions are checked for their compliance with the PEP8 Python programming standard. PEP8 limits line lengths, indents, and the count of spaces and other special characters that are known to complicate the code readability [19]. In addition, the DTA system [25] checks the values of the CycC of the submitted code snippets, encouraging students to refactor their programs into small and readable functions or classes. However, we are not aware of educational autograding systems that use the CogC metric [23] developed at SonarSource™.

3. Materials and Methods

3.1. A Rule-Based Algorithm for Measuring Code Complexity

The existing code complexity metrics are not easy to extend. CycC is strictly defined as (1) [22], and the definition of CogC in the Java programming language is provided in [23]. However, both of the complexity metrics can be expressed as sets of rules, where each rule is applied to every syntactic element during the traversal of an AST. In this section, we present a rule-based algorithm for assessing the complexity of programs based on AST analysis. The algorithm is inspired by the CogC metric [23].
As is shown in Section 2, CogC assigns different weights to complexity increments depending on the nesting level of a syntactic element. Thus, every rule in the rule-based algorithm for assessing the complexity of a code snippet can be represented as a tuple r ,   w , where:
  • r : V × V B is a predicate that checks whether the complexity value should be incremented or whether the nesting level should be increased for a given AST node n V and its parent node n p V , n , n p V × V , V is the set of all nodes belonging to the analyzed AST, B is the Boolean set, and B = 0 , 1 .
  • w : V × M Z is a mapping which computes the increment size or the nesting level increase size for a given AST node n V and the given context set M M , n , M V × M , where V is the set of nodes in an AST, M is the set of all possible context sets, and Z is the set of integers.
The proposed algorithm for measuring the code complexity is given as follows:
In the first step, Algorithm 1 initializes an empty set M that can be used to store the context used by complexity increment rules of different types. For example, the M set can store variables that are accessible at the analyzed AST node n . In the second step, Algorithm 1 uses the R 1 set to compute the simple increment σ n (see line 1) for the AST node n . For each rule r , w R 1 which is represented by a pair consisting of a predicate r and a mapping w , Algorithm 1 checks whether the rule should be applied to the AST node n if the parent node for the n node is n p . If r n , n p returns 1, then the rule weight w n , M is computed for the n node and the context set M ; otherwise, if r n , n p returns 0, the rule is skipped, and the weighting function w is ignored. According to the complexity formula (see line 4 in Algorithm 1), the simple increment σ n does not depend on the current nesting level λ of the node n . In the third step, the R 2 set is used to compute the increase in the nesting level λ n for the AST node n (see line 2). In the fourth step, the set of rules R 3 is used to compute the nesting increment η n for the AST node n (see line 3) that is multiplied by the current nesting level λ (see line 4). Increments for AST nodes might depend on their parents, hence the predicate r : V × V B accepts both the AST node n and its parent node n p as input (see lines 1–3). The value of the increment computed by the mapping w : V × M Z might depend on the shared context M used during the AST traversal, and because of that, the mapping w accepts both the AST node n and the context set M as input (see lines 1–3). The described process recursively repeats for each of the descendant AST nodes (see lines 5–8 in Algorithm 1).
Algorithm 1. A Rule-Based Algorithm for Measuring Code Complexity
Input: n V ▷ An AST node.
n p V ▷ Parent node of the n AST node.
λ Z ▷ Current nesting level, 0 by default.
R 1 ▷ The set of rules for simple increments.
R 2 ▷ The set of rules for increasing the nesting level.
R 3 ▷ The set of rules for nesting increments.
M = . ▷ The set used as the shared context during AST traversal.
1. σ n = r , w R 1 :   r n , n p 0 w n , M . ▷ Compute simple increment based on R 1 .
2. λ n = r , w R 2 :   r n , n p 0 w n , M . ▷ Compute nesting level increase based on R 2 .
3. η n = r , w R 3 :   r n , n p 0 w n , M . ▷ Compute nesting increment based on R 3 .
4. s n = σ n + λ × η n . ▷ Compute the complexity of the AST node n .
5.For each child node n c of the n node do:
6.   s n c = Algorithm 1 ( n c , n , λ + λ n , R 1 , R 2 , R 3 , M ) .
7.   s n s n + s n c .
8.End loop.
9.Return s n . ▷ The complexity of the n AST node.
For example, if Algorithm 1 is configured to replicate the behavior of the CycC metric when assessing the complexity of an AST of the program shown in Table 1, then the rules in the R 1 set are used to compute simple complexity increments σ n (see line 1 in Algorithm 1) during the recursive traversal of the AST (see lines 5–8). The rules from the R 1 set increment the complexity if the type of the visited node n belongs to the set F u n c t i o n D e f , I f , F o r , W h i l e , E x c e p t H a n d l e r (see Table 1), and the other rule sets are empty: R 2 = , and R 3 = . The shared context M can be used, for example, for such complexity assessment rules that analyze the definition-use graph of a program.
A complexity metric can be defined by the sets of rules R 1 , R 2 , and R 3 passed as arguments to Algorithm 1. In the subsequent sections, we define the R 1 , R 2 , and R 3 sets for such existing complexity metrics as CycC and CogC for the Python programming language. A sample Python AST is shown in Figure 1c, and the Python programming language’s formal grammar is documented in [27]. Additionally, we define the R 1 , R 2 , and R 3 sets for the new EduC source code complexity metric designed for use in educational programming courses.

3.2. Rules for Cognitive Complexity

The CogC metric, according to its definition in the SonarSource™ paper [23], supports:
  • Simple increments;
  • Nesting level increases;
  • Nesting increments.
Table 2 lists the rules for simple increments in the proposed rule-based algorithm for computing code complexity. Such rules belong to the R 1 set in Algorithm 1 (see line 1). The rules from Table 2 are used during the traversal of a Python AST (see Figure 1c for an example) obtained using the standard library [23]. In Table 2, t : V T is a mapping which maps an AST node n V to its type. The V n V set is the set of nodes belonging to a subtree of the analyzed AST, the root of the subtree is n , and n p is a parent for n .
The rules listed in Table 2 are specific to the Python programming language AST format and to the names of the edges connecting the AST nodes; the formal definition of the Python language AST’s format is available in [27]. The mapping t which maps an AST node n V to its type yields one of the known AST node types listed in [27]. However, the rules can be adapted to support other programming languages with a similar syntax.
As listed in Table 2, CogC increments the complexity for syntactic structures that break the linear control flow of a program (see rule 4), for chains of Boolean operators (see rule 6), for recurrent functions (see rule 2), for branching in loops, error-handling operators, and conditional operators (see rules 1, 3), as defined in [23]. In addition, simple increments also include the generators and conditional operators inside them (see rule 5), as they add branching to the control flow graph of a program.
Table 3 lists the rules for increasing the nesting level. As is shown in Table 3, CogC does not increase the nesting level based on decorators (see rule 2) due to the added exception, as described on p. 15 in [23]. Also, the nesting level is not increased for every new else-if operator (see rule 1), as is suggested in the specification of the CogC metric for Java (see p. 16 in [23]). Table 4 lists the rules for CogC nesting increments.

3.3. Rules for Cyclomatic Complexity

In contrast to the CogC metric, CycC does not maintain the nesting level and does not support nesting increments [22]. As a result, when defining CycC using Algorithm 1, we assume that R 2 = and R 3 = . The rules from the set R 1 that are used for simple increments are listed in Table 5, where t : V T is a mapping that obtains the type of the AST node n , n p is the parent node for the n AST node, and M is the shared context set (see the M parameter in Algorithm 1).
A comparison of the CycC and CogC metric rule sets applied to the AST of the code from Table 1 is shown in Figure 2; the visualizations were obtained using Graphviz [28]. The 6 nodes highlighted in red in Figure 2a caused CycC increments according to the rules listed in Table 5, so the resulting CycC metric value for the AST is 6. The five nodes highlighted in red in Figure 2b caused CycC increments and nesting level increases, and the brightness of the red color is proportional to the size of the total complexity increment for the highlighted AST nodes. As listed in Table 1, the “While” node shown in Figure 2b receives +3 (see rule 4 in Table 2 and rule 2 in Table 4), the “For” node receives +2, and the “ExceptHandler” node receives +1. The two conditional operators receive +1 and +2 due to the different levels of nesting.
The nodes that have a nonzero nesting level during AST traversal and receive no complexity increments are highlighted in orange in Figure 2b, and the brightness of the color is proportional to the nesting level at the highlighted AST node. The resulting CogC metric value for the AST shown in Figure 2b is 9 (see Table 1).
As is shown in Figure 2, the complexity increments in CycC and CogC differ, and programs containing many nested syntactic structures are considered more complex by the CogC code metric. However, both complexity metrics can be expressed as sets of rules in Algorithm 1.

3.4. Rules for Educational Complexity

The extensibility of Algorithm 1 simplifies the definition of new code complexity metrics and the modification of existing code complexity metrics.
In this section, we define a novel EduC code metric for use in autograding systems that automates some of the teacher’s activities in educational programming courses, such as the DTA autograding system [25] that is used in the massive Python programming course at RTU MIREA. The DTA system supports automatic generation of unique programming exercises of different types [26], as well as automatic checking of the submitted solutions for their correctness [25]. In addition, the DTA system checks the CycC of the submitted programs and rejects code snippets that exceed the allowed limit of 10 CycC points.
However, code that would be rejected during the code review stage in a real-world company still passes the automatic review based on the CycC checks. The aim of the proposed EduC metric is to be at least as strict as the CycC and CogC metrics and to incorporate additional checks to detect anti-patterns that hurt the readability of the source code. Such anti-patterns include, for example, the reuse of a variable with the same name for two unrelated purposes, as it is known that this anti-pattern hurts code maintainability [42].
In the novel EduC code metric, we use the CogC metric rule sets in Algorithm 1 as defined in Table 2, Table 3 and Table 4. However, the R 1 set is extended with the additional simple increment rules listed in Table 6. Rules 1–3 in Table 6 make the EduC metric at least as strict as the CycC metric, rule 4 increments for structures that break the linear control flow, and rules 5–8 detect variables that are reused for completely different purposes (see Table 6). In the variable reuse antipattern (see rules 5–8 in Table 6), we distinguish between assignments of the form “a = a + 1” and assignments of the form “a = 1”. In the second case, it is assumed that the name “a” is used in a completely new context, and a second assignment in a new context incurs a penalty. In the students’ code, we noticed that these assignments are commonly used in programs written in a low-level, imperative style, using, for example, complicated logic with flags. With the EduC rules responsible for the variable reuse anti-pattern detection, we intend to encourage students to write code in a more declarative manner, similar to functional programming. Also, we noticed that using an old variable name in a new context often indicates that the student was too lazy to come up with different names for two different concepts.
The mappings in rules 5–8 that compute the complexity increment for an AST node n are represented by sequences of statements. The statements update the shared context M (see the M parameter of Algorithm 1) containing variables that are available at a given AST node n . The rules 5 and 6 in Table 6 depend on Algorithm 2, which the extracts defined and variables used from an AST to enable basic data flow analysis. The algorithm traverses an AST starting from its root n (see lines 7–9) and maintains the D set of defined variable names (see lines 4–6) and the U set of used variable names (see line 1–3). The complexity of Algorithm 2 is O V , where V is the set of nodes belonging to the analyzed AST.
Rules 5, 6, and 8 in Table 6 are applied to every AST node during AST traversal; this is required to maintain the context set M containing the available variables. Rules 6–8 do not increment the complexity and are only required to maintain the M set. Rule 5 in Table 6 increments the complexity by the count of variables that are reused in a different context [42]. Such variables are defined (belong to the D set received from Algorithm 2), have been defined earlier (belong to the M shared context set), and are not used on the right-hand side of the assignment operator (do not belong to the U set received from Algorithm 2).
Algorithm 2. Extraction of defined and used variables from a Python AST
Input: n V ▷ An AST node to extract defined and used variables from.
D ▷ The set of defined variables, D = by default.
U ▷ The set of used variables, U = by default.
1.If t n = N a m e t n . c t x = L o a d then:
2.   U U n . i d .
3.End if.
4.If t n = N a m e t n . c t x = S t o r e then:
5.   D D n . i d .
6.End if.
7.For each child node n c of the n node do:
8.   D , U Algorithm 2 n c , D , U .
9.End loop.
10.Return D , U . ▷ The defined and used variables.
The intended use of the EduC metric is assessment of source code in educational programming courses, MOOCs, and automated systems for interviewing candidates for employment. EduC adds additional complexity increments with the aim of detecting anti-patterns that make code less maintainable [42], so the metric can be used to analyze and refactor existing software systems either manually or automatically, as is shown in [43].

4. Comparison of the Code Complexity Metrics

4.1. Sample Programs

The considered code complexity metrics were compared using programs from the [23] dataset. The programs were ported from the Java programming language to Python, Algorithm 1 (see Section 3.1) was used to measure the complexity of the programs.
For the CycC metric (see Section 3.2), the R 1 set contained rules from Table 5, R 2 = , and R 3 = . For the CogC metric (see Section 3.3), the R 1 , R 2 , and R 3 sets contained rules from Table 2, Table 3 and Table 4. For the EduC metric (see Section 3.4), the R 2 and R 3 sets contained rules from Table 3 and Table 4, and the R 1 set included rules from Table 2 and Table 6. Table 7 lists the increments in complexity for CycC, CogC, and EduC for a sample program from p. 18 of [23]. The results for other sample programs are provided in [44], and the code implementing the CycC, CogC, and EduC metrics is also available in [44].
According to Table 7, the EduC metric value is the highest among the considered metrics, and the CycC metric is the lowest, as it does not take nesting levels into account. The highlighted Python programming language tokens in Table 7 are such tokens that receive a complexity increment at least from one of the CycC, CogC, and EduC metrics. The EduC metric is at least as strict as the CycC and CogC metrics are. Line 11 and line 22 in Table 7 define a variable, “depends”. This variable is redefined at line 22 with a newly received value and has a different meaning compared to a variable defined earlier at line 11. This is an example of a well-known variable reuse anti-pattern that complicates the understandability of code [42], and the EduC metric adds +1 to the complexity value here (see rule 5 in Table 6).

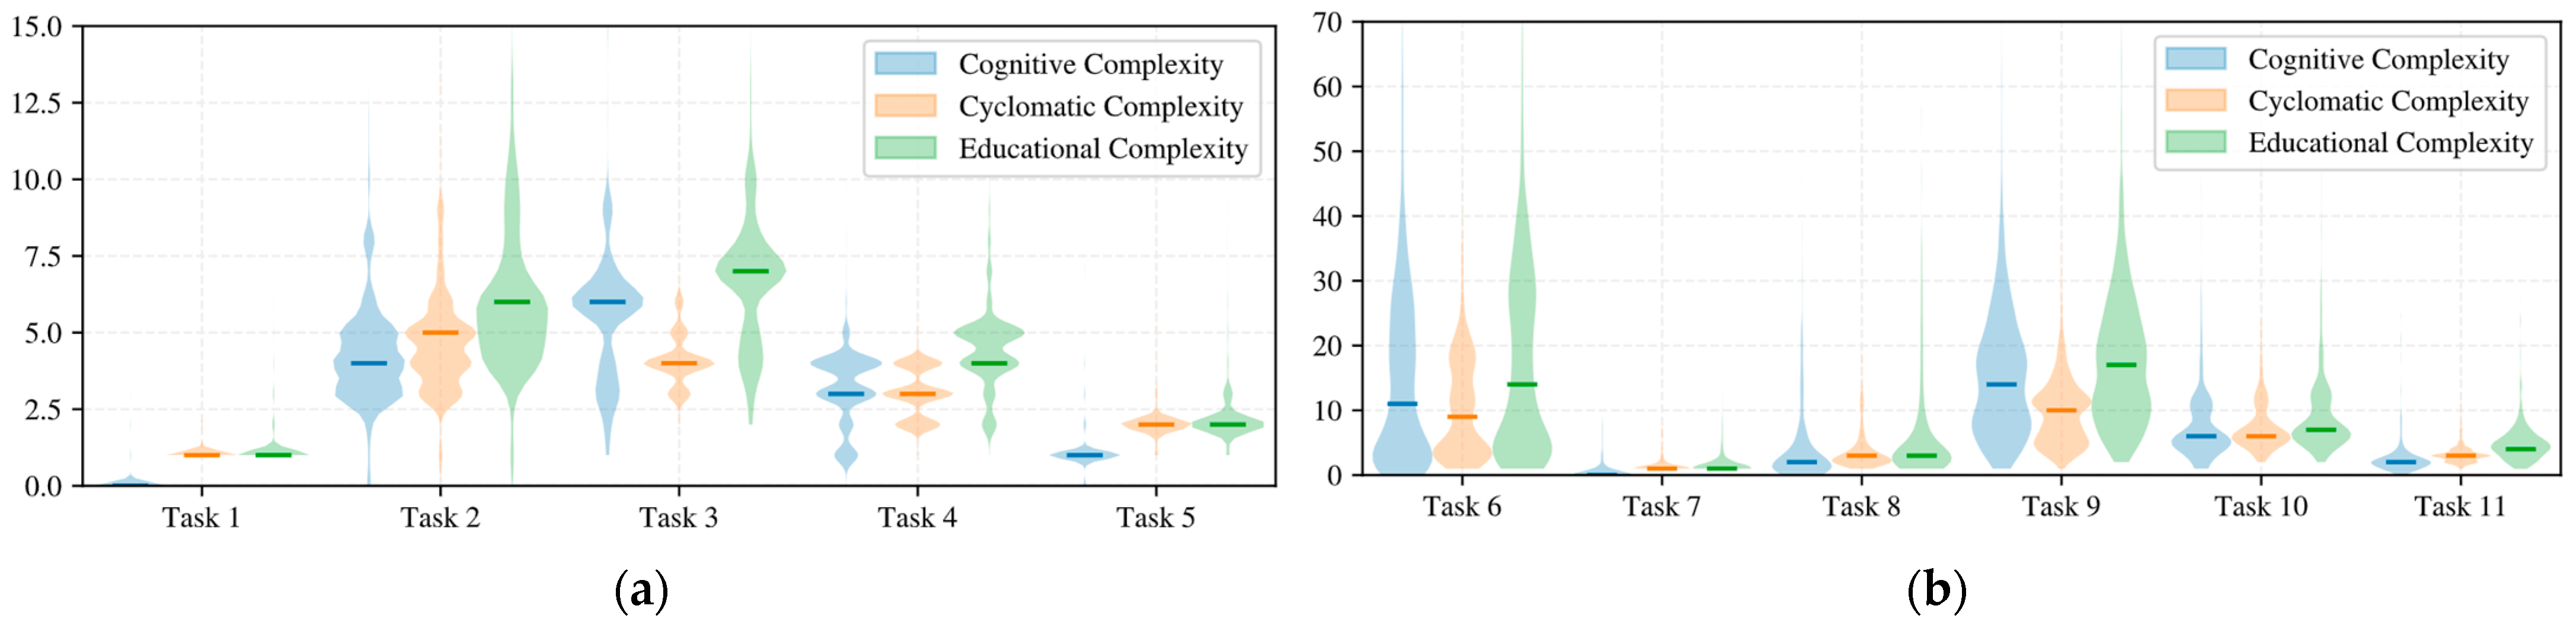
4.2. Programs Solving Unique Programming Exercises

The DTA autograding system described in [25] automates some of the teacher activities in a massive Python programming course at RTU MIREA. The DTA system is capable of automatic generation of unique programming exercises of different types using methods and algorithms described in [26]; static analysis programs submitted by students; checking the correctness of the submitted programs [25]; and maintenance of the statistics on students’ performance and achievements. A program submitted by a student is first checked for its compliance with the PEP8 Python code formatting standard, which was developed to simplify code readability and maintainability. If the program passes the PEP8 code style check, the CycC metric is then used to measure the complexity of the program. If the CycC value is below the allowed threshold (CycC 10), then the program is checked for correctness; otherwise, the program is rejected.
The DTA system supports automatic generation and automatic checking of tasks of 11 types, including formal notation into source code translation tasks and conversion between data format tasks. The task types supported in DTA are [45]:
  • Implement a mathematical function;
  • Implement a piecewise function formula;
  • Implement an iterative formula;
  • Implement a recurrent formula;
  • Implement a function that processes vectors;
  • Implement a function computing a decision tree;
  • Implement a bit field converter;
  • Implement a text format parser;
  • Implement tabular data transformation;
  • Implement a finite state machine as a class;
  • Implement a binary format parser.
Examples of each of the listed task types are available in [45], and examples of programs solving unique programming exercises of 11 types are also available in [45]. However, as can be seen from the source codes of the accepted programs, the system accepts code that is poorly readable despite the presence of the CycC check. Students overuse nested loops, nested functions, classes, and conditionals and do not pay attention to variable naming, even if the same variable is reused in different contexts. This issue can be resolved by incorporating either CogC or EduC instead of the CycC metric into the DTA system.
In the Spring semester of 2023, the DTA system received 100,691 programs [45] solving unique automatically generated programming exercises. A total of 18,683 programs were automatically checked and accepted by the system, and 82,008 programs were rejected. Meanwhile, 2851 of the 82,008 rejected programs passed the PEP8 standard compliance check and were rejected because of an excessive CycC metric value.
Aiming to compare the CycC, CogC, and EduC metrics (see Section 3), we prepared a dataset containing 21,534 programs solving unique programming exercises of 11 different types. The dataset included 18,683 programs that were checked and accepted by the DTA system, and the 2851 programs that were rejected due to a too-high CycC metric value (CycC > 10). Analysis of the source code of the programs from the dataset was carried out with the aim of answering two research questions (RQs).
Question 1 (RQ1).
Which of the well-known CycC and CogC metrics is stricter in the complexity assessment of programs solving unique programming exercises?
Aiming to answer this research question, we calculated the count of programs that exceed CycC (CycC > 10) but do not exceed CogC (CogC 10) and the count of programs that exceed CogC (CogC > 10) but do not exceed CycC (CycC 10) per task type. The CycC metric was calculated for each program using Algorithm 1 and the rules from Table 5, the CogC metric was calculated for each program using Algorithm 1 and the rules from Table 2, Table 3 and Table 4. The results are shown in Figure 3.
According to Figure 3, more than 700 programs exceed CogC (CogC > 10) but do not exceed CycC (CycC 10). According to the values of the CogC metric, students use the most complex solutions for tabular data transformation (task of type 9) and decision tree computation (task of type 6). The naive programmatic solutions to the decision tree computation task include a lot of nested conditional operators, the naive solutions to the tabular data transformation task include nested loops and conditionals, and the CogC metric increases penalties for nested “ifs” and loops (see Figure 2a,b and Table 7).
Aiming to compare the count of programs that exceed both metrics, the count of programs that exceed one of the two metrics, and the count of programs that do not exceed either metric, we obtained the plots shown in Figure 4.
According to Figure 4, the CycC and CogC metrics agree on rejecting 3132 programs and agree on accepting 17,534 programs with the maximum allowed complexity threshold set to 10. The metrics disagree for 868 programs, and CogC rejects more poorly readable programs where refactoring is necessary. This indicates that CogC is stricter than CycC in the assessment of Python programs solving educational exercises. However, programs that exceed CycC but do not exceed CogC also exist. Hence, one of the aims of EduC’s development was to make a metric that is at least as strict as CycC and CogC.
Question 2 (RQ2).
Is the developed EduC metric at least as strict as the well-known CycC and CogC metrics are in the complexity assessment of programs solving programming exercises?
Figure 4 compares the strictness of the CycC and CogC metrics and shows that CogC is stricter than CycC, but programs that pass the CogC check and do not pass the CycC check also exist. Aiming to answer the second research question, we included the third EduC metric in the comparison. Including the EduC metric with the same threshold value 10 in the comparison results in the histogram plot shown in Figure 5.
The EduC metric was calculated for each program from the dataset using Algorithm 1 and the rules from Table 2, Table 3 and Table 4 and additional rules from Table 6. According to Figure 5, the EduC metric is indeed at least as strict as the CycC and CogC metrics are, and no programs exist that exceed either CycC or CogC but do not exceed EduC. As is shown in Figure 4, 793 programs exceed CogC but do not exceed CycC, and 75 programs exceed CycC but do not exceed CogC. However, if we include the new EduC code metric in the comparison (see Figure 5), we find out that 0 programs exceed only CycC but do not exceed EduC, and 0 programs exceed only CogC but do not exceed EduC. Moreover, EduC rejects 810 programs more when compared to using the CycC and CogC metrics simultaneously.
Aiming to verify that the proposed EduC metric is indeed at least as strict as the CycC and CogC metrics are, we verified that the following condition was satisfied:
n P :   EduC ( n )     CycC ( n )     EduC ( n )     CogC ( n ) ,
where P denotes the considered dataset containing 21,534 programs, n denotes an AST of a program from the dataset P , CogC( n )’s value is computed using Algorithm 1 and the rules from Table 2, Table 3 and Table 4, CycC( n )’s value is computed using Algorithm 1 and the rules from Table 5, and EduC( n )’s value is computed using Algorithm 1 and the rules from Table 2, Table 3, Table 4 and Table 6.
Aiming to compare the distributions of different code complexity metrics, we obtained histograms of the occurrence frequencies of the metric values for the programs from the considered dataset containing 21,534 source codes. The histograms are shown in Figure 6.
As is shown in Figure 6, there are many programs with a CogC value of zero. The CycC metric values are often in the range of 1 to 5, and there is also a noticeable number of programs with the CycC metric value in the range of 11 to 15. Small values of CogC and EduC occur less often when compared to CycC. Aiming to better understand how the distributions differ for programs with a higher complexity, we applied a logarithmic scale to the vertical axis of Figure 6. The obtained result is shown in Figure 7.
According to Figure 7, CogC and EduC values above 15 occur more often when compared to CycC. Aiming to compare the relative values of the complexity metrics, we applied min–max normalization to the set containing the computed values of the CycC metric, to the set containing the computed values of the CogC metric, and to the set containing the computed values of the EduC metric. The metric values were obtained from programs from the dataset [45] (see Figure 7).
The set X s containing normalized values of a metric was computed as:
X s = x min x i X x i max x i X x i min x i X x i |   x X ,
where X s is the set containing scaled complexity metric values from the X set, and x denotes the value of the complexity metric before scaling.
Histograms of the occurrence frequencies of the scaled CycC, CogC, and EduC metric values are shown in Figure 8 with logarithmic scaling.
According to Figure 7 and Figure 8, the EduC metric is more likely to produce higher complexity values for complex programs when compared to CycC and CogC. EduC reaches higher complexity values by design (see Figure 7), but even after applying a normalization scheme, EduC appears to be stricter when compared to the other metrics.
In addition, we calculated the occurrence frequencies of different code complexity metrics for each task type, and the results are shown in Figure 9.
As is shown in Figure 9a, in the first block of the exercises which contain tasks where a student should implement a function computing a given mathematical formula, EduC increases the penalties for functions with conditional operators (type 2 in Figure 9a) and for functions with nested loops (type 3 in Figure 9a); see p. 4 of [45] for task formulation examples. It is expected that a student either refactors the nested loops into separate functions or uses such Python language features as generator expressions.
As is shown in Figure 9b, EduC increases the penalties for complex implementations of functions that compute decision trees (type 6). It is expected that a student either refactors the nested ifs into small Python functions or uses a declarative approach to describing the computation rules for decision trees. EduC also increases the penalties for functions that transform tabular data. Again, it is expected that a student either splits the complex code into small functions or uses list comprehensions or generator expressions.
A comparison of the program counts rejected by the three metrics is shown in Figure 10.
As is shown in Figure 10, the EduC metric is the strictest metric, rejecting 1603 more programs when compared to the CycC metric, which was previously used in the DTA system [25,45]. We suggest the use of the same threshold for EduC as for CycC (EduC ≤ 10) in autograding systems automating educational programming courses, including the DTA system. Programs that exceed the maximum allowed EduC metric value are rejected in the new version of the DTA system. In addition, a report is shown to students, listing the complexity increments for the syntactic elements of a program. An example of such a report is shown in Figure 11.
In addition, the textual output of the complexity check report generated by the developed eDSL [44] based on Algorithms 1 and 2 was used in an extension to the Visual Studio Code® editor. The developed extension is able to highlight the lines causing complexity increments if the analyzed function exceeds the configured code complexity limit, as is shown in Figure 12. The numerical complexity value does not help much with refactoring a code snippet with the aim of removing anti-patterns, too-high nesting levels, and other things that complicate readability. The user interface of the code editor which is shown in Figure 12 highlights lines with syntactic elements that cause complexity increments based on the textual output (see Figure 11a), aiming to provide tips to a developer or a student that help with refactoring a code snippet.
The use of colors and labels in the developed extension (see Figure 12) simplifies the understandability of the generated complexity check reports (see Figure 11a), suggesting students or ordinary developers refactor and simplify specific parts of their code. Figure 12a shows a program computing a recurrent formula and solving a task of type 4 from the considered dataset, while Figure 12b shows a refactored version of the original program with a reduced EduC metric value. In the refactored version of the program shown in Figure 12b, the variable reuse anti-pattern was refactored into multiple variable assignments.

5. Conclusions

In the conducted research, we described a rule-based algorithm, Algorithm 1, for complexity assessment of code snippets. We described the rules required to express the well-known CycC metric [21,22,29] and the CogC metric, which was proposed in [23] and extensively studied in [24,38]. Table 5 contains CycC simple increment rules for use in Algorithm 1. Table 2, Table 3 and Table 4 contain CogC simple increment, nesting level increase, and nesting increment rules for use in Algorithm 1. In addition, we proposed a new complexity metric, EduC, for use in autograding systems that automate educational programming courses. The EduC metric reuses the CogC rules (see Table 2, Table 3 and Table 4) but also includes simple increment rules from Table 6. The additional rules from Table 6 make the EduC metric at least as strict as the CycC and CogC metrics are when used simultaneously. Moreover, EduC also includes rules for detecting the variable reuse anti-pattern described in [42].
The proposed EduC metric can be used for the assessment of programs in software that supports automatic checking of programming exercises, such as the DTA system [25]. The aim of the incorporation of the EduC metric is to motivate students to write simple, maintainable, and reusable functions and classes. We expressed the CycC, CogC, and EduC metrics using the developed Python-based eDSL [44] and evaluated the metrics on programs submitted to the DTA system in the Spring semester 2023 [45]. The results confirm that CogC is stricter than CycC and that the EduC metric is indeed at least as strict as CycC and CogC are. The EduC metric rejects more overcomplicated and difficult-to-understand programs solving unique programming exercises generated by the DTA system. The EduC metric can be further extended with additional rules that increment the complexity based on code duplication and other anti-patterns. Moreover, Algorithm 1 can be used to check the compliance of software to corporate programming standards expressed as the sets of rules R 1 , R 2 , and R 3 in Algorithm 1 using the developed eDSL [44], and the EduC metric is an example demonstrating how Algorithm 1 can be configured to solve a domain-specific problem.
Future work could focus on the development of additional rules for Algorithm 1 that can detect the “magic number” anti-pattern [46], object-oriented programming anti-patterns, and functional programming anti-patterns. Moreover, automatic synthesis of the R 1 , R 2 , and R 3 rule sets in Algorithm 1 from a labeled dataset of programs is a promising research area. However, the described rule-based algorithm Algorithm 1 currently lacks support for complex control flow graph analysis, data flow graph analysis, or call graph analysis of software; the algorithm only supports complexity increments that can be computed separately for every node of an AST using the shared context M . Future research could focus on more advanced methods and algorithms that operate on graph-based representations of programs and software systems with the aim of detecting and refactoring more complex antipatterns such as semantic code duplication.

Author Contributions

Conceptualization, methodology: L.A.D., P.N.S. and A.V.G.; software, resources, testing: P.N.S. and A.V.G.; investigation, formal analysis, visualization: L.A.D., P.N.S. and A.V.G.; validation, supervision, project administration: L.A.D. and P.N.S.; writing—original draft preparation, A.V.G.; writing—review and editing: L.A.D. and P.N.S. All authors have read and agreed to the published version of the manuscript.

Funding

This research was supported by the Ministry of Science and Higher Education of the Russian Federation (Project No. FSFZ-2024-0023).

Data Availability Statement

The eDSL described in this study is openly available on GitHub at https://gist.github.com/worldbeater/51fa42ed4380da9218368bde78024bab (accessed on 7 December 2023).

Conflicts of Interest

The authors declare no conflicts of interest.

References

  1. Xia, X.; Bao, L.; Lo, D.; Xing, Z.; Hassan, A.E.; Li, S. Measuring Program Comprehension: A Large-Scale Field Study with Professionals. IEEE Trans. Softw. Eng. 2018, 44, 951–976. [Google Scholar] [CrossRef]
  2. Fowler, M. Patterns. IEEE Softw. 2003, 20, 56–57. [Google Scholar] [CrossRef]
  3. Gamma, E.; Helms, R.; Johnson, R.; Vlissides, J. Design Patterns: Elements of Reusable Object-Oriented Software, 1st ed.; Addison-Wesley Professional: Boston, MA, USA, 1995; 395p. [Google Scholar]
  4. Ampatzoglou, A.; Chatzigeorgiou, A.; Charalampidou, S.; Avgeriou, P. The effect of GoF design patterns on stability: A case study. IEEE Trans. Softw. Eng. 2015, 41, 781–802. [Google Scholar] [CrossRef]
  5. Qamar, N.; Malik, A.A. Impact of design patterns on software complexity and size. Mehran Univ. Res. J. Eng. Technol. 2020, 39, 342–352. [Google Scholar] [CrossRef]
  6. Koenig, A. Patterns and antipatterns. In The Patterns Handbooks: Techniques, Strategies, and Applications; Cambridge University Press: Cambridge, UK, 1998; pp. 383–389. [Google Scholar]
  7. Smaragdakis, Y.; Csallner, C. Combining Static and Dynamic Reasoning for Bug Detection. In Proceedings of the International Conference on Tests and Proofs, Zurich, Switzerland, 12–13 February 2007; Springer: Berlin/Heidelberg, Germany, 2007; pp. 1–16. [Google Scholar]
  8. Bakanov, V.M. Computational complexity when constructing rational plans for program execution in a given field of parallel computers. Russ. Technol. J. 2022, 10, 7–19. [Google Scholar] [CrossRef]
  9. Zhang, Z.; Xing, Z.; Xia, X.; Xu, X.; Zhu, L. Making Python Code Idiomatic by Automatic Refactoring Non-Idiomatic Python Code with Pythonic Idioms. In Proceedings of the 30th ACM Joint European Software Engineering Conference and Symposium on the Foundations of Software Engineering, Singapore, 14–16 November 2022; Association for Computing Machinery: New York, NY, USA, 2022; pp. 696–708. [Google Scholar]
  10. Uchiyama, S.; Kubo, A.; Washizaki, H.; Fukazawa, Y. Detecting design patterns in object-oriented program source code by using metrics and machine learning. J. Softw. Eng. Appl. 2014, 7, 983. [Google Scholar] [CrossRef]
  11. Dwivedi, A.K.; Tirkey, A.; Ray, R.B.; Rath, S.K. Software design pattern recognition using machine learning techniques. In Proceedings of the 2016 IEEE Region 10 Conference (TENCON), Marina Bay Sands, Singapore, 22–25 November 2016; IEEE: Piscataway, NJ, USA, 2016; pp. 222–227. [Google Scholar]
  12. Hummel, O.; Burger, S. Analyzing source code for automated design pattern recommendation. In Proceedings of the 3rd ACM SIGSOFT International Workshop on Software Analytics, Paderborn, Germany, 4 September 2017; Association for Computing Machinery: New York, NY, USA, 2017; pp. 8–14. [Google Scholar]
  13. Parsa, S.; Zakeri-Nasrabadi, M.; Ekhtiarzadeh, M.; Ramezani, M. Method name recommendation based on source code metrics. J. Comput. Lang. 2023, 74, 10117. [Google Scholar] [CrossRef]
  14. Russell, R.; Kim, L.; Hamilton, L.; Lazovich, T.; Harer, J.; Ozdemir, O.; Ellingwood, P.; McConley, M. Automated Vulnerability Detection in Source Code Using Deep Representation Learning. In Proceedings of the 2018 17th IEEE International Conference on Machine Learning and Applications (ICMLA), Orlando, FL, USA, 17–20 December 2018; IEEE: Piscataway, NJ, USA, 2018; pp. 757–762. [Google Scholar]
  15. Gorchakov, A.V.; Demidova, L.A.; Sovietov, P.N. Analysis of Program Representations Based on Abstract Syntax Trees and Higher-Order Markov Chains for Source Code Classification Task. Future Internet 2023, 15, 314. [Google Scholar] [CrossRef]
  16. Taherkhani, A.; Malmi, L.; Korhonen, A. Algorithm Recognition by Static Analysis and Its Application in Students’ Submissions Assessment. In Proceedings of the 8th International Conference on Computing Education Research, Koli, Finland, 13–16 November 2008; Association for Computing Machinery: New York, NY, USA, 2008; pp. 88–91. [Google Scholar]
  17. Parareda, B.; Pizka, M. Measuring productivity using the infamous lines of code metric. In Proceedings of the SPACE 2007 Workshop, Nagoya, Japan, 4 December 2007; pp. 4–9. [Google Scholar]
  18. Mamun, M.A.A.; Berger, C.; Hansson, J. Correlations of software code metrics: An empirical study. In Proceedings of the 27th international workshop on software measurement and 12th international conference on software process and product measurement, Gothenburg, Sweden, 25–27 October 2017; Association for Computing Machinery: New York, NY, USA, 2017; pp. 255–266. [Google Scholar]
  19. Buse, R.P.L.; Weimer, W.R. Learning a metric for code readability. IEEE Trans. Softw. Eng. 2009, 36, 546–558. [Google Scholar] [CrossRef]
  20. Halstead, M.H. Elements of Software Science (Operating and Programming Systems Series); Elsevier Science Inc.: New York, NY, USA, 1977. [Google Scholar]
  21. Curtis, B.; Sheppard, S.B.; Milliman, P.; Borst, M.A.; Love, T. Measuring the psychological complexity of software maintenance tasks with the Halstead and McCabe metrics. IEEE Trans. Softw. Eng. 1979, 2, 96–104. [Google Scholar] [CrossRef]
  22. McCabe, T.J. A Complexity Measure. IEEE Trans. Softw. Eng. 1976, 4, 308–320. [Google Scholar] [CrossRef]
  23. Campbell, G.A. Cognitive Complexity: An Overview and Evaluation. In Proceedings of the 2018 International Conference on Technical Debt, Gothenburg, Sweden, 27–28 May 2018; Association for Computing Machinery: New York, NY, USA, 2018; pp. 57–58. [Google Scholar]
  24. Muñoz Barón, M.; Wyrich, M.; Wagner, S. An empirical validation of cognitive complexity as a measure of source code understandability. In Proceedings of the 14th ACM/IEEE International Symposium on Empirical Software Engineering and Measurement (ESEM), Bari, Italy, 5–9 October 2020; Association for Computing Machinery: New York, NY, USA, 2020; pp. 1–12. [Google Scholar]
  25. Sovietov, P.N.; Gorchakov, A.V. Digital Teaching Assistant for the Python Programming Course. In Proceedings of the 2022 2nd International Conference on Technology Enhanced Learning in Higher Education (TELE), Lipetsk, Russia, 26–27 May 2022; IEEE: Piscataway, NJ, USA, 2022; pp. 272–276. [Google Scholar]
  26. Sovietov, P. Automatic Generation of Programming Exercises. In Proceedings of the 2021 1st International Conference on Technology Enhanced Learning in Higher Education (TELE), Lipetsk, Russia, 7–9 July 2021; IEEE: Pistacaway, NJ, USA, 2021; pp. 111–114. [Google Scholar]
  27. Python Software Foundation. AST—Abstract Syntax Trees. 2023. Available online: https://docs.python.org/3/library/ast.html (accessed on 3 December 2023).
  28. Gansner, E.R.; North, S.C. An Open Graph Visualization System and its Applications to Software Engineering. Softw. Pract. Exp. 2000, 30, 1203–1233. [Google Scholar] [CrossRef]
  29. McCabe, T.J.; Butler, C.W. Design complexity measurement and testing. Commun. ACM 1989, 32, 1415–1425. [Google Scholar] [CrossRef]
  30. Lacchia, M. Radon 4.1.0 Documentation. 2020. Available online: https://radon.readthedocs.io/en/latest/ (accessed on 6 December 2023).
  31. Köşker, Y.; Turhan, B.; Bener, A. Refactoring prediction using class complexity metrics. In Proceedings of the Third International Conference on Software and Data Technologies, Volume SE/MUSE/GSDCA, Porto, Portugal, 5–8 July 2008; INSTICC Press: Lisboa, Portugal, 2008; pp. 289–292. [Google Scholar]
  32. Kumar, S.K.S.; Kulyadi, S.P.; Mohandas, P.; Raman, M.S.; Vasan, V.S. Computation of Cyclomatic Complexity and Detection of Malware Executable Files. In Proceedings of the 2021 13th International Conference on Electronics, Computers and Artificial Intelligence (ECAI), Pitesti, Romania, 1–3 July 2021; IEEE: Piscataway, NJ, USA, 2021; pp. 1–5. [Google Scholar]
  33. Emergy, K.O.; Mitchell, B.K. Multi-level software testing based on cyclomatic complexity. In Proceedings of the IEEE National Aerospace and Electronics Conference, Dayton, OH, USA, 22–26 May 1989; IEEE: Piscataway, NJ, USA, 1989; pp. 500–507. [Google Scholar]
  34. Farooq, U.; Abubakar; Aqeel, A.B. A Meta-Model for Test Case Reduction by Reducing Cyclomatic Complexity in Regression Testing. In Proceedings of the 2021 International Conference on Robotics and Automation in Industry (ICRAI), Rawalpindi, Pakistan, 26–27 October 2021; IEEE: Piscataway, NJ, USA, 2021; pp. 1–6. [Google Scholar]
  35. Yu, S.; Zhou, S. A survey on metric of software complexity. In Proceedings of the 2010 2nd IEEE International conference on information management and engineering, Chengdu, China, 16–18 April 2010; IEEE: Piscataway, NJ, USA, 2010; pp. 352–356. [Google Scholar]
  36. Zheng, J.; Wu, J. Research of the method of measuring program complexity based on pseudo-path. J. Zhongkai Agrotech. Coll. 2006, 4, 42–45. [Google Scholar]
  37. Vinju, J.J.; Godfrey, M.W. What does control flow really look like? Eyeballing the cyclomatic complexity metric. In Proceedings of the 2012 IEEE 12th International Working Conference on Source Code Analysis and Manipulation, Riva del Garda, Italy, 23–24 September 2012; IEEE: Piscataway, NJ, USA, 2021; pp. 154–163. [Google Scholar]
  38. Sarwar, M.M.S.; Shahzad, S.; Ahmad, I. Cyclomatic complexity: The nesting problem. In Proceedings of the Eighth International Conference on Digital Information Management (ICDIM 2013), Islamabad, Pakistan, 10–12 September 2013; IEEE: Piscataway, NJ, USA, 2013; pp. 274–279. [Google Scholar]
  39. Lavazza, L.; Abualkishik, A.Z.; Liu, G.; Morasca, S. An empirical evaluation of the “Cognitive Complexity” measure as a predictor of code understandability. J. Syst. Softw. 2023, 197, 111561. [Google Scholar] [CrossRef]
  40. Hung, S.L.; Kwok, I.F.; Chan, R. Automatic programming assessment. Comput. Educ. 1993, 20, 183–190. [Google Scholar] [CrossRef]
  41. Smith, R.; Tang, T.; Warren, J.; Rixner, S. An automated system for interactively learning software testing. In Proceedings of the 2017 ACM Conference on Innovation and Technology in Computer Science Education, Bologna, Italy, 3–5 July 2017; Association for Computing Machinery: New York, NY, USA, 2017; pp. 98–103. [Google Scholar]
  42. Fowler, M.; Beck, K. Refactoring: Improving the Design of Existing Code, 2nd ed.; Addison-Wesley Professional: Boston, MA, USA, 2018; pp. 104–107. [Google Scholar]
  43. Saborido, R.; Ferrer, J.; Chicano, F.; Alba, E. Automatizing Software Cognitive Complexity Reduction. IEEE Access 2022, 10, 11642–11656. [Google Scholar] [CrossRef]
  44. Gorchakov, A.V. Precise Library for Complexity Assessment Algorithm Synthesis. 2023. Available online: https://gist.github.com/worldbeater/51fa42ed4380da9218368bde78024bab (accessed on 8 December 2023).
  45. Demidova, L.A.; Andrianova, E.G.; Sovietov, P.N.; Gorchakov, A.V. Dataset of Program Source Codes Solving Unique Programming Exercises Generated by Digital Teaching Assistant. Data 2023, 8, 109. [Google Scholar] [CrossRef]
  46. Jorge, D.; Machado, P.; Andrade, W. Investigating Test Smells in JavaScript Test Code. In Proceedings of the 6th Brazilian Symposium on Systematic and Automated Software Testing, Salvador, Brazil, 27 September 2021; Association for Computing Machinery: New York, NY, USA, 2021; pp. 36–45. [Google Scholar]
Figure 1. A simple Python program computing factorial using a loop and its tree-based representations: (a) source code of the program computing factorial, “*=” is the compound assignment operator with augmented multiplication, “-=” is the compound assignment operator with augmented subtraction; (b) control flow graph of the program visualized using Graphviz [28]; (c) AST of the program obtained using the AST module from Python standard library [27] and visualized using Graphviz [28].
Computers 13 00075 g001
Figure 2. The comparison of CycC and CogC metric rule sets applied to the AST of the code in Table 1: (a) visualization of simple increments in the CycC metric, CycC = 6; (b) visualization of simple increments, nesting level increases, and nesting increments in the CogC metric, CogC = 9.
Computers 13 00075 g002
Figure 3. The count of programs that exceed either CycC or CogC but not both, per task type.
Computers 13 00075 g003
Figure 4. A comparison of the count of programs that exceed both complexity metrics, the count of programs that exceed one of the two complexity metrics, and the count of programs that do not exceed either CycC or CogC.
Computers 13 00075 g004
Figure 5. A comparison of the count of programs that exceed all complexity metrics (CycC, CogC, EduC), the count of programs that exceed one of the three complexity metrics, and the count of programs that pass the complexity checks using all metrics.
Computers 13 00075 g005
Figure 6. Histograms of occurrence frequencies of CogC, CycC, and EduC metric values for programs solving unique programming exercises [45].
Computers 13 00075 g006
Figure 7. Histograms of occurrence frequencies of CogC, CycC, and EduC metric values for programs solving unique programming exercises [45], logarithmic scale.
Computers 13 00075 g007
Figure 8. Histograms of occurrence frequencies of the min–max-scaled (3) values of the CogC, CycC, and EduC metrics for programs solving unique programming exercises [45], logarithmic scale.
Computers 13 00075 g008
Figure 9. Violin plots of occurrence frequencies of CogC, CycC, and EduC metric values for programs solving unique programming exercises of 11 different types [45]: (a) complexity distributions for tasks from 1 to 5; (b) complexity distributions for tasks from 6 to 11.
Computers 13 00075 g009
Figure 10. A comparison of program counts rejected by CycC, CogC, and EduC.
Computers 13 00075 g010
Figure 11. The user interface of the task submission page in the DTA system [25]: (a) example of a report generated based on code complexity analysis performed using the specialized implementation of Algorithm 1 with rules listed in Table 2, Table 3, Table 4 and Table 6; (b) example of task submission page UI when a program was successfully checked and accepted by the DTA system.
Computers 13 00075 g011
Figure 12. The user interface of the Visual Studio Code® editor highlighting complexity increments based on the output of the EduC complexity analyzer described using the developed eDSL: (a) a sample program from the dataset solving task of type 4; (b) refactored version of the program with reduced EduC metric value.
Computers 13 00075 g012
Table 1. Comparison of CycC [22] and CogC [23] code metrics on a sample Python program.
Line No.Source CodeCycCCogC
1.def main():+1
2. try:
3.  if condition1:+1+1 (nesting = 0)
4.   for i in range(10):+1+2 (nesting = 1)
5.    while condition2:+1+3 (nesting = 2)
6.     pass
7. except Exception as e:+1+1 (nesting = 0)
8.  if condition2:+1+2 (nesting = 1)
9.   pass
  Total complexity:69
Table 2. Simple increments in the CogC metric for Python, the R 1 set of rules in Algorithm 1.
Rule No.DescriptionThe Predicate r n , n p The Mapping w n , M
1.Conditional operator
with two branches
t n = I f n . o r e l s e > 0 ¬ n . o r e l s e = 1 t n . o r e l s e 0 = I f . 1.
2.Recursive function t n F u n c t i o n D e f , A s y n c F u n c t i o n D e f n c V n : ( t n c = C a l l t n c . f u n c = N a m e n c . f u n c . i d = n . n a m e ) 1.
3.Branching in loops and
Error-handling operators
t n F o r , A s y n c F o r ,   W h i l e ,   T r y n . o r e l s e > 0 . 1.
4.Control flow breakers t n = ListComp , DictComp , SetComp , GeneratorExp , For , AsyncFor , While , Match , ExceptHandler , IfExp , If .1.
5.Generators and branching
in generators
t n ListComp , DictComp , SetComp , GeneratorExp . n g G n g . i f s , where
G = n . g e n e r a t o r s .
6.A chain of Boolean operators t n = B o o l O p . 1.
Table 3. Nesting level increases in the CogC metric for Python, the R 2 set of rules in Algorithm 1.
Rule No.DescriptionThe Predicate r ( n , n p ) The Mapping w n , M
1.A conditional operator
which is not an else-if
t n = I f ¬ ( t n p = I f n p . o r e l s e = 1 n p . o r e l s e 0 = n ) . 1.
2.A function which is not
a simple decorator
t n F ¬ n . b o d y = 2 t n . b o d y 0 F t n . b o d y 1 = R e t u r n , where F = F u n c t i o n D e f ,   A s y n c F u n c t i o n D e f .1.
3.A syntactic construct which increases the nesting level t n ListComp , DictComp , SetComp , GeneratorExp , For , AsyncFor , While , Match , ExceptHandler , IfExp , With , AsyncWith , ClassDef , Lambda .1.
Table 4. Nesting increments in the CogC metric for Python, the R 3 set of rules in Algorithm 1.
Rule No.DescriptionThe Predicate r n , n p The Mapping w n , M
1.A conditional operator
which is not an else-if
t n = I f ¬ ( t n p = I f n p . o r e l s e = 1 n p . o r e l s e 0 = n ) . 1.
2.Control flow breaker t n ListComp , DictComp , SetComp , GeneratorExp , For , AsyncFor , While , Match , ExceptHandler , IfExp .1.
Table 5. Simple increments in the CycC metric for Python, the R 1 set of rules in Algorithm 1.
Rule No.DescriptionThe Predicate r n , n p The Mapping w n , M
1.Exception handling t n = T r y . n . h a n d l e r s + a , where
a = 1 ,   n . o r e l s e > 0 0 ,   n . o r e l s e = 0 .
2.Every Boolean operator t n = B o o l O p . n . v a l u e s 1 .
3.Pattern matching t n = M a t c h . n . c a s e s .
4.Generators and branching
in generators
t n ListComp , DictComp , SetComp , GeneratorExp . n g G n g . i f s + 1 , where G = n . g e n e r a t o r s .
5.Control flow breakers t n F o r , A s y n c F o r ,   W h i l e . 1 + a , where
a = 1 ,   n . o r e l s e > 0 0 ,   n . o r e l s e = 0 .
6.Conditional operators and function definition t n If , IfExp , FunctionDef , AsyncFunctionDef .1.
Table 6. Additional simple increment R 1 rules used in the EduC metric for Python.
Rule No.DescriptionThe Predicate r n , n p The Mapping w n , M
1.Distinct Boolean operators t n = B o o l O p . max 0 ,   n . v a l u e s 2 .
2.Pattern-matching cases t n = M a t c h . max 0 ,   n . c a s e s 1 .
3.Function body t n F u n c t i o n D e f , A s y n c F u n c t i o n D e f . 1.
4.Loop iteration stop t n C o n t i n u e , B r e a k .1.
5.Variable reuse in assignment statement or expression t n Assign , AnnAssign , NamedExpr . D , U = Algorithm 2 n ;
s = d : d D d M d U ;
M M D ;
Return s.
6.Augmented assignment t n = A u g A s s i g n . D , U Algorithm 2 n ;
M M D ;
Return 0.
7.Variable definition t n = N a m e t n . c t x = S t o r e . M M n . i d ;
Return 0.
8.Argument definition t n = a r g . M M n . a r g ;
Return 0.
Table 7. The comparison of CycC, CogC, and EduC code metrics.
Line No.Source CodeCycCCogCEduC
1.def add_version(entry, txn):+1+1
2. ti = persistit.transaction()
3. while True:+1+1 (nesting = 0)+1 (nesting = 0)
4.  try:
5.   if first is not None:+1+2 (nesting = 1)+2 (nesting = 1)
6.    if first.version() > entry.version():+1+3 (nesting = 2)+3 (nesting = 2)
7.     raise RollbackException()
8.    if txn.active():+1+3 (nesting = 2)+3 (nesting = 2)
9.     for e in e.get_previous():+1+4 (nesting = 3)+4 (nesting = 3)
10.      version = e.version()
11.      depends = ti.depenency(version, txn.status, 0)
12.      if depends == TimedOut:+1+5 (nesting = 4)+5 (nesting = 4)
13.       raise RetryException()
14.      if depends != 0 \+1+5 (nesting = 4)+5 (nesting = 4)
15.       and depends != Aborted:+1+1+1
16.       raise RollbackException()
17.   entry.set_previous(first)
18.   first = entry
19.   break+1
20.  except RetryException as re:+2 (nesting = 1)+2 (nesting = 1)
21.   try:
22.    depends = persistit.transaction()+1 (variable reuse)
23.    if depends != 0 \+1+3 (nesting = 2)+3 (nesting = 2)
24.     and depends != Aborted:+1+1+1
25.     raise RollbackException()
26.   except InterruptedException as ie:+3 (nesting = 2)+3 (nesting = 2)
27.    raise PersistitInterruptedException(ie)
28.  except InterruptedException as ie:+2 (nesting = 1)+2 (nesting = 1)
29.   raise PersistitInterruptedException(ie)
 Total complexity:143538
Disclaimer/Publisher’s Note: The statements, opinions and data contained in all publications are solely those of the individual author(s) and contributor(s) and not of MDPI and/or the editor(s). MDPI and/or the editor(s) disclaim responsibility for any injury to people or property resulting from any ideas, methods, instructions or products referred to in the content.

