MRI Breast Tumor Segmentation Using Different Encoder and Decoder CNN Architectures


Computer Science Unit, Faculty of Engineering, University of Mons, Place du Parc, 20, 7000 Mons, Belgium
*
Author to whom correspondence should be addressed.
Computers 2019, 8(3), 52; https://0-doi-org.brum.beds.ac.uk/10.3390/computers8030052
Submission received: 18 June 2019
/
Revised: 27 June 2019
/
Accepted: 28 June 2019
/
Published: 29 June 2019
(This article belongs to the Special Issue Advances and Innovations in Cloud Computing Technologies and Applications (CloudTech 2018))
Abstract
:Breast tumor segmentation in medical images is a decisive step for diagnosis and treatment follow-up. Automating this challenging task helps radiologists to reduce the high manual workload of breast cancer analysis. In this paper, we propose two deep learning approaches to automate the breast tumor segmentation in dynamic contrast-enhanced magnetic resonance imaging (DCE-MRI) by building two fully convolutional neural networks (CNN) based on SegNet and U-Net. The obtained models can handle both detection and segmentation on each single DCE-MRI slice. In this study, we used a dataset of 86 DCE-MRIs, acquired before and after two cycles of chemotherapy, of 43 patients with local advanced breast cancer, a total of 5452 slices were used to train and validate the proposed models. The data were annotated manually by an experienced radiologist. To reduce the training time, a high-performance architecture composed of graphic processing units was used. The model was trained and validated, respectively, on 85% and 15% of the data. A mean intersection over union (IoU) of 68.88 was achieved using SegNet and 76.14% using U-Net architecture.
1. Introduction
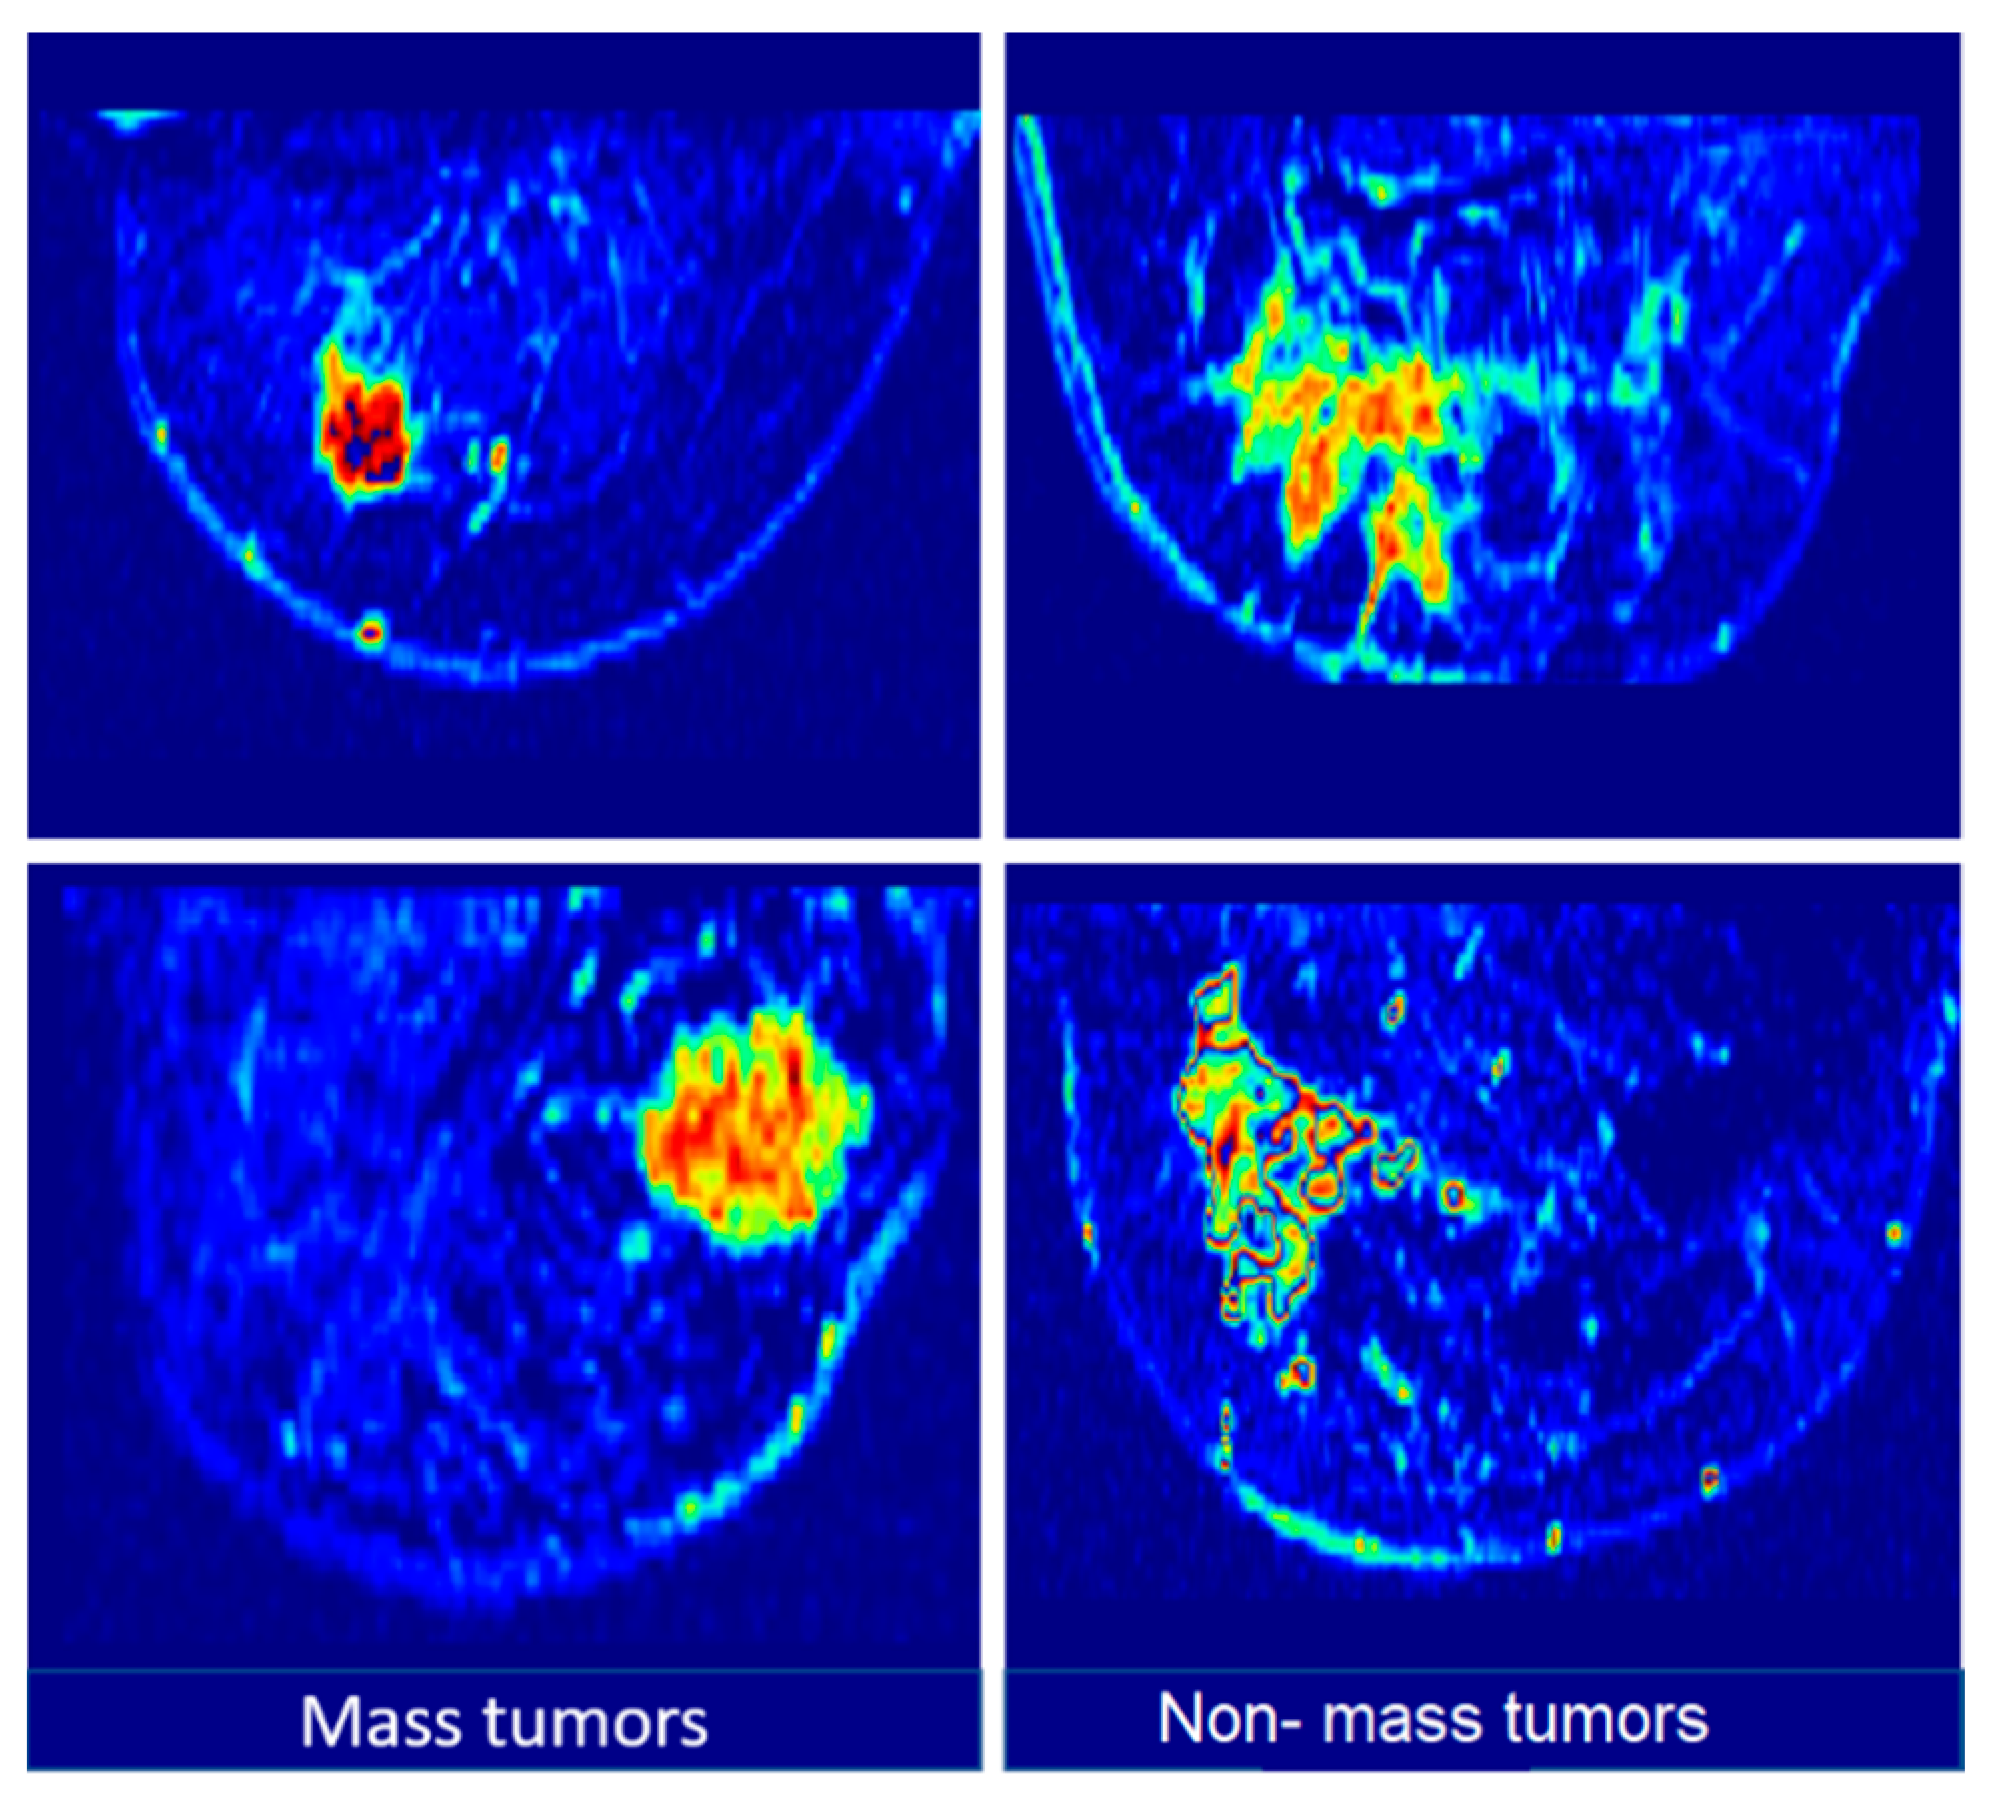
Breast cancer is one of the most common cancers in the world. In the last years, a high number of breast medical examinations have been collected, which allowed for the development of several medical imaging techniques, such as tumor localization and segmentation [1]. These tasks aim to separate the tumor from the normal breast tissue, which can provide valuable information for further analysis. The most used medical imaging modalities for breast cancer detection and diagnosis are mammography and magnetic resonance imaging (MRI). Mammography is more dedicated to the early stage detection of breast tumors. Deep learning-based techniques have been successfully applied to the analysis of mammograms thanks to the availability of a relatively large dataset [2]. In this context, Zhu et al. [3] proposed a deep multi-instance network for whole mammogram classification without segmenting the tumor area. Yang et al. [4,5] proposed a tumor detection system for digital mammograms which integrates a visual saliency model based on a deep learning approach. Yang et al. [6] used mammography images to provide an autoencoder deep learning model analyzing the breasts’ asymmetry. Furthermore, MRI provides Several subsequences such as Dynamic Contrast-Enhanced of Magnetic Resonance Imaging (DCE-MRI). This sequence is based on the injection of a para-magnetic contrast agent during the MRI exam [7]. This allows for the production of images with local high intensity on the tumor area (cf. Figure 1). This type of MRI subsequence has a functional role. Indeed, it allows a high precision of breast tumor follow-up.
Breast tumor segmentation based on DCE-MRI remains an important task for several breast tumor routines. For example, for tumor-response prediction to chemotherapy, it is necessary to go through a tumor segmentation step [8,9,10]. Currently, many manual or semi-automatic tumor annotation techniques are used [11,12]. These methods are time-consuming and can drive too many inter and intra user variabilities. In this paper, we used two deep neural networks based on U-Net and SegNet architectures [13,14], which were successfully applied to image segmentation problems. These two architectures provide the potential to produce accurate models even with relatively small datasets. In fact, the U-Net method improved the idea of a fully convolutional neural network (CNN) [15] by comprising regular CNN layers followed by up-sampling ones.
2. Related Work
Detection and segmentation of objects in medical images is a common task in clinical diagnosis. In the literature, several deep learning-based computer-aided detection (CAD) systems were developed for tumor detection and segmentation. One of the first object detection systems using convolution neural networks (CNNs) was proposed in 1995. In this research, the authors used a CNN with four layers to detect nodules in X-ray images [16]. In general, deep learning-based tumor localization and segmentation used a voxel/pixel classification. Authors in [17] used a 3D CNN to detect micro-bleeds in brain MR images. In general, machine learning-based methods rely heavily on data annotation, which is done manually or semi-automatically. Authors in [18] explored poorly-supervised deep learning for the detection of nodules in chest X-rays and lesions in mammography. Breast tumor segmentation using deep learning has been applied in many medical imaging applications [19,20,21,22,23,24]. The authors in [19] used a segmentation approach based on U-Net architecture. The proposed technique has been validated on a dataset of 66 breast T1-MR breast images. Authors in [20] trained a single fCNN to segment the pectoral muscle in breast MRI using 34 T1-MR breast images. In the literature, there is a few researches using CNNs for breast DCE-MRI analysis. In addition, when large data sets are available, good results can be obtained. The most used metrics in the state of the art of medical image segmentation and classification by neural networks are the intersection over union (IoU) metric, described in Equation (1), and dice similarity coefficient (DCS) (Equation (2)). The IoU metric or Jaccard index consists of quantifying the percent of overlap between the mask of ground truth and the predicted output mask. This metric is closely related to the dice similarity coefficient which is often used as an accuracy function during training.
where TP: True Positive, FP: False Positive, TN: True Negative and FN: False Negative.
Table 1 presents an overview of recent methods (since 2016) using convolutional neural network for different medical image segmentation problems.
3. Material and Methods
3.1. Dataset
Participants in this study were selected from a breast MRI database retrospectively collected at our collaborator institution (Jules Bordet institute—Brussels, Belgium). A cohort of 43 adult patients with pathologically-confirmed breast cancer was used to realize this study. In this dataset, all patients have tumors larger than 2 cm and received neoadjuvant chemotherapy. These patients received pre-treatment and post-treatment imaging between 2002 and 2010. Therefore, 86 volumes were exploited. After the first cycle of chemotherapy, all tumors were visible with a gradual change in intensity and size. The patients’ median age was 51 years (between 25 and 82). A total of 30 patients (60 volumes) were used to directly train the proposed encoder–decoder CNN. The remaining 13 patients (26 volumes) were included as test dataset during training to evaluate the final model. Consequently, 86 volumes were used in this study. In addition, a protocol approved by the institute’s ethical committee was obtained for this dataset. The MRI exams were performed with a Siemens 1.5T MRI scanner. Each breast tumor area was annotated manually, with the help of an experiment radiologist, to create ground truth data. The images were first preprocessed using a bias field correction filter [25] followed by the selection of the breast of interest (with tumor) [26]. Annotation was performed using MITK software [27].
3.2. Data-Augmentation
We applied data augmentation to the training set using random operations of translations, rotations, flips, and scale. For each training epoch, new training samples were generated. Therefore, during 500 epochs, more than two million different samples were generated to train the deep neural network. To avoid non-real tumors for validation, only linear transformations were used.
3.3. Encoder–Decoder Architecture
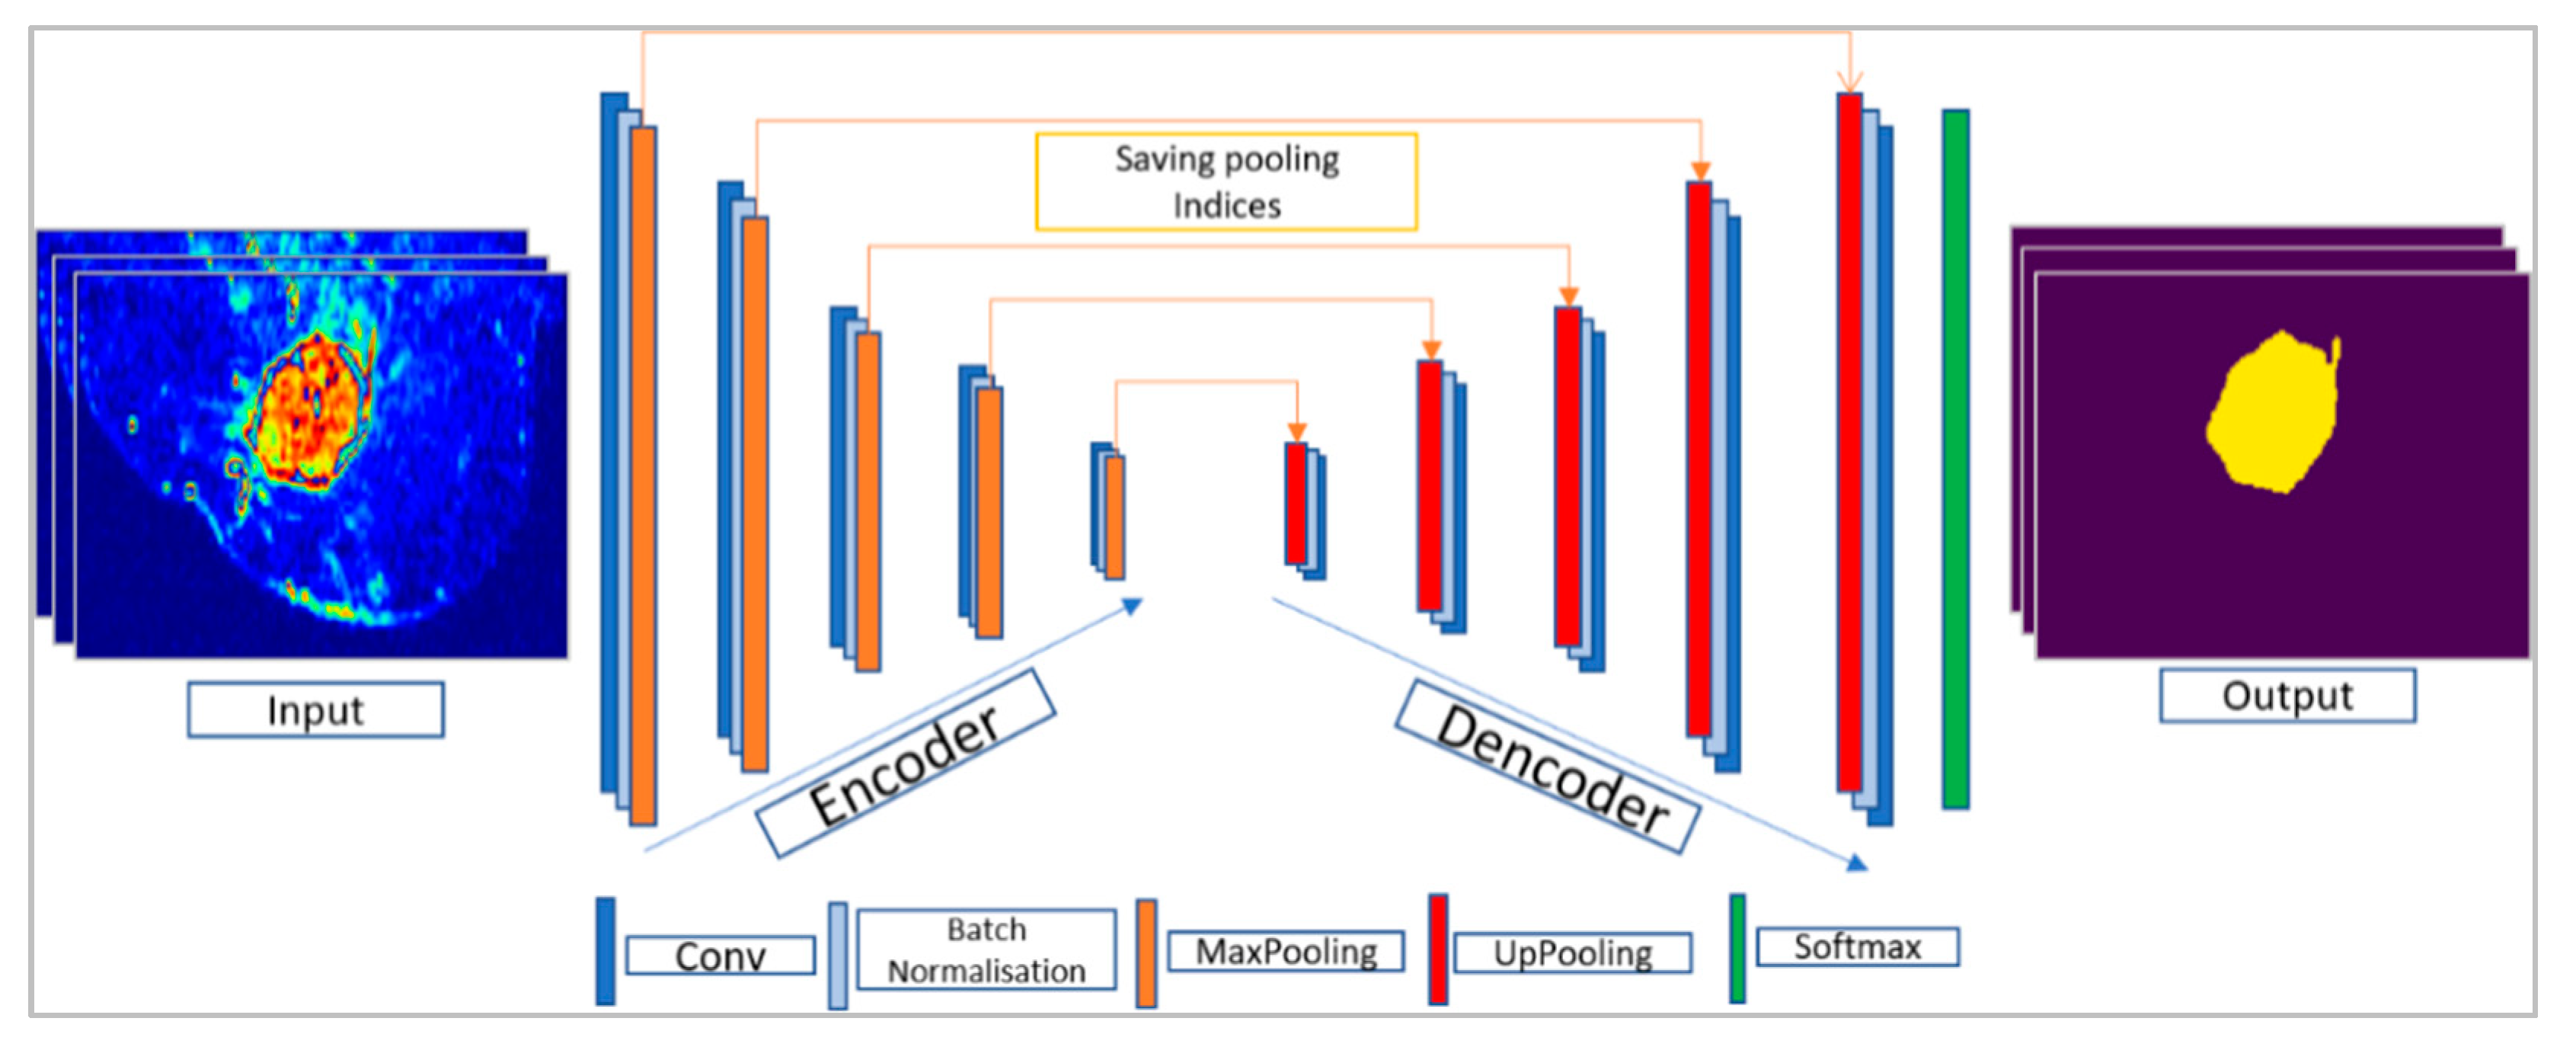
As illustrated in Figure 2, the encoder–decoder architecture is a deep fully convolutional neural network structure for pixel-wise segmentation [18]. This structure consists of an encoder network and a corresponding decoder network followed by a pixel-wise classification layer. The role of the decoder layers is to map the low resolution of the encoder layers’ features to full input resolution. This allows recovering a 2D mask containing the tumor segmentation, with the same size as the input image. In this work, we used two different encoder–decoder architectures, SegNet [14] and U-Net [13]. For each architecture, the layer’s and parameters were tuned for the segmentation of breast tumors on DCE-MR images.
3.3.1. SegNet Architecture
SegNet was designed to be an efficient CNN architecture for pixel-wise semantic segmentation for road scene understanding (cars, building, and pedestrians). The encoder layers in SegNet are inspired by the CNN layers in VGG16 [28] architecture. The decoder uses max-pooling indices stocked and sent from the corresponding encoder’s layers. This aims to perform non-linear up-sampling of their input feature maps. The advantage of reusing max-pooling indices in the decoding process is improving boundary delineation. This process can be incorporated into any encoder–decoder architecture with minimal updates. The final layer consists of a Sigmoid activation function that classify each pixel as a tumor or background. Figure 3 illustrates the used SegNet architecture.
3.3.2. U-Net Architecture
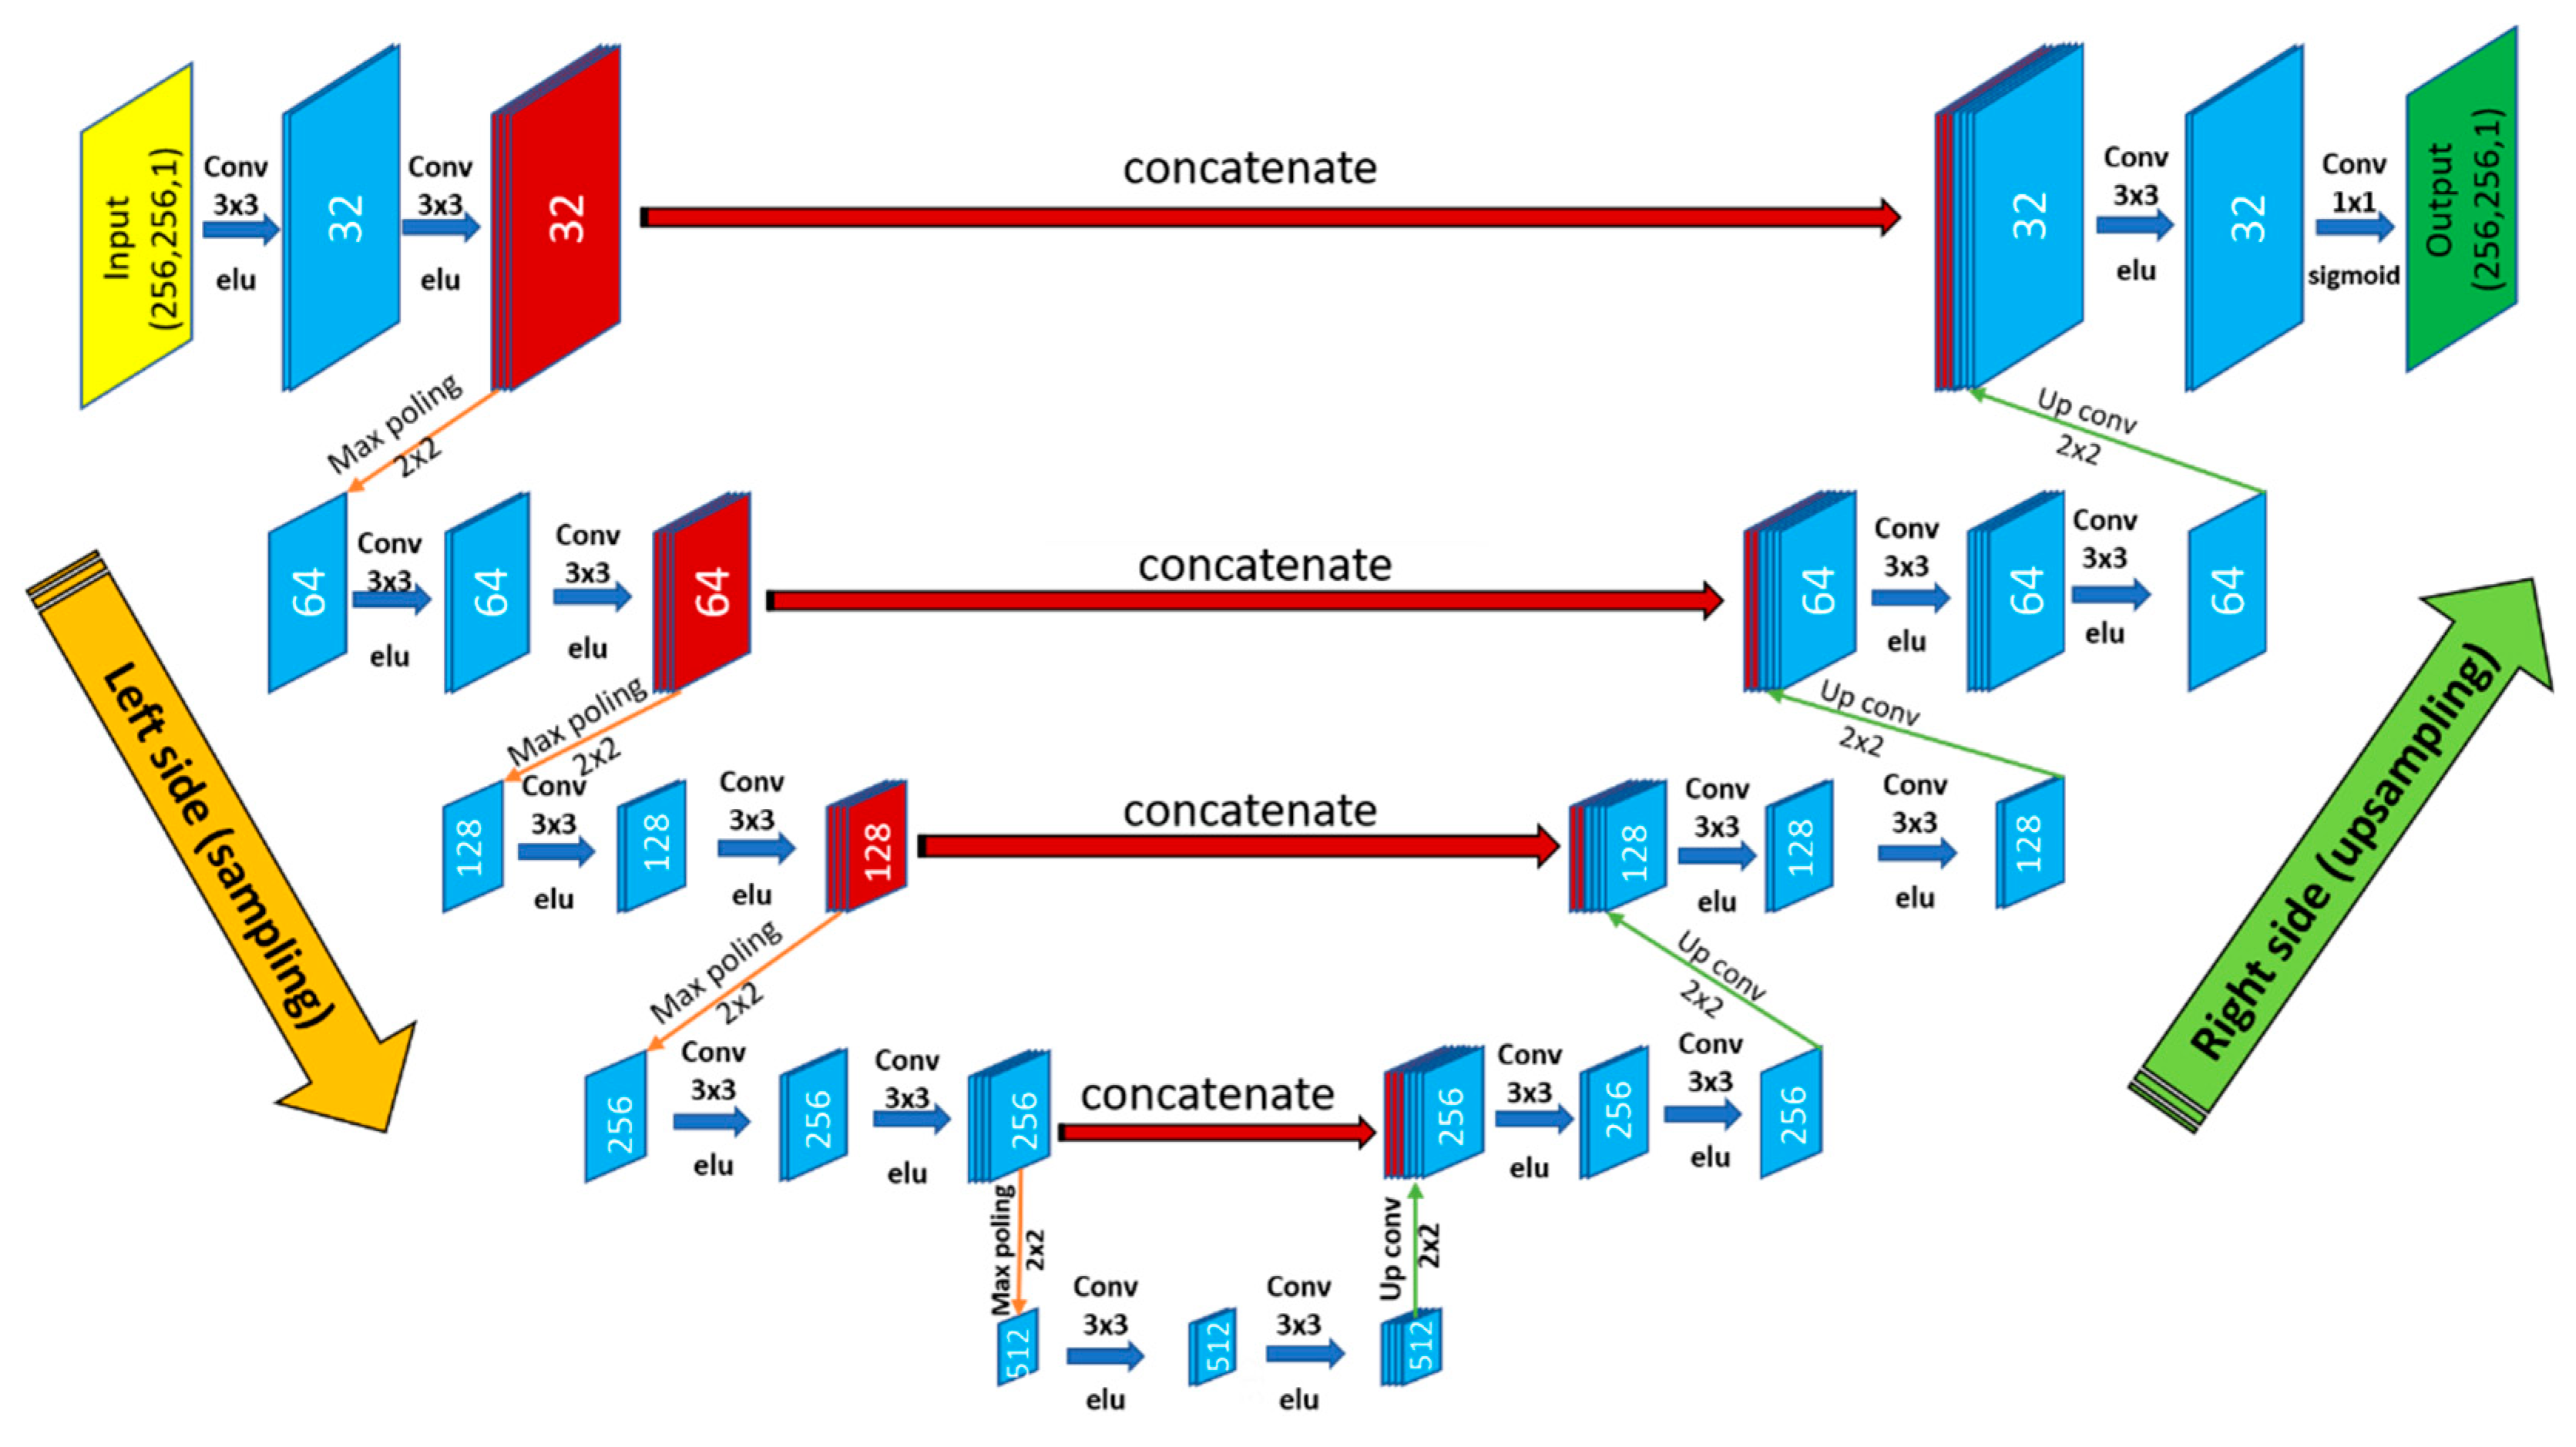
U-Net [13] is a fully convolutional neural network architecture providing a fast and precise object segmentation in 2D or 3D images [21]. One advantage of this method is its robustness even with small training data. U-Net architecture consists of two parts, first down-sampling (left side) and second up-sampling (right side). The left side is a classical fully CNN, it consists of a sequence of blocks of 3 × 3 convolutions layers followed by a rectified linear unit (ReLU) activation function and a 2 × 2 max pooling operation with two strides for down-sampling. After each block, the number of feature’s maps is doubled. On the right side, a 2 × 2 up-sampling is used, the number of features maps is divided by 2 after each block and concatenated with the corresponding feature map from the left side (contracting path), followed by a 3 × 3 convolution and a ReLU activation function. A 1 × 1 convolution is used at the final layer followed by a sigmoid activation function, in order to associate each 32-component feature vector to the desired number of classes. In our version, we had 26 convolutional layers with a total number of 9,239,681 trainable parameters. The used U-Net architecture is illustrated in Figure 4.
3.4. HPC Software and Hardware
In addition to proving the efficiency of automatic breast tumor segmentation, we were interested in providing improved performance in terms of computation time. Therefore, we used a high-performance architecture composed of graphic processing units that allowed for the exploitation of a high number of computing units in parallel [29]. In this context, we used Keras 2.2.4 API with Tenserflow 1.9.0 backend. The latter can exploit the power of GPUs based on the CUDA API (CUDA. NVIDIA Accelerated Computing) which allows efficient exploitation of the parallel architecture of GPUs. In our case, we used the following hardware:
- CPU: 16 cores, 2.10 GHz clock speed, 128 GB of RAM memory
- 4 GPUs: Nvidia P100, 3584 CUDA cores, 10.6 TeraFLOPS (performance), 16 GB of memory.
Notice that the GPU was used within the Tensorflow library for executing highly intensive steps, while the CPU was used for executing low intensive steps. The resource selection (CPUs or GPUs) was based on estimating the complexity of each step (or layer) of our deep neural network architecture. The factor of complexity was calculated by the following multiplication of four parameters [30]:
- -
- Parallel fraction: Calculated with Amdahl’s law [31] that estimates the theoretical speedup when using N processors. This law supposes that f is the part of program that can be parallelized and (1 − f) is the part that cannot be made in parallel (data transfers, dependent tasks, etc.). Indeed, high values of f can provide better performance and vice versa.
- -
- Computation per-pixel: In fact, GPUs allow for the acceleration of image processing algorithms thanks to the exploitation of the GPU’s computing units in parallel. These accelerations increase when we apply intensive treatments since the GPU is specialized for highly parallel computation. The number of operations per pixel presents a relevant factor to estimate the computation intensity.
- -
- Computation per-image: Simply computed with the multiplication of the image resolution by the computation per pixel factor.
- -
- Dependency factor: Obtained by counting the mean number of neighbors’ pixel values that are required for calculating the output values of image pixels after treatment, such as convolution, pooling, etc.
As a result, our algorithm exploited HPC material in a convenient way that allows for the acceleration of computations and the reduction of energy consumptions, since GPUs are used for highly intensive steps. In our case, the most intensive steps that were affected by GPU were: convolution and deconvolution. Moreover, we used the Docker framework [32] to deploy our application (mainly for doctors) without the need to install and configure operating systems and libraries. Notice that Docker is an open-source platform released in 2013 and is used for the creation, deployment, and management of applications. Docker is mainly based on images and containers, where images allow for the definition of the precise software packages (applications, libraries, configurations, etc.). Images can be also created by combining or modifying other standard images downloaded from public repositories. On the other hand, containers present instances of images that can be executed from each user (one user can execute one container). To summarize, Docker containers present an open-source software platform of development. Its main advantage is the ability to package applications in containers, which allows them to be portable among any system running the Linux operating system (OS).
In our case, we generated two docker images:
- -
- CPU-based docker image: Including sequential (CPU) versions of the required algorithms and libraries, such as OpenCV (Open Computer Vision Library), Tensorflow, Keras (The Python Deep Learning Library) etc.
- -
- GPU-based docker image: Including parallel (GPU) versions of the required algorithms and libraries, such as OpenCV, Tensorflow, Keras, etc.
The final training time was around 16 h 40 min using U-Net and 17 h 32 min using SegNet.
3.5. Performance Analysis
The accuracy of the predicted segmentations was calculated based on the degree of similarity between the ground truth and the outputs predicted by the two models. This similarity was performed by the mean IoU (Equation (1)). To evaluate the segmentation’s error, we used the binary cross entropy (Equation (2)).
where y is the label and p(y) is the predicted probability for all the N points (pixels).
To compare between the two performances, we used the one-sided Mann–Whitney U test [33,34], a non-parametric test where the null hypothesis checks if the two samples (ground truth and predicted segmentations) come from the same population without assuming a normal distribution. To accept the null hypothesis or not a threshold of 0.05 was fixed (95% of confidence).
4. Results
In this study, 86 volumes of DCE-MRI were used. We conducted an extended experiment to model hyper-parameter tuning using two different architectures of encoder–decoder. Table 2 shows the most important parameters and their optimal values for SegNet and U-Net.
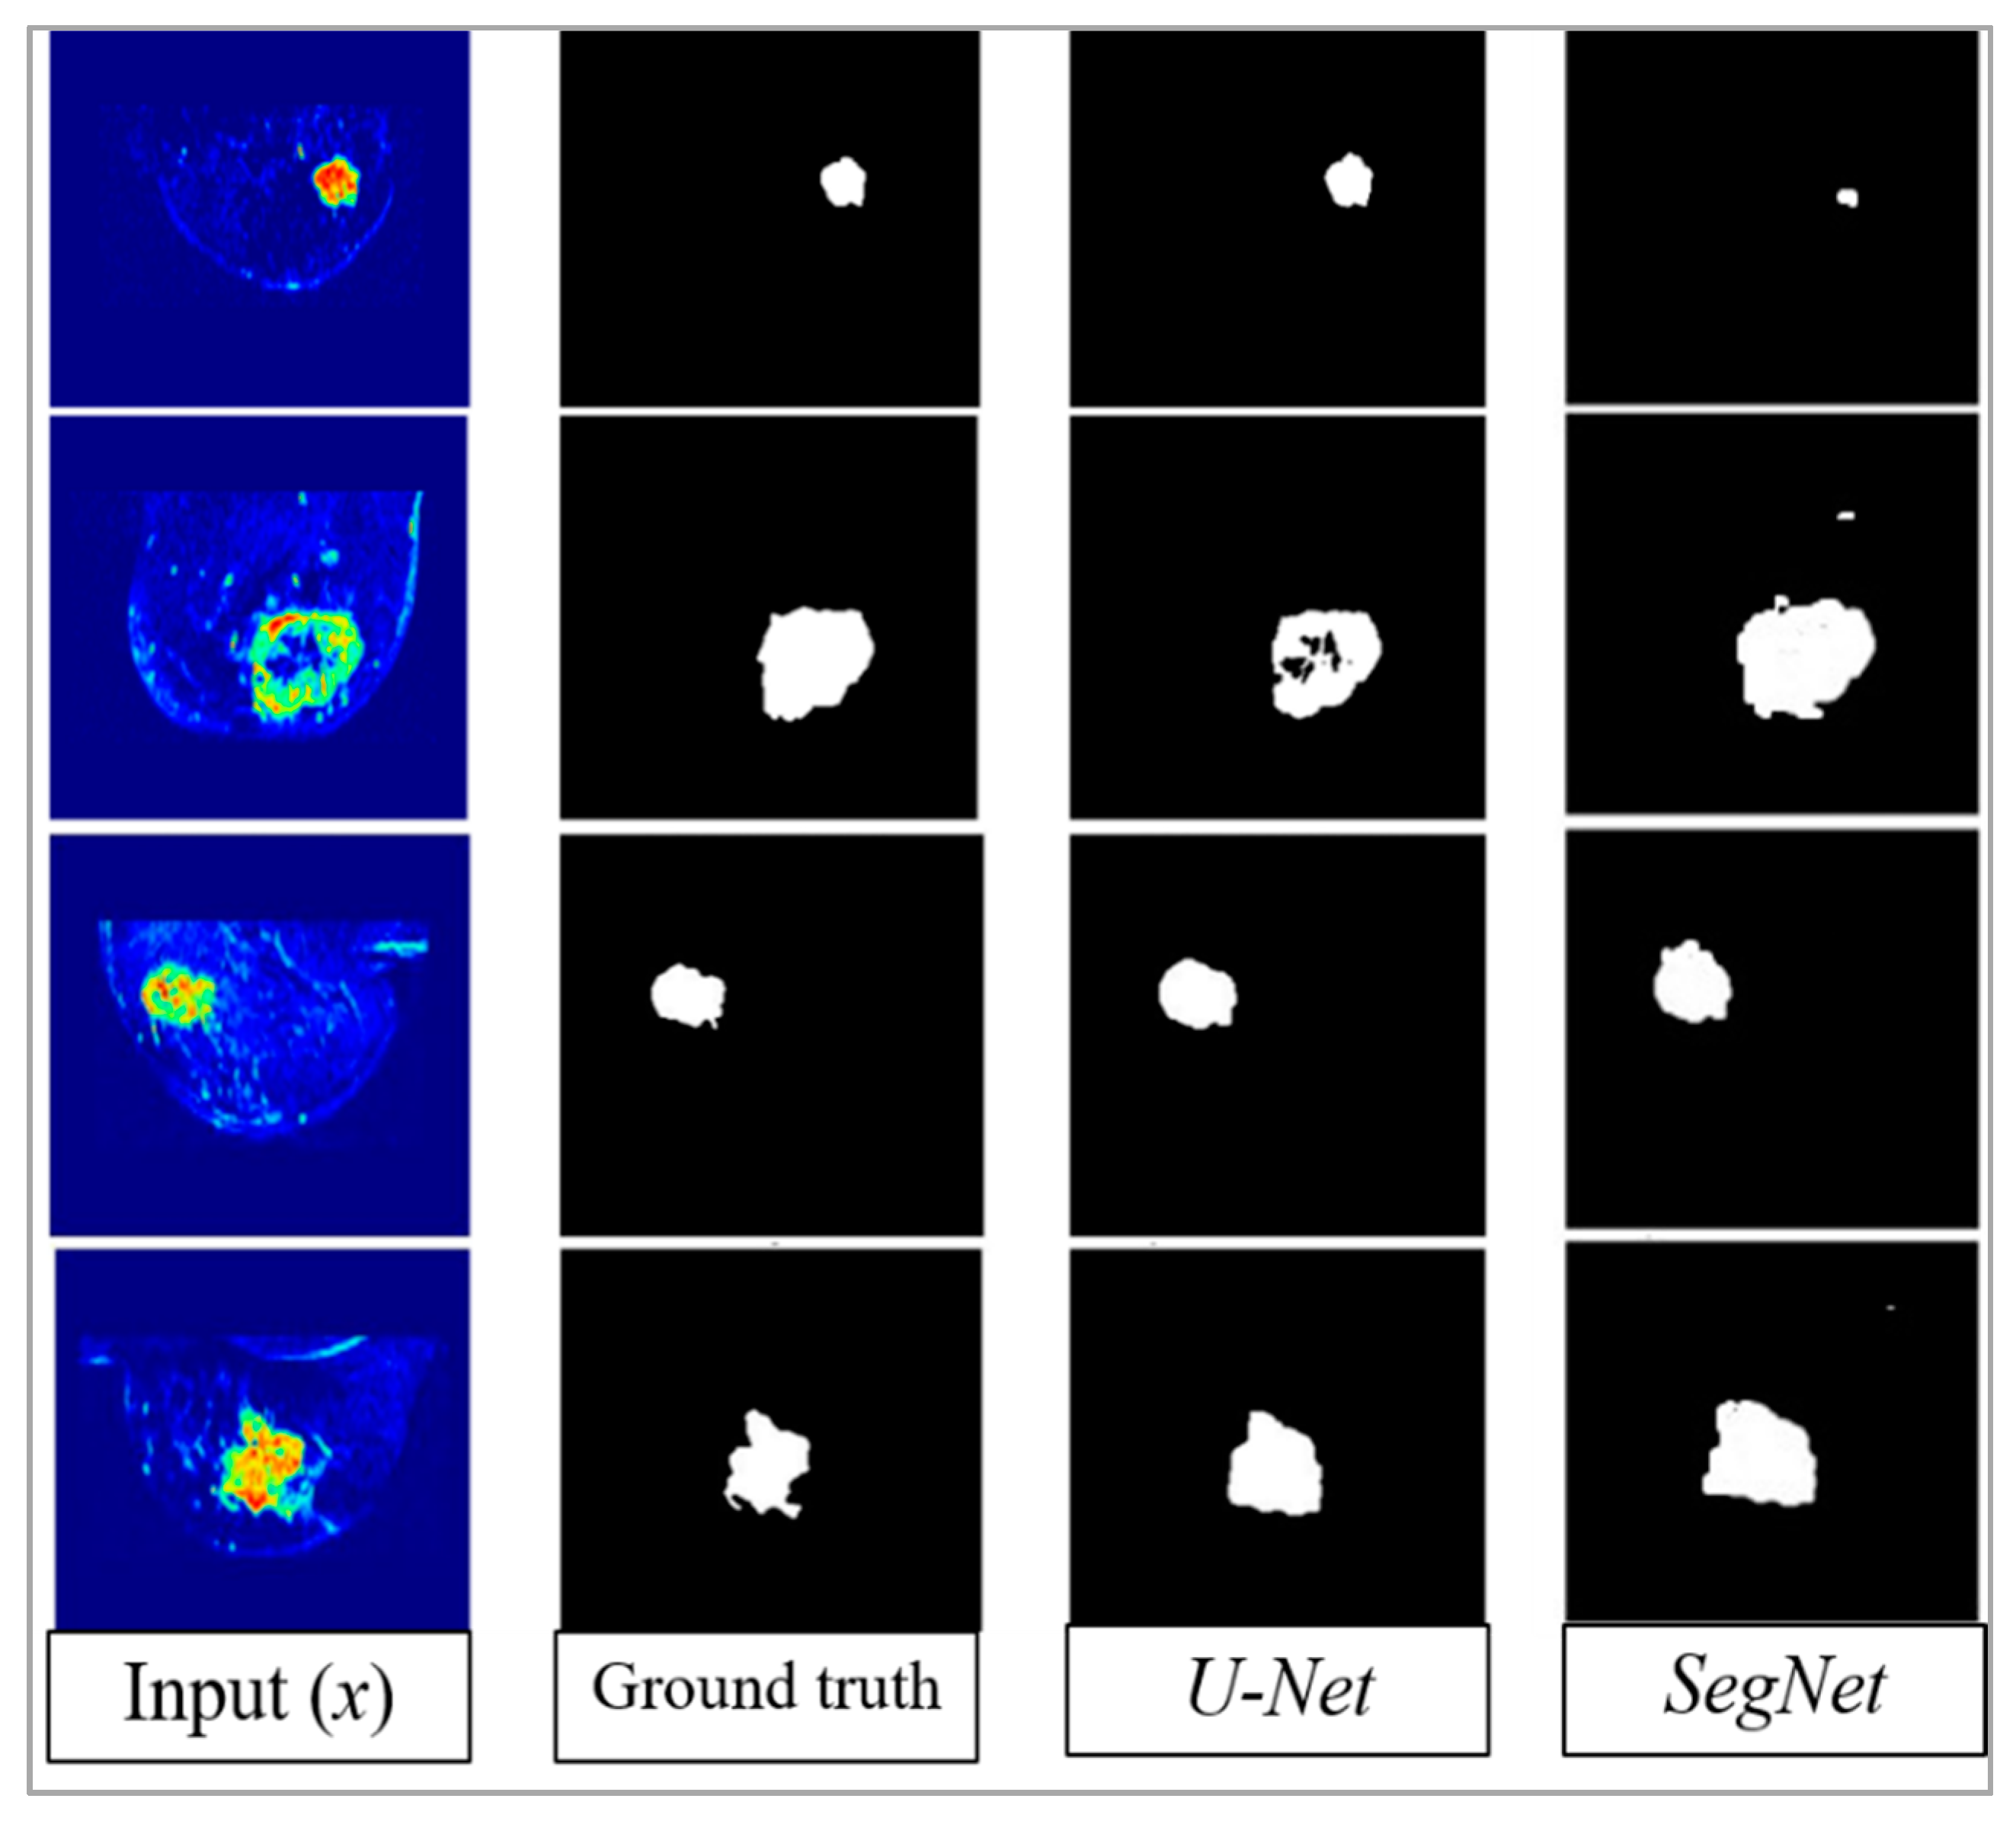
Training was conducted on the augmented 60 volumes (85%), the models were validated on the remaining 26 volumes (15%) using mean IoU as the accuracy score metric. The final mean IoU scores were 76.14% using U-Net and 68.88% using SegNet. The loss error based on binary cross entropy (Equation (3)) for U-Net and SegNet were, respectively, 0.002 and 0.053. As illustrated in Figure 5, the predicted qualitative results using U-Net were closer to the ground truth than those obtained using SegNet.
To prove if there was a statistically significant difference between the predicted segmentations provided by the two architectures and the ground truth labels, based on Mann–Whitney test, we calculated the p-values between the ground truth of the validation set (stratified 26 volumes: 1664 2D slices) and the two predicted segmentations. No significant difference was found between the U-Net predicted segmentation and the ground truth one (p-value = 0.147). However, by using SegNet, it was found that the p-value was less than the fixed cutoff (p-value = 0.045), which confirmed it failed to find a difference between the ground truth labels and the SegNet’s predicted segmentation. A p-value of 0.046 was found between the two predicted segmentations, which corroborate that the two outputs segmentations provided by U-Net and SegNet were also different according to U-test. Table 3 presents an overview of the quantitative obtained results regarding the accuracy, loss, and the p-values between the ground truth and the predicted results based on U-test.
5. Discussion
In this work, two different fully CNN encoder–decoder type architectures, namely U-Net and SegNet, were successfully implemented to perform breast tumor segmentation. A dataset of 86 volumes of DCE-MRI data was used. DCE-MRI of 13 patients (26 volumes) were used for testing the model’s performances. According to the radiologist, the predicted segmentation using U-Net showed better accuracy than the segmentation done by humans in some cases (Figure 5). However, SegNet’s qualitative results were not very close to the ground truth. This is can be explained by the fact that SegNet is more adapted to the multiclassification task such as autonomous car’s applications [35]. The main difference between the two architectures is the relation type between the convolution and deconvolution. Indeed, U-Net is based on a concatenation between features maps (convolution and deconvolution). Whereas, SegNet uses only the saved pooling indices during convolution operation. One of the limitations of this study, is that, due to the lack of data, only 2D slices were used as inputs rather than 3D volumes. This affects, artificially, the statistically significant differences between the outputs and the ground truth. Indeed, comparing performance by 2D slices can fail to consider the correlation in performance for same slices from the tumor. A last limitation of this study is that only one collaborator radiologist was working to provide the ground truth labels. It could be interesting to provide the ground truth by many radiologists.
6. Conclusion and Future Work
In this work, two different encoder–decoder architectures were tuned to tumor segmentation: SegNet and U-Net. All parameters and layers of each architecture were modified to re-train the deep neural network using DCE-MRI data. The best quantitative and qualitative results were provided by using U-Net architecture.
We plan to improve the robustness of the proposed model by adding new data, which is still undergoing annotation and is awaiting the ethics committee approval. We also plan to use the segmented tumor method as a part of an end-to-end breast cancer response to chemotherapy prediction system [36,37,38]. On the other hand, we plan to deploy the proposed model to a web-based service to provide a prospective validation [39,40]. To get users’ evaluation and validation, we plan also to explore and concept a cloud resource, to make our model available to a broader community.
Author Contributions
Conceptualization, M.E.A. and M.A.L.; data curation, formal analysis, methodology, and validation, M.E.A.; formal analysis, S.A.M. and M.A.L.; writing and reviewing original draft, M.E.A., S.A.M., M.A.L. and M.B.; supervision, M.B.
Funding
This research was funded by the University of Mons (Umons), the Faculty of Engineering, Computer Science Unit in Belgium.
Acknowledgments
We would like to express our deepest appreciation to Stylianos Drisis and all the Jules Bordet Institute members in Brussels for helping us with medical data acquisition and annotation.
Conflicts of Interest
The authors declare no conflicts of interest.
References
- Kaufmann, M.; von Minckwitz, G.; Mamounas, E.P.; Cameron, D.; Carey, L.A.; Cristofanilli, M.; Denkert, C.; Eiermann, W.; Gnant, M.; Harris, J.R.; et al. Recommendations from an international consensus conference on the current status and future of neoadjuvant systemic therapy in primary breast cancer. Ann. Surg. Oncol. 2012, 19, 1508–1516. [Google Scholar] [CrossRef] [PubMed]
- Hamidinekoo, A.; Denton, E.; Rampun, A.; Honnor, K.; Zwiggelaar, R. Deep learning in mammography and breast histology, an overview and future trends. Med. Image Anal. 2018, 47, 45–67. [Google Scholar] [CrossRef] [PubMed] [Green Version]
- Zhu, W.; Lou, Q.; Vang, Y.S.; Xie, X. Deep multi-instance networks with sparse label assignment for whole mammogram classification. In Proceedings of the International Conference on Medical Image Computing and Computer-Assisted Intervention (MICCAI 2017), Quebec City, QC, Canada, 11–13 September 2017; pp. 603–611. [Google Scholar]
- Jiao, Z.; Gao, X.; Wang, Y.; Li, J. A deep feature-based framework for breast masses classification. Neurocomputing 2016, 197, 221–231. [Google Scholar] [CrossRef]
- Hu, Y.; Li, J.; Jiao, Z. Mammographic Mass Detection Based on Saliency with Deep Features. In Proceedings of the International Conference on Internet Multimedia Computing and Service, Xi’an, China, 19–21 August 2016; pp. 292–297. [Google Scholar]
- Yang, D.; Wang, Y.; Jiao, Z. Asymmetry Analysis with Sparse Autoencoder in Mammography. In Proceedings of the International Conference on Internet Multimedia Computing and Service, Xi’an, China, 19–21 August 2016; pp. 287–291. [Google Scholar]
- Li, X.; Arlinghaus, L.R.; Ayers, G.D.; Chakravarthy, A.B.; Abramson, R.G.; Abramson, V.G.; Atuegwu, N.; Farley, J.; Mayer, I.A.; Kelley, M.C.; et al. Dce-mri analysis methods for predicting the response of breast cancer to neoadjuvant chemotherapy: Pilot study findings. Magn. Reson. Med. 2014, 71, 1592–1602. [Google Scholar] [CrossRef] [PubMed]
- El Adoui, M.; Drisis, S.; Larhmam, M.A.; Lemort, M.; Benjelloun, M. Breast cancer heterogeneity analysis as index of response to treatment using MRI images: A review. Imaging Med. 2017, 9, 109–119. [Google Scholar]
- El Adoui, M.; Drisis, S.; Benjelloun, M. A PRM approach for early prediction of breast cancer response to chemotherapy based on registered MR images. Int. J. Comput. Assist. Radiol. Surg. 2018, 13, 1233–1243. [Google Scholar] [CrossRef] [PubMed]
- Benjelloun, M.; El Adoui, M.; Larhmam, M.A.; Mahmoudi, S.A. Automated Breast Tumor Segmentation in DCE-MRI Using Deep Learning. In Proceedings of the 2018 4th International Conference on Cloud Computing Technologies and Applications (Cloudtech), Brussels, Belgium, 26–28 November 2018; pp. 1–6. [Google Scholar]
- Chen, W.; Giger, M.L.; Bick, U. A fuzzy c-means (FCM)-based approach for computerized segmentation of breast lesions in dynamic contrast-enhanced MR images1. Acad. Radiol. 2006, 13, 63–72. [Google Scholar] [CrossRef] [PubMed]
- Nie, K.; Chen, J.H.; Hon, J.Y.; Chu, Y.; Nalcioglu, O.; Su, M.Y. Quantitative analysis of lesion morphology and texture features for diagnostic prediction in breast MRI. Acad. Radiol. 2008, 15, 1513–1525. [Google Scholar] [CrossRef]
- Ronneberger, O.; Fischer, P.; Brox, T. U-net: Convolutional networks for biomedical image segmentation. In Proceedings of the International Conference on Medical image computing and computer-assisted intervention (MICCAI 2015), Munich, Germany, 5–9 October 2015; pp. 234–241. [Google Scholar]
- Badrinarayanan, V.; Kendall, A.; Cipolla, R. SegNet: A Deep Convolutional Encoder-Decoder Architecture for Image Segmentation. IEEE Trans. Pattern Anal. Mach. Intell. 2017, 39, 2481–2495. [Google Scholar] [CrossRef]
- Long, J.; Shelhamer, E.; Darrell, T. Fully convolutional networks for semantic segmentation. In Proceedings of the IEEE conference on computer vision and pattern recognition (CVPR 2015), Boston, MA, USA, 7–12 June 2015; pp. 3431–3440. [Google Scholar]
- Lo, S.C.B.; Lou, S.L.A.; Lin, J.S.; Freedman, M.T.; Chien, M.V.; Mun, S.K. Artificial convolution neural network techniques and applications for lung nodule detection. IEEE Trans. Med. Imaging 1995, 14, 711–718. [Google Scholar] [CrossRef]
- Dou, Q.; Chen, H.; Yu, L.; Zhao, L.; Qin, J.; Wang, D.; Mok, V.C.; Shi, L.; Heng, P.A. Automatic detection of cerebral microbleeds from MR images via 3D convolutional neural networks. IEEE Trans. Med. Imaging 2016, 35, 1182–1195. [Google Scholar] [CrossRef] [PubMed]
- Hwang, S.; Kim, H.E. Self-transfer learning for fully weakly supervised object localization. arXiv 2016, arXiv:1602.01625. [Google Scholar]
- Dalmıs¸, M.U.; Litjens, G.; Holland, K.; Setio, A.; Mann, R.; Karssemeijer, N.; Gubern-M´erida, A. Using deep learning to segment breast and fibroglandular tissue in MRI volumes. Med. Phys. 2017, 44, 533–546. [Google Scholar] [CrossRef] [PubMed]
- Moeskops, P.; Wolterink, J.M.; van der Velden, B.H.; Gilhuijs, K.G.; Leiner, T.; Viergever, M.A.; Iˇsgum, I. Deep learning for multitask medical image segmentation in multiple modalities. In Proceedings of the International Conference on Medical Image Computing and Computer-Assisted Intervention (MICCAI 2016), Athens, Greece, 17–21 October 2016; pp. 478–486. [Google Scholar]
- Milletari, F.; Navab, N.; Ahmadi, S.A. V-net: Fully convolutional neural networks for volumetric medical image segmentation. In Proceedings of the 2016 Fourth International Conference on 3D Vision (3DV), Stanford, CA, USA, 25–28 October 2016; pp. 565–571. [Google Scholar]
- Christ, P.F.; Elshaer, M.E.A.; Ettlinger, F.; Tatavarty, S.; Bickel, M.; Bilic, P.; Rempfler, M.; Armbruster, M.; Hofmann, F.; D’Anastasi, M.; et al. Automatic liver and lesion segmentation in CT using cascaded fully convolutional neural networks and 3d conditional random fields. In Proceedings of the International Conference on Medical Image Computing and Computer Assisted Intervention (MICCAI 2016), Athens, Greece, 17–21 October 2016; pp. 415–423. [Google Scholar]
- Kamnitsas, K.; Ledig, C.; Newcombe, V.F.J.; Simpson, J.P.; Kane, A.D.; Menon, D.K.; Rueckert, D.; Glocker, B. Efficient multi-scale 3D CNN with fully connected crf for accurate brain lesion segmentation. Med. Image Anal. 2017, 36, 61–78. [Google Scholar] [CrossRef] [PubMed]
- Zhao, G.; Liu, F.; Oler, J.A.; Meyerand, M.E.; Kalin, N.H.; Birn, R.M. Bayesian convolutional neural network based MRI brain extraction on nonhuman primates. Neuroimage 2018, 175, 32–44. [Google Scholar] [CrossRef] [PubMed]
- Tustison, N.J.; Avants, B.B.; Cook, P.A.; Zheng, Y.; Egan, A.; Yushkevich, P.A.; Gee, J.C. N4ITK: Improved N3 bias correction. IEEE Trans. Med Imaging 2010, 29, 1310. [Google Scholar] [CrossRef] [PubMed]
- Adoui, M.E.; Drisis, S.; Benjelloun, M. Analyzing breast tumor heterogeneity to predict the response to chemotherapy using 3d MR images registration. In Proceedings of the 2017 International Conference on Smart Digital Environment, Rabat, Morocco, 21–23 July 2017; pp. 56–63. [Google Scholar]
- Wolf, I.; Vetter, M.; Wegner, I.; Nolden, M.; Bottger, T.; Hastenteufel, M.; Schobinger, M.; Kunert, T.; Meinzer, H.P. The medical imaging interaction toolkit (mitk): A toolkit facilitating the creation of interactive software by extending vtk and itk. In Proceedings of the Medical Imaging 2004: Visualization, Image-Guided Procedures, and Display, San Diego, CA, USA, 14–19 February 2004; Volume 5367, pp. 16–28. [Google Scholar]
- Simonyan, K.; Zisserman, A. Very deep convolutional networks for large-scale image recognition. arXiv 2014, arXiv:1409.1556. [Google Scholar]
- Mahmoudi, S.A.; EOzkan, E.; Manneback, P.; Tosun, S. Taking advantage of heterogeneous platforms in image and video processing. High-Perform. Comput. Complex Environ. 2014, 95, 429–449. [Google Scholar]
- Mahmoudi, S.A.; Manneback, P. Efficient exploitation of heterogeneous platforms for images features extraction. In Proceedings of the 3rd International Conference on Image Processing Theory, Tools and Applications (IPTA), Istanbul, Turkey, 15–18 October 2012; pp. 91–96. [Google Scholar]
- Grama, A.; Kumar, V.; Gupta, A.; Karypis, G. Introduction to Parallel Computing. Available online: http://cse.csusb.edu/ykarant/courses/sp2006/csci525-625/slides/gramma-et-al/karypis/parbook/Lectures/GK-CS5451/Chapter%203%20-%20Principles%20of%20Parallel%20Algorithm%20Design.pdf (accessed on 18 June 2019).
- Merkel, D. Docker: Lightweight Linux containers for consistent development and deployment. Linux J. 2014, 239, 2. [Google Scholar]
- Nachar, N. The Mann-Whitney U: A test for assessing whether two independent samples come from the same distribution. Tutor. Quant. Methods Psychol. 2008, 4, 13–20. [Google Scholar] [CrossRef]
- McKnight, P.E.; Najab, J. Mann-Whitney U Test. Corsini Encycl. Psychol. 2010. [Google Scholar] [CrossRef]
- Treml, M.; Arjona-Medina, J.; Unterthiner, T.; Durgesh, R.; Friedmann, F.; Schuberth, P.; Mayr, A.; Heusel, M.; Hofmarcher, M.; Widrich, M.; et al. Speeding up semantic segmentation for autonomous driving. In Proceedings of the MLITS, NIPS Workshop, Barcelona, Spain, 9 December 2016; Volume 1, p. 5. [Google Scholar]
- El Adoui, M.; Larhmam, M.A.; Drisis, S.; Benjelloun, M. Deep Learning approach predicting breast tumor response to neoadjuvant treatment using DCE-MRI volumes acquired before and after chemotherapy. In Proceedings of the Medical Imaging 2019: Computer-Aided Diagnosis, San Diego, CA, USA, 16–21 February 2019; Volume 10950, p. 109502I. [Google Scholar]
- El Adoui, A.; Drisis, S.; Benjelloun, M. Predict Breast Tumor Response to Chemotherapy Using a 3D Deep Learning Architecture Applied to DCE-MRI Data. In Proceedings of the International Work-Conference on Bioinformatics and Biomedical Engineering (IWBBIO 2019), Granada, Spain, 8–10 May 2019; pp. 33–40. [Google Scholar]
- Vulchi, M.; El Adoui, M.; Braman, N.; Turk, P.; Etesami, M.; Drisis, S.; Plecha, D.; Benjelloun, M.; Madabhushi, A.; Abraham, J. Development and external validation of a deep learning model for predicting response to HER2-targeted neoadjuvant therapy from pretreatment breast MRI. J. Clin. Oncol. 2019, 37, 593. [Google Scholar] [CrossRef]
- Mahmoudi, S.A.; Belarbi, M.A.; Mahmoudi, S.; Belalem, G. Towards a smart selection of resources in the cloud for low-energy multimedia processing. Concurr. Comput. Pract. Exp. 2018, 30, e4372. [Google Scholar] [CrossRef]
- Mahmoudi, S.A.; El Adoui, M.; Belarbi, M.A.; Larhmam, M.A.; Lecron, F. Cloud-based platform for computer vision applications. In Proceedings of the 2017 International Conference on Smart Digital Environment, ICSDE ’17, Rabat, Morocco, 21–23 July 2017; pp. 195–200. [Google Scholar]
Figure 1.
Examples of Dynamic Contrast Enhanced (DCE-MRI) slices with color map of patients with breast cancer: mass tumor (left), non-mass tumor (right).
Figure 1.
Examples of Dynamic Contrast Enhanced (DCE-MRI) slices with color map of patients with breast cancer: mass tumor (left), non-mass tumor (right).

Figure 2.
Illustration of an encoder–decoder architecture.

Figure 3.
SegNet simplified Architecture.

Figure 4.
The used U-Net architecture.

Figure 5.
U-Net and SegNet predicted segmentations.


Table 1.
Recent methods using CNN in medical image segmentation.
| Year | CNN Approach | Segmentation Application | Modality | Accuracy (%) | Metric |
|---|---|---|---|---|---|
| 2017 [19] | 2 conductive U-Nets | Breast tissue | MRI-T1 | 93.30 | DSC |
| 2016 [20] | Standard CNN | Brain–Breast–Cardiac | MRI-T1 | 81.00 | DSC |
| 2016 [21] | V-Net (Volumetric U-Net) | Prostate | MRI-T2 | 82.39 | DSC |
| 2016 [22] | U-Net | Liver | MRI-T1 | 72.90 | IoU |
| 2017 [23] | 3D CNN | Brain lesion | MRI-T1 | 60.80 | DSC |
| 2018 [24] | Bayesian CNN | Nonhuman primate brain extraction | MRI-T1 | 98.00 | DCS |
Table 2.
The tried and used learning parameters with their optimal values for SegNet and U-Net.
| Parameter | Grid Search | Optimal Value for SegNet | Optimal Value for U-Net |
|---|---|---|---|
| Data augmentation | Linear, no-linear | Linear | Linear |
| Learning rate | 0.5, 0.05, 0.005, 0.0005 | 0.0005 | 0.005 |
| Batch size | 2, 4, 8, 16, 32 | 4 | 4 |
| Momentum rate | 0.8, 0.9, 0.99 | 0.99 | 0.99 |
| Weight initialization | Normal, uniform, Glorot uniform, | Normal | Normal |
| Adaptive learning rate methods | stochastic gradient descent (SGD), RMSprop, Adagrad, Adadelta, Adam | SGD | SGD |
| Learning rate decay | None, linear, exponential | Linear (0.000062) | Linear (0.000062) |
| Dropout rate | 0.1, 0.25, 0.3, 0.5, 0.75 | 0.30, 0.40 | 0.10, 0.20, 0.30 |
Table 3.
Loss, accuracy, and p-value comparison between U-Net and SegNet.
| Accuracy (IoU) | Loss (Binary Cross Entropy) | p-Value (U-test) | |
|---|---|---|---|
| U-Net | 76.14 | 0.002 | 0.147 (>0.05) |
| SegNet | 68.88 | 0.053 | 0.045 (<0.05) |
© 2019 by the authors. Licensee MDPI, Basel, Switzerland. This article is an open access article distributed under the terms and conditions of the Creative Commons Attribution (CC BY) license (http://creativecommons.org/licenses/by/4.0/).
Share and Cite
MDPI and ACS Style
El Adoui, M.; Mahmoudi, S.A.; Larhmam, M.A.; Benjelloun, M. MRI Breast Tumor Segmentation Using Different Encoder and Decoder CNN Architectures. Computers 2019, 8, 52. https://0-doi-org.brum.beds.ac.uk/10.3390/computers8030052
AMA Style
El Adoui M, Mahmoudi SA, Larhmam MA, Benjelloun M. MRI Breast Tumor Segmentation Using Different Encoder and Decoder CNN Architectures. Computers. 2019; 8(3):52. https://0-doi-org.brum.beds.ac.uk/10.3390/computers8030052
Chicago/Turabian StyleEl Adoui, Mohammed, Sidi Ahmed Mahmoudi, Mohamed Amine Larhmam, and Mohammed Benjelloun. 2019. "MRI Breast Tumor Segmentation Using Different Encoder and Decoder CNN Architectures" Computers 8, no. 3: 52. https://0-doi-org.brum.beds.ac.uk/10.3390/computers8030052
Note that from the first issue of 2016, this journal uses article numbers instead of page numbers. See further details here.