Predicting Employee Attrition Using Machine Learning Techniques
by
 , , and
Francesca Fallucchi
1,2,*,†,‡ ,
,
Marco Coladangelo
1,‡ ,
,
Romeo Giuliano
1,‡ and
and
Ernesto William De Luca
1,2,3,‡ 1
Department of Innovation & Information Engineering, Guglielmo Marconi University, 00193 Roma, Italy
2
Georg Eckert Institute for International Textbook Research Member of the Leibniz Association, 38114 Braunschweig, Germany
3
Faculty of Computer Science, Otto von Guericke Universität Magdeburg, 39106 Magdeburg, Germany
*
Author to whom correspondence should be addressed.
†
Current address: Via Plinio 44, 00193 Rome, Italy.
‡
These authors contributed equally to this work.
Computers 2020, 9(4), 86; https://0-doi-org.brum.beds.ac.uk/10.3390/computers9040086
Submission received: 9 October 2020
/
Revised: 26 October 2020
/
Accepted: 29 October 2020
/
Published: 3 November 2020
(This article belongs to the Special Issue Feature Paper in Computers)
Abstract
:There are several areas in which organisations can adopt technologies that will support decision-making: artificial intelligence is one of the most innovative technologies that is widely used to assist organisations in business strategies, organisational aspects and people management. In recent years, attention has increasingly been paid to human resources (HR), since worker quality and skills represent a growth factor and a real competitive advantage for companies. After having been introduced to sales and marketing departments, artificial intelligence is also starting to guide employee-related decisions within HR management. The purpose is to support decisions that are based not on subjective aspects but on objective data analysis. The goal of this work is to analyse how objective factors influence employee attrition, in order to identify the main causes that contribute to a worker’s decision to leave a company, and to be able to predict whether a particular employee will leave the company. After the training, the obtained model for the prediction of employees’ attrition is tested on a real dataset provided by IBM analytics, which includes 35 features and about 1500 samples. Results are expressed in terms of classical metrics and the algorithm that produced the best results for the available dataset is the Gaussian Naïve Bayes classifier. It reveals the best recall rate (0.54), since it measures the ability of a classifier to find all the positive instances and achieves an overall false negative rate equal to 4.5% of the total observations.
1. Introduction
In today’s competitive economy and its growing technological specialisation, acquisition, study and analysis of data are giving rise to new knowledge, referred to as “knowledge economy”. Information technologies are not only a source of data but are, above all, an enabling factor for data analysis, making it possible to process large data collections and allow information to be extracted from them. Data has become a strategic asset for most organisations across multiple sectors, including those linked to business processes. All types of organisations benefit from the adoption of new technologies [1] and collection, management and analysis of data bring numerous benefits in terms of efficiency and competitive advantage. In fact, analysing large amounts of data can lead to improvements in decision-making processes, the achievement of pre-established corporate objectives and better business competitiveness [2,3].
Within organisations there are several areas in which the adoption of artificial intelligence impacts on a company’s decision-making activities [4,5]. In recent years, increasing attention has been focused on human resources (HR), since the quality and skills of employees constitute a growth factor and a real competitive advantage for companies [6]. In fact, after becoming more adopted in sales and marketing areas, artificial intelligence is now also starting to guide company decisions regarding their employees, with the aim of basing HR management decisions on the analysis of objective data rather than subjective considerations [7,8,9].
In general, companies try to maximise their profits. In companies where workers perform simple tasks, they can resort to on-call, occasional and temporary work (as in the gig economy), because they have fewer contractual obligations. However, for companies in which workers perform more specialised tasks, the specialisation and continuity of work of the employee becomes essential.
The importance of skills, knowledge and continuous learning ability has proven to be fundamental for businesses. The application of artificial intelligence in the field of HR allows companies to transform data into knowledge by implementing predictive models: such models allow predictions on employees using data collected by the company over the previous years, thus reducing critical issues and optimising all HR activities [10,11].
Companies invest a lot of time and resources in employee recruiting and training, according to their strategic needs [12]. Therefore, the employees (to a greater or lesser extent) represent a real investment for organisations. When an employee leaves the company, the organisation is not only losing a valuable employee, but also the resources, specifically money and HR staff effort, that were invested recruiting and selecting those employees and training them for their related tasks. Consequently, the organisation must continuously invest in recruiting, training and developing new staff to fill vacant job positions. Training a new employee is a long and costly process and it is of full interest of the company to control and decrease the employee attrition rate: attrition is defined as an employee resigning or retiring from a company. Moreover, satisfied, highly motivated and loyal employees form the core of a company and also have an impact on the productivity of an organisation. In the literature, some authors suggest retaining only happy and motivated employees as they tend to be more creative, productive and perform better, which in the end generates and sustains improved firm performance [13,14,15]. As job dissatisfaction is shown in the economic literature as a good predictor of turnover intention (see [16,17,18,19,20]) job satisfaction data are powerful predictors of both separations and resignations, even controlling for wages, hours and standard demographic and job variables [16,17].
In this paper, we perform an analysis of the reasons or motivations that push an employee to leave the company and consequently allow the HR department to take timely appropriate countermeasures such as improving the work environment or production incentives. Starting from the dataset, we identify the main factors related to the employee’s attrition and we propose a real classification, based on the statistical evaluation of the data. The application of classification algorithms can support the HR management by allowing the adoption of staff management support tools in the company. The obtained model for the prediction of employees’ attrition is tested on a real dataset provided by IBM analytics, which includes 35 features and about 1500 samples. By analysing the correlations in the heatmap of 35 features, we derive the characteristics that have high correlations related to the reasons that an employee leaves the company. Results are expressed in terms of classical metrics and the algorithm that produced the best results for the available dataset is the Gaussian Naïve Bayes classifier. It reveals the best recall rate (0.54), since it measures the ability of a classifier to find all the positive instances and achieves an overall false negative rate equal to 4.5% of the total observations. The results obtained from the data analysis demonstrate that the adoption of machine learning systems can support the HR department in the company staff management. The paper is organised as follows. In Section 2, issues and related works are analysed. In Section 3, the study case is discussed, presenting the adopted methodology and the data analysis. Section 4 is dedicated to the model construction phase and adopted techniques are detailed. In Section 5 we report the results of the analysis, comparing the performance metrics of the considered algorithms. Finally, in Section 6, conclusions are drawn.
2. Related Work
Many researchers have proved [21,22] the usefulness of human resource management (HRM) in working scenarios, production and management, and in identifying relationships with productivity. In fact, the results confirm that the impact of HRM on productivity has positive effects on a business’s capital growth and intensity [23]. Most studies focus on analysing and monitoring customers and their behaviour [24,25], and do not address the main assets of a company, as represented by its employees. Many studies analysed employee attrition. An existing research [26] showed that employee demographics and job-related attributes are the factors that most affect employee attrition, such as the salary and the duration of the employment relationship. Another research [27] evaluated the impacts of demographic attributes and employee absenteeism on attrition. Authors in [28] focused only on work-specific factors. Authors in [29] compared a Naïve Bayes classifier and the decision tree algorithm J48 in predicting the likelihood of an employee departing from the company. In particular, two methodologies were evaluated for each algorithm: tenfold cross-validation and percentage split 70. The results showed an accuracy of 82.4% and an incorrect classification of 17.6% with J48 using tenfold cross-validation, while there was an accuracy of 82.7% and an incorrect classification of 17.3% using percentage split 70. In contrast, the Naïve Bayes classifier obtained an accuracy of 78.8% and an incorrect classification of 21.2% using tenfold cross-validation, while an accuracy of 81% and an incorrect classification of 19% was obtained using percentage split 70. Authors in [30] explored the application of Logistic Regression when predicting employee turnover and obtained an accuracy of 85% and a false negative rate of 14%.
3. HR Prediction: A Case Study
Machine learning can give important support to HRM applications. In this paper we have the aim of demonstrating a possible application for machine learning in HR departments, which are typically limited by subjective decisions and interpretations of employees’ behaviour. Actions using objective support tools can avoid measures that are implemented once an employee has resigned, and when it is usually too late to retain him. We propose a real classification on potential reasons that an employee may leave the company, based on the statistical study of the data. From one side, this work shows how complex tasks can be performed through the application of classification algorithms and on the other side it reveals new scenarios in which the implementation of this technology could allow the diffusion of staff management support tools in the company.
3.1. Methodology
The methodology adopted in this work relates to the TDSP framework, Team Data Science Process [31]: the scientific data analysis process is an agile and iterative data science methodology designed to offer predictive analysis solutions and efficient, intelligent applications.
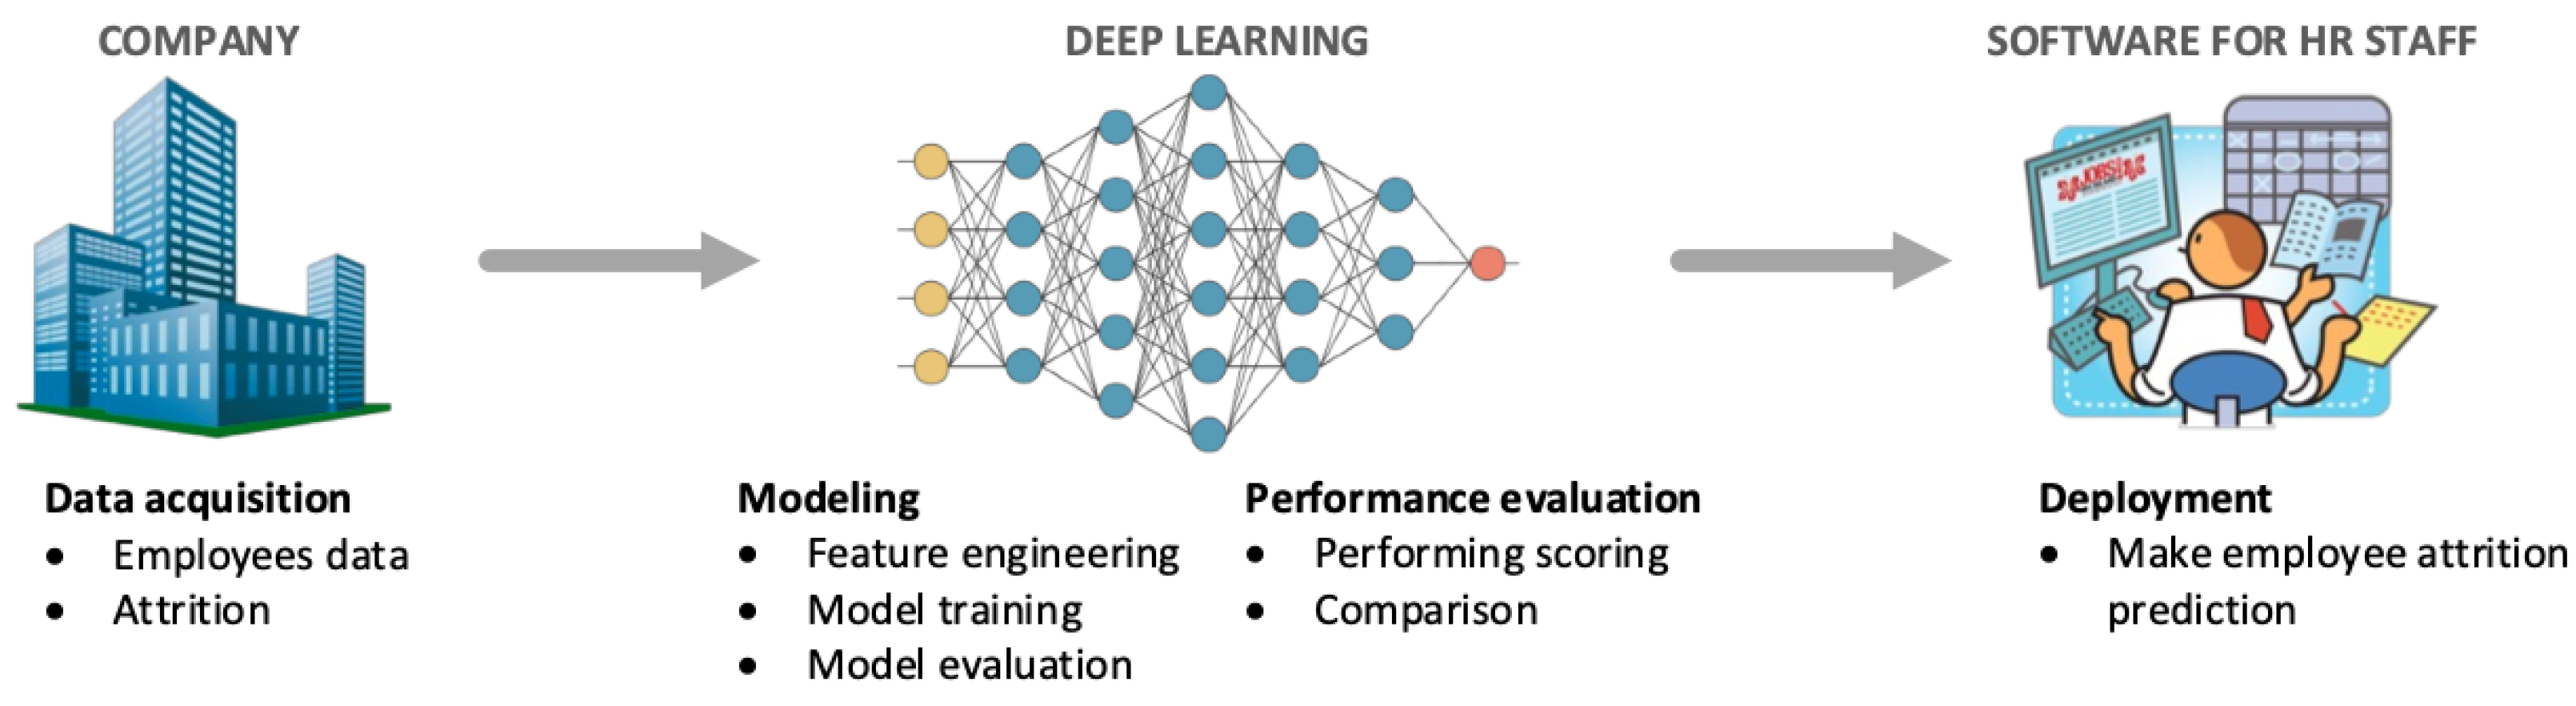
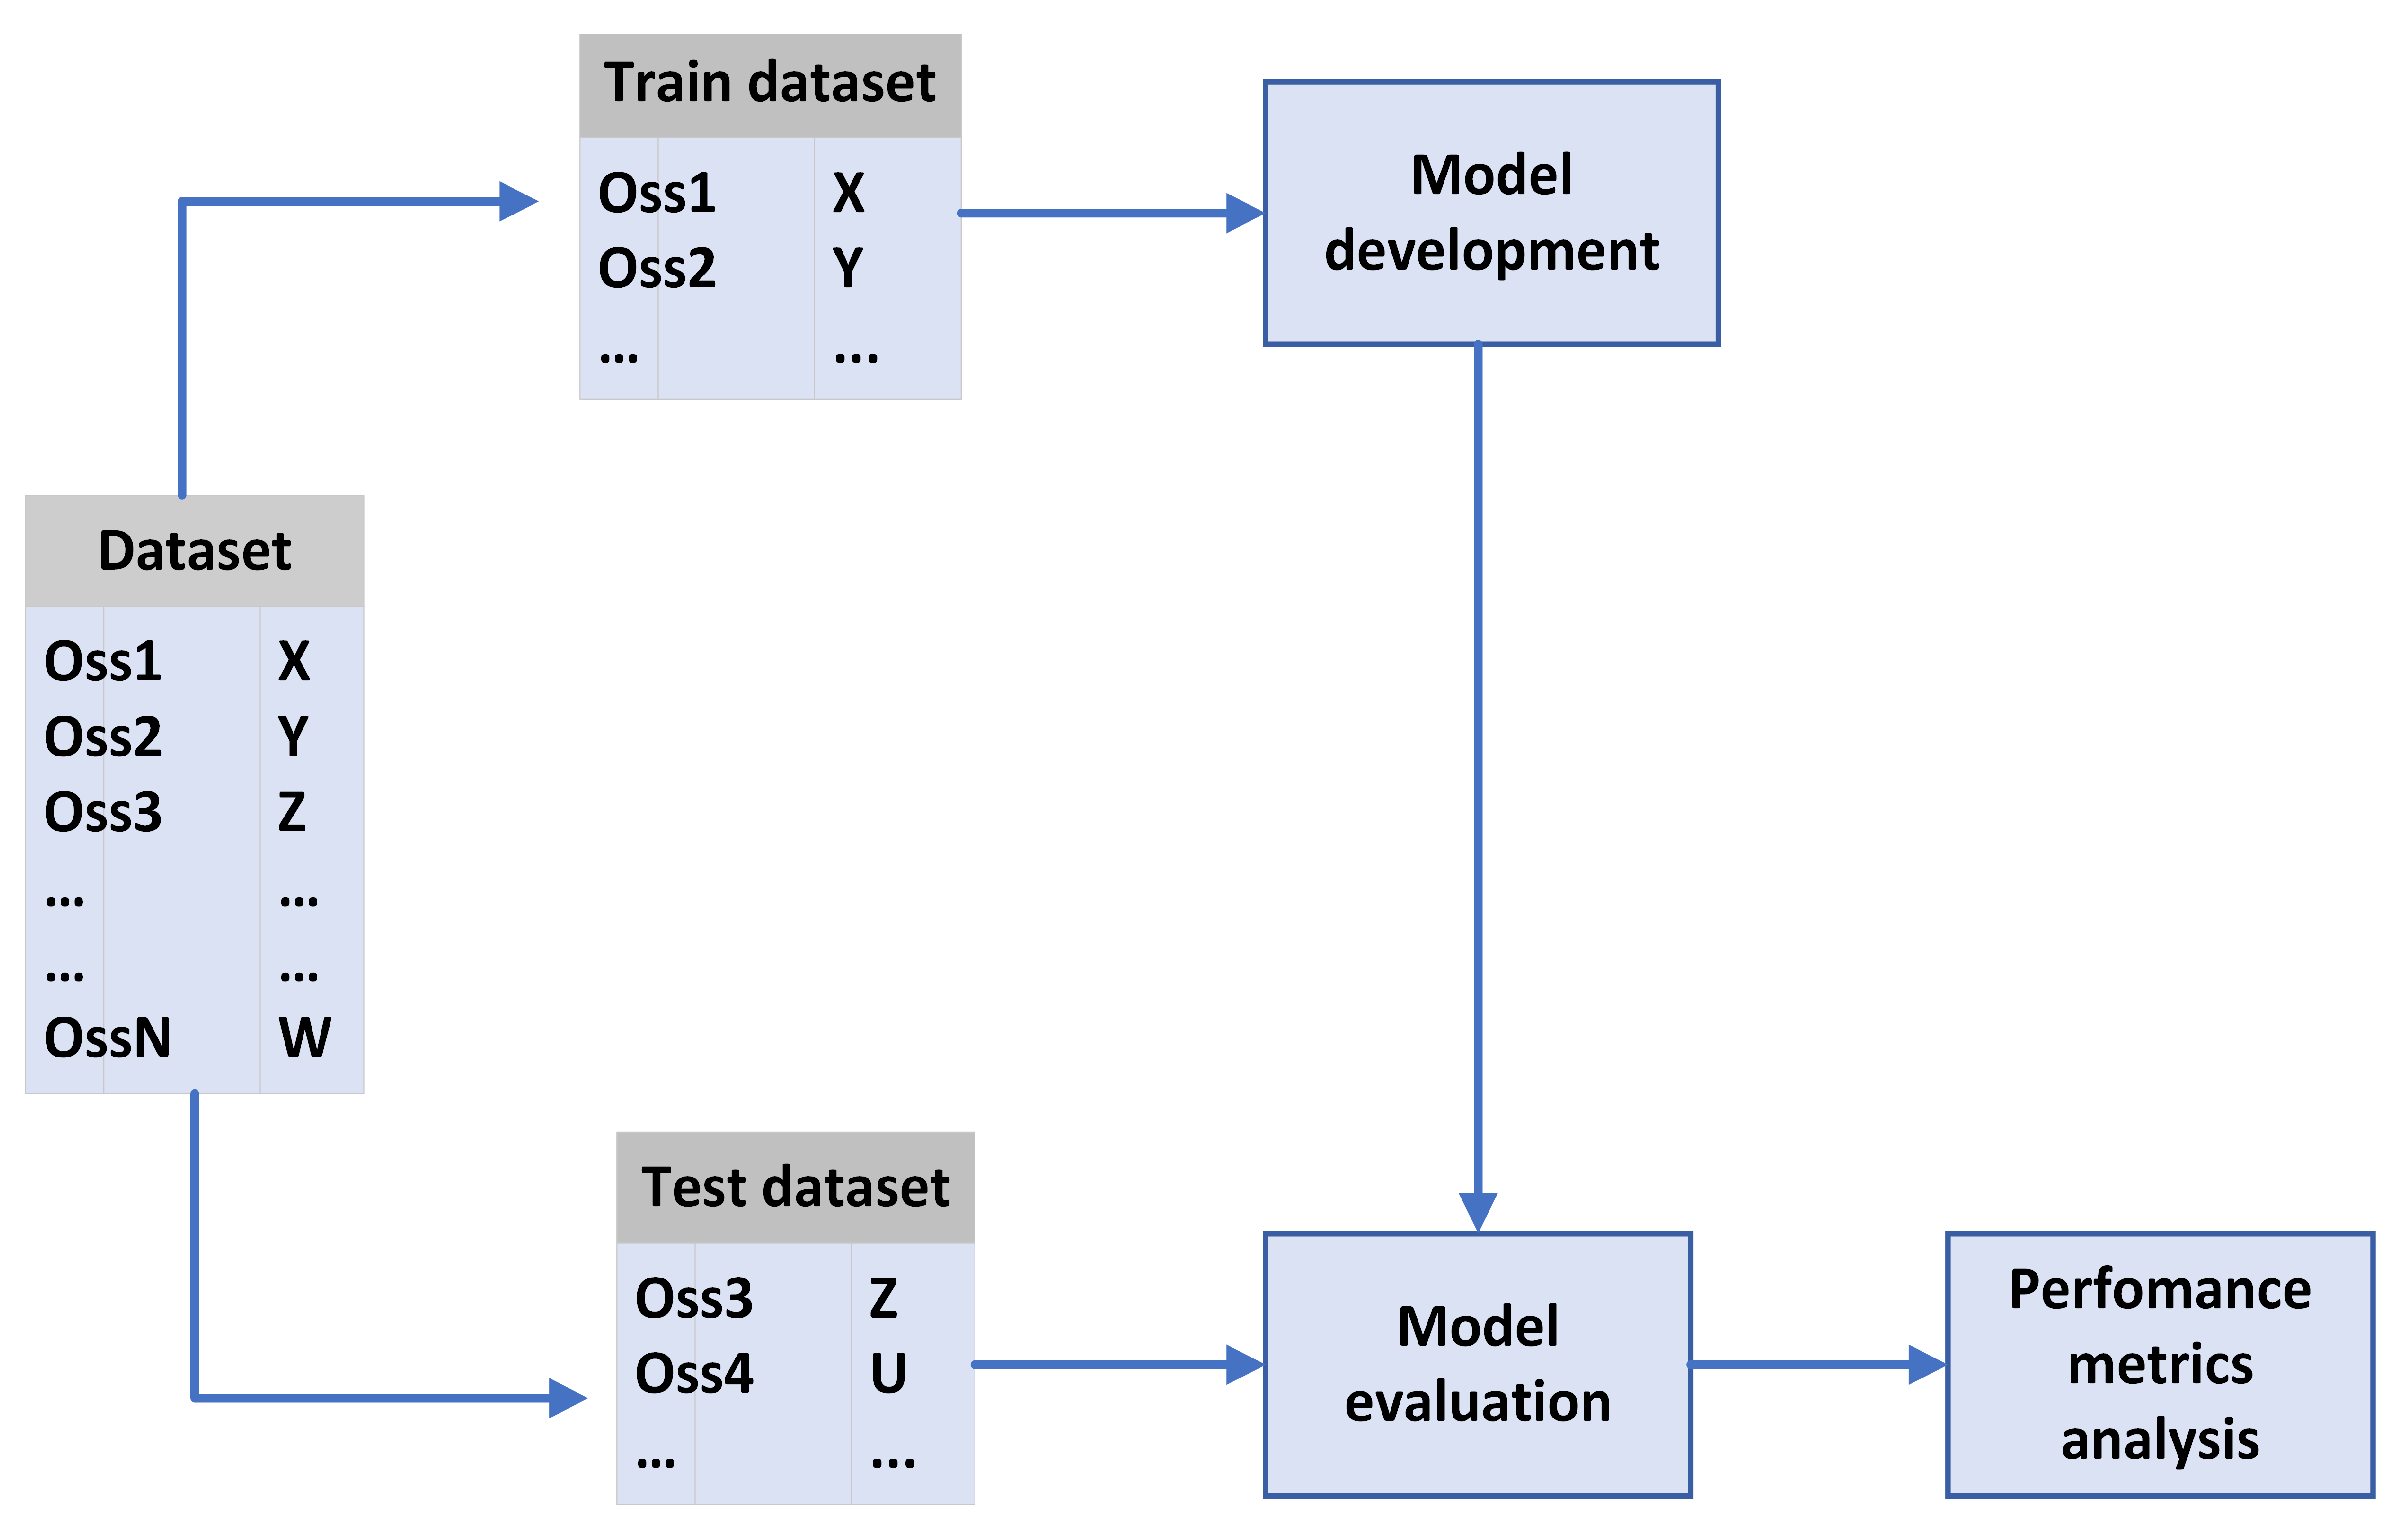
The TDSP methodology is applied to look for the reasons of employee attrition and to build a predictive model according to the following phases (see Figure 1):
- Collect the employee dataset, which consists of current and past employee observations (Section 3.2.1);
- Apply various data cleaning techniques to prepare the dataset (Section 3.2.2);
- Start a descriptive analysis of data to detect the key factors and trends that contribute to attrition (Section 3.3);
- Elaborate the dataset for the training and testing phase and try several classification algorithms to process it (Section 4);
- Based on the results collected with test data, compare many performance metrics of machine learning models and select which model best fits and gives the most accurate results for the given problem (Section 5) and release HR support software that implements the classification model.
3.2. Preprocessing
3.2.1. Dataset Description
The HRM dataset used in this research work is distributed by IBM Analytics [32]. This dataset contains 35 features relating to 1500 observations and refers to U.S. data. All features are related to the employees’ working life and personal characteristics (see Table 1).
The dataset contains target feature, identified by the variable Attrition: “No” represents an employee that did not leave the company and “Yes” represents an employee that left the company. This dataset will allow the machine learning system to learn from real data rather than through explicit programming. If this training process is repeated over time and conducted on relevant samples, the predictions generated in the output will be more accurate.
3.2.2. Data Cleaning
Data preparation is one of the most important aspects of machine learning; it is usually complex and often requires rather a lot of time. In fact, it has been calculated that on average this operation requires 60% of the time and energy spent on a data science project [33]. Therefore, attention should be paid to the preliminary stages of Business Understanding and Data Understanding, which will simplify the next stages of the process. The first performed activity was the data selection: the data relevant to the target was selected from the initial dataset; characteristics considered less significant or redundant were removed, such as the progressive number of the employee (1, 2, 3, …), flags marking over 18s (the “age” variable), hourly and weekly rates (monthly rates are also present). Then, “null” and “undefined” values or duplicate records were identified, since they could inadvertently influence the correct training of the model and, consequently, produce inaccurate predictions. No null or undefined values were found in any variable and no duplicate observations emerged. In addition, the qualitative variables were transformed into quantitative variables: the categorical data were converted into numbers so that the machine learning model could work. The original dataset in fact contained several variables with textual values (“BusinessTravel”, “Department”, “EducationField”, “Gender”, “JobRole”, “MaritalStatus” and “Overtime”). Therefore we applied a transcoding to transform the n values of a class into numeric variables, from 0 to . For example, the “BusinessTravel” variable, consisting of 3 values, was transformed as follows:
- The “Non-Travel” value was mapped with the value 0,
- The “Travel_Frequently” value was mapped with the value 1,
- The “Travel_Rarely” value was mapped with the value 2.
3.2.3. Data Exploration
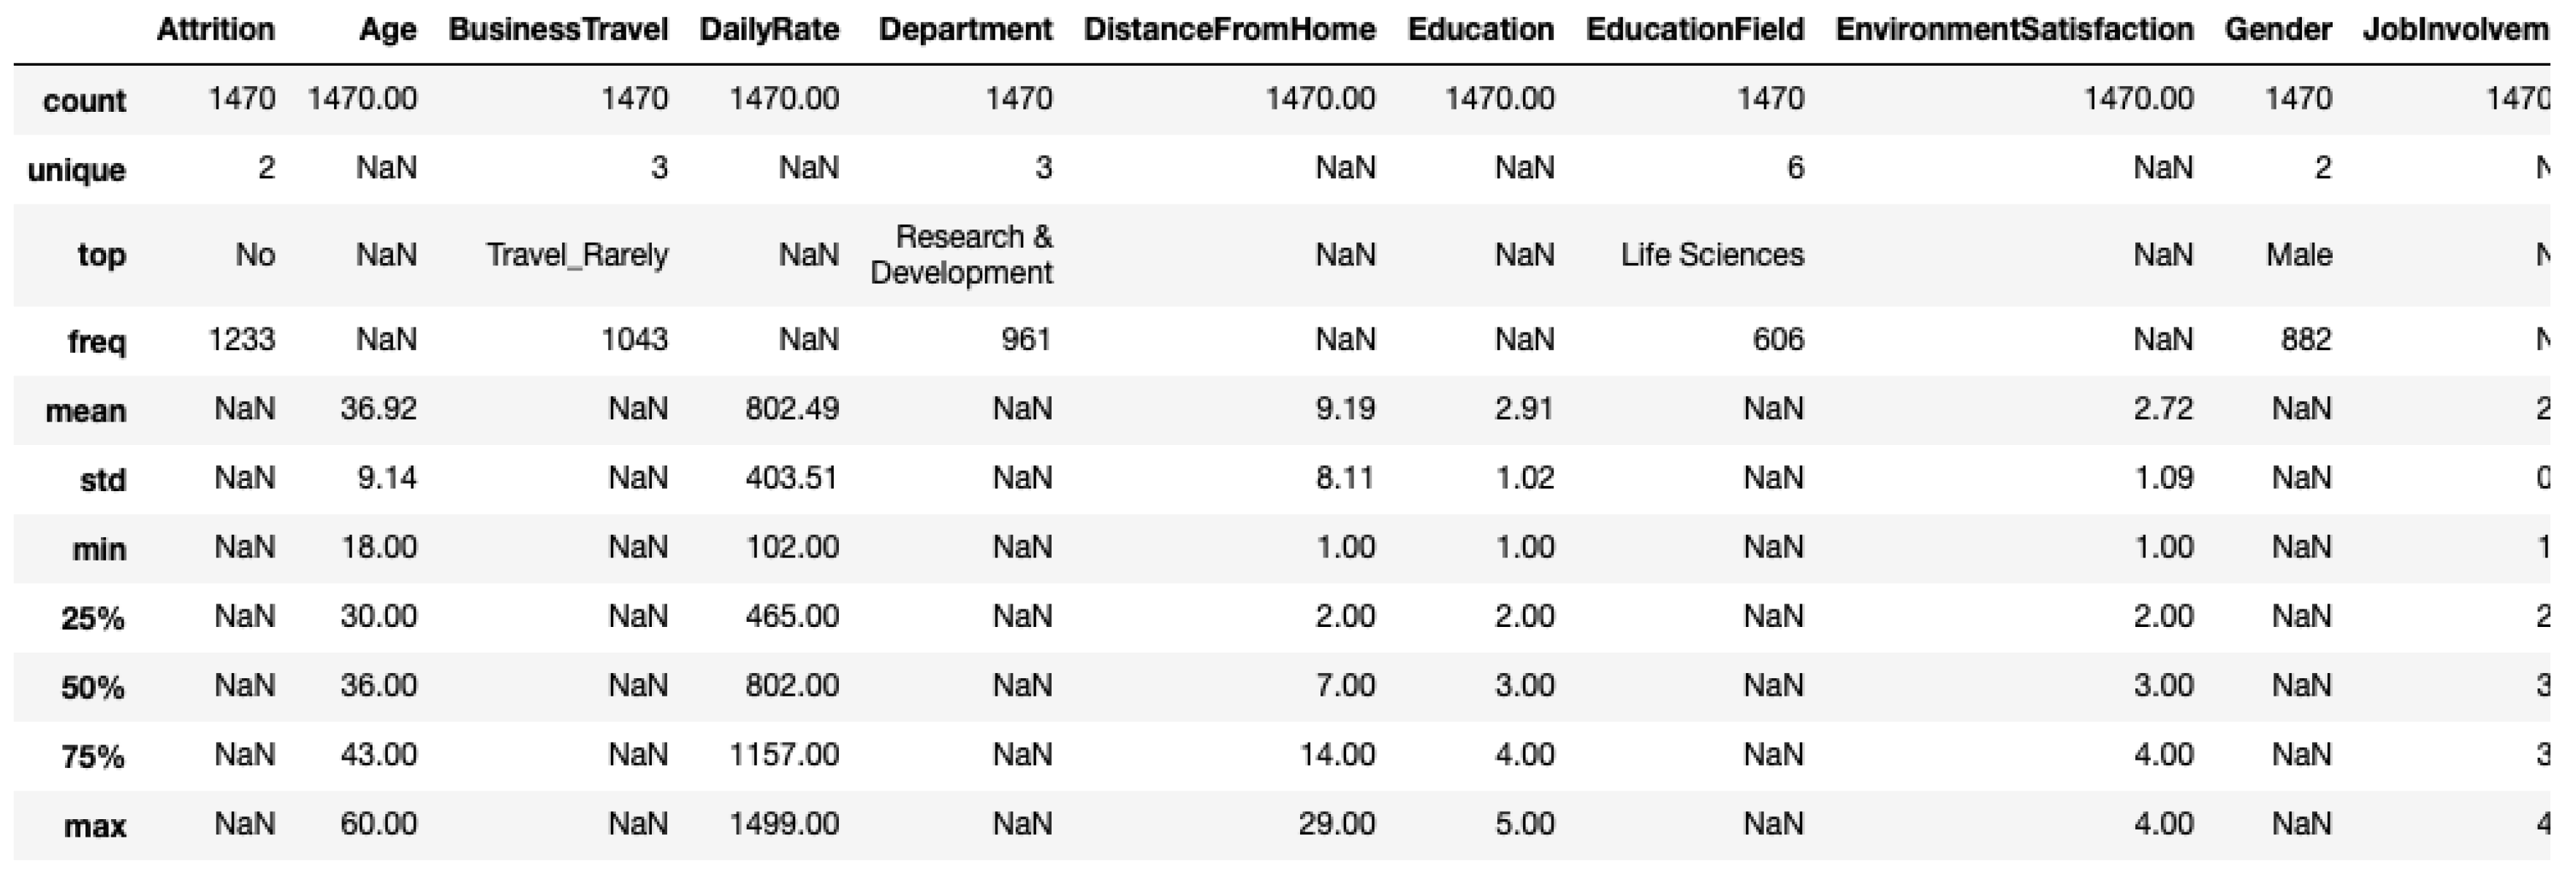
At this point we generated the descriptive statistics of the dataset in order to observe the characteristics of all variables. We considered the following variables: count, unique, top, frequency, mean, standard deviation (std), minimum and maximum values (min/max), 25%/50%/75% percentile. An extract of the overall dataset is reported in Figure 2.
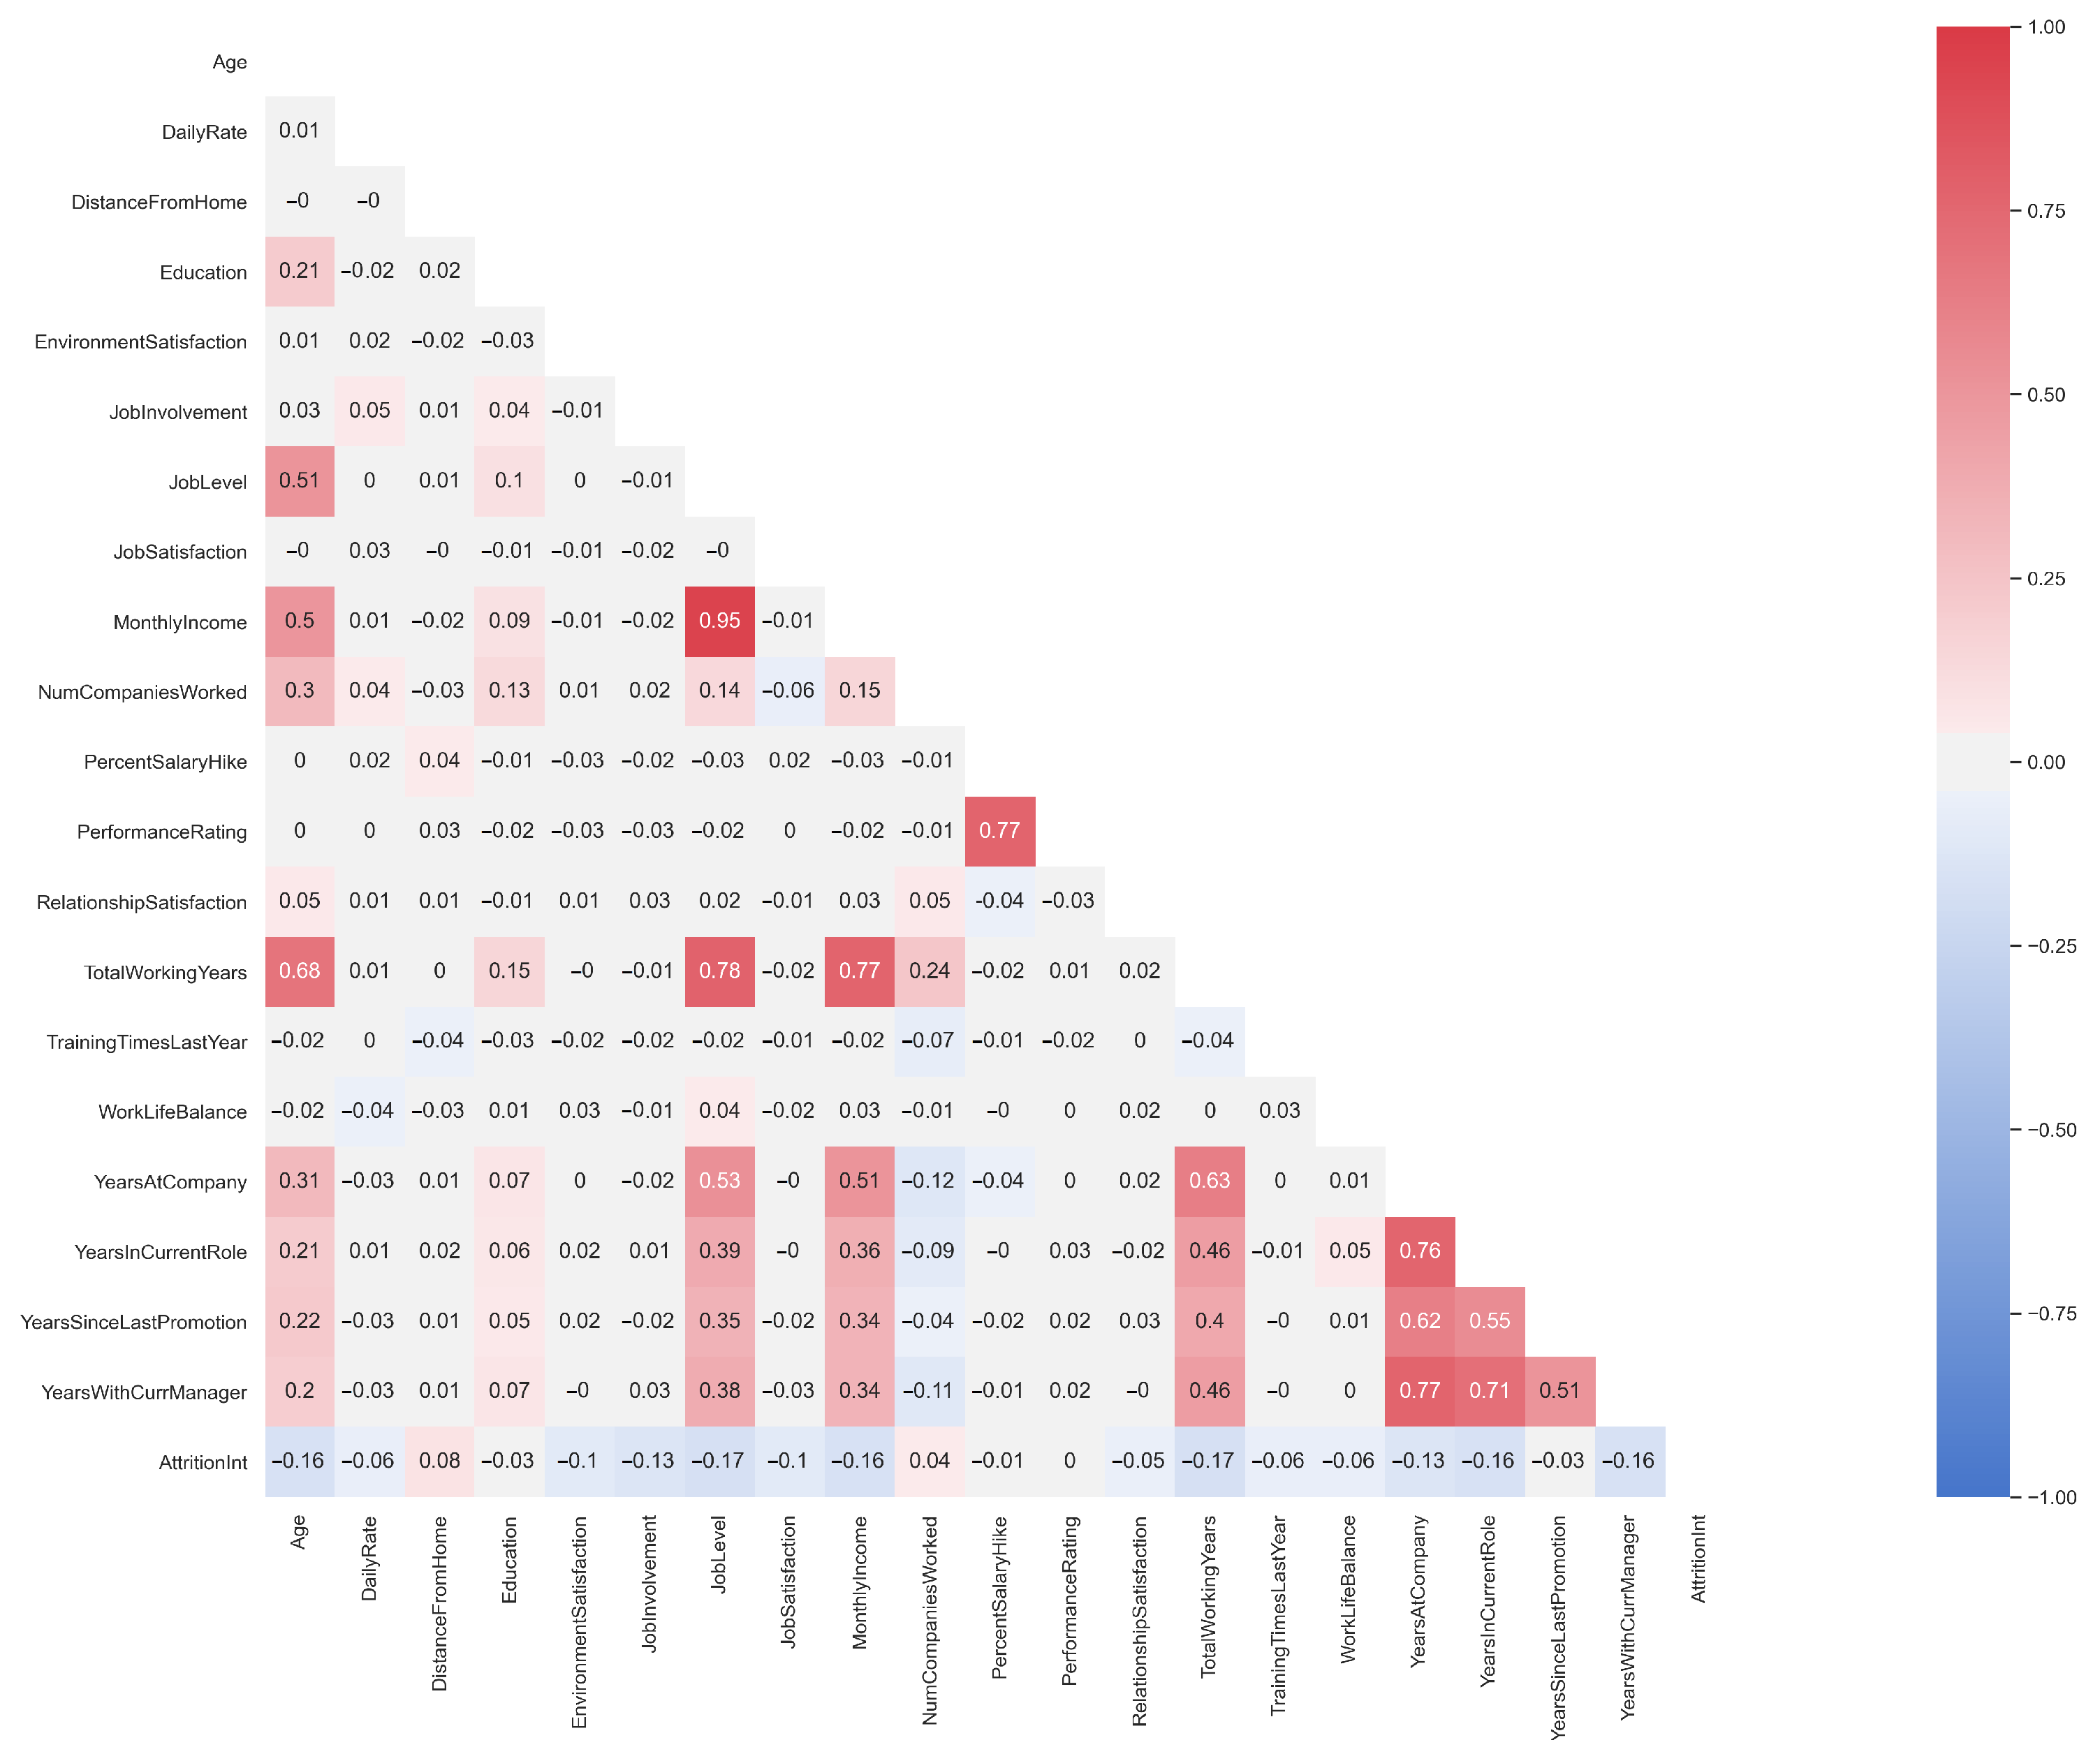
In Figure 3 we report the correlation matrix heat map. It graphically illustrates correlations among all variables: the grey fields represent no correlation, while the relative intensity of the red and blue colours represents an increase in correlation. In particular, red reveals a positive or direct correlation (the variation of one characteristic directly affects the other) and blue reveals a negative or indirect correlation (the variation of a characteristic inversely affects that of the other).
By analysing the correlations in the heatmap we derive that the following characteristics have high correlations (i.e., between 0.7 and 1 for direct correlation and from −1 to −0.7 for inverse correlation):
- Salary increase (“PercentSalaryHike”) and performance evaluation (“PerformanceRating”): employees who receive an increase in salary tend to be more productive;
- Salary (“MonthlyIncome”) and employment level (“JobLevel”): employees with greater seniority generally tend to earn more;
- Spent years of work in the company (“YearsAtCompany”), spent years with the current manager (“YearsWithCurrManager”) and spent years in the current role (“YearsInCurrentRole”): this would seem to highlight the absence of professional growth.
Once the data cleaning and data exploration phases were complete, it was necessary to proceed with Categorical Encoding before moving to the descriptive analysis. In this phase we transform data to the correct format to perform the analysis. It is necessary to change the format of some variables to allow greater readability and a comparison with other analysed quantities, in order to avoid ambiguous results. The format modification involved arranging values into uniform clusters to make values comparable, or mapping for each numeric value with a corresponding categorical variable.
3.3. Descriptive Analysis
The first step of the descriptive analysis was to observe the distribution of the target variable within the dataset.
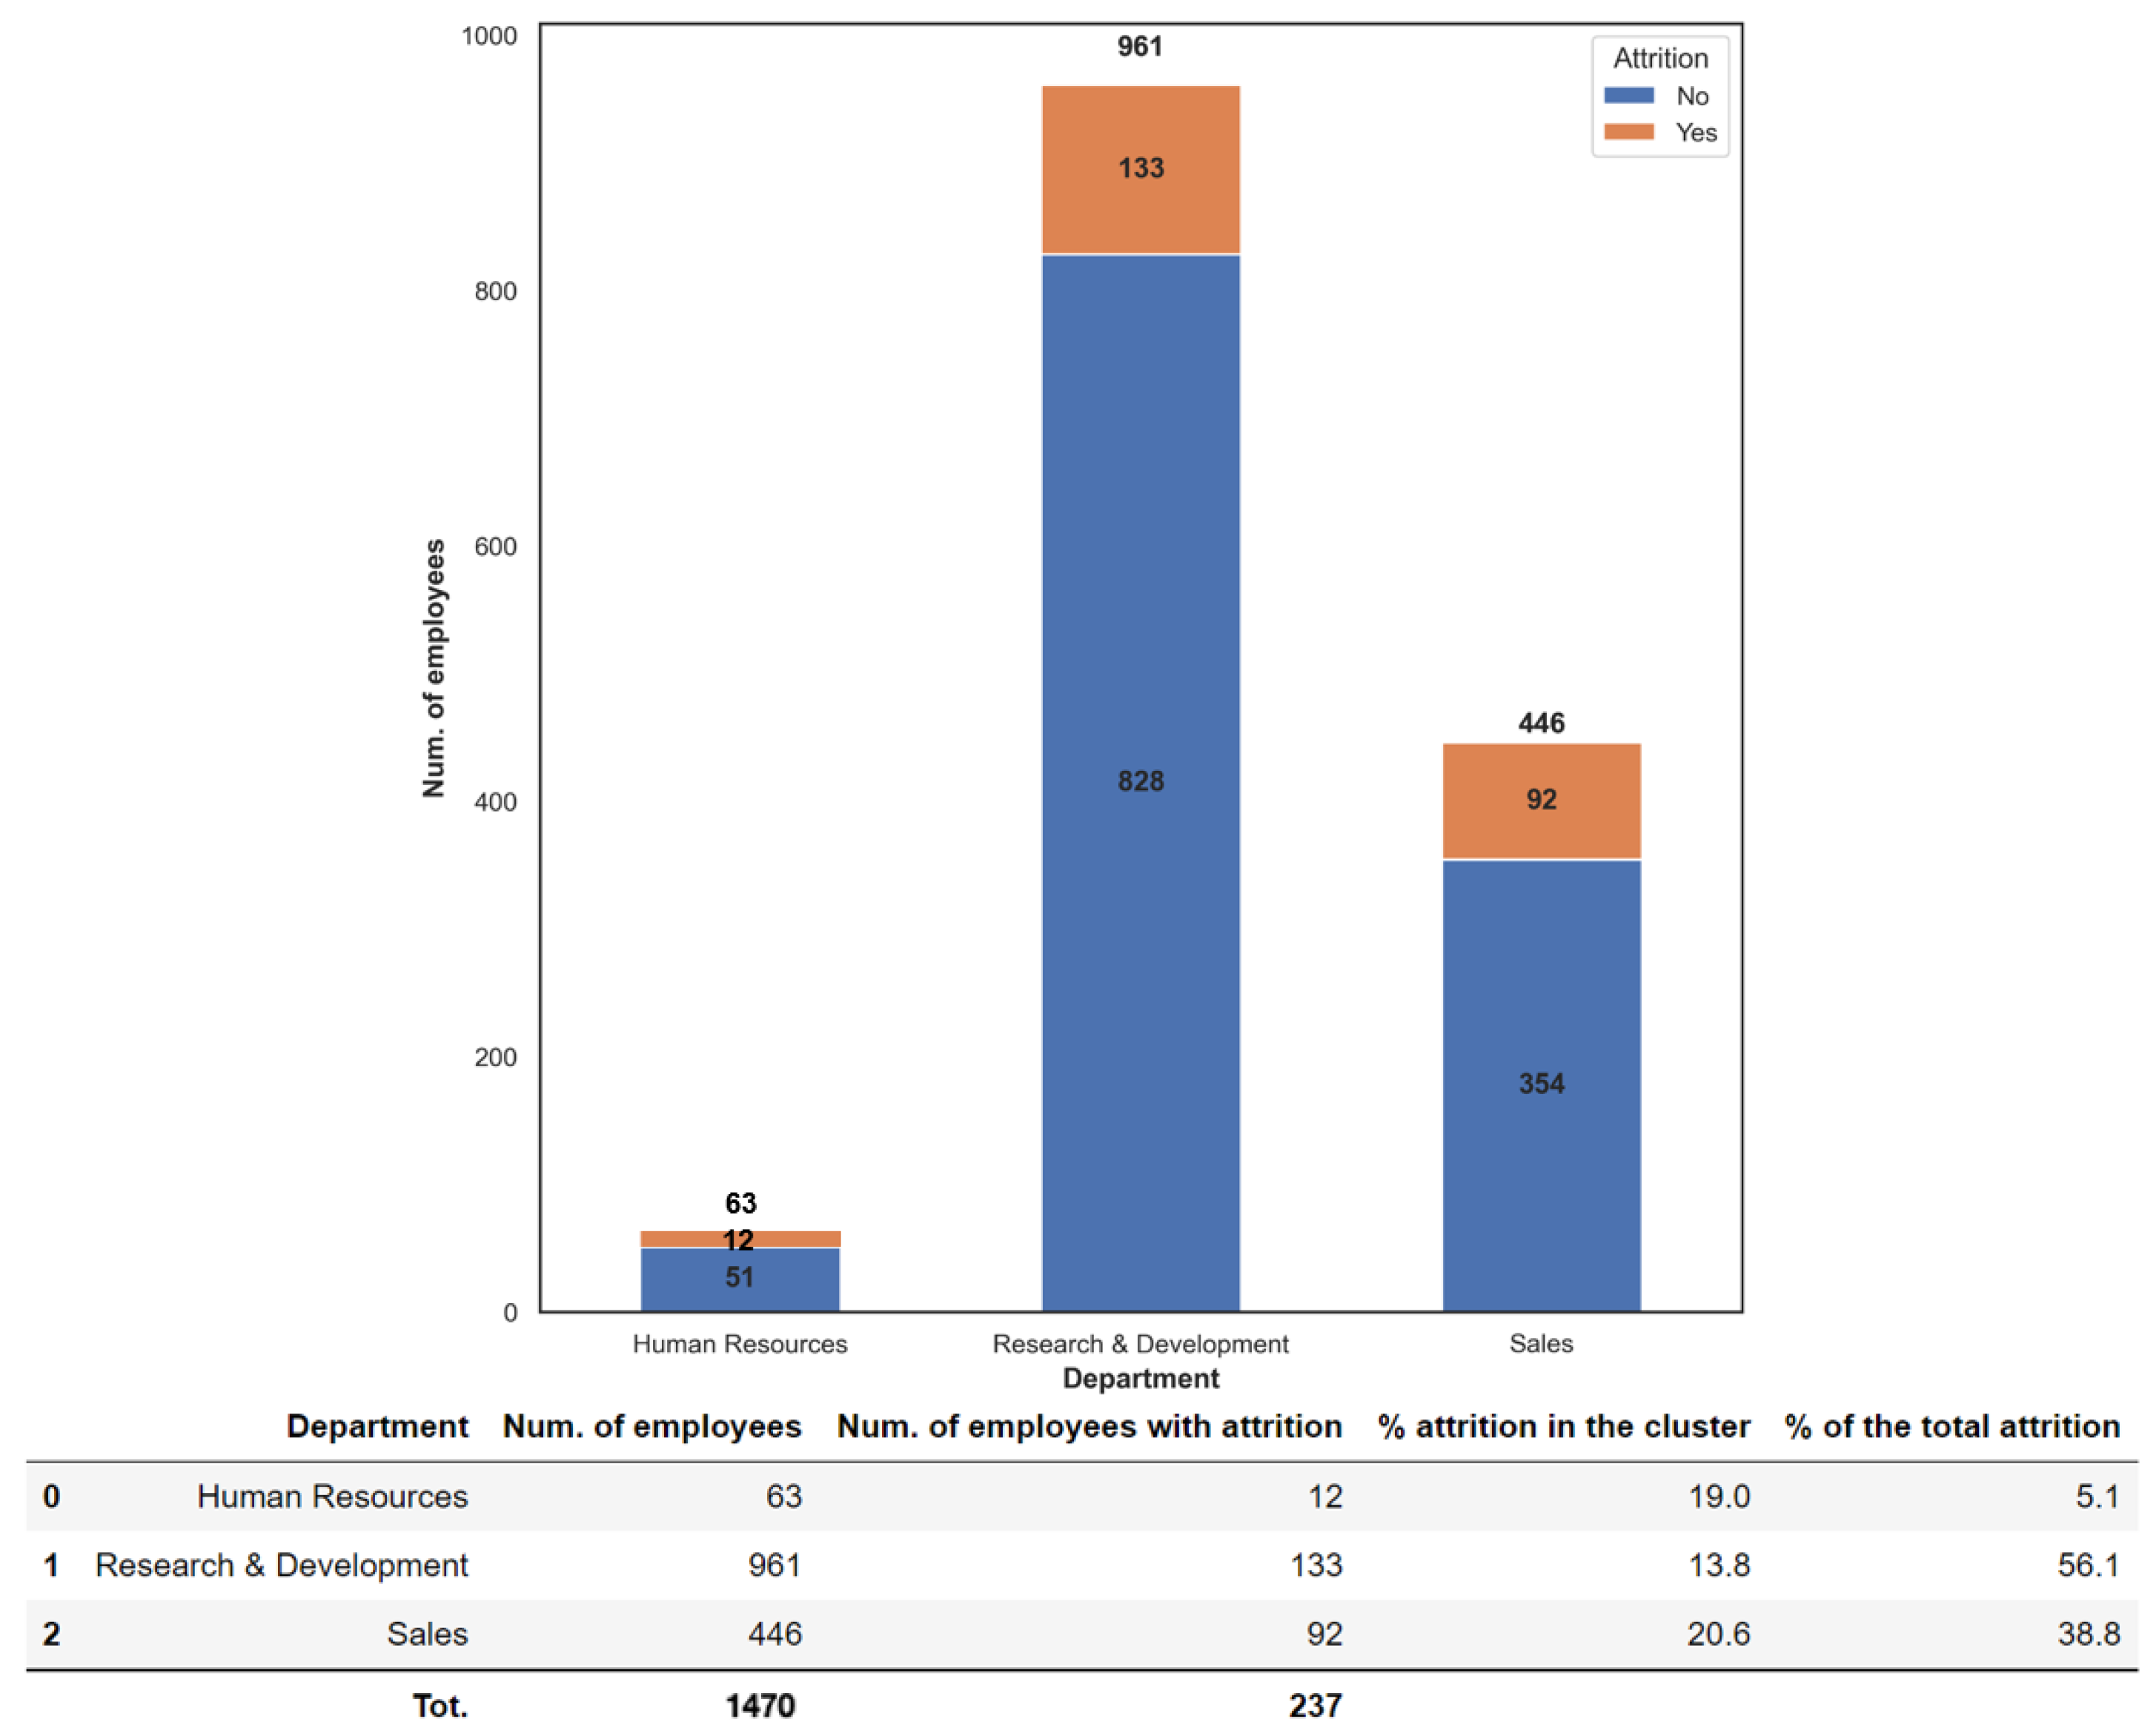
In the sample of 1470 employees, 16% (237 workers) left their jobs, while the remaining 84% (1233 workers) are still in service with the company. The breakdown within the company departments is summarised below:
Considering the absolute values, the “Research and Development” department has the highest number of resigned employees equal to 133 workers out of 237 (i.e., 56.1%). Nevertheless, it presents the lowest rate of attrition equal to 13.8%, within its area with respect to the “Sales” department and the “Human Resources” management department, which experienced an attrition rate of 20.6% and 19% within their department, respectively.
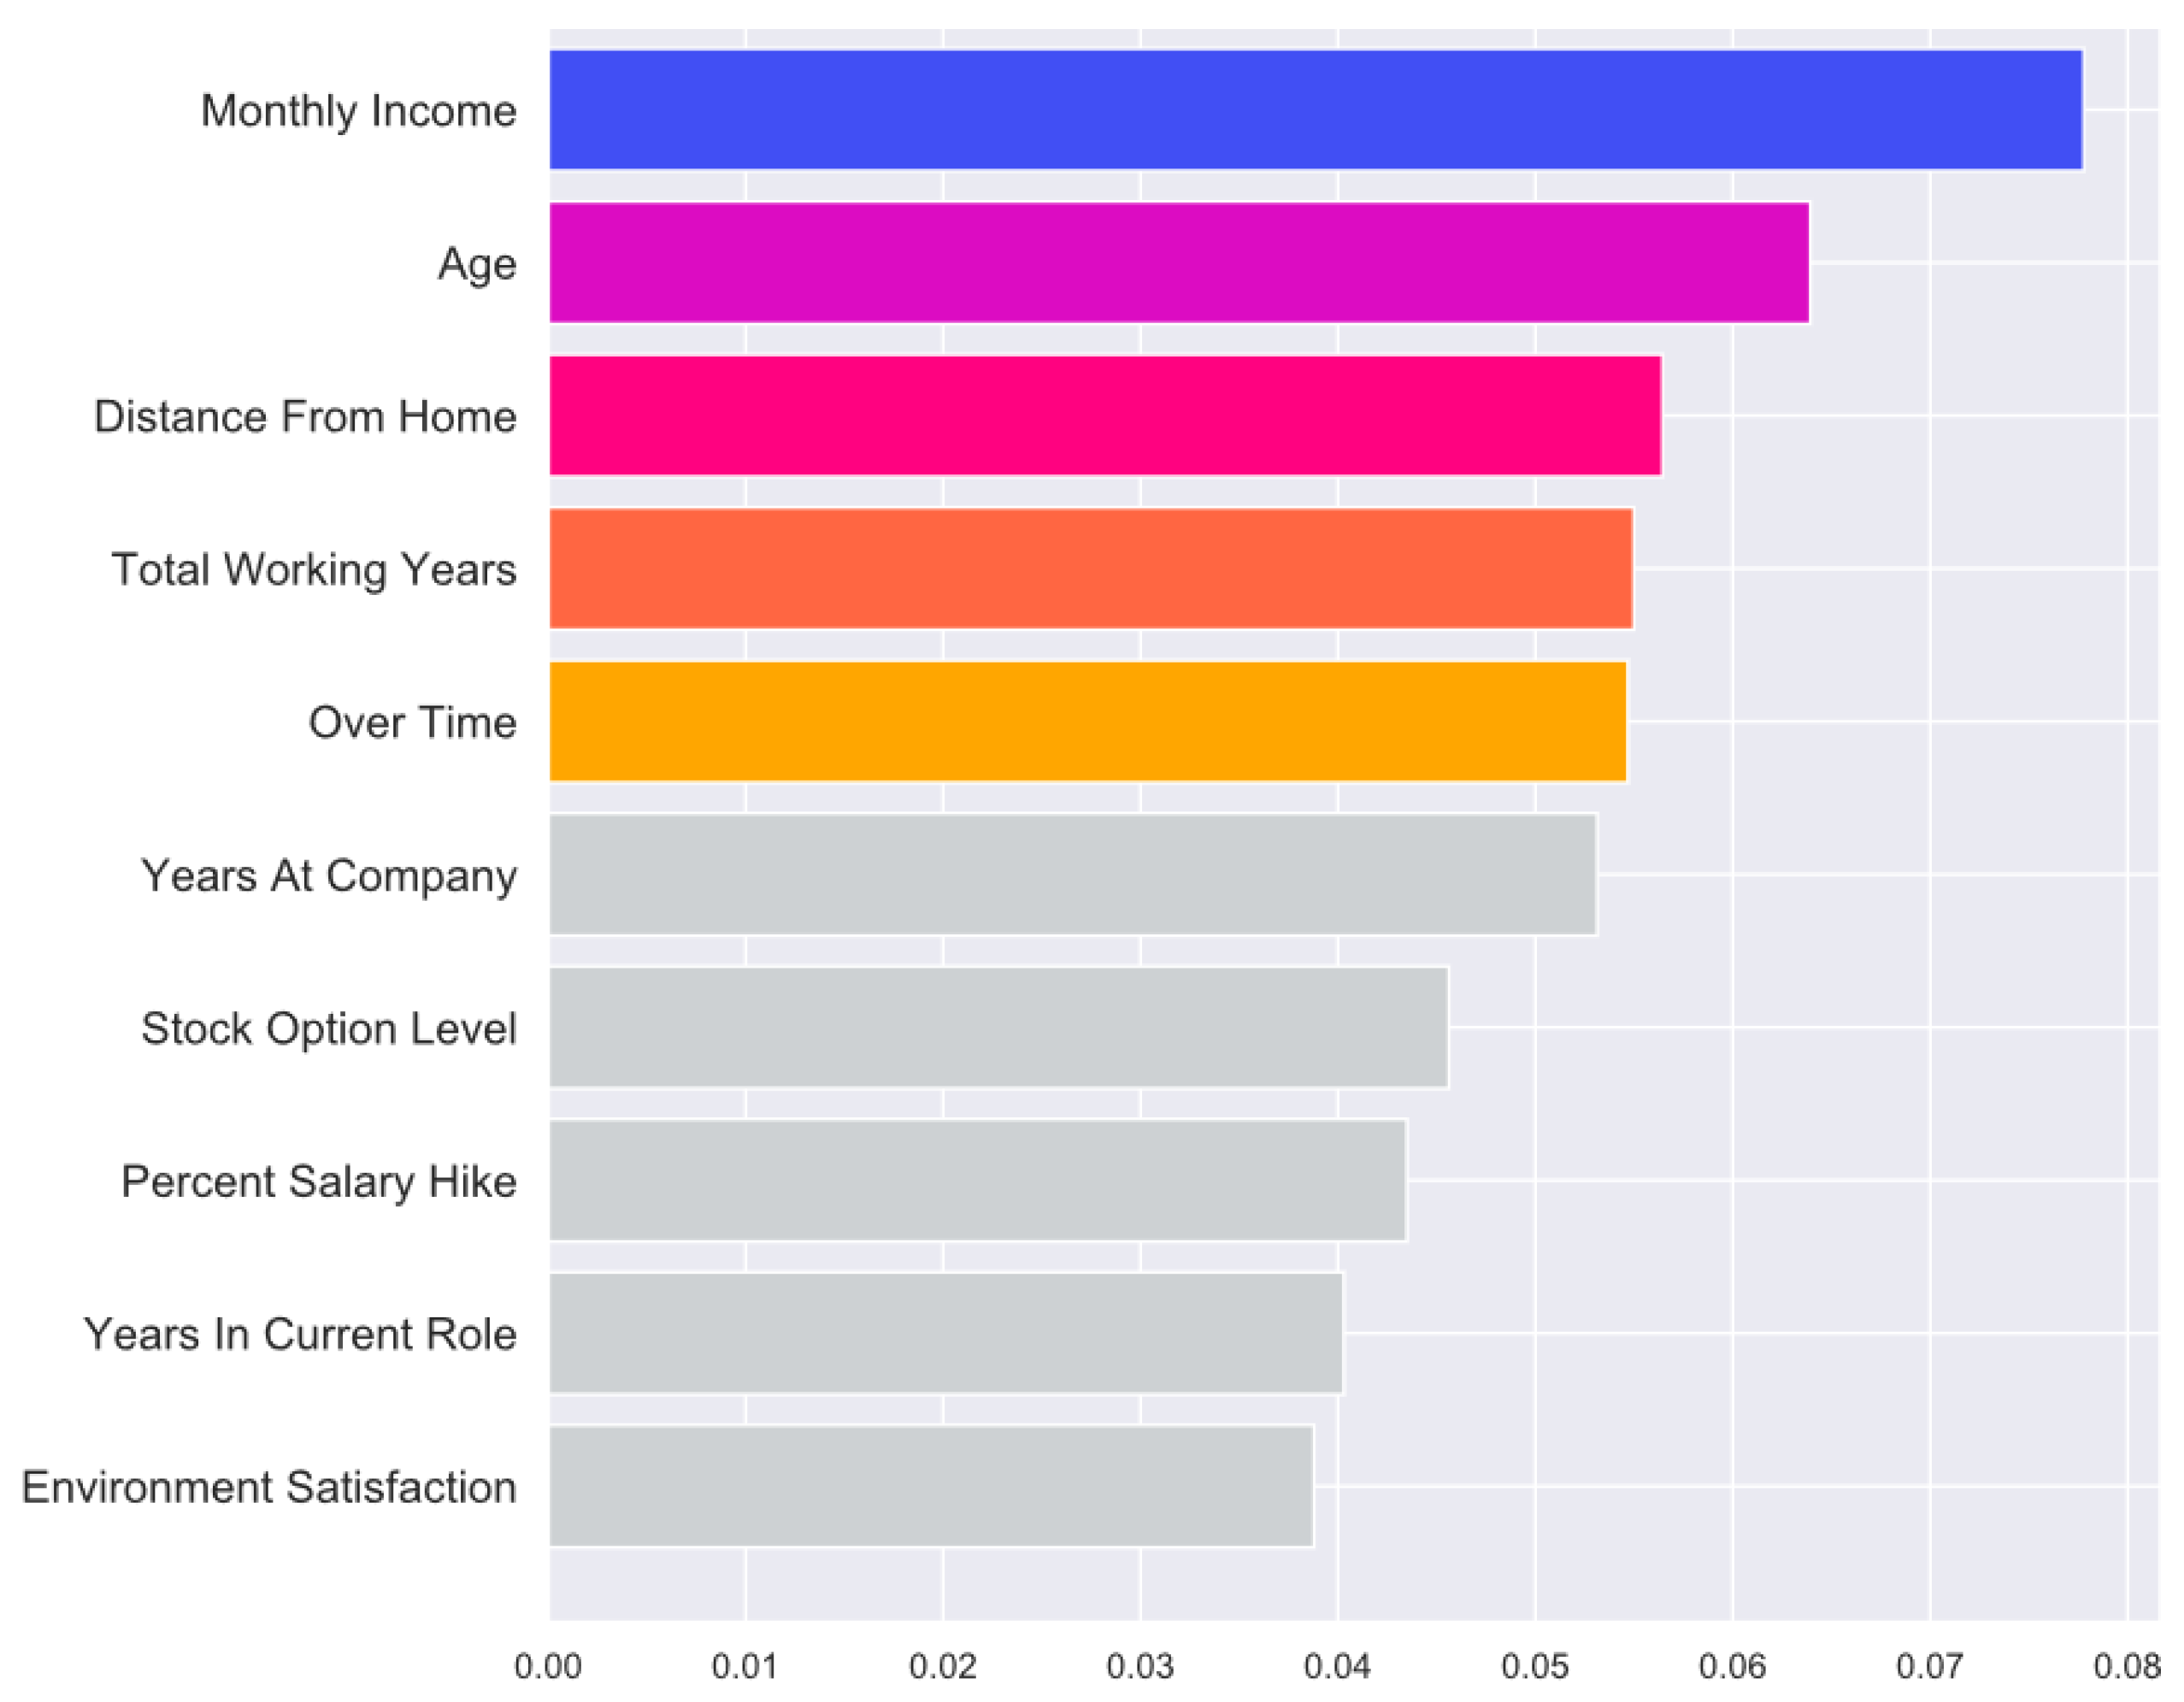
Figure 4 shows the list of factors in order of importance that are highly related with the attrition.
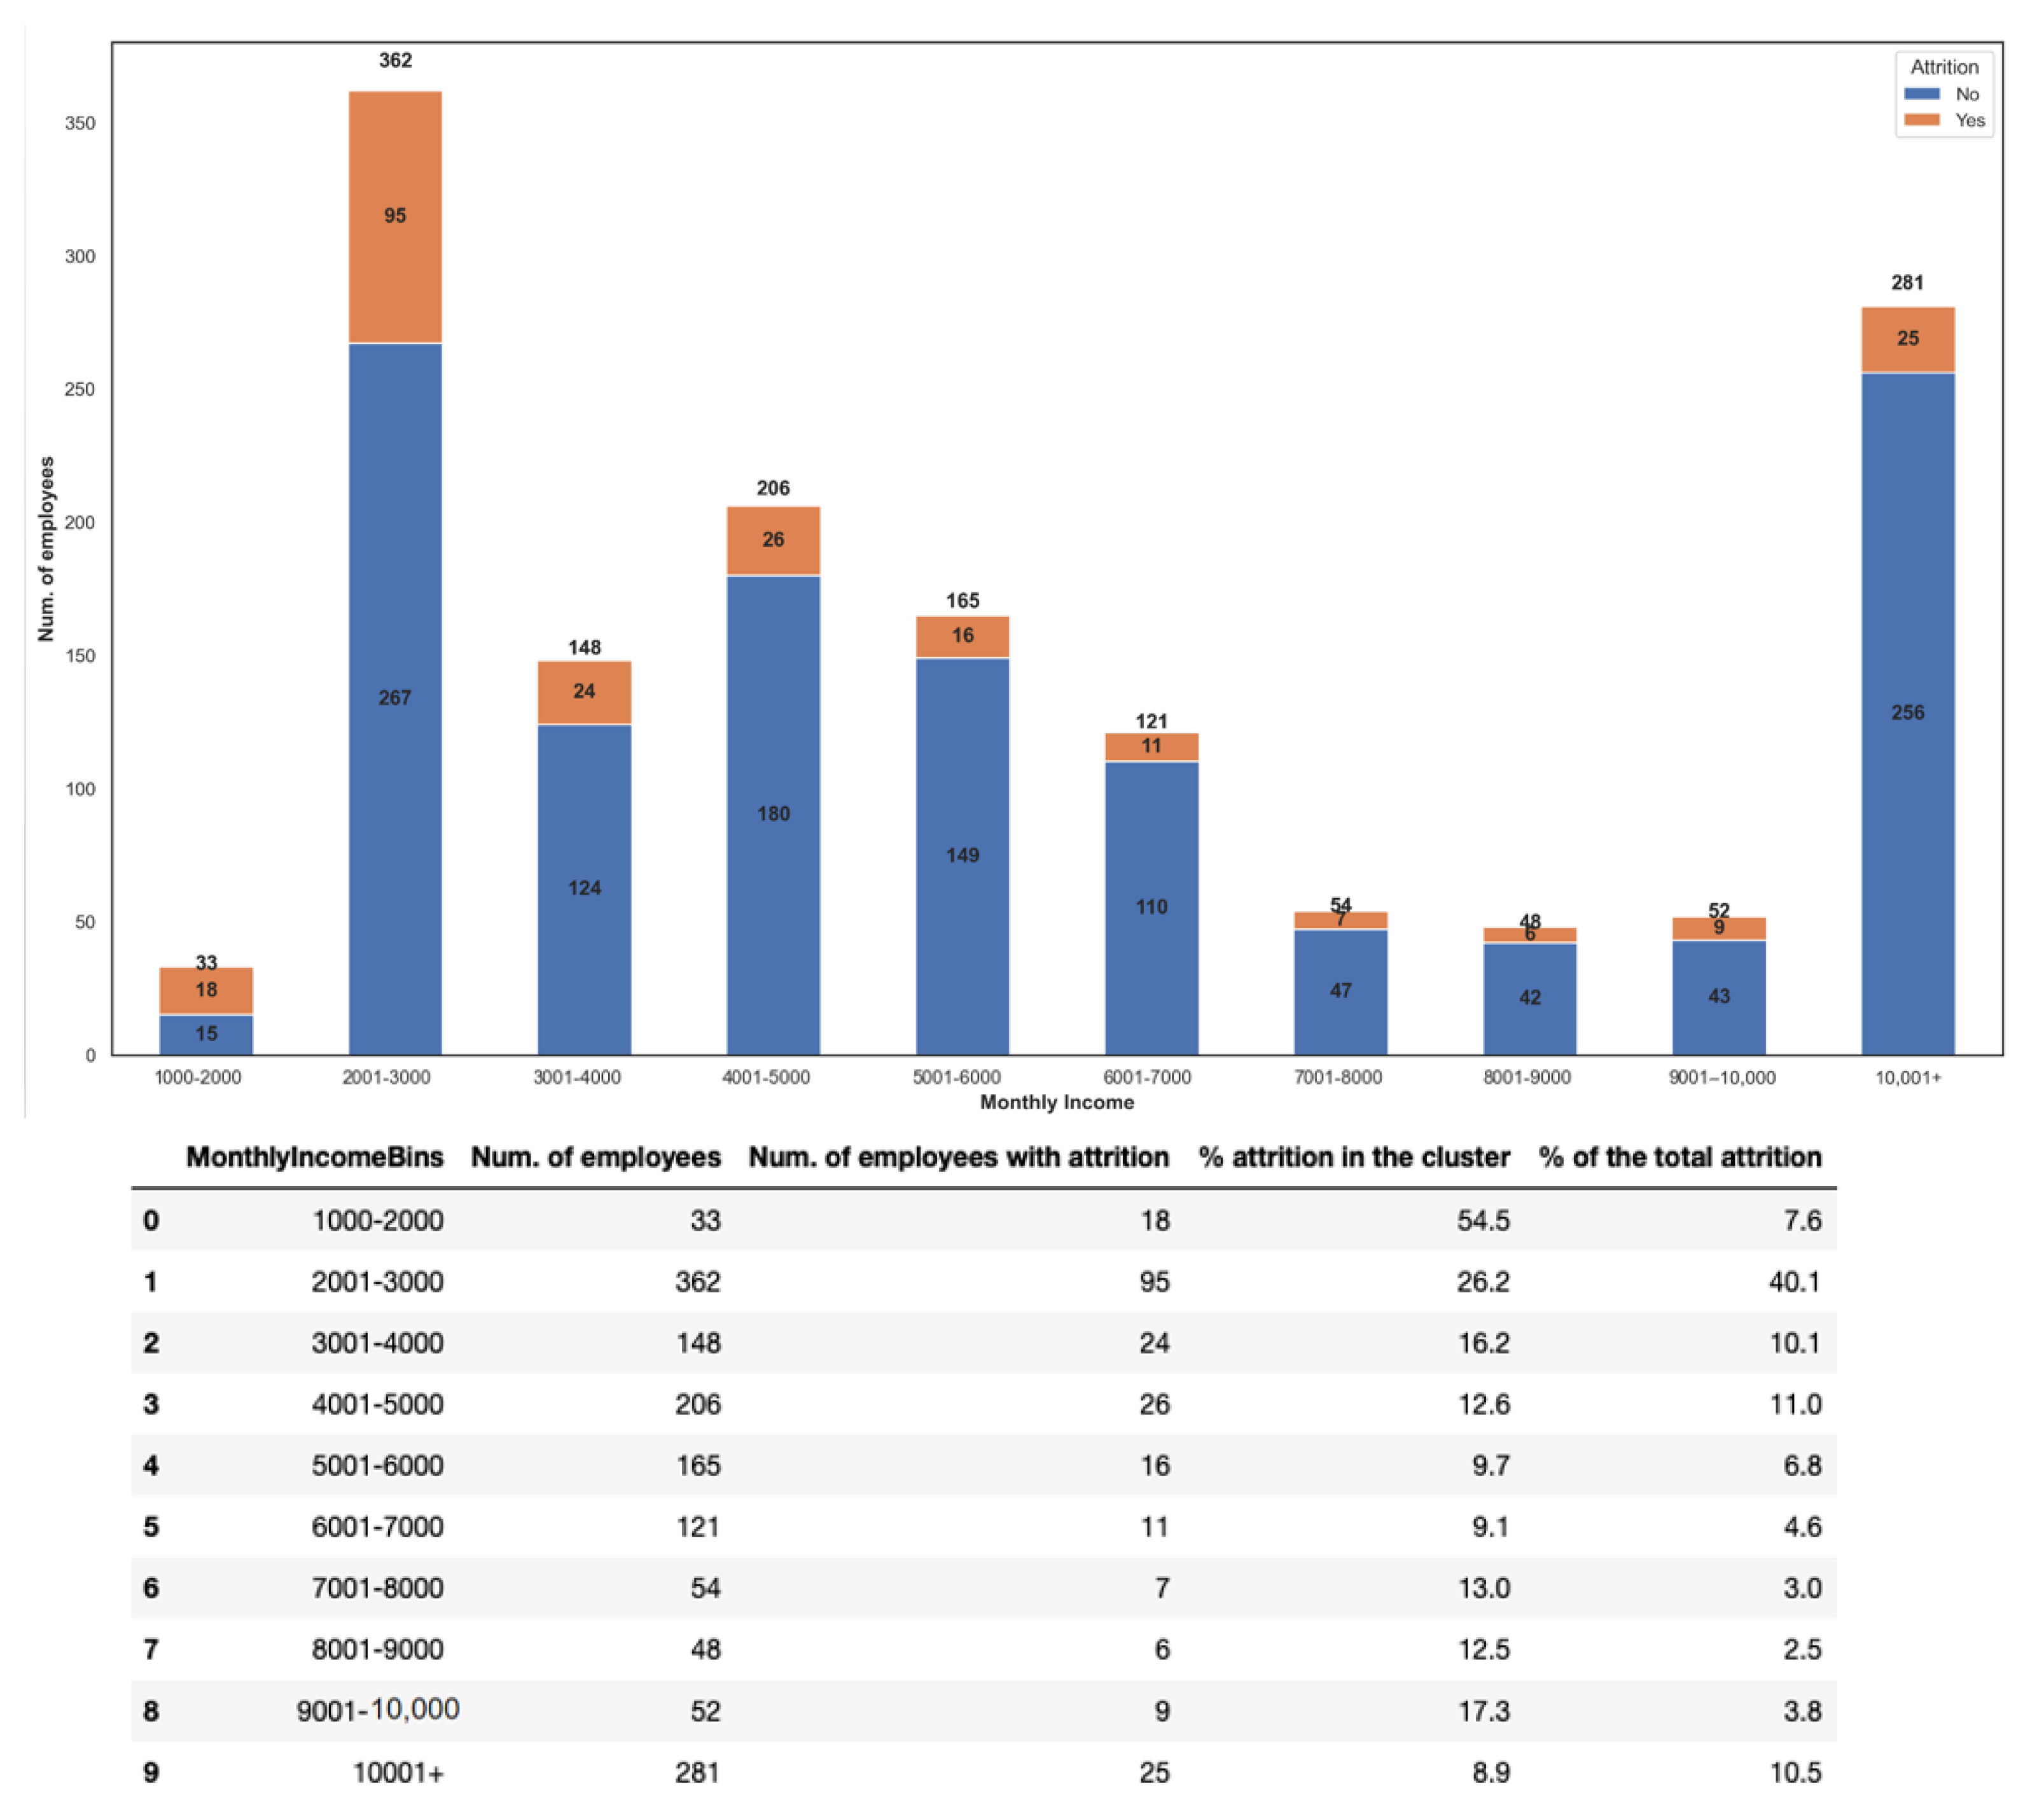
The descriptive analysis of dataset characteristics was conducted by relating each feature to the target variable “Attrition”. In this section we analysed only the five most important characteristics. The top factor for employee attrition seems to be monetary, as “MonthlyIncome” emerged at the top. This could be due to a poor compensation process (Figure 5).
The resignations progressively decrease for higher salaries. In fact, the highest attrition rate (up to 40% in the “$2001–$3000” range) is found in the lower salary bands, with the exception of wages above $10,000, where there is a reversal of the trend (over 10%). Moreover, it is worth noting the highest attrition percentage in its cluster of the employees is within the $1000–$2000 range equal to 54.5%.
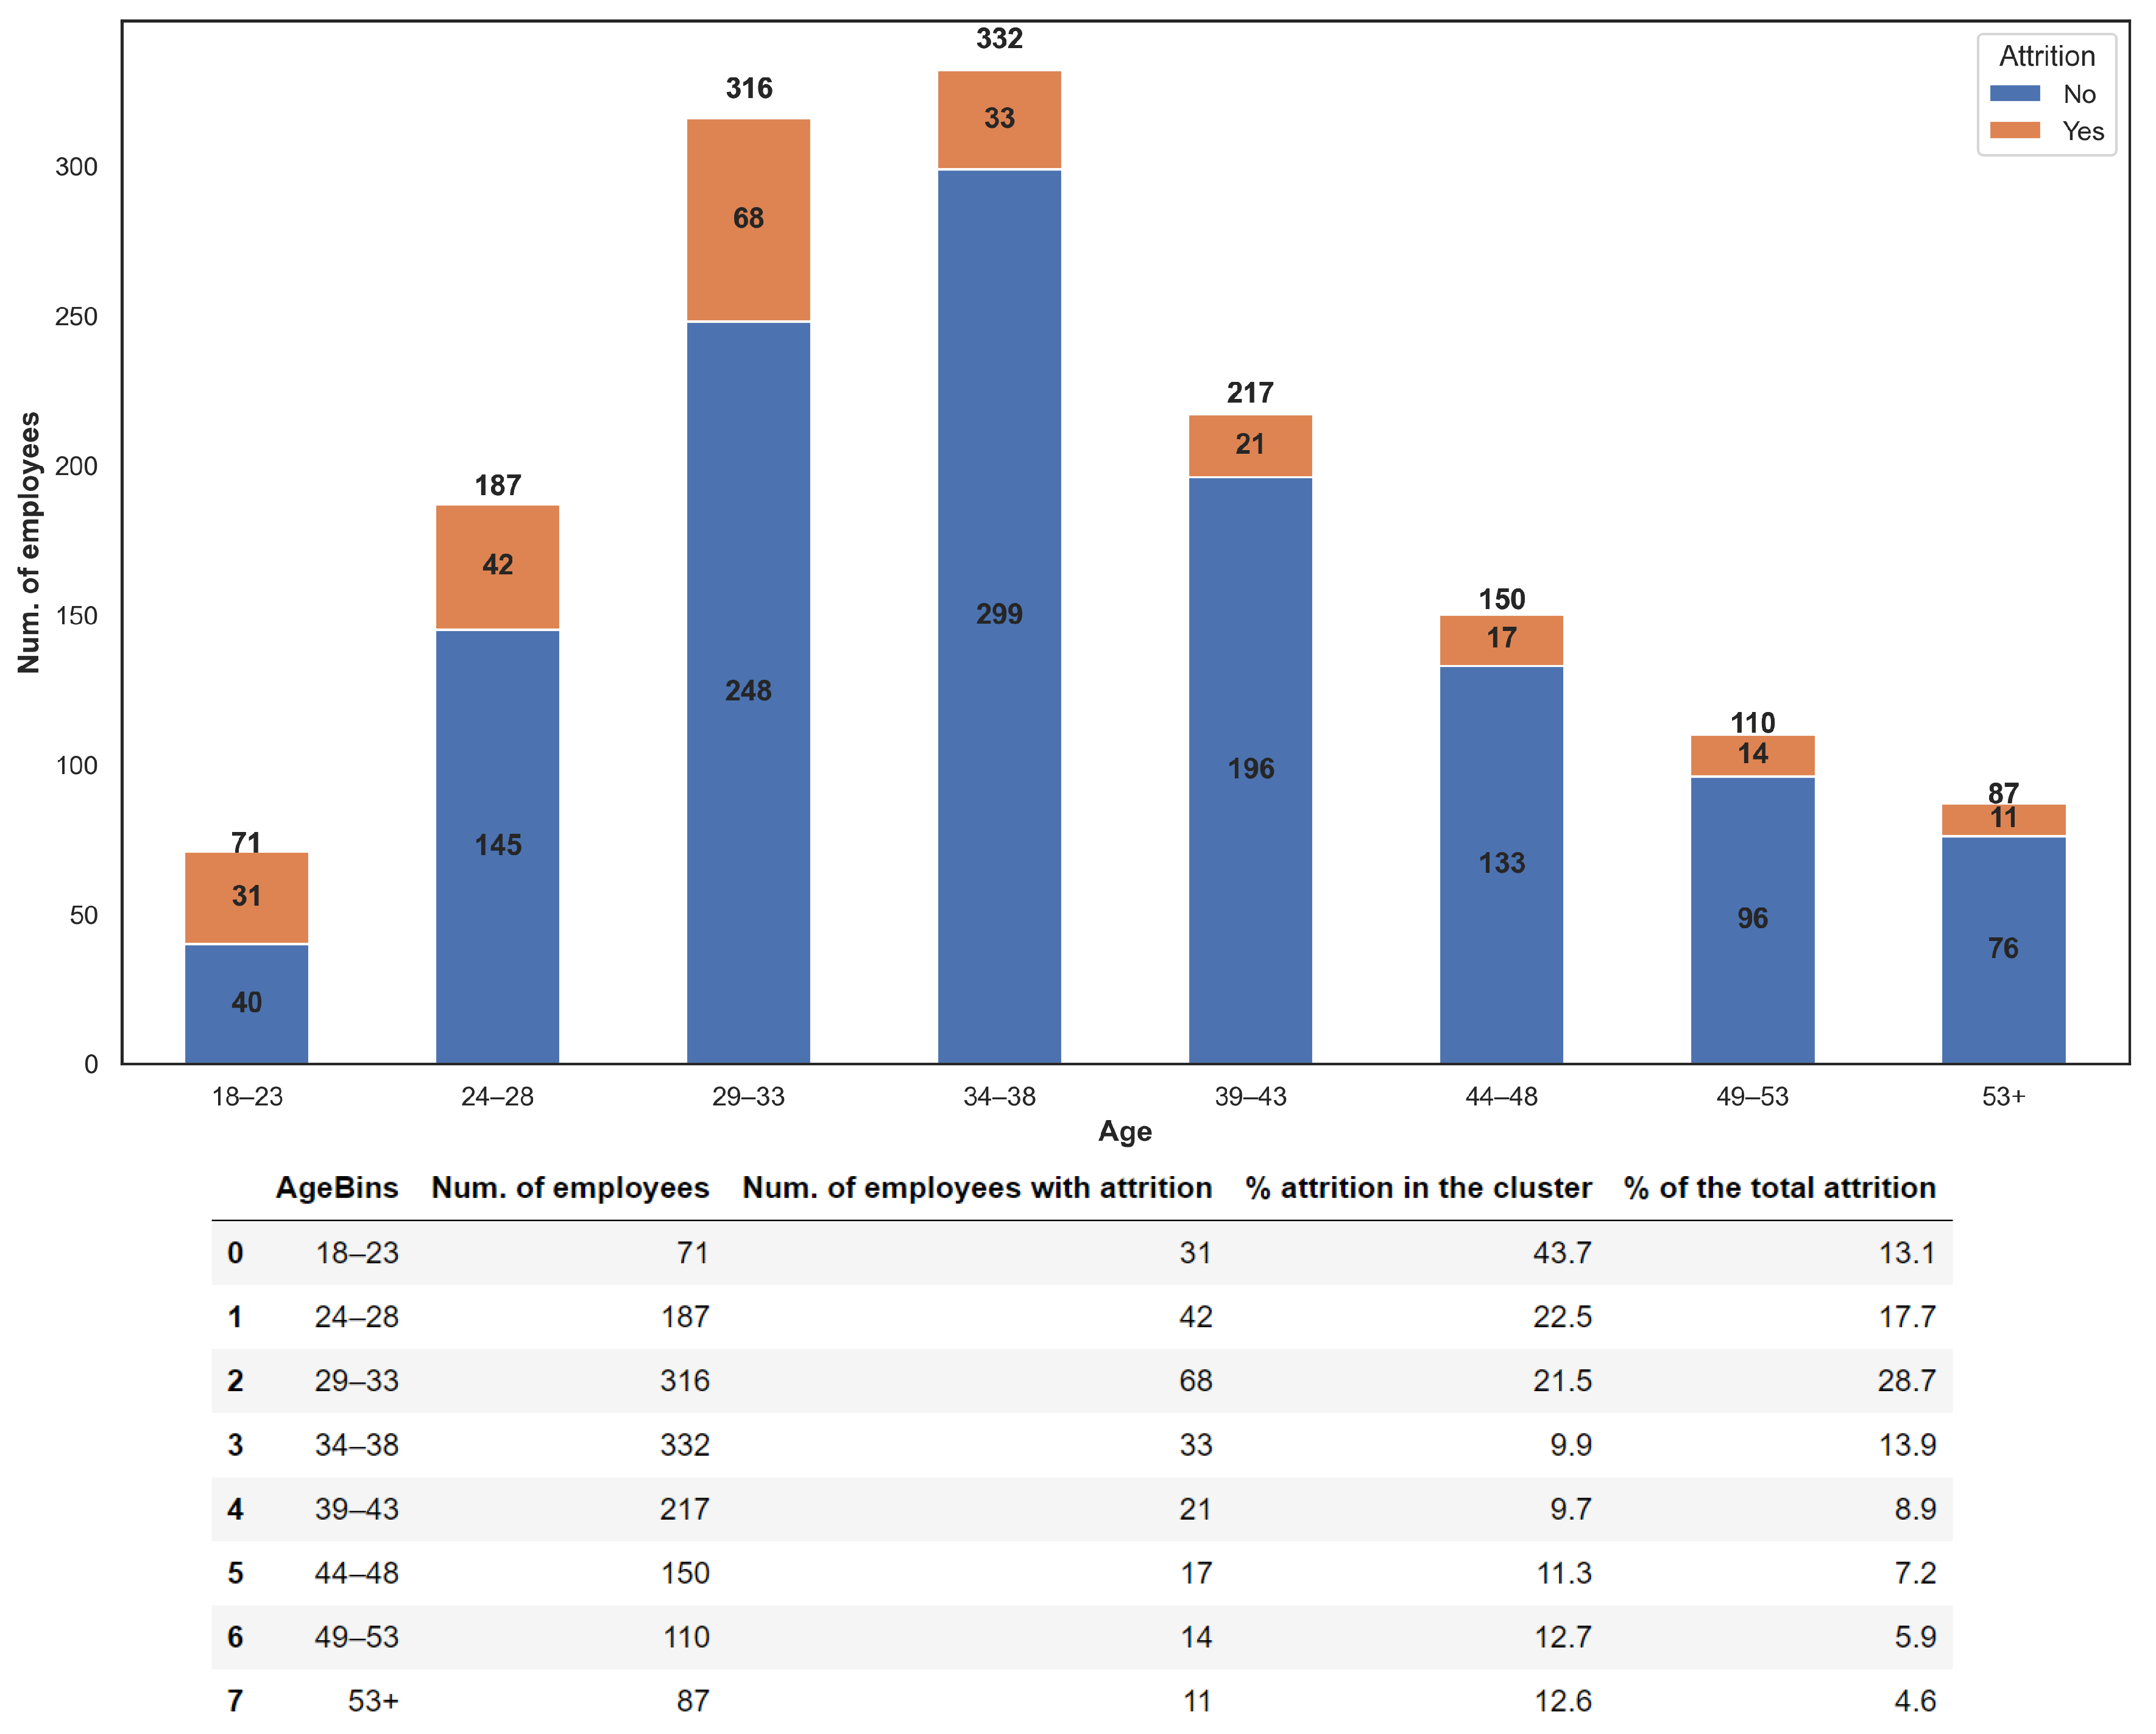
From the histogram of Figure 6, we can see that young employees (in the 18–23 age group) are more likely to leave the company. The percentage of attrition in their cluster is around 44% (31 out of 71 employees) and represents more than 13% of all attrition (31 out of 237 employees). As employees age, their attrition percentage decreases. On the contrary, looking at absolute values, the most affected category in attrition is the 29–33 age range, which has a value 28.7%, i.e., more than 60% higher than the second affected category (age “24–28”) and more than double of the third affected category (age “34–38”).
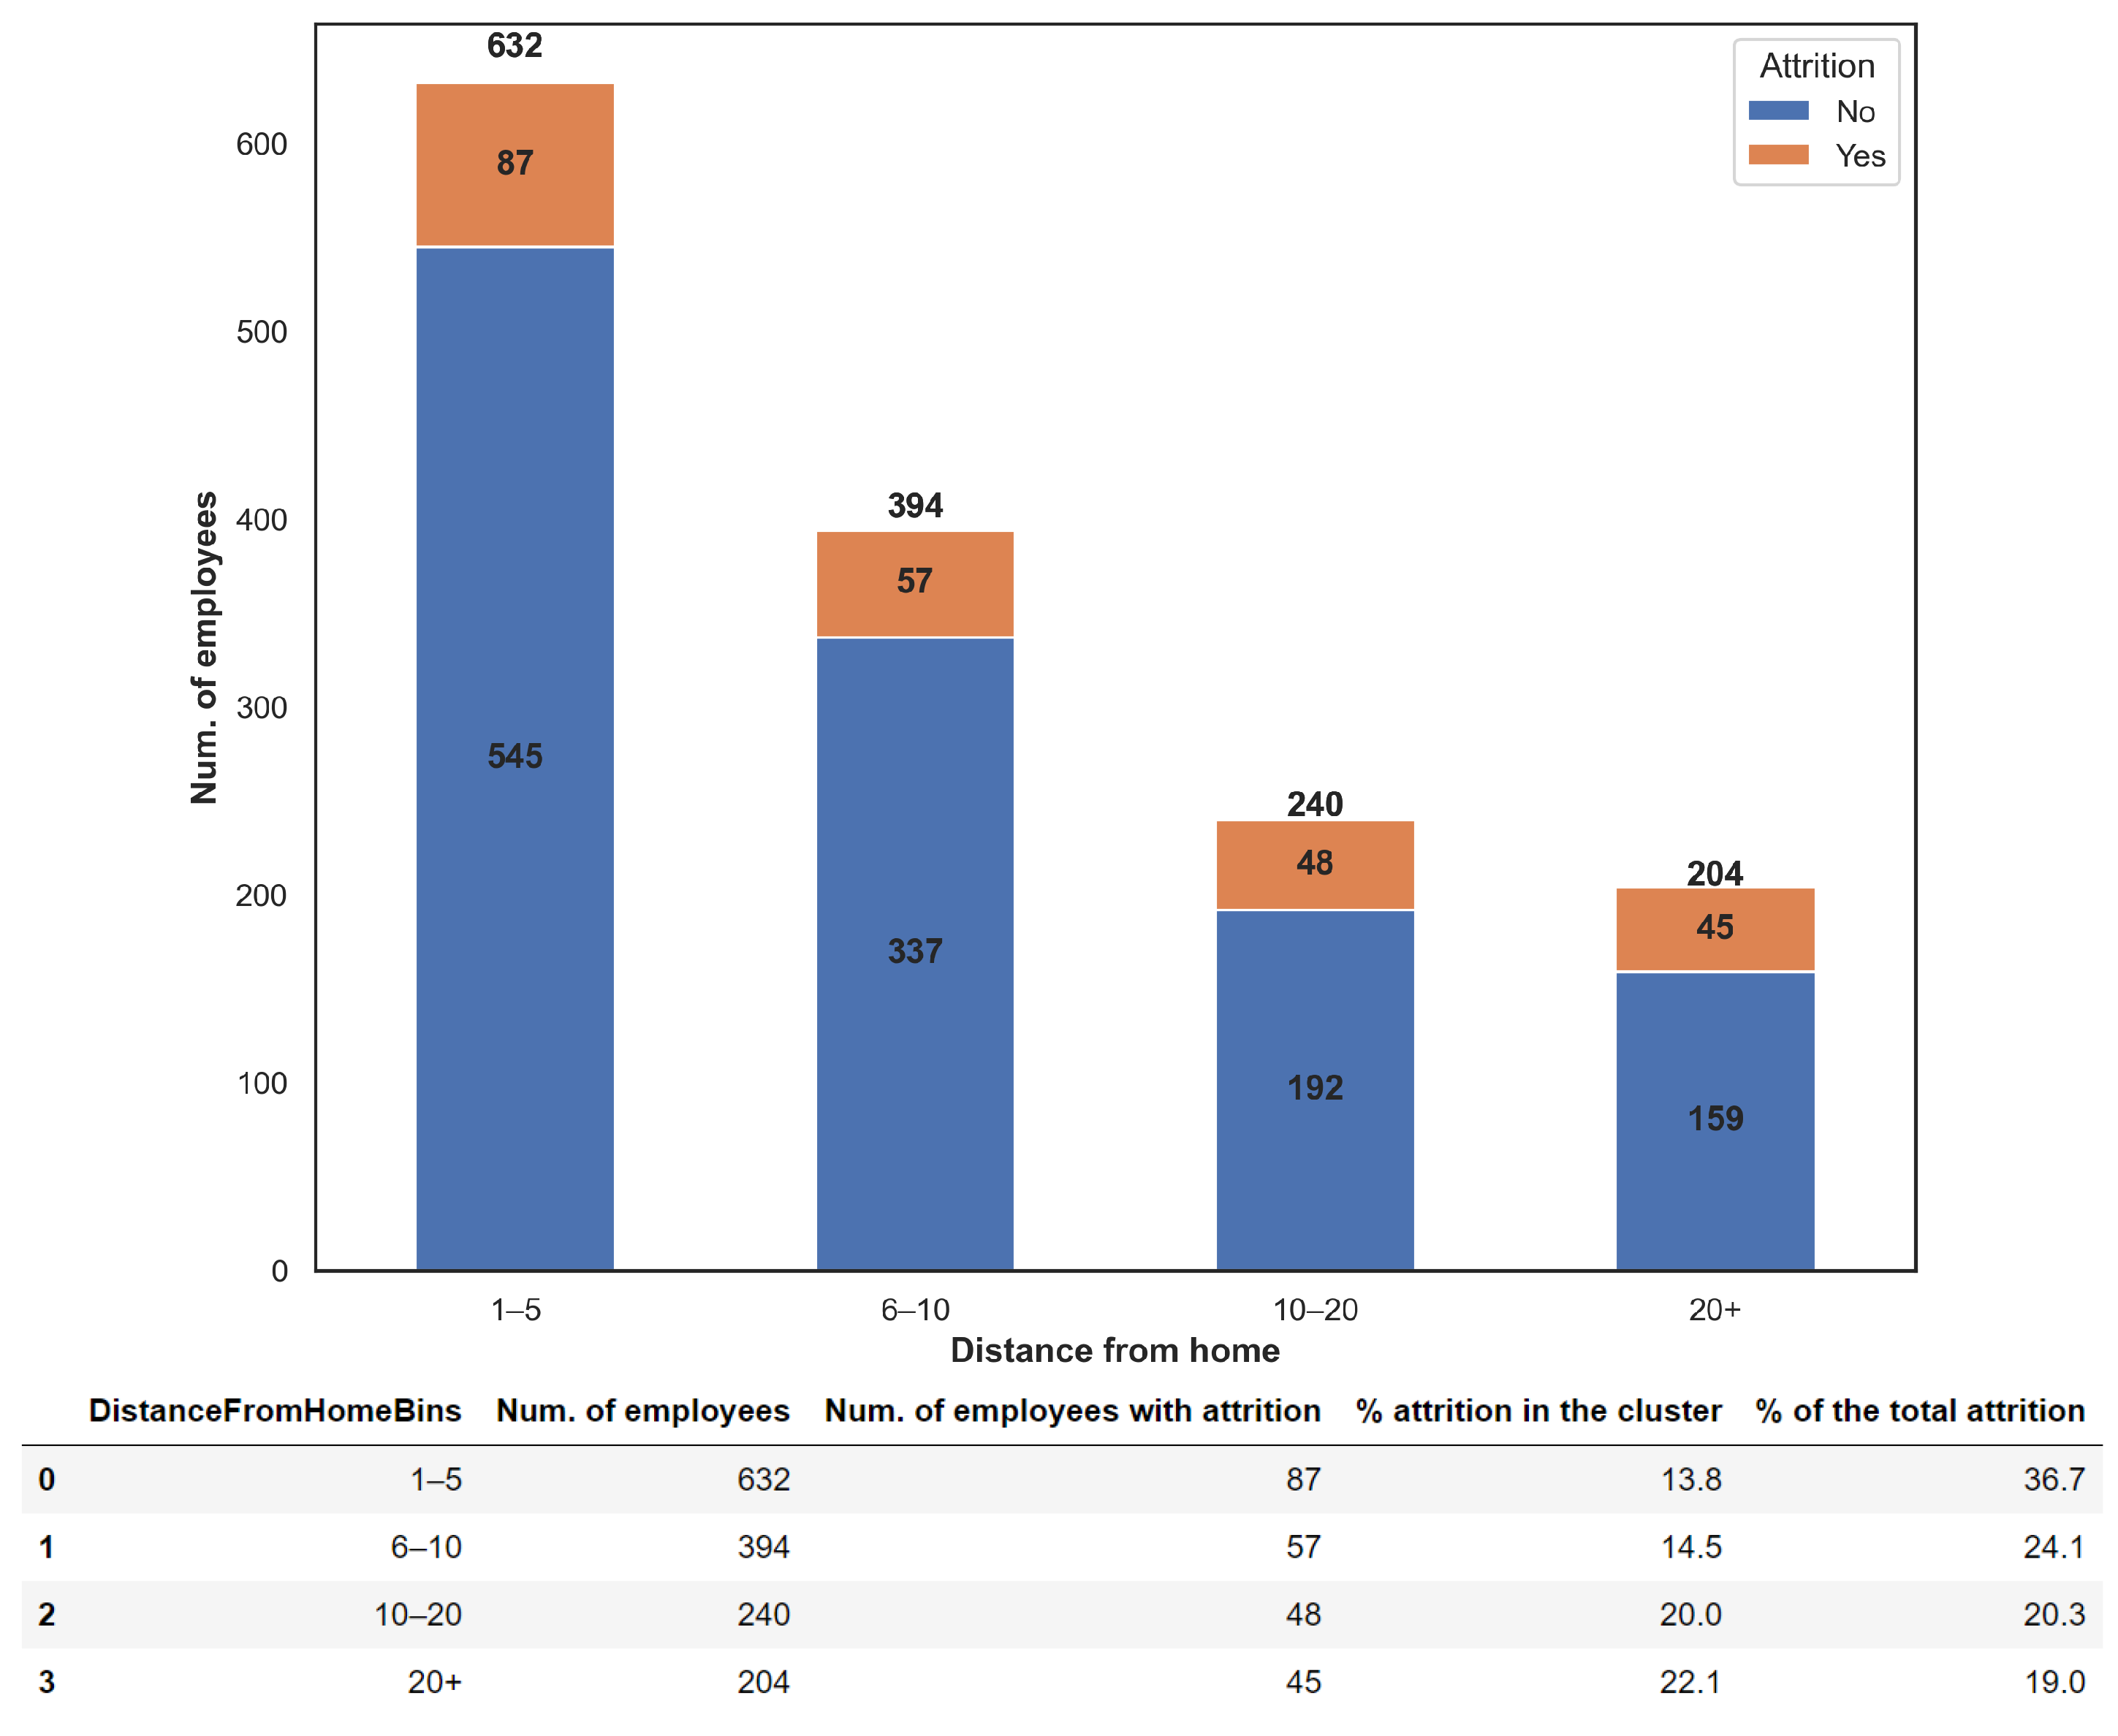
From the table of Figure 7, it is possible to observe that as the distance between home and office increases, there is a progressive increase in the rate of employees leaving the company.
Results in Figure 7 show that the percentages of attrition within the clusters do not vary significantly (i.e., between 14% and 22%). On the contrary, it can be noted that in absolute value more employees living close to company premises leave the job. In fact, the leaving rate is almost twice than that of the employees living over 20 km.
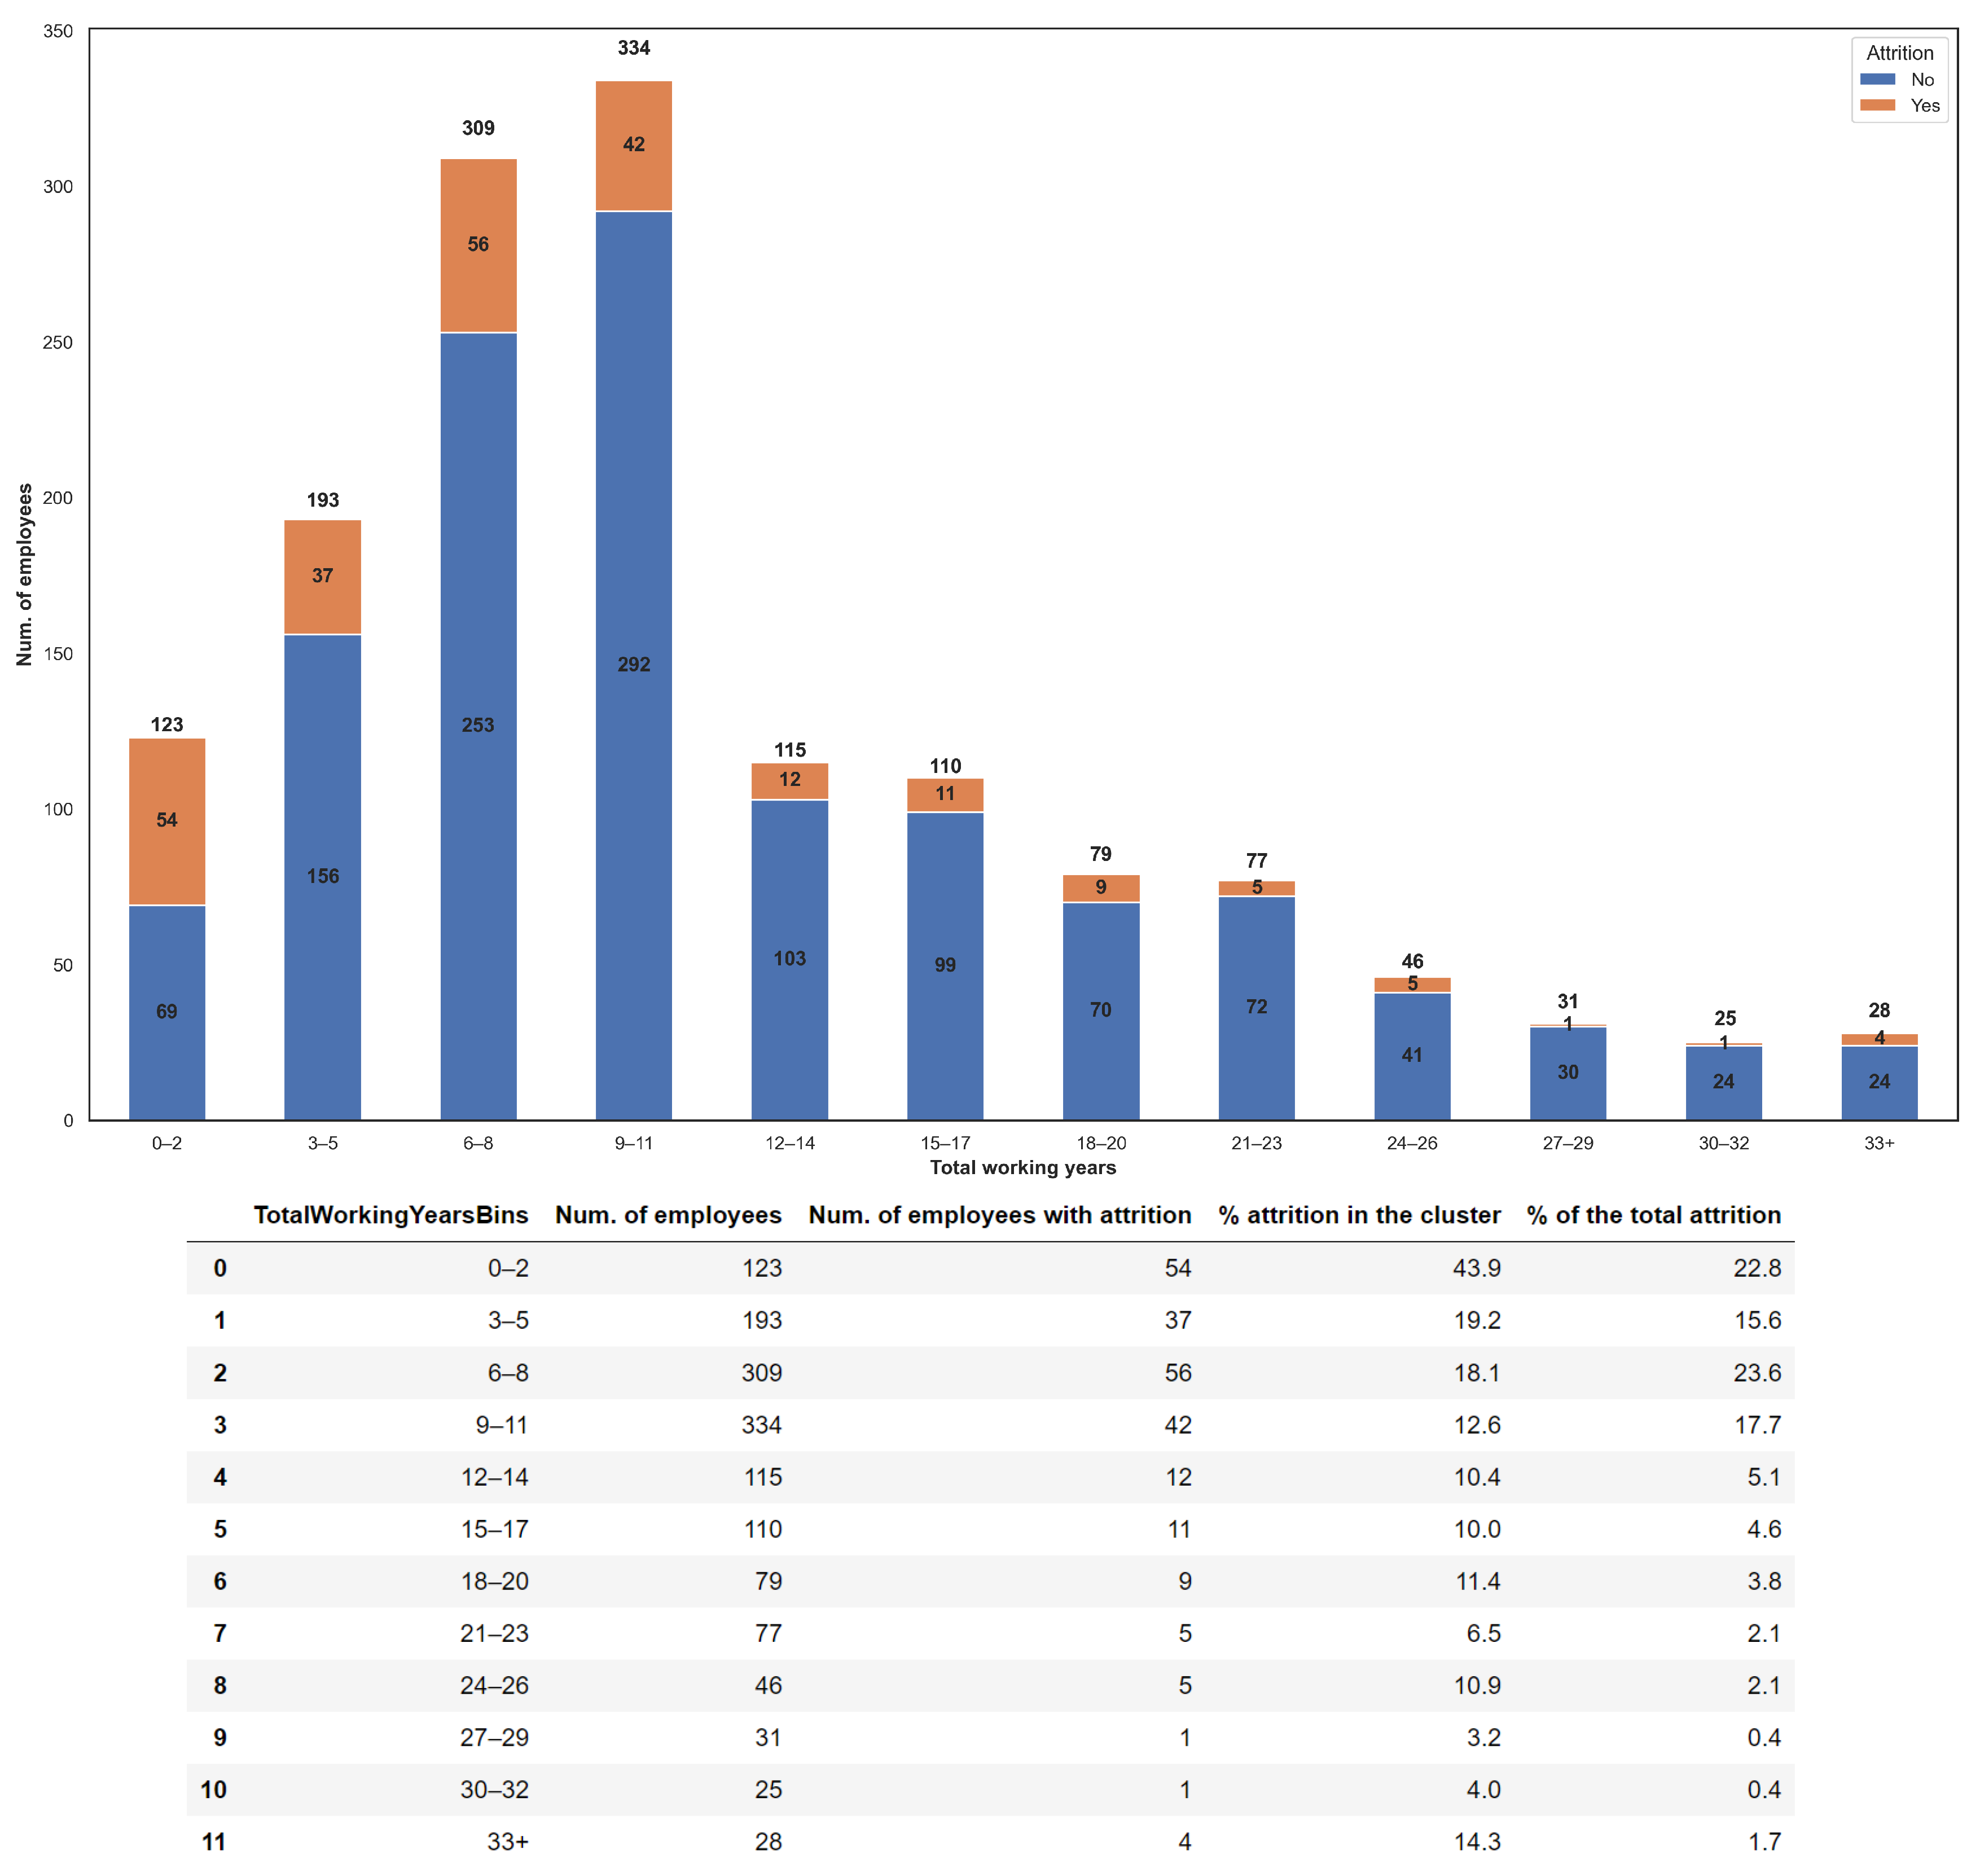
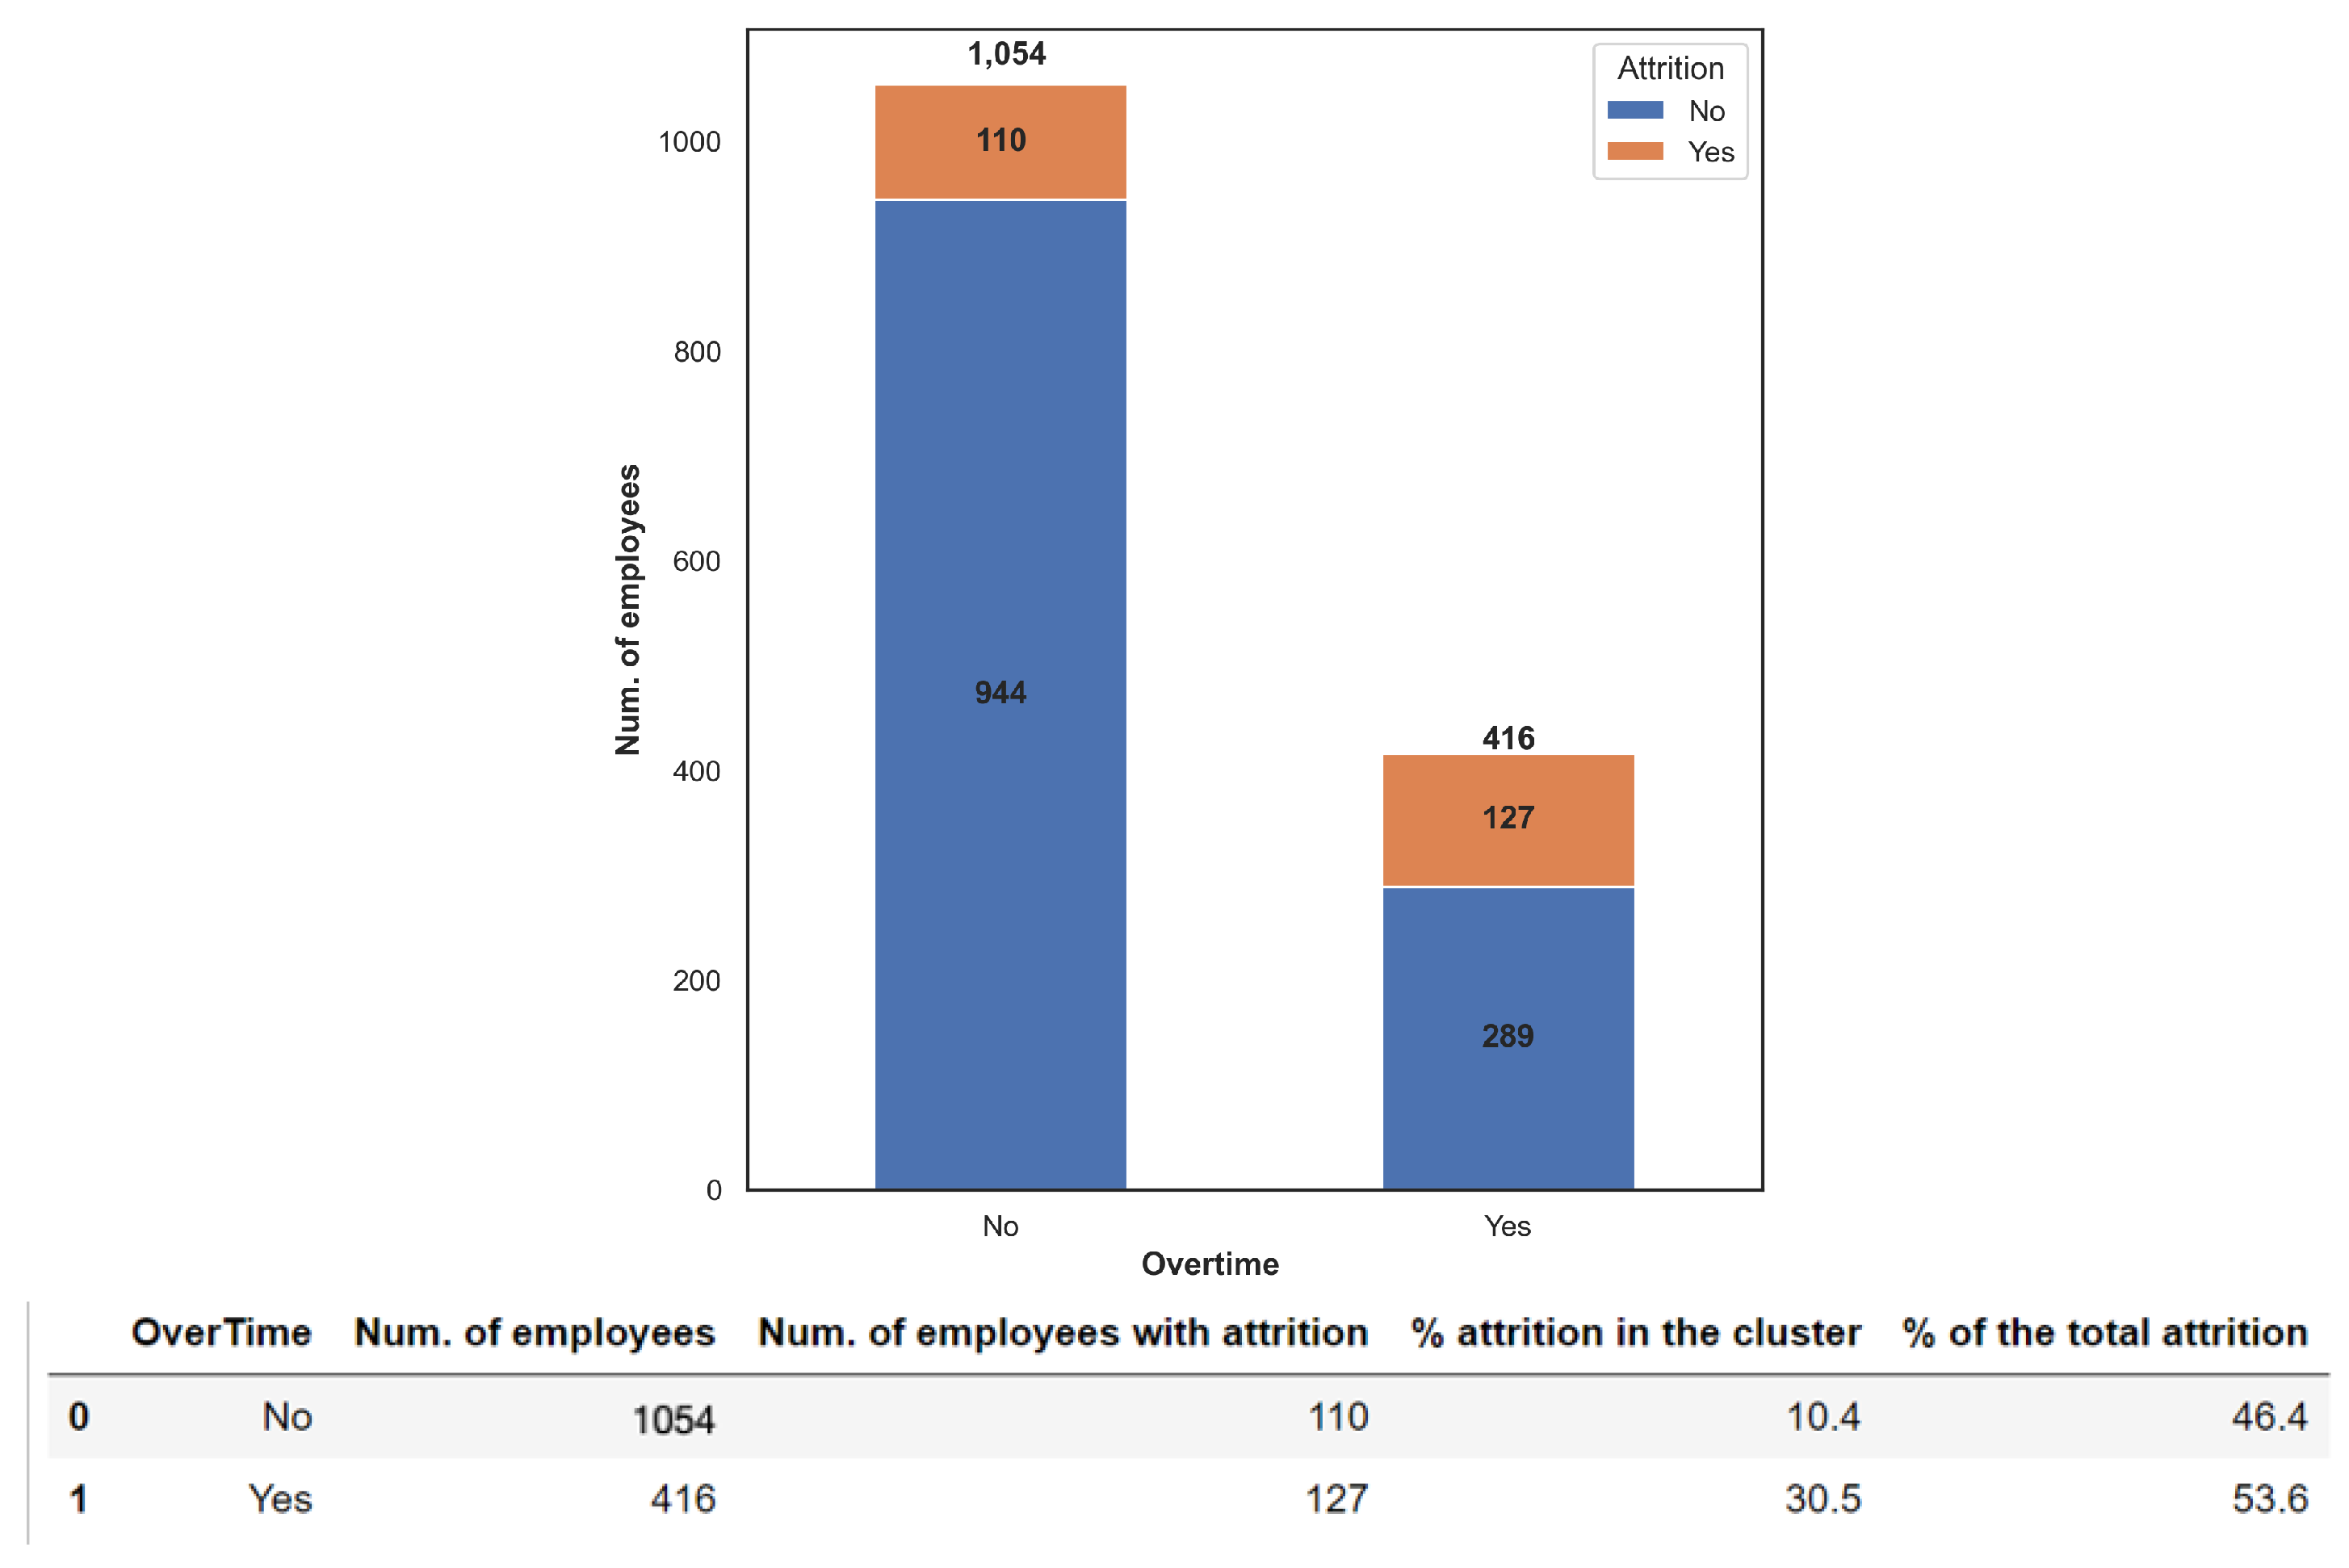
In Figure 8, we reported the attrition as a function of the total working years in the company. In general, it is possible to observe that employees with fewer years of experience are more likely to leave the company both in absolute value as well as in percentage within its own category. In fact, employees in categories of total working years of “0–2”, “3–5”, “6–8” and “9–11” present an attrition percentage between 15.6% and 23.6% with respect to the total resigned employees. Those percentages are more than triple with respect to the others. Concerning the percentage within its cluster, “0–2”, “3–5” and “6–8” have percentage almost doubled with respect to the others. The “0–2” category presents even about 44% of resigned employees within that category. Finally, attrition progressively decreases as the overall time working with the company increases from the “12–14” category on. In terms of those working overtime, the attrition rate is evenly balanced between employees who left the company and those still in service (Figure 9). Among workers who worked overtime, the percentage of attrition is over 30%, while employees who did not work overtime have an attrition rate of 10.4%.
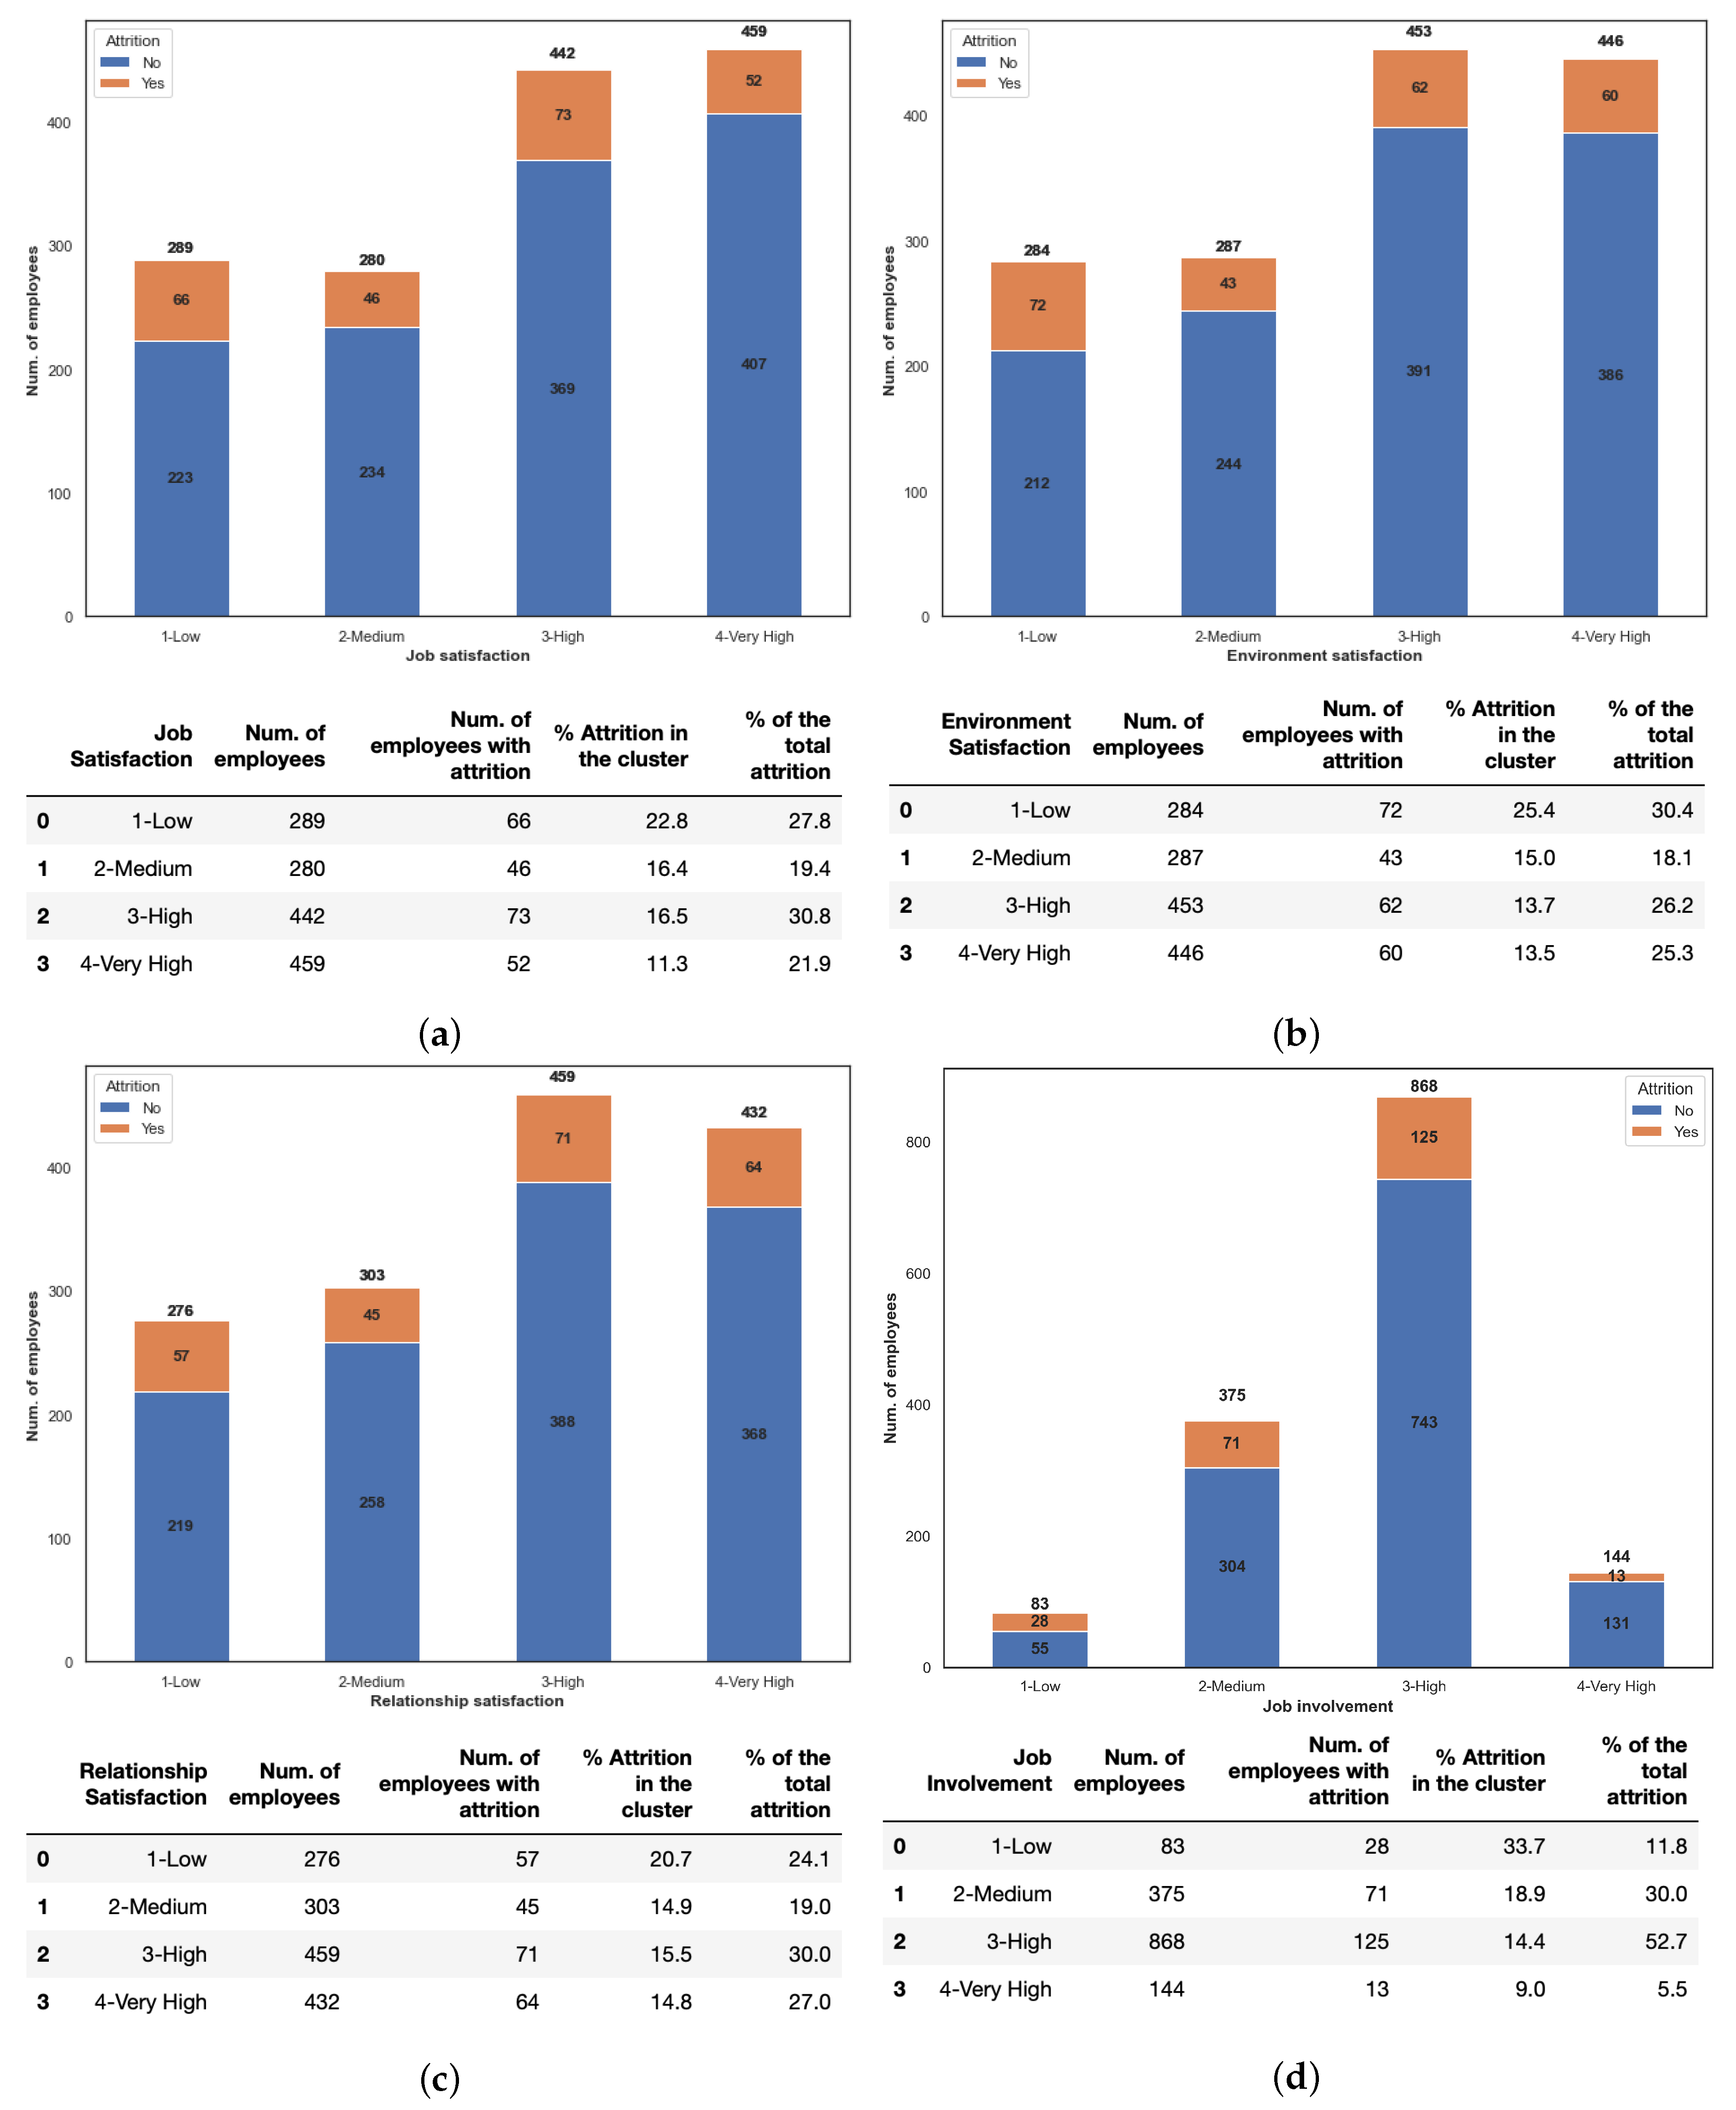
In Figure 10 we reported the distribution of attrition of the job satisfaction, environment satisfaction, relationship satisfaction and job involvement, respectively.
Results show that job involvement of the employee in the processes or tasks of the company is the most influencing parameters for his attrition. In fact, more than one-third of employees with “low” job involvement changes the work, while the other variables range from to . Finally, results showed in Figure 11 and Figure 10 demonstrate that the analysis on employees’ attrition performed through the proposed automatic predictor are related to the same causes highlighted in [16,17].
4. Model Building
The modelling process consists in selecting models that are based on various machine learning techniques used in the experimentation. In this case various predictive models were used such as those based on decision tree, Bayesian method, logistic regression and SVM. The goal is to identify the best classifier for the analysed problem. Each classifier must therefore be trained on the featured set and the classifier with the best classification results is used for prediction. The classification algorithms taken into consideration are:
- Gaussian Naive Bayes,
- Naive Bayes classifier for multivariate Bernoulli models,
- Logistic Regression classifier,
- K-nearest neighbours (K-NN),
- Decision tree classifier,
- Random forest classifier,
- Support Vector Machines (SVM) classification,
- Linear Support Vector Machines (LSVM) classification.
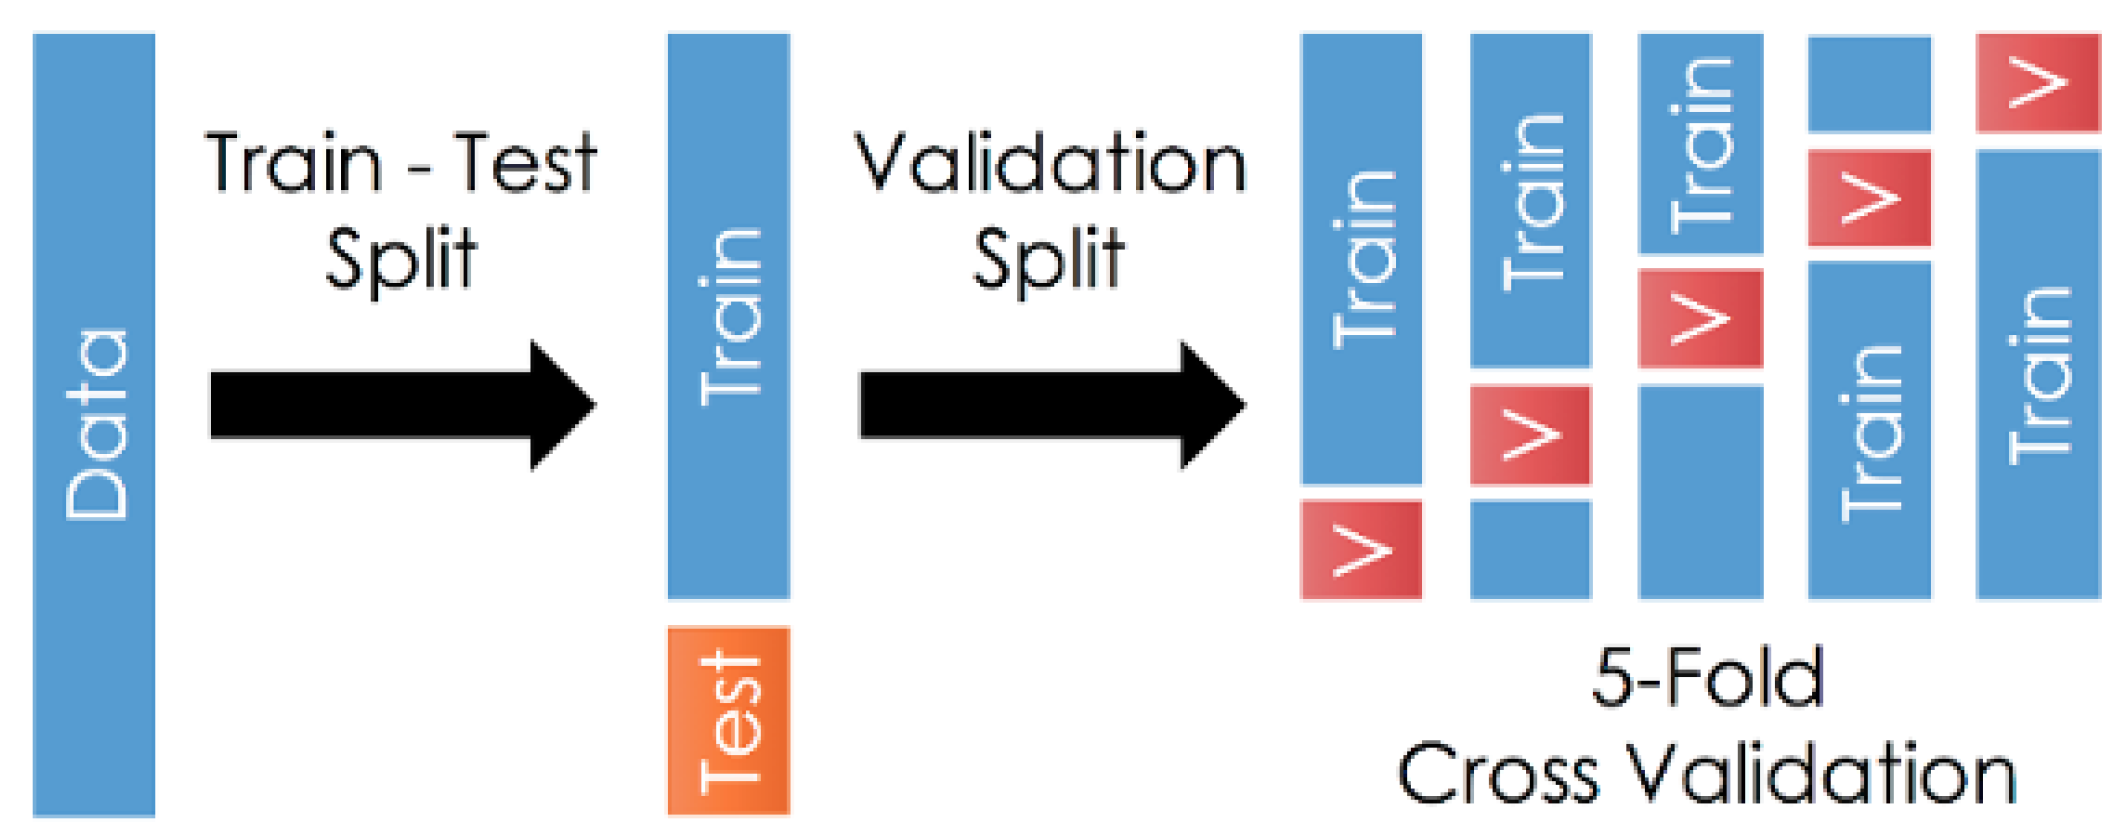
After identifying the objectives and adequately preparing and analysing the dataset to be used, we proceeded with the design of the prediction model to identify employees that would potentially leave the company. In the construction phase of a model that implements a supervised learning algorithm, it was necessary to have a training-set available that consisted of instances of an already classified population (target), in order to train the model to classify new observations, which will constitute the test-set (in which the attribute representing the class was missing). Then, the model must be trained on a consistent number of observations in order to refine its prediction ability. The precision of the machine learning algorithms increases with the amount of data available during training. Ideally, one would have two distinct datasets: one for training and a second to be used as a test. As two dedicated datasets were not available in this case, the original dataset was divided into two parts with a 70:30 ratio, one used for training and one used for testing (see Figure 12):
- Train set contained 70% of the dataset. This information was dedicated to the training phase in order to allow the model to learn the relationships hidden in the data; the train-set contains 1029 observations;
- Test set contained the remaining 30%. This information was dedicated to the test and validation phase in order to evaluate the general performance of the model and to calculate errors between predicted and actual results; the test-set contains 441 observations.
In addition, the newly created train and test datasets were further divided to extract the target variable (“Attrition”); the label was stored in a dedicated dataset (y) separating it from the dataset (X) containing the rest of the variables:
- X, containing all independent variables;
- y, containing the dependent variable, i.e., “Attrition”;
When evaluating the performance of a model, it is important to perform independent evaluation tests and to use multiple observations in assessment in order to obtain more reliable and accurate indicators of errors. Therefore, we adopted the following two techniques for a better error estimation:
- Holdout: When the datasets are in the split phase, it is essential to keep the same distribution of target variables within both the training and test datasets. Thus, it is necessary to avoid that a random subdivision can alter the proportion of the classes present in the training and test datasets from that in the original. The target (“attrition” attribute) is a binary variable with 84% “No” and 16% “Yes”, both datasets kept the same proportion after the split.
- Cross-validation: We adopted this technique to prevent over-fitting problems and to simplify the model. The training-set was randomly divided into five parts (k)—one was used as a validation-set and the other k-1s as training-sets, repeating the procedure k times. In each of the iterations, a different part was taken as the validation-set and finally the average prediction error was obtained by assessing the average errors in the k iterations performed on each k-validation set (see Figure 13).
The introduction of the validation-set makes it possible to preview the performances of the test-set, inducing an immediate review of the model in case performance is unsatisfactory.
In order to avoid that a feature dominates the others, we use a feature scaling. In feature scaling data standardisation is the process of resizing one or more attributes to produce an average value of zero and a standard deviation of one. If the variance in the orders of magnitude is greater for one characteristic than for the others, it could dominate the objective function and make the estimator unable to learn from other characteristics. For this reason, a standardisation was applied through a Z-Score normalisation:
where is the value to be standardised, is the average of the training samples and is the standard deviation of the training samples.
5. Results
This phase evaluated the qualities of the adopted models. The results of the decisions made in the prediction phase were collected, for each algorithm, in the relative “confusion matrix”. This is a matrix where the values predicted by the classifier are shown in the columns and the real values of each instance of the test-set are shown in rows. To proceed with the performance evaluation, we used the confusion matrix to derive a series of fundamental metrics to quantitatively express the efficiency of each algorithm: recording accuracy, precision, recall, specificity and F1-score. These metrics, summarised in Table 2, are based on the number of errors and correct answers formulated by the classifier:
In the considered case study, we are interested in predicting the greatest number of people who could leave the company by minimising the number of false negatives. Thus, Gaussian Naïve Bayes classifier was identified as the best classification algorithm able to achieve the objective of the analysis.
In Table 3 we reported the confusion matrix of the Gaussian Naïve Bayes classifier. The Gaussian Naïve Bayes algorithm correctly classified 364 out of 441 instances. This classifier obtained:
- The lowest false positive rate of approximately 4.5%. It only failed to detect 20 employees who had actually left the company, getting the best recall score of 0.541;
- The highest true positive rate of approximately 72%, correctly predicting 51 out of 71 workers who left the company;
Recall was identified as the most important performance metric to ensure the minimum number of false negatives (employees who may potentially leave the company but are not classified as such) to a lack of precision resulted in greater numbers of false positives (employees who do not meet the conditions for potentially leaving but are classified as such). The machine learning process does not end with the extraction of knowledge from a model; this knowledge must be expressed and represented in a manner that allows the end user to adopt it in practice. For this reason, an application was released that had been developed in Python and which was based on our analyses and findings. The user enters the personal and professional characteristics of a worker through a user interface and the application adopts a Gaussian Naïve Bayes classifier to predict whether an employee may potentially leave the company.
6. Conclusions
This work tried to provide answers to some of the common questions of responsible human resources management:
- What are the key indicators that signal that an employee will leave the company?
- What is the probability that an employee will leave the company?
To this aim, we applied some machine learning techniques in order to identify the factors that may contribute to an employee leaving the company and, above all, to predict the likelihood of individual employees leaving the company. First, we assess statistically the data and then we classified them. The dataset was processed, dividing it into the training phase and the test phase, guaranteeing the same distribution of the target variable (through the holdout technique). We selected various classification algorithms and, for each of them, we carried out the training and validation phases. To evaluate the algorithm’s performance, the predicted results were collected and fed into the respective confusion matrices. From these it was possible to calculate the basic metrics necessary for an overall evaluation (precision, recall, accuracy, f1 score, ROC curve, AUC, etc.) and to identify the most suitable classifier to predict whether an employee was likely to leave the company. The algorithm that produced the best results for the available dataset was the Gaussian Naïve Bayes classifier: it revealed the best recall rate (), a metric that measures the ability of a classifier to find all the positive instances, and achieved an overall false negative rate equal to of the total observations. Results obtained by the proposed automatic predictor demonstrate that the main attrition variables are monthly income, age, overtime, distance from home. The results obtained from the data analysis represent a starting point in the development of increasingly efficient employee attrition classifiers. The use of more numerous datasets or simply to update it periodically, the application of feature engineering to identify new significant characteristics from the dataset and the availability of additional information on employees would improve the overall knowledge of the reasons why employees leave their companies and, consequently, increase the time available to personnel departments to assess and plan the tasks required to mitigate this risk (e.g., retention activities, employee substitution and/or task redistribution).
Other existing economic evidence underlines the role played by outside opportunities on the labour market in employees utility in the current job and turnover intention [19,34,35,36]. In future research it is possible to improve the analysis by considering new employees’ opportunities as well as adverse working conditions (e.g., harm and hazard) and poor promotion prospects, discrimination and low social support, that are positively related to employees’ turnover intention [37,38].
Author Contributions
Conceptualization, F.F. and R.G.; Methodology, R.G.; Software, F.F. and M.C.; Validation, M.C. and R.G.; Formal Analysis, F.F.; Investigation, M.C.; Resources, M.C.; Data Curation, F.F.; Writing Original Draft Preparation, F.F. and M.C.; Writing Review & Editing, F.F. and R.G.; Visualization, M.C.; Supervision, F.F. and R.G.; Project Administration, E.W.D.L.; Funding Acquisition, E.W.D.L. All authors have read and agreed to the published version of the manuscript.
Funding
This research received no external funding.
Conflicts of Interest
The authors declare no conflict of interest.
References
- Cockburn, I.; Henderson, R.; Stern, S. The Impact of Artificial Intelligence on Innovation. In The Economics of Artificial Intelligence: An Agenda; University of Chicago Press: Chicago, IL, USA, 2019; pp. 115–146. [Google Scholar]
- Jarrahi, M. Artificial intelligence and the future of work: Human-AI symbiosis in organizational decision making. Bus. Horiz. 2018, 61, 577–586. [Google Scholar] [CrossRef]
- Yanqing, D.; Edwards, J.; Dwivedi, Y. Artificial intelligence for decision making in the era of Big Data. Int. J. Inf. Manag. 2019, 48, 63–71. [Google Scholar]
- Paschek, D.; Luminosu, C.; Dra, A. Automated business process management-in times of digital transformation using machine learning or artificial intelligence. In MATEC Web of Conferences; EDP Sciences: Les Ulis, France, 2017; Volume 121. [Google Scholar]
- Varian, H. Artificial Intelligence, Economics, and Industrial Organization; National Bureau of Economic Research: Cambridge, MA, USA, 2018. [Google Scholar]
- Vardarlier, P.; Zafer, C. Use of Artificial Intelligence as Business Strategy in Recruitment Process and Social Perspective. In Digital Business Strategies in Blockchain Ecosystems; Springer: Berlin/Heidelberg, Germany, 2019; pp. 355–373. [Google Scholar]
- Gupta, P.; Fernandes, S.; Manish, J. Automation in Recruitment: A New Frontier. J. Inf. Technol. Teach. Cases 2018, 8, 118–125. [Google Scholar] [CrossRef]
- Geetha, R.; Bhanu Sree Reddy, D. Recruitment through artificial intelligence: A conceptual study. Int. J. Mech. Eng. Technol. 2018, 9, 63–70. [Google Scholar]
- Syam, N.; Sharma, A. Waiting for a sales renaissance in the fourth industrial revolution: Machine learning and artificial intelligence in sales research and practice. Ind. Mark. Manag. 2018, 69, 135–146. [Google Scholar] [CrossRef]
- Mishra, S.; Lama, D.; Pal, Y. Human Resource Predictive Analytics (HRPA) For HR Management in Organizations. Int. J. Sci. Technol. Res. 2016, 5, 33–35. [Google Scholar]
- Jain, N.; Maitri. Big Data and Predictive Analytics: A Facilitator for Talent Management. In Data Science Landscape; Springer: Singapore, 2018; pp. 199–204. [Google Scholar]
- Boushey, H.; Glynn, S.J. There Are Significant Business Costs to Replacing Employees. Cent. Am. Prog. 2012, 16, 1–9. [Google Scholar]
- Martin, L. How to retain motivated employees in their jobs? Econ. Ind. Democr. 2018, 34, 25–41. [Google Scholar] [CrossRef]
- Wood, S.; Van Veldhoven, M.; Croon, M.; de Menezes, L.M. Enriched job design, high involvement management and organizational performance: The mediating roles of job satisfaction and wellbeing. Hum. Relat. 2012, 65, 419–446. [Google Scholar] [CrossRef]
- Zelenski, J.M.; Murphy, S.A.; Jenkins, D.A. The happy-productive worker thesis revisited. J. Happiness Stud. 2008, 9, 521–537. [Google Scholar] [CrossRef]
- Clark, A.E. What really matters in a job? Hedonic measurement using quit data. Labour Econ. 2001, 8, 223–242. [Google Scholar] [CrossRef]
- Clark, A.E.; Georgellis, Y.; Sanfey, P. Job satisfaction, wage changes, and quits: Evidence from Germany. Res. Labor Econ. 1998, 17, 95–121. [Google Scholar]
- Delfgaauw, J. The effect of job satisfaction on job search: Not just whether, but also where. Labour Econ. 2007, 14, 299–317. [Google Scholar] [CrossRef] [Green Version]
- Green, F. Well-being, job satisfaction and labour mobility. Labour Econ. 2010, 17, 897–903. [Google Scholar] [CrossRef] [Green Version]
- Kristensen, N.; Westergaard-Nielsen, N. Job satisfaction and quits – which job characteristics matters most? Dan. Econ. J. 2006, 144, 230–249. [Google Scholar]
- Marchington, M.; Wilkinson, A.; Donnelly, R.; Kynighou, A. Human Resource Management at Work; Kogan Page Publishers: London, UK, 2016. [Google Scholar]
- Van Reenen, J. Human resource management and productivity. In Handbook of Labor Economics; Elsevier: Amsterdam, The Netherlands, 2011. [Google Scholar]
- Deepak, K.D.; Guthrie, J.; Wright, P. Human Resource Management and Labor Productivity: Does Industry Matter? Acad. Manag. J. 2005, 48, 135–145. [Google Scholar]
- Gordini, N.; Veglio, V. Customers churn prediction and marketing retention strategies. An application of support vector machines based on the AUC parameter-selection technique in B2B e-commerce industry. Ind. Mark. Manag. 2016, 62, 100–107. [Google Scholar] [CrossRef]
- Keramati, A.; Jafari-Marandi, R.; Aliannejadi, M.; Ahmadian, I.; Mozaffari, M.; Abbasi, U. Improved churn prediction in telecommunication industry using data mining techniques. Appl. Soft Comput. 2014, 24, 994–1012. [Google Scholar] [CrossRef]
- Alao, D.; Adeyemo, A. Analyzing employee attrition using decision tree algorithms. Comput. Inf. Syst. Dev. Inf. Allied Res. J. 2013, 4, 17–28. [Google Scholar]
- Nagadevara, V. Early Prediction of Employee Attrition in Software Companies-Application of Data Mining Techniques. Res. Pract. Hum. Resour. Manag. 2008, 16, 2020–2032. [Google Scholar]
- Rombaut, E.; Guerry, M.A. Predicting voluntary turnover through Human Resources database analysis. Manag. Res. Rev. 2018, 41, 96–112. [Google Scholar] [CrossRef]
- Usha, P.; Balaji, N. Analysing Employee attrition using machine learning. Karpagam J. Comput. Sci. 2019, 13, 277–282. [Google Scholar]
- Ponnuru, S.; Merugumala, G.; Padigala, S.; Vanga, R.; Kantapalli, B. Employee Attrition Prediction using Logistic Regression. Int. J. Res. Appl. Sci. Eng. Technol. 2020, 8, 2871–2875. [Google Scholar] [CrossRef]
- Microsoft Docs: Team Data Science Process. Available online: https://docs.microsoft.com/it-it/azure/machine-learning/team-data-science-process/ (accessed on 31 October 2020).
- IBM HR Analytics Employee. Available online: https://www.kaggle.com/pavansubhasht/ibm-hr-analytics-attrition-dataset (accessed on 31 October 2020).
- CrowdFlower. Data Science Report. 2016. Available online: https://visit.figure-eight.com/data-science-report.html (accessed on 31 October 2020).
- Antecol, H.; Cobb-Clark, D. Racial harassment, job satisfaction, and intentions to remain in the military. J. Popul. Econ. 2009, 22, 713–738. [Google Scholar] [CrossRef] [Green Version]
- Böckerman, P.; Ilmakunnas, P. Job disamenities, job satisfaction, quit intentions, and actual separations: Putting the pieces together. Ind. Relations 2009, 48, 73–96. [Google Scholar] [CrossRef] [Green Version]
- Theodossiou, I.; Zangelidis, A. Should I stay or should I go? The effect of gender, education and unemployment on labour market transitions. Labour Econ. 2009, 16, 566–577. [Google Scholar] [CrossRef]
- Böckerman, P.; Ilmakunnas, P.; Jokisaari, M.; Vuori, J. Who stays unwillingly in a job? A study based on a representative random sample of employees. Econ. Ind. Democr. 2013, 34, 25–41. [Google Scholar] [CrossRef] [Green Version]
- Griffeth, R.W.; Hom, P.W.; Gaertner, S. A meta-analysis of antecedents and correlates of employee turnover: Update, moderator tests, and research implications for the next millennium. J. Manag. 2000, 26, 463–488. [Google Scholar] [CrossRef]
Figure 1.
Phases of the analysis process.

Figure 2.
Dataset descriptive statistics.

Figure 3.
Correlation heatmap.

Figure 4.
Feature importance.

Figure 5.
Distribution of attrition by monthly income.

Figure 6.
Distribution of attrition by age.

Figure 7.
Distribution of attrition by distance from home.

Figure 8.
Distribution of attrition by total working years.

Figure 9.
Distribution of attrition by overtime.

Figure 10.
Distribution of attrition by: (a) job satisfaction, (b) environment satisfaction, (c) relationship satisfaction, (d) job involvement.
Figure 10.
Distribution of attrition by: (a) job satisfaction, (b) environment satisfaction, (c) relationship satisfaction, (d) job involvement.

Figure 11.
Distribution of attrition by department.

Figure 12.
Dataset split process.

Figure 13.
K-Fold cross-validation.


Table 1.
Dataset features.
| Age | Monthly income |
| Attrition | Monthly rate |
| Business travel | Number of previous employers |
| Daily rate | Over 18 |
| Department | Overtime |
| Distance from home | Per cent salary hike |
| Education | Performance rating |
| Education field | Relations satisfaction |
| Employee count | Standard hours |
| Employee number | Stock option level |
| Environment satisfaction | Total working years |
| Gender Training times | last year |
| Hourly rate | Work-life balance |
| Job involvement | Years with company |
| Job level | Years in current role |
| Job role | Years since last promotion |
| Job satisfaction | Years with current manager |
| Marital status |
Table 2.
Evaluation metrics.
| Accuracy Train | Accuracy Test | Precision | Recall | Specificity | F1 Score | |
|---|---|---|---|---|---|---|
| Gaussian NB | 0.782 | 0.825 | 0.386 | 0.541 | 0.845 | 0.446 |
| Bernoulli NB | 0.831 | 0.845 | 0.459 | 0.331 | 0.927 | 0.379 |
| Logistic Regression | 0.865 | 0.875 | 0.663 | 0.337 | 0.962 | 0.445 |
| K Nearest Neighbour | 0.842 | 0.852 | 0.551 | 0.090 | 0.994 | 0.150 |
| Decision Tree | 0.792 | 0.823 | 0.356 | 0.361 | 0.910 | 0.351 |
| Random Forest | 0.850 | 0.861 | 0.658 | 0.132 | 0.991 | 0.194 |
| SVC | 0.851 | 0.859 | 0.808 | 0.096 | 0.994 | 0.166 |
| Linear SVC | 0.858 | 0.879 | 0.665 | 0.247 | 0.978 | 0.358 |
Table 3.
Gaussian Naïve Bayes confusion matrix. Note, 0 = not left and 1 = left.
| Predicted 0 | Predicted 1 | ||
|---|---|---|---|
| 313 | 57 | 370 | |
| Real 0 | 70.98% | 12.93% | 84.59% |
| 15.41% | |||
| 20 | 51 | 71 | |
| Real 1 | 4.54% | 11.56% | 71.83% |
| 28.17% | |||
| 333 | 108 | 441 | |
| 93.99% | 47.22 % | 82.54% | |
| 6.01% | 52.78% | 17.46% |
Publisher’s Note: MDPI stays neutral with regard to jurisdictional claims in published maps and institutional affiliations. |
© 2020 by the authors. Licensee MDPI, Basel, Switzerland. This article is an open access article distributed under the terms and conditions of the Creative Commons Attribution (CC BY) license (http://creativecommons.org/licenses/by/4.0/).
Share and Cite
MDPI and ACS Style
Fallucchi, F.; Coladangelo, M.; Giuliano, R.; William De Luca, E. Predicting Employee Attrition Using Machine Learning Techniques. Computers 2020, 9, 86. https://0-doi-org.brum.beds.ac.uk/10.3390/computers9040086
AMA Style
Fallucchi F, Coladangelo M, Giuliano R, William De Luca E. Predicting Employee Attrition Using Machine Learning Techniques. Computers. 2020; 9(4):86. https://0-doi-org.brum.beds.ac.uk/10.3390/computers9040086
Chicago/Turabian StyleFallucchi, Francesca, Marco Coladangelo, Romeo Giuliano, and Ernesto William De Luca. 2020. "Predicting Employee Attrition Using Machine Learning Techniques" Computers 9, no. 4: 86. https://0-doi-org.brum.beds.ac.uk/10.3390/computers9040086
Note that from the first issue of 2016, this journal uses article numbers instead of page numbers. See further details here.