Explaining Cooperative Behavior in Public Goods Games: How Preferences and Beliefs Affect Contribution Levels

1
Institute of Marketing Management, Center for Behavioral Marketing, ZHAW Zurich University of Applied Sciences, Stadthausstrasse 14, 8401 Winterthur, Switzerland
2
Morningstar Investment Management LLC, 22 W. Washington, Chicago, IL 60602, USA
3
Department of Economics, University of Zurich, Bluemlisalpstrasse 10, 8006 Zurich, Switzerland
*
Author to whom correspondence should be addressed.
†
These authors contributed equally to this work.
Games 2019, 10(1), 15; https://0-doi-org.brum.beds.ac.uk/10.3390/g10010015
Submission received: 1 February 2019
/
Revised: 9 March 2019
/
Accepted: 11 March 2019
/
Published: 15 March 2019
(This article belongs to the Special Issue Social Norm and Risk Attitudes)
Abstract
:There is a large body of evidence showing that a substantial proportion of people cooperate in public goods games, even if the situation is one-shot and completely anonymous. In the present study, we bring together two major endogenous factors that are known to affect cooperation levels, and in so doing replicate and extend previous empirical research on public goods problems in several important ways. We measure social preferences and concurrently elicit beliefs on the individual level using multiple methods, and at multiple times during the experiment. With this rich set of predictor variables at the individual level, we test how well individual contribution decisions can be accounted for in both a one-shot and a repeated interaction. We show that when heterogeneity in people’s preferences and beliefs is taken into consideration, more than 50% of the variance in individual choice behavior can be explained. Furthermore, we show that people do not only update their beliefs in a repeated public goods game, but also that their social preferences change, to some extent, in response to the choices of other decision makers.
1. Introduction
From the vantage of standard neoclassic economic theory, cooperation between humans can be difficult to explain. Within the normative framework, decision makers (DMs) are conceptualized as narrowly self-interested cognitive agents who believe that other DMs are also narrowly self-interested, and that these preferences are common knowledge. These normative axioms yield powerful, precise, and testable models of behavior in interactive decision contexts. In some cases, these axioms yield predictions that are remarkably accurate, whereas in other situations these models are woefully inadequate for comparative illustrations of both instances, see e.g., [1,2,3]. We consider here an instance of the latter case, namely DMs’ common propensity to cooperate in a social dilemma, even when the situation is one-shot, anonymous, and played for real resources.
One reason standard economic theory is unable to account for the observed range of cooperation behavior in such situations is that standard theory relies on the assumption of complete homogeneity among DMs, i.e., the negation of variance in DMs’ preferences and beliefs. However, there is ample evidence from empirical studies showing that people are tremendously heterogenous with respect to both their preferences and their expectations of other DMs’ behavior. Moreover, the heterogeneity in tastes is not a result of measurement error or noise, but rather emerges from stable individual differences in how joint outcomes are subjectively valued. Although non-selfish preferences are generally non-standard, these prosocial preferences can be internally consistent and thus can be rationalized within a utility framework (e.g., [4,5]). Consequently, to gain a better understanding of aggregate behavior in social dilemmas, one should take into account how individual preferences and individual beliefs yield behavior on the individual level, and moreover measure how these preferences and beliefs are potentially affected by the behavior of other DMs. This last statement summarizes the central aim of this paper: Our goal is to account for cooperative choices at the individual level using measures of DMs’ social preferences and beliefs, thus providing an empirically validated rationalization of cooperative choice behavior.
Previous work has already revealed a great deal about the determinants and dynamics of individual contribution levels in social dilemmas, such as the standard public goods game (see, e.g., [6,7]). These works serve as the basis for our experimental investigations, while our goal is in part to replicate previous research, we also extend the state of the art in several important ways. Concretely, the experimental design we use can be characterized by the following features.
First, we measure the DMs’ individual social preferences, elicit their individual beliefs, and use these two factors in tandem to account for their behavior at the individual level.
Second, we use two different methods to assess the DMs’ types. On the one hand, we employ the strategy method to measure DMs’ propensities to condition their contributions on the contribution levels of others, and on the other hand we measure other-regarding preferences in terms of the weights decision makers attach to the outcome of others in relation to their own outcomes by means of a method that is independent from the public goods game context and thus is unconfounded by the strategic context. This allows us to compare the results from the two measures, and thus to evaluate the degree to which these measures have differential predictive capacity, and see how they relate to each other.
Third, we let DMs play both a one-shot, and a repeated, public goods game with partner-matching, which allows for a comparison of the effects preferences and beliefs have in different situations, and whether potentially divergent behavior, or divergent explanatory power of predictors, are a result of attempts to signal cooperative decision making.
Fourth, and related to the former point, we elicit both DMs’ beliefs about the contribution levels of others, and their beliefs about other peoples’ social preferences. This additional assessment of DMs’ beliefs about their interaction partners’ types allows us to evaluate the extent to which beliefs about others’ behavior differ from beliefs about other’s intentions, and whether the latter has differential explanatory power in accounting for contribution decisions.
Fifth, we measure both DMs’ beliefs and preferences repeatedly to address the issues of belief updating and preference dynamics. Concretely, we elicit DMs’ beliefs about the contributions of others in every period of the repeated public goods game, and assess their distributive other-regarding preferences once before they play the public goods game, and once again after the repeated interaction. This allows us to test whether preferences, in addition to beliefs, are affected (i.e., updated) by corresponding interaction partners’ behavior.
We show that taking into account both the decision makers’ preferences, and their beliefs about others, we can explain more than 50% of the variance in DMs’ contribution choices in both a one-shot and a repeated public goods game. Furthermore, we provide evidence that DMs not only update their beliefs, but also that DMs’ preferences change in response to the observed behavior of other DMs, thereby manifesting some form of reciprocity. However, we find no evidence for propensities to signal cooperative intentions; that is, behavior in the one-shot public goods game does not differ from behavior in the first period of a repeated interaction with partner-matching. Also, we find only weak evidence that beliefs about other people’s social preferences matter beyond beliefs about other people’s behavior. Finally, we show that preferences as measured via the strategy method, and as measured by an independent choice task, are related but are not the same. Surprisingly, we find that people behave quite differently in an ongoing interaction than they indicated they would via the strategy method. We also find, consistent with previous results, that most people are conditional cooperators, and moreover that social preferences are, at least to some extent, dynamic in that they are reactive to the behavior of interaction partners.
2. Cooperation in Social Dilemmas
2.1. On the Importance of Considering Endogenous Factors
How people trade off personal benefits against collective outcomes in situations of conflicting interests has been studied extensively across many different disciplines (e.g., [8,9,10,11,12,13,14,15]), yet the puzzle of human cooperation remains an active area of experimental (e.g., [6,7,16,17,18]) and theoretical (e.g., [19,20,21,22,23,24,25,26,27]) research. The best-known instance of a social dilemma situation is the Prisoner’s Dilemma (PD; see, e.g., [28]). Typically, substantial cooperation rates (see e.g., [29,30,31]) are observed when people play a PD game, even if the situation is one-shot and anonymous (for a general overview, see for instance [8]). This also holds for the extension of the PD, namely the standard linear public goods game (PGG).
Several reasons have been hypothesized as explanations for why people choose strictly dominated strategies in these strategic contexts. Generally, levels of cooperation can depend on both exogenous and endogenous factors (for a review on PGGs in this respect, see [32]). For example, the payoff structure of the game, such as the index of cooperation (K) in a PD (see [33,34]) or the marginal per capita return in a PGG (see [35]) can have a significant effect on cooperation rates in social dilemmas. However, these exogenous factors alone cannot explain why people cooperate if they are assumed to be homogeneous with respect to endogenous variables, as is the case in the standard neoclassic model. That is, no matter how small the difference is between the Temptation payoff and the Reward payoff in a PD, or how large the marginal per capita return (MPCR) is in a PGG (as long as MPCR holds), defection or free riding remains the strictly dominant strategy for all DMs. In other words, under the assumption of narrow self-interest and common knowledge thereof, altering game parameters such as the K-index in a PD or the MPCR in a PGG will have no effect at all on the DMs’ behavior in a social dilemma. Only if DMs are assumed to derive benefit not exclusively from their own payoff, but at least in part also from the payoffs others receive (i.e., if DMs have non-selfish distributive social preferences), altering game parameters can be expected to affect behavior (see, e.g., [36,37]).
Consider, for instance, a DM who has distributive social preferences that are consistent with maximizing efficiency, i.e., the DM’s utility is the sum of his own payoff and the other player’s payoff. Moreover, this DM believes that the other player is narrowly self-interested (for simplicity, assume that the DM believes that the interaction partner is going to defect with probability ). In a standard symmetric PD game, given these preferences and beliefs, the DM will choose to defect as long as , but will choose to cooperate if the game parameters are changed such that .1 Now assume the DM believes (for simplicity again with ) that the other player, for whatever reason, is going to choose to cooperate. In this case, the DM will choose to cooperate also only if , but will defect in case the game parameters are such that . The example makes clear that changing game parameters can affect behavior only in the presence of social preferences. Under the assumption of narrow self-interest, altering the payoff structure of a social dilemma cannot influence behavior, even if DMs are assumed to have diverse beliefs about the intentions and anticipated behavior of others, i.e., even if the assumption of common knowledge of narrow self-interest is not true.
The importance of endogenous factors and other-regarding elements for the emergence of cooperation in social dilemmas has also been demonstrated in game theoretic research in the context of evolutionary dynamics. For instance, it has been shown that the emergence of cooperation in agent-based models can depend substantially on parameters or model instantiations reflecting other-regarding factors, such as reciprocity, social diversity, competitiveness, or conformity (see e.g., [12,38,39,40,41], respectively).
In summary, exogenous factors can influence choice behavior in social dilemmas only if there are endogenous variables which the exogenous factors can act upon. Consequently, understanding how endogenous variables affect cooperation behavior in social dilemmas is a prerequisite for understanding how exogenous variables do so. Ledyard ([32], p. 143). provides a list of several endogenous (he uses the term “systemic”) variables that have a potential impact on cooperation behavior in PGGs. We will focus on two of these variables, namely (1) social preferences (“altruism, fairness” in Ledyard’s terminology) and (2) beliefs as predictors of contribution levels in PGGs.
2.2. How Social Preferences and Beliefs Affect Cooperation Behavior in PGGs
2.2.1. Distributive Other-Regarding Preferences
Researchers have sometimes tried to infer social preferences from behavior in strategic games without taking into account that peoples’ behavior in games is a function of their preferences entangled with their beliefs about the behavior of others, and that it is often impossible to disentangle these two factors ex post, i.e., on the basis of information about peoples’ behavior in strategic interactions. To assess people’s preferences alone, i.e., unconfounded by beliefs, it is necessary to observe their behavior in non-strategic situations (e.g., the dictator “game”). The recognition of this claim has been made explicit in game theoretic research in psychology and has led to a particular conceptualization of distributive social preferences termed social value orientation (SVO; for a review, see e.g., [42]). It is important to note, however, that the assumptions underlying the SVO construct—namely that there is reliable and persistent heterogeneity in peoples’ other-regarding preferences—are strongly supported by the results of recent economic research, highlighting the value of studying social preferences at the individual level (e.g., [4,5,43,44,45,46,47]). Also, the SVO construct has become better known in economics recently, and corresponding measures have been used in a few economic studies to date (e.g., [48,49,50,51]).2
Like other notions of distributive other-regarding preferences (e.g., [19,23]), SVO can be represented within a utility framework. That is, SVO corresponds to the parameter in a simple joint utility function , where denotes the decision maker’s payoff, and denotes another person’s payoff. Hence, SVO can be understood as the weight a person attaches to the payoff of another person in relation to the own payoff, or in other words, the willingness to pay for a one-unit increase in the other person’s payoff. In cases where , a decision maker is narrowly self-interested (i.e., individualistic), while positive values of indicate positive concerns for others (i.e., prosociality), and negative values of indicate negative concerns for others (i.e., competitiveness/spitefulness). SVO as an individual difference can be measured reliably on a continuous scale [52], and has been shown to be a significant predictor of behavior in social dilemmas (e.g., [53]). With respect to PGGs, Balliet et al. [53] report an SVO-cooperation effect size of .
2.2.2. Beliefs and Conditional Cooperation
Several studies have investigated the relationship between choice behavior and beliefs about other peoples’ anticipated behavior in PGGs, and evidence clearly suggests that DMs’ contributions in a PGG correlate positively with expected contributions of others (e.g., [6,54,55]). Moreover, Croson [54] found that this aggregate result is due to the behavior of almost all (about 92%; [54], p. 207) DMs, indicating that most people condition their contribution levels on the (expected) contribution levels of others in an approximately linear way. However, results from other studies suggest that people are heterogeneous with respect to how contribution levels of others affect own contribution amounts in a PGG.
For example, Fischbacher et al. [7] found that only about 50% of DMs condition their contributions on the contribution levels of others in a linear way, while 30% free ride no matter how much others contribute, and about 14% are so called “hump-shaped contributors” who, roughly speaking, match the contribution levels of others for average contribution amounts below 50% of the endowment, and decrease their own contribution levels for average contribution amounts above 50% of the endowment (see [7], p. 401). Furthermore, they found that those DMs termed “conditional cooperators” do not match the average contribution level of others exactly, but tend to contribute a little less than the average. The authors hypothesize that this may be the reason contributions decline over time in repeated PGGs—a common but disheartening finding (e.g., [16,35,56,57,58,59,60,61,62,63,64,65,66,67]). However, Fischbacher et al. [7] did not elicit peoples’ beliefs about other peoples’ contributions, but instead used the strategy method [68] and thereby assessed how much people are willing to contribute given specific contribution levels of others. Extending this approach, Fischbacher and Gächter [6] conducted a similar study, but additionally elicited DMs’ beliefs about the contribution levels of others.
In line with results from other studies [54,55], they find that DMs’ beliefs about anticipated contributions of others are strongly correlated with their own contributions on the aggregate level, but also that there is heterogeneity among DMs in this respect, i.e., not all people are conditional cooperators. Also, these studies showed that a large proportion of those DMs who do condition their contributions on the contribution levels of others are imperfect conditional cooperators. That is, they consistently contribute a little less than they expect others to contribute; this finding is in accordance with the results reported by Fischbacher et al. [7]. With respect to the formation of beliefs, they found that DMs’ beliefs about contribution levels of others in round t can best be modeled as a weighted average of beliefs in round and actual contribution levels in round . From these results Fischbacher and Gächter [6] conclude that the reason cooperation rates in repeated PGGs decline is because many people are imperfect (i.e., downward biased) conditional cooperators, who persistently contribute a bit less than they believe others will, which in turn leads to a downward adjustment of beliefs about contribution levels in the next round by others, resulting in a downward spiral that feeds back and culminates in end-stages of almost complete uniform defection.3 This explanation for the decline of cooperation in repeated PGGs is also supported by data from Neugebauer et al. [55], which provides further evidence that many people are selfish-biased conditional cooperators. One issue that has not been clarified to date refers to the question of how well people can predict the contribution levels of others, that is, the congruence between beliefs about contribution levels and actual contribution levels. While Kachelmeier and Shehata [69] found that peoples’ beliefs of other peoples’ contributions are too pessimistic, Neugebauer et al. [55] report opposite results. However, optimistic beliefs would not negate the mechanism that leads to the decline of cooperation in repeated PGGs suggested by Fischbacher and Gächter [6], but only slow it down. Pessimistic beliefs, on the other hand, would speed it up. Yet, how accurate people’s beliefs about other peoples’ contributions are remains an open question.
2.3. Connecting the Streams of Research
In summary, there seems to be agreement across disciplines that both social preferences and beliefs matter substantially in PGGs. With respect to social preferences, psychologists have primarily focused on the SVO construct and have produced a substantial amount of evidence showing that this construct is predictive of individual contribution levels in PGGs (see the large number of studies investigated in the meta-analysis by Balliet et al. [53]). Economists, on the other hand, have not focused on one particular conceptualization of social preferences, but have investigated a multitude of different models thereof, such as “warm-glow” [70], altruism (see [32]), or inequality aversion [19,23]. While some researchers found support for some of these models, others found support for different ones (see, for instance [54,71,72]), thus there is no consensus to date about which model does best at explaining choice data, and one reason for this may be that none of them seems to do satisfactorily well. However, there is a clear consensus that some form of social preferences ([57], p. 900) are partly responsible for cooperation in PGGs (e.g., [48,54,57,59,67,70,71,72,73,74]). It is noteworthy at this point what Brandts and Schram [59] (p. 414) wrote after having considered several economic models as explanations for their data:
A form of cooperation that is consistent with all of our findings can be found in the classical psychological literature on differences in individual ‘value orientation’ …
However, as mentioned earlier in this paper, the SVO construct has largely been ignored in the economic sciences to date. One reason for this may be that until very recently, prominent measures of SVO yielded the lowest resolution output possible, i.e., results on the nominal scale level of measurement [75], hence the measures have probably appeared unattractive for researchers accustomed to more precise parameterized modeling. The necessity of good measures at the individual level has long been acknowledged nonetheless.4 The advent of a high-resolution measure (see [52]) may help to improve interdisciplinary connectivity and encourage the use of the SVO construct by economists.
Furthermore, evidence strongly suggests that beyond social preferences, beliefs about the behavior of others are highly associated with cooperative decisions in PGGs [6,54,55], and a substantial literature has been built on this phenomenon termed conditional cooperation [6,7,55,64,76,77], which is supposed to be driven by both beliefs and preferences, has not only been observed in the laboratory but also in the field [17], and seems to be global [78,79].
Also, the question whether beliefs about other peoples’ preferences, beyond beliefs about others’ behavior, affect peoples’ behavior in PGGs remains unanswered to date. However, there is accumulating evidence that people do take into account the intentions of others when making decisions in interdependent situations [21,22,25,26,27,80,81]. For instance, Levine [25] proposed a model which not only incorporates a parameter , reflecting the weight player i attaches to the outcome of another player j, but also a parameter reflecting the weight player i believes player j is attaching to his own (that is, i’s) outcome. The idea behind most models incorporating a term for the interaction partner’s intention is that the believed intention of the other may change a decision maker’s distributive preferences with respect to this other person. This idea is consistent with the definition of reciprocity as given before and has been supported empirically [82,83]. In this respect, we investigate two issues. First, we measure the DMs’ expectations of the social preferences of others to see whether this belief matters on top of the beliefs about the others’ behavior. Second, we measure the DMs’ other-regarding preferences twice—once at the beginning of the experiment, and one more time at its very end—to assess the degree to which social preferences are affected by the observed behavior of interaction partners.
2.4. Research Questions
A central goal of this study is to bring together what is known about the major endogenous drivers of cooperation in standard linear PGGs, and to measure these factors simultaneously, repeatedly, at the individual level, and in the same experiment, all the while employing both a one-shot, and a repeated game using a properly incentivized within-subjects design. This setup allows us to replicate previous research and to extend it in several important ways. First, it allows us to rigorously investigate and disentangle the differential effects of individual social preferences and individual beliefs on individual choice behavior in a PGG. The disentanglement of preferences and beliefs is achieved by measuring social preferences (SVO) as an independent construct rather than inferring preferences from strategic behavior. Also, we assess the DMs’ propensities to condition their contributions on the contribution levels of others by means of the strategy method. This allows us to investigate the relation between, and potentially the differential predictive capacity of, conditional cooperation and distributive other-regarding preferences. Furthermore, we directly elicit DMs’ beliefs about the behavior of others in an incentive compatible way by using a proper scoring rule (see e.g., [84]). Next, we extend previous research by addressing the question whether beliefs about other peoples’ social preferences matter on top of beliefs about other peoples’ behavior. We assess beliefs directly by using an independent and incentive compatible measure of beliefs about social preferences. Finally, we investigate how preferences and beliefs affect contribution levels in a repeated interaction and, more importantly, the degree to which the dynamics that arise in repeated PGGs affect peoples’ social preferences and beliefs. That is, we test whether people’s other-regarding preferences, in addition to their beliefs about others’ behavior, change in response to the observed behavior of interaction partners, and in so doing measure reciprocal reactions.
3. Method
The data collection took place at a dedicated decision science laboratory at a large European university as a standard laboratory experiment. The study was made fully incentive compatible and explicitly followed a strict no-deception policy. The DMs earned 42.05 Swiss francs on average, including a guaranteed show-up payment of 10 Swiss francs. The decision tasks were programmed in z-Tree [85]. We conducted 6 sessions in total with 20 (4 sessions) or 24 (2 sessions) players per session, resulting in a total N of 128 research participants. Upon arrival at the laboratory, each player was randomly assigned a cubicle number and seated at the corresponding place. Once the participants were seated, they were welcomed via loudspeaker and told to follow the instructions displayed on their computer screen. DMs first completed the SVO Slider Measure (explicated in the next section) and then played an anonymous one-shot PGG in groups of four, composed via random matching. Subsequently, DMs were asked to indicate their beliefs about the average contribution of their group members. Next, DMs’ contribution profiles were elicited by use of the strategy method followed by the assessment of their beliefs about other peoples’ SVOs. It is important to note here that DMs were not given any information or feedback about the outcome of the one-shot PGG or their accuracy in estimating other peoples’ contributions or SVOs at this point in the experiment. Finally, the DMs played a repeated PGG with fixed matching and feedback for 10 periods and thereafter completed the SVO Slider Measure a second time. A graphical representation of the sequence of tasks that the subjects had to perform is provided in Figure 1. As the final part of the experiment, the DMs received detailed feedback about their earnings in the experiment, completed a questionnaire, and were subsequently called to the experimenter window one by one to privately collect their earnings. The duration of the experiment was about 1.5 h and the exchange rate between experimental currency unit (ECU) and real monetary value was 8 ECUs = 1 Swiss franc.
Incentive compatibility was implemented as follows. Before each session, it was determined at random which parts of the experiment would be relevant for payment. Concretely, it was determined whether the first or second SVO assessment would be relevant for payment, and which item of the SVO Slider Measure would be relevant for payment for both the assessment of SVO and SVO beliefs. Furthermore, one period out of the 10 periods from the repeated PGG was randomly selected to be relevant for payment. At the beginning of the experiment, DMs were informed that the parts relevant for payment had been predetermined, but are unknown to them, and that they should therefore treat every part of the experiment as payoff relevant. They were also informed that the indication of the relevant parts had been written down on a piece of paper in an envelope that was affixed to the wall where the envelope was visible (but its contents hidden) to the DMs during the entire experiment. After the experiment, they were given the opportunity to have a look at that piece of paper from the envelope to verify that they were truthfully informed about the payment procedure.
Out of the 128 participants, 4 showed intransitive choice patterns in the SVO Slider Measure and are therefore excluded from further study, leaving a sample of 124 participants for analyses. Participants were mainly university students from a wide range of disciplines, and out of the sample, 76 (61%) participants were male and 48 (39%) participants were female.
3.1. Measures
3.1.1. SVO
DMs’ SVOs were assessed with the SVO Slider Measure [52] implemented as a Slider Measure module [86] programmed in z-Tree [85]. The SVO Slider Measure consists of 6 primary and 9 secondary items, which are essentially a set of dictator games with varying marginal rates of substitution. The primary items measure a person’s SVO on a continuous scale. One of the primary items of the Slider Measure is shown in Figure 2. Each item consists of 9 options indicating different distributions of monetary units between the self and another person. When completing a Slider Measure item, a decision maker considers different payoff allocations and then indicates that own–other payoff allocation she prefers most. When all of the 6 primary items are completed, the measure yields a scaler index of a person’s SVO in terms of an angle (which is the typical metric for SVO results in the psychology literature), which can range from −16.26 indicating perfect competitiveness (i.e., spite) up to 61.39 indicating perfect altruism, while a narrowly self-interested choice pattern would result in an angle around 0. SVO angular degrees can be translated into -values in the utility function by the trigonometric function . The Slider Measure has been shown to be highly reliable and valid in terms of both its predictive power and its comparability to other SVO measures (see [52]). The measure also allows for detecting intransitivity in a DMs’ choice patterns which may indicate carelessness or random responding.
Incentive compatibility was implemented by a lottery system, and DMs were informed about all the details of the payoff scheme before completing the task. Concretely, DMs were paid according to their choice in one randomly selected item of the Slider Measure plus the choice of another randomly selected decision maker in an item that was randomly selected for her. More precisely, DMs were matched with a procedure we call ring-matching. We employed this procedure to negate strategic consideration, and it is one of many different matching protocols that would be sufficient. Ring-matching was applied as follows: Decision maker A receives the payoff she allocated to herself in a randomly selected item and in addition receives the payoff decision maker Z allocated to the other in an item that was randomly selected for decision maker Z. Decision maker B then receives the payoff she allocated to the self in a randomly selected item and in addition receives the payoff decision maker A allocated to the other in the item that was selected for her, and so forth, until the ring is closed. This allows for incentive compatibility of the choices (as there are potential real consequences for both the self and for the other) and does so without introducing a strategic interaction and thus a confound of the measure (in this respect, see e.g., [87]).
As mentioned earlier, SVO was assessed two times—once at the beginning of the experiment (SVO t), and one more time (SVO t) as the final incentive compatible task after the repeated PGG. When DMs completed the Slider Measure the first time, they were not informed that there will be a second assessment at the end of the experimental session. The instructions for the task were identical at both points in time, with two exceptions. First, the instructions for the second assessment of SVO included the following phrase: “You have done this task before. Now please complete the task one more time. You do not have to be consistent with the answers you gave the first time. Your preferences may or may not have changed during the experiment.” Second, DMs were informed that both tasks could be relevant for payment, maintaining incentive compatibility. Second, the instructions also included the additional phrase: “Remember that this other person is randomly selected that is, this person may or may not be someone you interacted with during this experiment.”
At time t, the average SVO angle was () with a minimum of and a maximum of . When decision makers are categorized, 1 (0.81%) decision maker is altruistic, 58 (46.8%) decision makers are prosocial, 64 (51.6%) decision makers are individualistic, and 1 (0.81%) decision makers is competitive. The distribution of SVO t angles is shown in Figure 3.
At time t, the average SVO angle was () with a minimum of and a maximum of . When decision makers are categorized, no person is altruistic, 45 (36.3%) decision makers are prosocial, 78 (62.9%) decision makers are individualistic, and 1 (0.81%) decision maker is competitive. The distribution of SVO t angles is shown in Figure 4.
3.1.2. SVO Beliefs
The players’ beliefs about the other players’ SVOs were measured directly after they indicated their contribution decision in the one-shot PGG (including the completion of the strategy table). DMs were presented with the Slider Measure again, but this time, they were asked to complete the measure as they thought most other people would. More precisely, subjects had to indicate for each item of the Slider Measure which option they thought most other people had chosen in the past.5 Furthermore, it was made clear to participants that they would be paid for accuracy using a proper scoring rule.
For each decision maker, one item of the Slider Measure was selected at random. DMs earned 30 ECUs if they exactly hit that option which was chosen most often in the past. A deviation by 1 option still yielded 20 ECUs, a deviation by 2 options yielded 10 ECUs, and a deviation by 3 or more yielded zero points.
DMs on average believed that other people would have an SVO angle of (min = , max = ). When beliefs are categorized, 1 (0.81%) decision maker believed that most others are altruistic, 38 (30.65%) DMs believe that most others are prosocial, and 85 (368.55%) believe that the majority is individualistic. Figure 5 shows the full distribution of SVO beliefs.
3.1.3. PGG Contributions and Beliefs
The PGG used a standard linear payoff function and was implemented with the Voluntary Contributions Mechanism [35]. The endowment was 20 ECUs for each player and the group size was 4 persons, with a MPCR of 0.4. That is, the sum of contributions in a group was multiplied by the factor 1.6 and the resulting amount was divided equally among the 4 group members.
One-Shot PGG and Strategy Method
Players received detailed instructions about how the PGG works6 and how final payoffs depend both on the own contribution and the contribution of others. Players were also provided with several examples to make it clear how final payoffs are realized given the amount of the own contribution and the sum of the group members’ contributions. Furthermore, players had to answer a comprehension check question so that we could verify that they really understood the task7. Finally, they had to indicate how much they wanted to contribute to the public good and were subsequently asked to indicate their beliefs about the average contribution of others.
After players indicated their contributions and their beliefs about the average contribution of others, they were asked to indicate how much they would choose to contribute given any possible integer average contribution of the other group members by means of the strategy method. To maintain incentive compatibility, we followed a procedure that was also applied by Fischbacher et al. [7]. Concretely, we truthfully informed players that one member per group would be selected at random to be the “conditional member”, and that their payoff from the (one-shot) PGG would then be calculated as follows. First, in each group, the average contribution of the three “unconditional members” would be computed. Then, the computer would look up what the “conditional member” had indicated to contribute in the strategy method given the actual average contribution of the three “unconditional” group members. Finally, based on the contributions of the “unconditional members” and the contribution of the “conditional member”, the group contributions are determined, and individual payoffs are computed.
Repeated PGG
As mentioned earlier, subjects began playing the repeated PGG without having received any feedback about the outcomes of the one-shot PGG, nor did they have information about their accuracy in predicting the empirical average contribution of other people or the actual modal SVO. The instructions for the repeated PGG informed subjects that they would make 10 successive decisions about how much to transfer to the group account and then to indicate what they believed the other three group members would transfer on average. Furthermore, we employed partner-matching for the repeated PGG, and subjects were informed that group compositions are stable across the 10 periods, such that they are interacting with the same people in all 10 periods. Also, they were informed that they would receive detailed feedback after each period where they would see how much each of the other three group members had transferred to the group account, and the resulting average contribution. We implemented this extensive feedback condition to give subjects the opportunity to signal their intentions, such that we could determine the degree peoples’ beliefs about other people’s SVO mattered in this situation. Figure 9 shows the distribution of contributions across the ten periods on the aggregate, i.e., disregarding group-level information, and Figure 10 shows the corresponding mean contributions across the ten periods. The contribution profiles of all groups across the ten periods is shown in Figure 11.
3.1.4. Questionnaires
After the completion of the SVO Slider Measure at t following the repeated PGG, subjects received detailed feedback about their earnings in the experiment and then answered a questionnaire. The questionnaire consisted of three parts. The first part assessed Machiavellianism, a construct that has been shown to be associated with behavior in experimental games in previous research (e.g., [88]), by means of the Mach IV scale [89]. This scale consists of 20 statements such as, “Never tell anyone the real reason you did something unless it is useful to do so”, to which subjects indicate the degree to which they agree on a 5-point Likert scale. In our sample, the scale showed low but marginally acceptable internal consistency (Cronbach’s = 0.73). The second part of the questionnaire assessed the Belief in a Just World (BJW) with the 6 items of the General Belief in a Just World Scale [90], which showed weak internal consistency (Cronbach’s = 0.67). The third and final part of the questionnaire was the subscale of positive reciprocity (9 items) from the Personal Norm of Reciprocity (PNR) Scale [91], which also showed low but marginally acceptable internal consistency (Cronbach’s = 0.72). The three scales were included in the experiment for exploratory purposes. The questionnaire concluded with the assessment of the sociodemographic variables age, sex, and field of academic study.
4. Results
Table 1 shows the bivariate relations between selected variables (see Appendix A for a Table A1 showing the correlations among all variables used in this study). The variable CCA stands for “Conditional Cooperation Area” and is an index computed from subjects’ choices in the strategy method for the purpose of summarizing individual choice patterns into a single index. Concretely, a subject’s CCA is a rescaled approximation of the area under the curve of the subjects’ contribution profile from the strategy method. A subject’s CCA is 0 if the subject indicated to contribute zero for any possible average contribution of others (free riding), and 1 if the subject indicated to match the average contribution of others exactly (perfect conditional cooperation), and more than 1 if the subject indicated to contribute more than the average contribution of others in total.8
4.1. Explaining Behavior in the One-Shot PGG
In this section, we consider only the results corresponding to the one-shot PGG. As can be seen in Table 1, there are clear associations of considerable magnitude between SVO, the beliefs about other’s behavior (PG os belief), and contribution levels (PG os), while also CCA is significantly correlated with these three variables. However, there is no evidence for a relation between subjects’ beliefs about other subjects’ SVO and contributions in the one-shot PGG (PG os). Furthermore, we find a significant and considerable correlation between SVO and beliefs about other people’s SVO (SVO belief), suggesting a consensus effect, such that people believe that other people have similar social preferences as they themselves have on the aggregate. However, there is no significant bivariate relation between SVO belief and contribution decisions, or beliefs about contribution levels.
Table 2 shows the results of an ordinary least squares regression with contributions in the one-shot PGG as dependent variable. As already indicated by the bivariate correlations, both subjects’ SVO and their beliefs about the average contribution of others are clearly predictive of their own contributions in the one-shot PGG. Furthermore, including SVO belief as a predictor explains a significant proportion of variance in PG contributions in addition to the proportion of variance already explained by SVO and PG belief (). Interaction effects are absent. Together, the three predictors SVO, PG belief, and SVO belief explain about 60% of the variance in contribution levels in the one-shot PGG. Furthermore, including CCA as a further predictor again results in a significant increase ((), leading to a total of of explained variance in contribution levels in the one-shot PGG, while SVO remains to be a significant predictor. This would suggest that SVO and propensities to condition own contributions on the contribution level of others (as measured by the strategy method) do have different predictive capacities, at least to some extent.
As an additional test, we replaced the general CCA index by the specific belief-based conditional contribution (BBCC) as a predictor of individual contributions in the one-shot PGG.9 BBCC is computed as follows. First, for each subject, we identify the belief this subject indicated to have about the average contribution of others in the one-shot PGG. Second, in the strategy table completed by this subject, we look up the contribution the subject indicated to make given that average contribution of others that corresponds with the average contribution this subject believed others would contribute in the one-shot PGG, which is then identified as that subject’s BBCC. Hence, if a person—given this person’s belief about the average contribution level of others—would behave exactly how that person indicated to behave in the strategy method, then his BBCC would be identical to his actual contribution in the one-shot PGG. However, the correlation between subjects’ BBCCs and their contributions in the one-shot PGG is not perfect, but rather it is (). Moreover, including BBCC in the regression (see model 3 in Table 2) does not at all negate the main effects of SVO, PG belief, or SVO belief, but only reduces their relative predictive capacity slightly. Also, if BBCC is entered first into the regression, the addition of PG beliefs leads to a highly significant increase of explained variance in contribution levels (() and further the addition of SVO (on top of beliefs) leads to a marginally significant increase of explained variance in contribution levels ((). Clearly, the strategy method does reveal useful information about peoples’ behavior in an iterated PGG, but the information is far from perfect. Moreover, and perhaps surprising, the results regarding both CCA and BBCC suggest that data gained by means of the strategy method are not a good substitute for independent measures of social preferences, as these constructs have clearly differentiated predictive power.
What is somewhat puzzling about the results is the role of SVO belief in explaining contribution levels. Subjects’ contributions in the one-shot PGG appear to be independent of their beliefs about other subjects’ SVO when considering the bivariate correlation between the two variables. However, when SVO and PG belief are statistically controlled (and only if both are controlled), SVO belief does appear to be predictive of contribution levels, but to our surprise the association is negative. This would indicate that when SVO and PG belief are already taken into account, a subject can be expected to contribute less the more prosocial most others are believed to be. This would be a surprising implication that could perhaps be explained by some sort of diffusion of responsibility, where a person does not feel urged to be the “nice guy” given the belief that there are so many others who could play this role. However, we can only speculate about the nature of the role of SVO beliefs in explaining contributions in a one-shot PGG. Our data only allow us to conclude that SVO belief does appear to have some explanatory power with respect to contribution levels, but the exact underlying mechanism must be investigated in more detail by future research.
4.2. Explaining Behavior in the Repeated PGG
The subjects’ behavior in the first period of the repeated PGG is very similar to their behavior in the one-shot PGG as evidenced by the high association between individual contributions in the one-shot PGG and in the first period of the repeated PGG (see Table 1). Although slightly more subjects contribute the full endowment, and also more subjects believe that the others are going to contribute the full endowment on average in the first period of the repeated PGG compared to the one-shot situation, the distribution of contributions in the first period of the repeated PGG does not differ significantly from the distribution of contributions in the one-shot situation.10 Also, the bivariate relations between SVO, SVO belief, and PG belief on the one hand and contribution levels on the other hand are about the same in the one-shot situation and in the first period of the repeated PGG (see and compare the respective indicators in Table 1 and Table 2, and Figure 12). Moreover, the differences between individual contributions in the one-shot PGG and the first period of the repeated PGG cannot be explained by SVO beliefs (), and there is no significant interaction between SVO and SVO beliefs as predictors of contributions in the first period of the repeated interactions. Thus, we find no evidence of systematic signaling, and differences in contribution levels between the one-shot PGG and the first round of the repeated PGG on the individual level are not accounted for by SVO beliefs. We conclude from this that people enter a repeated PGG as they enter a one-shot PGG, and that the main drivers of contribution levels are just the subjects’ individual social preferences and individual beliefs about the contribution levels of others in both situations.
Figure 12 shows the results of ten OLS regressions, one per period of the repeated PGG, with contributions in the respective period as dependent variable, and SVO (t), SVO belief, and subjects’ beliefs about the average contribution of their group members (PG rp belief) in the respective period as independent variables. The figure also shows the proportion of variance explained in contributions by the three independent variables per period.
As can be seen in Figure 12, the proportion of variance explained in contribution levels by the three predictors is very high across all ten periods, with a minimum of explained variance in period 2, and a maximum of explained variance in period 5. Clearly, the predictor which contributes by far the most to the proportion of variance explained in contribution levels is subjects’ beliefs about the average contribution of others in a particular period (PG rp belief). However, adding SVO as a predictor to PG belief leads to a significant increase in 8 out of the 10 periods (not visible in Figure 12). Subjects’ beliefs about other subjects’ SVO is only significantly predictive of contribution levels in the first period (and period 5), and thereafter appears to be generally uninformative. Analyses of interaction effects indicated a significant two-way interaction between SVO and SVO belief in periods 2, 3 and 4, indicating that proself subjects contribute more given that they believe that others are prosocial, while prosocials do not respond much to their beliefs about the SVO of others in terms of their own contribution levels. However, although it appears plausible that such an effect may be there in the first couple of periods, the evidence that this effect is real is too thin to draw definitive conclusions. What seems to be driving subjects’ cooperative behavior in the PGG after all, is simply their beliefs about the average contribution of others, followed by their own SVO.
Table 3 shows the results of a random-effects generalized least squares (GLS) regression on all 1280 observed contributions from the total sample of 128 subjects across the ten periods of the repeated PGG. As indicated by models 1 and 2, the general pattern of results concerning the relative predictive capacity of the three independent variables is similar to the one observed in the one-shot PGG, and is robust to the inclusion of the period number into the model. Clearly, the best predictor—by far—of contribution levels is PG belief. In contrast to the one-shot situation, the predictive power of SVO is dramatically diminished, which may be somewhat expected given that it is a static variable used for predicting behavior in a dynamic situation. Nevertheless—and in accordance with the results of the period-wise OLS regression analyses (see Figure 12)—the effect of SVO on contribution levels does not fade out completely, but remains useful as a predictor over iterations of the PGG.
Since there is substantial evidence that beliefs about the behavior of others are affecting subjects’ choices substantially, then the question arises to what degree we can predict subjects’ beliefs about the average contribution of others. First, it is noteworthy that subjects’ beliefs about the average contribution of others in the one-shot PGG is not significantly different compared to the first period of the repeated PGG.11 Among the variables we have assessed that may be predictive of a priori PG contribution beliefs, SVO, and CCA show a significant bivariate correlation with PG beliefs both in the one-shot and first period of the repeated PGG. Together, these two variables explain 17.7% of the variance in beliefs about the average contribution of others in the one-shot situation, and 11.6% in the first period of the repeated PGG. In terms of a false consensus effect [92], it appears plausible to surmise that people who are more prosocial and reciprocal are also more likely to believe that others are prosocial (see the positive correlation between SVO and SVO belief in Table 1) and reciprocal, and consequently also expect higher contribution levels from others compared to less prosocial and reciprocal people.
However, given the variables we have assessed here, we cannot shed more light on how subjects form their “home grown” beliefs about the anticipated behavior of others. We can however elucidate how subjects update their beliefs according to the feedback they receive after each period of the repeated PGG. Figure 13 shows the results of 9 nested OLS regressions, one for each period of the repeated PGG starting from the second period, with subjects’ beliefs about the average contribution of their corresponding group members as the dependent variable. The average contribution of group members in period p-1 is inserted first into the regression as independent variable (IV1). As the second independent variable (IV2), subject’s beliefs about the average contribution of the group members in period p-1 is entered into the regression model. As can be seen in Figure 13, the addition of IV2 into the regression model results in a significant increase in the proportion of variance explained in all but the final period. Finally, subjects’ own contributions in period p-1 are inserted as the third independent variable (IV3). The inclusion of IV3 also leads to a further significant increase in in addition to IV1 and IV2 in most periods, and predominantly in the second and third period, but not in the final period. Clearly, subjects’ beliefs about the average contribution of group members can be predicted extremely well by these three variables, especially from periods 4 to 9, where more than 90% of the variance in subjects’ beliefs about what the group members are going to contribute in the current period on average can be explained. The prediction of beliefs in the second, third, and last period of the repeated PGG is (albeit still quite accurate) more complicated, presumably because higher-order beliefs are likely to play a significant role at the beginning and the end of a repeated interaction.
Next, we tested whether the data obtained by means of the strategy method render the independent measures of preferences and beliefs obsolete in the repeated PGG. As shown in Figure 14, BBCC explains about 30–50% of the variance in contribution levels across the ten periods, but adding subjects’ beliefs about the average contribution of others results in a significant, and substantial, increase in in each period. Also, the addition of SVO yields a significant, albeit not very pronounced, increase in in six out of the ten periods. Also, when performing a regression across the repeated interaction while including both period number and BBCC, in addition to PG beliefs as independent variables (see model 3 in Table 3), the relative effect of SVO becomes only marginally significant (). However, it may be worth emphasizing again that SVO here is used as a static predictor (SVO), while beliefs are updated in each period and BBCCs are informed by these updated beliefs. Hence, after having performed different kinds of analyses to look at the data from different angles, we conclude on the aggregate that BBCC is not a very good substitute of an independent measure of social preferences. If it were a good substitute, we would expect it to explain the variance otherwise explained by the independent measure of social preferences irrespective of the particular analysis performed, which is clearly not the case.
As can be seen in Figure 15, subjects on average actually contributed more than they indicated they would contribute given the believed average contribution of others in the strategy method in each period except the last, but on average rather matched the believed average contributions of others in all periods except the first and the last. The fact that subjects behave more conditionally cooperative than they indicated they would behave in the strategy method could have several causes. First, people may be more conditionally cooperative in a “hot” situation such as an ongoing PGG interaction compared to a “cold” situation of the strategy method. Second, subjects may feel urged to behave more conditionally cooperative because of social desirability effects due to the transparency of their contributions to others. Third, subjects may behave more conditionally cooperative because of strategic considerations (e.g., for the purpose of signaling cooperativeness). The second and third reasons would both be due to the fact that the subjects completed the strategy method with respect to a completely anonymous one-shot PGG, without even knowing that a repeated interaction would later follow. We cannot fully answer the question which reasons may be contributing to the effect, but we can consider the difference scores from the one-shot PGG. In the one-shot situation, the mean difference between subjects’ contributions and their BBCC is 1.79 (within a 95% confidence interval between 0.97 and , while the mean difference between subjects’ contributions and their beliefs about the average one-shot contribution of others is 0.33 (within a 95% confidence interval between and . Although these figures indicate that in the one-shot situation, too, subjects’ contributions on average deviate significantly from their BBCC in the expected direction but do not deviate significantly from the believed average contribution of others, the confidence intervals around the two mean difference scores overlap, meaning that they are not statistically significantly different from each other. Hence, the evidence does not clearly support, nor refute one of the three stated possible explanations for the observation that subjects behave more conditionally cooperative in the repeated PGG than they indicated in the strategy method.
An additional question we can address is which variables on the group level are predictive of group performance. To investigate this issue, we can use the groups’ average contribution in the final period of the repeated PGG as a dependent variable, and find its best predictor on the group level among the variables we have assessed so far. Since using the group as unit of analysis reduces sample size by a factor of four, and because the subjects we excluded from the sample due to intransitive choice patterns in the SVO Slider Measure are dispersed across groups, we keep all 128 subjects for analyses so the number of groups we can analyze is not further reduced.12 In our sample of 32 groups, the best predictors of the groups’ average contributions in the final period of the repeated PGG are the groups’ average contributions in the first period () and the minimum13 of the groups’ members’ CCAs (). These two variables together explain of the variance in groups’ average contributions in the final period of the repeated PGG.14 This shows that we can predict a group’s performance (as operationalized by its average contribution level in the final period) quite well given that we know the group’s initial average contribution level and the minimum of the group members’ degrees of conditional cooperativeness. This result also holds, and is even more pronounced, if we define group performance as the groups’ average contribution levels across all of the 10 periods.15 The groups’ total average contribution levels across periods 2 to 10 depend on the groups’ average contribution levels in period 1 (), and the minimum of the groups’ members’ CCAs (). Clearly, the least cooperative player in a group has significant influence over the whole group’s performance. If group performance is operationalized as the total average group contribution across periods 2 to 10, the two independent variables together explain of the variance in group performance.
4.3. Conditional Cooperation
Since we have assessed conditional cooperation by means of the strategy method just as it was assessed by Fischbacher and Gächter [6] and Fischbacher et al. [7], we can compare some of our findings to previous results. First, we can directly compare our results to the results from Fischbacher et al. [7]. Figure 16 shows the total mean conditional contributions of all16 subjects from the strategy method, and for the subgroups of conditional cooperators, “hump-shaped”, and free riders. We found that of all subjects can be categorized as conditional cooperators, while can be termed “hump-shape” contributors, free riders, and cannot be assigned to one of these categories.17 As for the subjects categorized as conditional cooperators, (relative to all 128 subjects) match the average contributions of others perfectly or almost perfectly, contribute more than the average contributions of others most of the time (i.e., excessive conditional cooperation), predominantly contribute less (i.e., imperfect conditional cooperation), and sometimes contribute more and sometimes less than the average contribution of others.
Hence, our findings replicate the results from Fischbacher et al. [7] quite nicely, although subjects’ overall willingness to cooperate was clearly much higher in our study.18 We also find that many subjects can be termed imperfect conditional cooperators, resulting in a general, but in our study a weak, tendency to contribute less than others on average. This supports the conclusion stated by Fischbacher et al. [7] and Fischbacher and Gächter [6] that imperfect conditional cooperation can cause, or at least contributes substantially to, the decline of cooperation in repeated PGGs that is often observed. However, in our experiment, where subjects received detailed feedback about the contributions of others after each period, and where fixed matching was applied, we do not find a general tendency of subjects to contribute less than the average contribution of their group members in the aggregate. However, we can readily imagine that we would have observed such a pattern if the subjects in our experiment had solely received feedback about the average contribution of others in the repeated PGG, rather than receiving a full revelation of each group member’s contribution after each period.
We extend previous findings by investigating how SVO relates to cooperator types as assessed by means of the strategy method. Table 4 shows the proportion of subjects with a particular SVO value (assigned to the categories low, medium, and high SVO) per choice pattern in the strategy method. Let us first read the table row-wise, and attend to the corresponding percentages indicated to the right of the vertical line in the parentheses. Clearly, the subjects who indicated to free ride completely in the strategy method are predominantly subjects with low or medium SVOs (nearly 80 percent together). However, there are also some subjects with high SVOs who choose free riding in the strategy method. Interestingly, among the perfect conditional cooperators, there are predominantly subjects with a medium SVO, followed by those with a high SVO, while still more than a fifth of all perfect conditional cooperators is represented by subjects with low SVOs (i.e., individualists and competitors). In accordance with expectation, most excessive conditional cooperators are subjects with high SVOs and medium SVOs. Also, most imperfect conditional cooperators are subjects with low-to-medium SVOs, while mixed conditional cooperators are predominantly medium-to-high SVO subjects. Finally, hump-shaped cooperators are almost exclusively subjects with intermediate SVO angles.
Consider the table column-wise and focus on the corresponding percentages indicated to the left of the vertical bar in the parentheses. Surprisingly, the modal cooperator type among subjects with low SVOs is not a “free rider”, but rather an “imperfect conditional cooperator”, while the percentages of free riders and perfect conditional cooperators are equal among low-SVO subjects. As for subjects with medium SVOs, the distribution is quite flat across the different cooperator types, with the modal type being perfect conditional cooperation followed by imperfect conditional cooperation. One quarter of the subjects with high SVOs are perfect conditional cooperators, while slightly more than a fifth are mixed conditional cooperators and another fifth are excessive conditional cooperators.
In summary, the two concepts of SVO and conditional cooperator types are neither completely unrelated, nor totally redundant, and Table 4 reveals some surprising results. First, the strategy to free ride given any possible average contribution of others is not exclusively indicated by subjects with low SVOs, but also to a considerable extent by subjects with medium and high SVOs. Second, the modal cooperator type of subjects with low SVOs is not “free rider”, but “imperfect conditional cooperator”, i.e., the relative majority of individualists and competitors is still inclined to cooperate—up to a certain extent—given that others cooperate as well. Third, perfect conditional cooperators can be found across all ranges of SVO, including the lowest range. Finally, excessive and mixed conditional cooperators are predominantly DMs with high SVO angles as expected. These results show that the tendency to condition own contributions on the contribution levels of others is only mildly associated with SVO, and that conditional cooperation is a behavioral pattern that is shown by DMs who are heterogeneous with respect to their basic distributive social preferences.
4.4. SVO
We have assessed SVO twice, once at the very beginning of the experimental session, and once at the very end, right after the repeated PGG, to determine to what extent the dynamics of the repeated interaction (i.e., the increase or decline of cooperation) may lead to changes in the DMs’ distributive preferences. As already shown in Table 1 the correlation between SVO at t and SVO at t is very high (), yet it is lower than the test-retest correlation across a one-week period of we found when validating the SVO Slider Measure (see [52]).
Figure 17 shows the distribution of SVO. About one third of the participants (38, i.e., 31%) showed no change in their distributive social preferences after the repeated PGG, and among those two thirds who did show a change in SVO, 35 (28%) showed an increase in SVO angle (i.e., became more prosocial), and 51 (41%) showed a decrease in their SVO angle (i.e., became less prosocial). However, although more people changed their SVO downwards compared to upwards, the distribution is only slightly skewed, indicating that there is not a massive shift on the aggregate. Also, distributions of SVO angles at t and t are not statistically significantly different from each other as indicated by a Kolmogorov-Smirnov test, suggesting that the PGG interaction by itself did not affect DMs’ distributive preferences in a particular direction at the aggregate level.
The question then is to what degree we can explain individual changes in SVO by characteristics of the individual PGG interactions. A first natural question we can address is whether group performance is predictive of individual shifts in SVO angles (SVO). Both of the two group performance measures we have used previously are significantly associated with SVO, namely the group mean contribution levels across all periods () and likewise the mean contribution levels in the final period (). It is interesting to see that what happens in the very last period appears to be as important as what happened across all ten periods on average. However, the best single predictor of SVO is the average contribution of the DMs’ corresponding group members in the final period with a correlation of (). This may be due to a recency effect (see e.g., [93,94]) or that contributions in the final period are perceived as revelations of others’ intentions unaffected by the shadow of the future [95].
Furthermore, the difference between DMs’ beliefs about the average contribution of others and the actual average contribution of others in the first half of the repeated PGG—especially in the very first period—is predictive of SVO. In particular, the difference between what DMs believed their group members would contribute in the very first period, and what the group members then actually contributed in that first period shows a correlation of () with SVO. This means that shifts in SVO are not independent from the experience of positive surprise or disappointment about the average contribution of group members in the first period. Finally, also the constellation of a group’s members’ CCAs is informative with respect to the group’s members’ SVO. Concretely, SVO is significantly correlated with the average CCA of the three other group members (), and more importantly, with the minimum of the other three group members’ CCAs ().
Clearly, what happens in a group during a repeated PGG influences most corresponding interaction partners’ social preferences, which then affects their subsequent behavior. Contribution levels in the final period of the repeated PGG are far better predicted by SVO at time t (, ) than by SVO at time t (). Consistent with Ackermann et al. [82] and as evaluated by Nax et al. [83], the analyses regarding SVO suggest that people do not only update their beliefs about the behavior of others during a repeated PGG interaction, but additionally update their social preferences. Hence, for understanding the dynamics arising from peoples’ behavior in a repeated PGG interaction, both the process of belief updating, and the process of preference updating must be taken into account.
4.5. Questionnaire Data
In general, the questionnaire data are not very informative with respect to DMs’ behavior in the one-shot PGG, nor with respect to their behavior in the first and last period of the repeated PGG. The only scale which shows some predictive power with respect to contribution levels in the repeated PGG is Machiavellianism, which is significantly negatively associated with contributions in periods 2, 3 and 5 (r ranging between 0.18 and −0.27), and marginally significantly negatively associated with contributions in periods 4, 6, and 7. On average, the correlation between Machiavellianism and contribution levels in the repeated PGG across all periods is (). The negative association, albeit rather weak, between Machiavellianism and contribution levels in the repeated PGG makes sense, since Machiavellianism is also significantly negatively associated with both SVO () and CCA (), which themselves are positively associated with contribution levels. Furthermore, Machiavellianism is the only variable among all the variables we have assessed or computed which is significantly (negatively) associated with the other two questionnaire scales we have assessed, namely the BJW, and Positive Reciprocity (PR).19
5. Discussion
The main results of this study show that both social preferences and beliefs about the behavior of others are important determinants of contributions in both an anonymous one-shot PGG and a repeated game with partner-matching, while up to more than 50% of the variance in individual contribution levels can be explained by these two endogenous factors in both situations. Furthermore, peoples’ beliefs about the social preferences of others turn out to be predictive of contribution levels as well, but only if peoples’ own social preferences and beliefs about the contribution levels of others are statistically controlled for. Furthermore, the relation between peoples’ beliefs about the SVO of others and their own contribution levels appears to be negative, which was surprising. However, our expectation that SVO beliefs are more informative of contribution levels in a repeated interaction compared to a one-shot situation is not supported by the data.
Also to our surprise was the result that contribution levels and beliefs about the contribution levels of others did not differ noticeably between the one-shot PGG and the first period of the repeated PGG. From this we conclude that only very few people took the opportunity to signal their willingness to cooperate at the beginning of the repeated interaction in an effort to induce cooperation by others. Rather, contribution levels can best be predicted by peoples’ beliefs about the contribution level of others together with their social preferences in both situations. Furthermore, we found that most people have a clear tendency to behave conditionally cooperatively, and that this tendency is likely underestimated when measured by means of the strategy method. Our data clearly reiterate the finding by Fischbacher and Gächter [6] that people behave more conditionally cooperative in an ongoing PGG interaction than they indicated they will when asked in the strategy method.
Regarding the dynamics of the repeated PGG interaction, we found that once people receive feedback about the outcomes of a PGG period, they update their beliefs based on the observed average contribution of others, their own contribution level, and the previous belief they had about the average contribution of others. Due to the predominance of the tendency to condition own contributions on the contributions of others, the updated beliefs are then excellent predictors of individual contributions in the following period. However, the accuracy of the prediction can be significantly increased when individual social preferences (i.e., individual SVO scores) are taken into account as well.
A further conclusion from this study is that a group’s performance in the repeated PGG can be predicted quite well by the group members’ average contribution in the first period and the group members’ tendencies to behave conditionally cooperatively. Concretely, the higher the contribution level a group starts with, and the higher the tendency of group members to behave conditionally cooperative, the more likely it is that the group can sustain a high contribution level on average, resulting in higher group performance. Likewise, the lower the contribution level a group starts with, and the lower the group members’ tendencies to behave conditionally cooperative, the more likely it is that the group will end up with a low average contribution level. Since we found no interaction between initial average contribution level and CCA, the effects of the two factors seem to be simply additive. This means that even if a group starts with a rather high average contribution level, it can end up performing poorly given that one or more group members have a very low tendency to behave conditionally cooperative (imperfect conditional cooperators) or free ride completely. Imagine, for instance, a group consisting of one free rider and three perfect conditional cooperators as an extreme case. Even if the three perfect conditional cooperators contribute the full endowment in the first period, the decline of cooperation would unfold due to the distribution of the group members’ CCAs (see [6]), and the group will end up with an average contribution level of 1.12 tokens in the final period. On the contrary, a group starting with a rather low level of cooperation can end up performing very well given that one or more group members have a very high CCA, and sometimes contribute more than the believed average of others (i.e., excessive cooperators).
The finding that a group’s performance is quite strongly dependent on the group’s initial average contribution level, and that initial individual contribution levels depend strongly on individual beliefs players have about the anticipated contributions of others, leads to an interesting implication, namely that peoples’ beliefs about the contribution levels of others can turn into self-fulfilling prophecies. Consider, for instance, a group with very prosocial DMs who have a quite high, but not perfect, tendency to behave conditionally cooperatively. Assume now that the group members all believe that the other group members are going to contribute very little in the first period, so they will also contribute very little since they are conditional cooperators. Once they get feedback about the outcomes of the first period, their beliefs are confirmed and due to their tendency to imperfectly conditionally cooperate, they are very likely to end up performing very poorly, even though they would all have wished and been willing to achieve very high contribution levels.
Furthermore, we have investigated whether the use of the strategy method renders the assessment of individual distributive social preferences by means of independent measures obsolete. We could demonstrate that this is not the case, and that SVO and tendencies to condition own contributions on the contributions of others have differential predictive capacities with respect to contribution decisions both in an anonymous one-shot PGG, and a repeated interaction with partner-matching. Moreover, the results here clarify how SVO and conditional cooperation relate to each other, and show that they are largely independent of each other insofar as the tendency to condition one’s own contributions on the contributions of others is expressed by DMs across the full range of SVO.
An additional and new finding is that peoples’ distributive social preferences (i.e., SVO) can change as a function of what happens during the repeated PGG interaction. Concretely, SVO is associated in the expected direction with both group performance and “surprise” (positive or negative) about the average contribution of others in the first period(s). This is direct evidence for reciprocity according to the definition of reciprocity we have given earlier in this paper. Hence, in the process of a repeated PGG interaction, people do not only update their beliefs about the behavior of others, but do also update their own distributive social preferences in response to the behavior of others. This result extends previous findings and shows that people may not only alter their social preferences towards a specific other person [82,96], but that the behavior of interaction partners can change peoples’ social preferences more generally. It is an open question, however, to which degree the shifts in peoples’ social preferences are decoupled from specific others, i.e., for how long peoples’ distributive preferences remain altered, and to which extent the DMs’ altered distributive preferences would carry over towards a completely different group consisting of people the DMs know they have not yet interacted with.
Concerning the observed individual shifts in SVO, it would be beyond the scope of this paper to discuss the implications of intra-individual variability and context-sensitivity of the SVO construct in general. However, we think there is enough evidence by now (see, e.g., [82,96]) indicating that SVO has both trait and state components, and that further investigating the malleability and variability of this construct may be a promising and worthwhile undertaking. Also, we do not think that the acknowledgement of intra-individual variability in SVO threatens the validity and reliability of studies in which SVO has predominantly been conceptualized as a stable trait. Intra-individual variability has also been observed in personality constructs such as the Big Five, which are prominent examples of generally stable individual differences. In acknowledging that personality variables have both state and trait components, we advocate the conceptualization of traits as density distributions of states (see, e.g., [97,98]), while the variance in distributions may to a large extent be accounted for by context.
6. Conclusions
Theoretical accounts on the determinants of cooperative behavior in social dilemmas have focused on endogenous as well as exogenous factors. However, exogenous factors can influence choice behavior in social dilemmas only if there are endogenous variables which the exogenous factors can act upon, such as individual tastes and beliefs that are heterogeneous among DMs. One way to gain a better understanding of the relative degree to which these individual level factors impact real DMs’ propensities to cooperate in social dilemmas is to measure these factors simultaneously and at the individual level within one integrated study.
Following this line of thought, we conducted and report here a study with extensive measurement of endogenous variables on the individual level to investigate how preferences and beliefs affect contribution levels in both a one-shot and repeated linear PGG, and to what extent individual preferences and beliefs are dynamic. The evidence is clear that people enter a PGG situation with very diverse preferences and beliefs, resulting in notable heterogeneity among players’ choice behavior and willingness to cooperate. However, the data indicate that beliefs are not independent from preferences, and that people generally believe that others have similar preferences as they have and will show a behavior similar to their own.
Once we know peoples’ distributive social preferences (SVO), their tendency to condition their behavior on the behavior of others, and their beliefs about others’ preferences and behavior, we can predict how much they are going to contribute in a one-shot PGG and also in the first period of a repeated PGG with considerable accuracy. In addition, once we know the distribution of preferences, beliefs, and behavior within a group in the first period of a repeated interaction, we can predict how the interaction will evolve and how the group will perform collectively.
We have seen that peoples’ beliefs about the behavior of others are especially critical to their own behavior, and that due to people’s strong tendency to cooperate conditionally, beliefs are the best single predictor of a person’s future behavior in a repeated PGG. However, we have also seen that the impact of peoples’ social preferences on their contribution levels never really fades out nor becomes completely overridden by the effect beliefs have on behavior. Moreover, we could show that the strategy method is not a highly reliable methodological substitute for independent measures of social preferences at the individual level. In summary, both individual preferences and beliefs are important determinants of behavior, and the results show that people not only update their beliefs about others during a repeated interaction, but they also change their distributive social preferences in response to the behavior of others.
Our study allowed us to quantify and explain a substantial amount of the individual choice behavior in a standard linear PGG. However, what is also notable to consider is what our simple model does not account for. Cooperation is complex, and many questions remain unanswered; moreover, some new questions arise from our results. For instance, what are the reasons that people make different decisions in an ongoing PGG than they indicated they would when asked via the strategy method? How do people use and interpret signaling, and what hinders some people from signaling their willingness to cooperate at the beginning of a repeated interaction, the outcome of which—as our data shows—is strongly dependent on the initial periods? Furthermore, it remains an open question how exactly people combine and integrate endogenous and exogenous information to arrive at their contribution decisions. That is, what are the cognitive processes underlying choice behavior in PGGs? How do people learn and adapt their behavior in these interactive and dynamic contexts? To what degree does noise play as these interactions unfold? For instance, it has been shown theoretically that cooperative choices (e.g., [99]) as well as the generally observed decline of cooperation in PGGs (e.g., [100,101]) could be explained by relatively simple models of payoff-based learning while modeling agents to make partially erroneous or random decisions—all under the assumption of narrow self-interest and common knowledge thereof. Given the wealth of findings—including our own—indicating that people do show concern for others, even in anonymous one-shot situations across a variety of domains, we assign a low posterior probability to the hypothesis that human cooperation in social dilemmas only happens by mistake and is simply the result of noise. Nevertheless, we do think that integrating different streams of research across disciplines, theoretical as well as empirical, collected in the laboratory or in the wild, provides fruitful ground for gaining a better understanding of human cooperation and the variety and complexity of its causes.
Author Contributions
Conceptualization, R.O.M. and K.A.A.; methodology, R.O.M. and K.A.A.; formal analysis, K.A.A.; investigation, K.A.A.; resources, K.A.A.; data curation, K.A.A.; writing–original draft preparation, K.A.A.; writing–review and editing, R.O.M. and K.A.A.; visualization, R.O.M. and K.A.A.; supervision, R.O.M.; project administration, K.A.A.; funding acquisition, R.O.M.
Funding
This research has been supported in part by Swiss National Science Foundation (SNF) grant 100014_143199/1.
Acknowledgments
We would like to thank the three anonymous reviewers and Heinrich Nax for their valuable feedback on the paper.
Conflicts of Interest
The authors declare no conflict of interest. The funders had no role in the design of the study; in the collection, analyses, or interpretation of data; in the writing of the manuscript, or in the decision to publish the results.
Appendix A

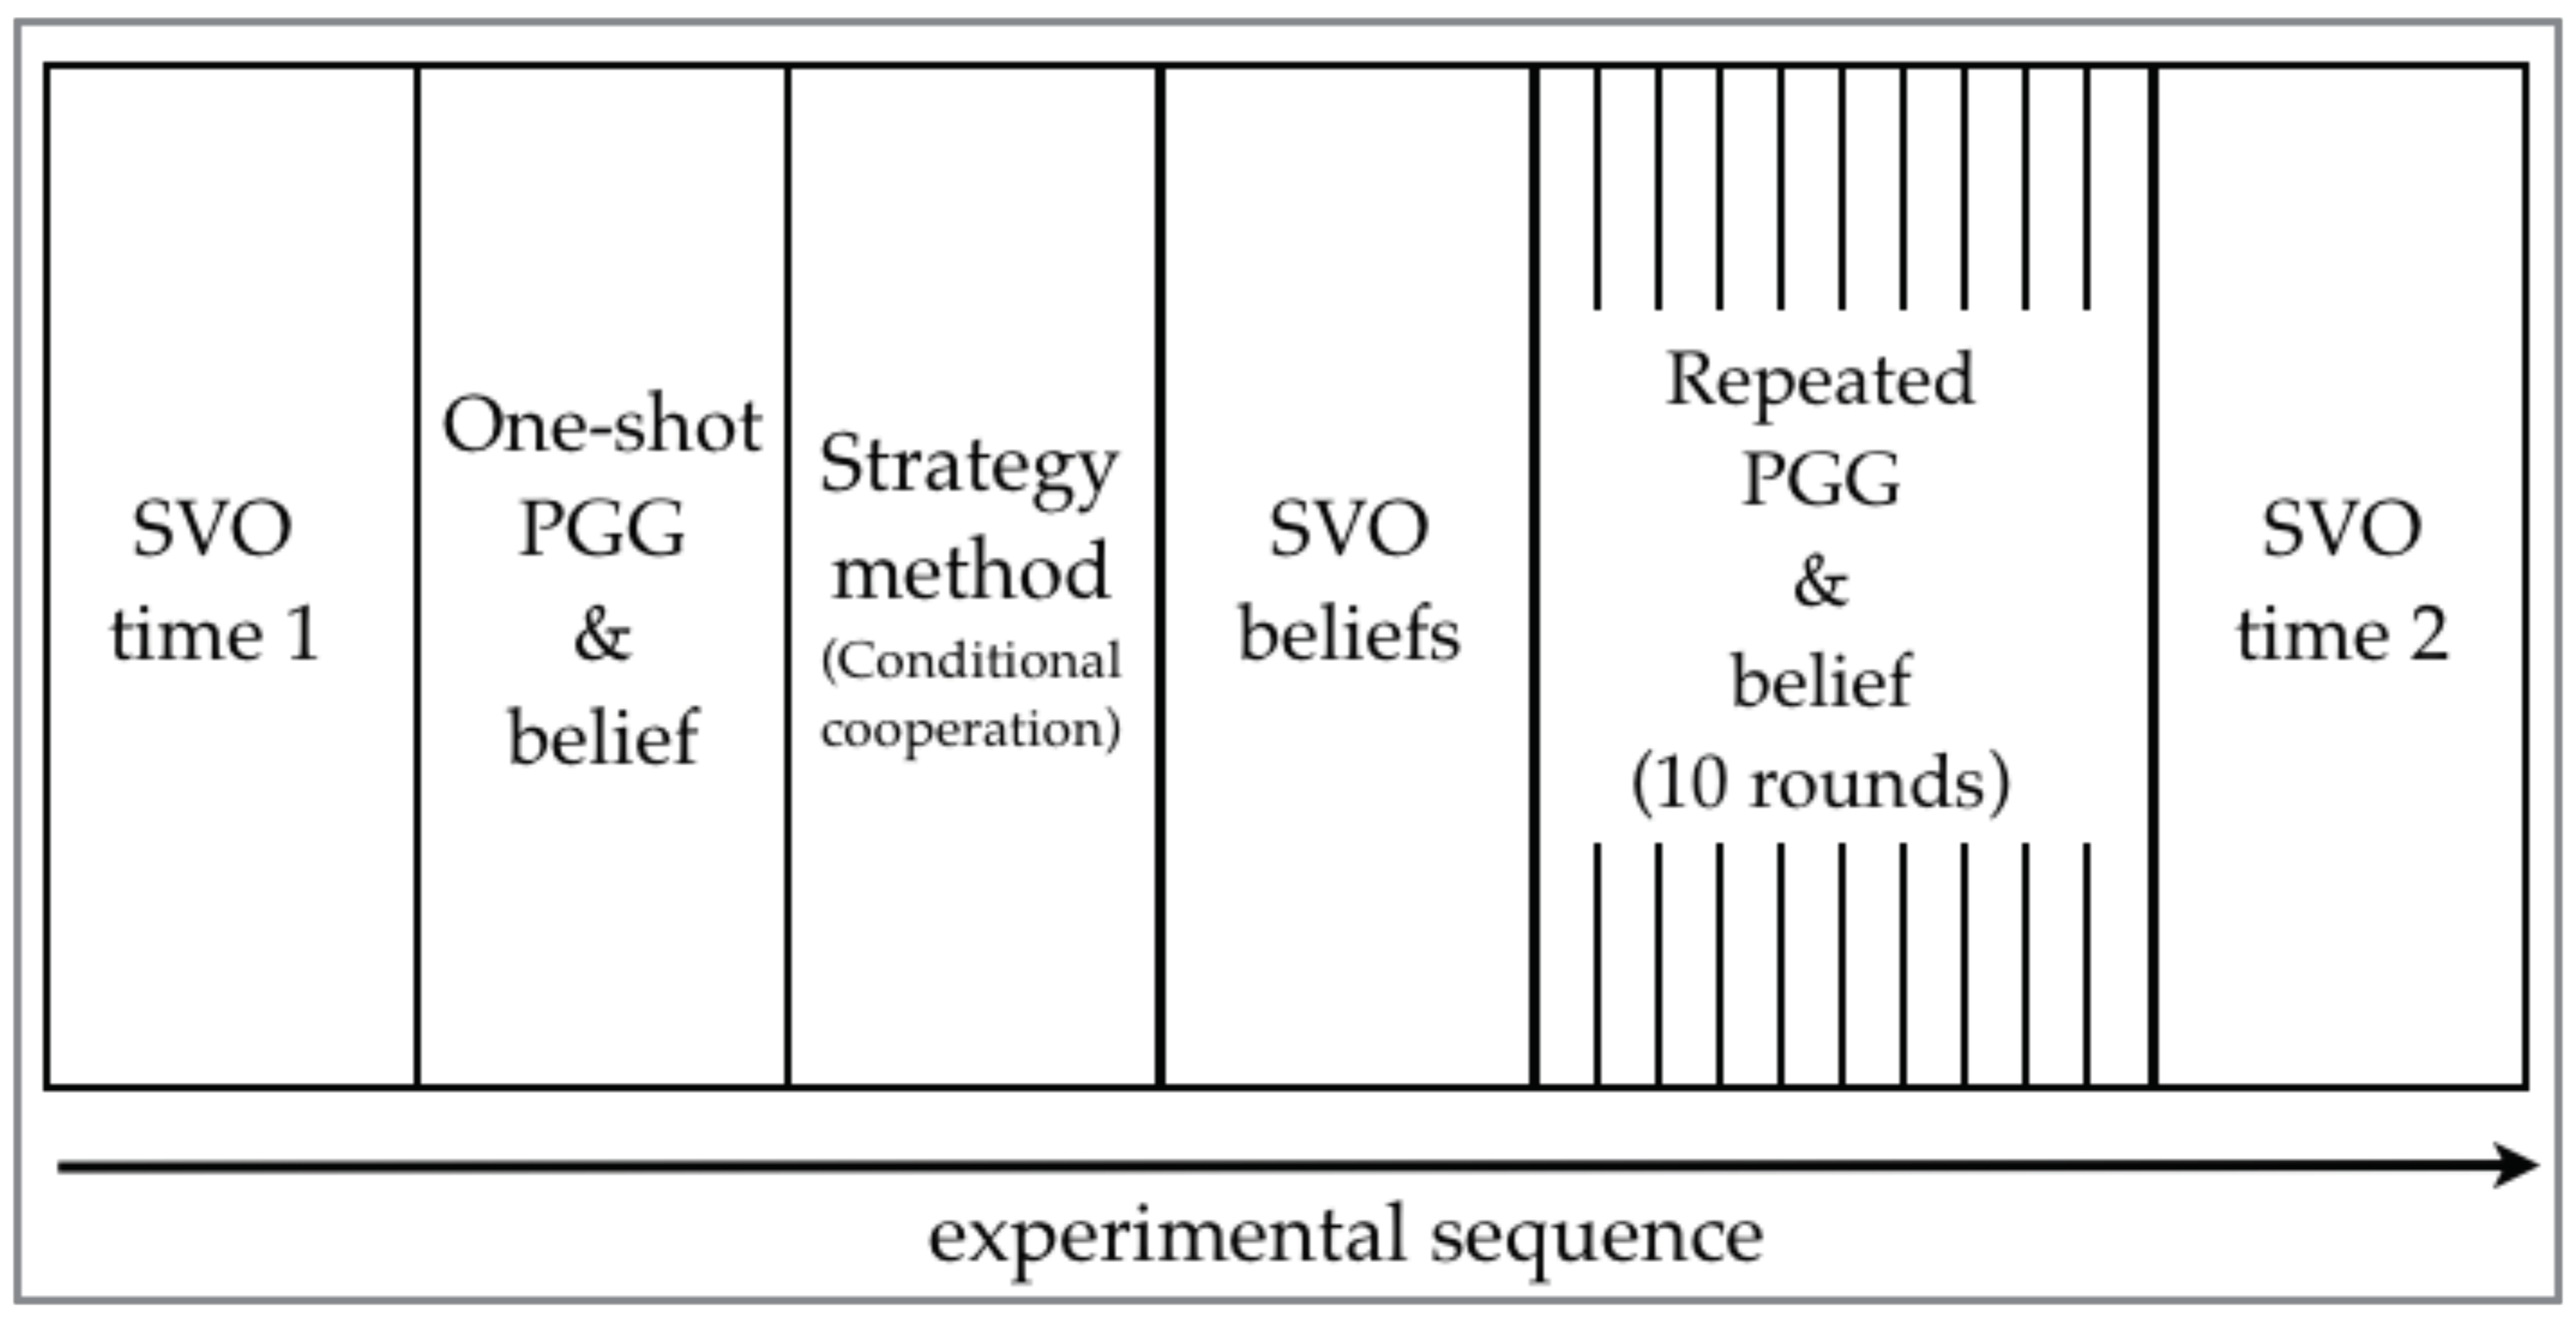
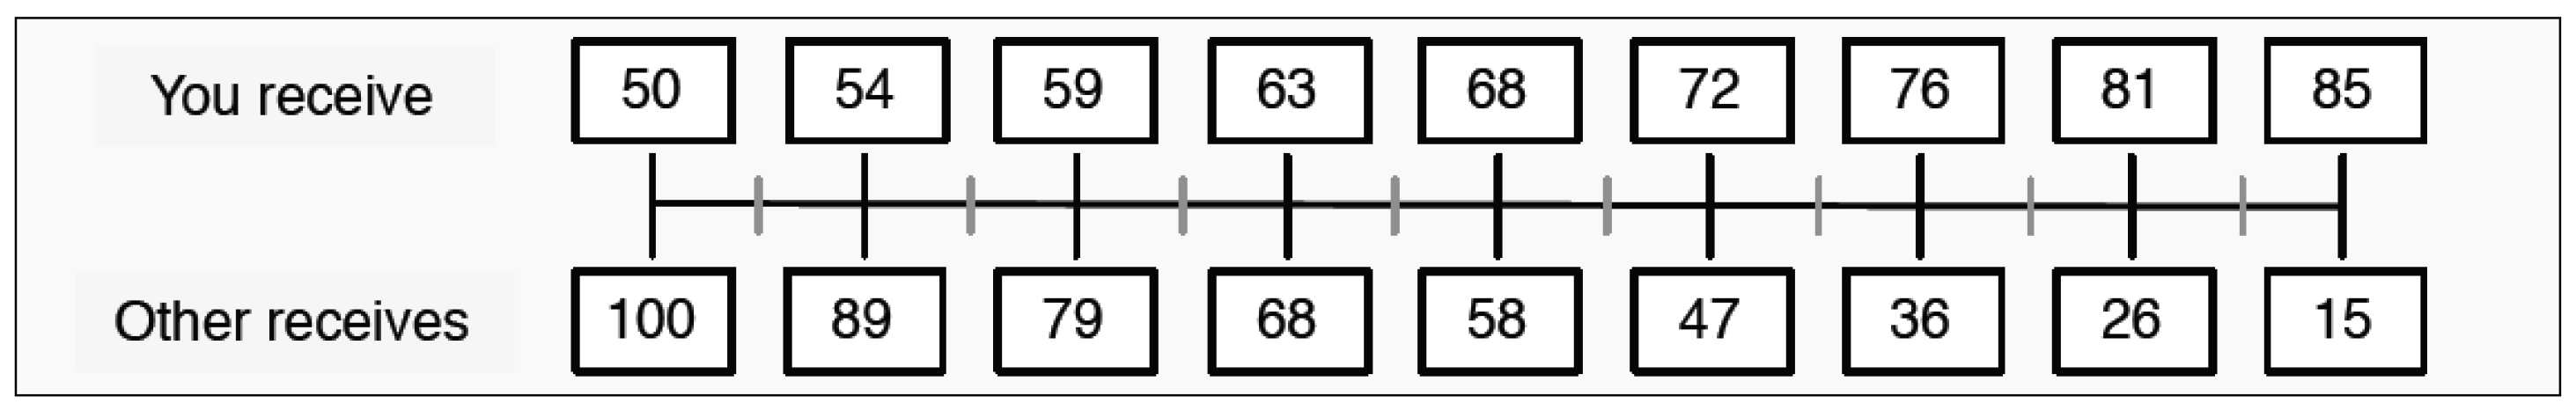
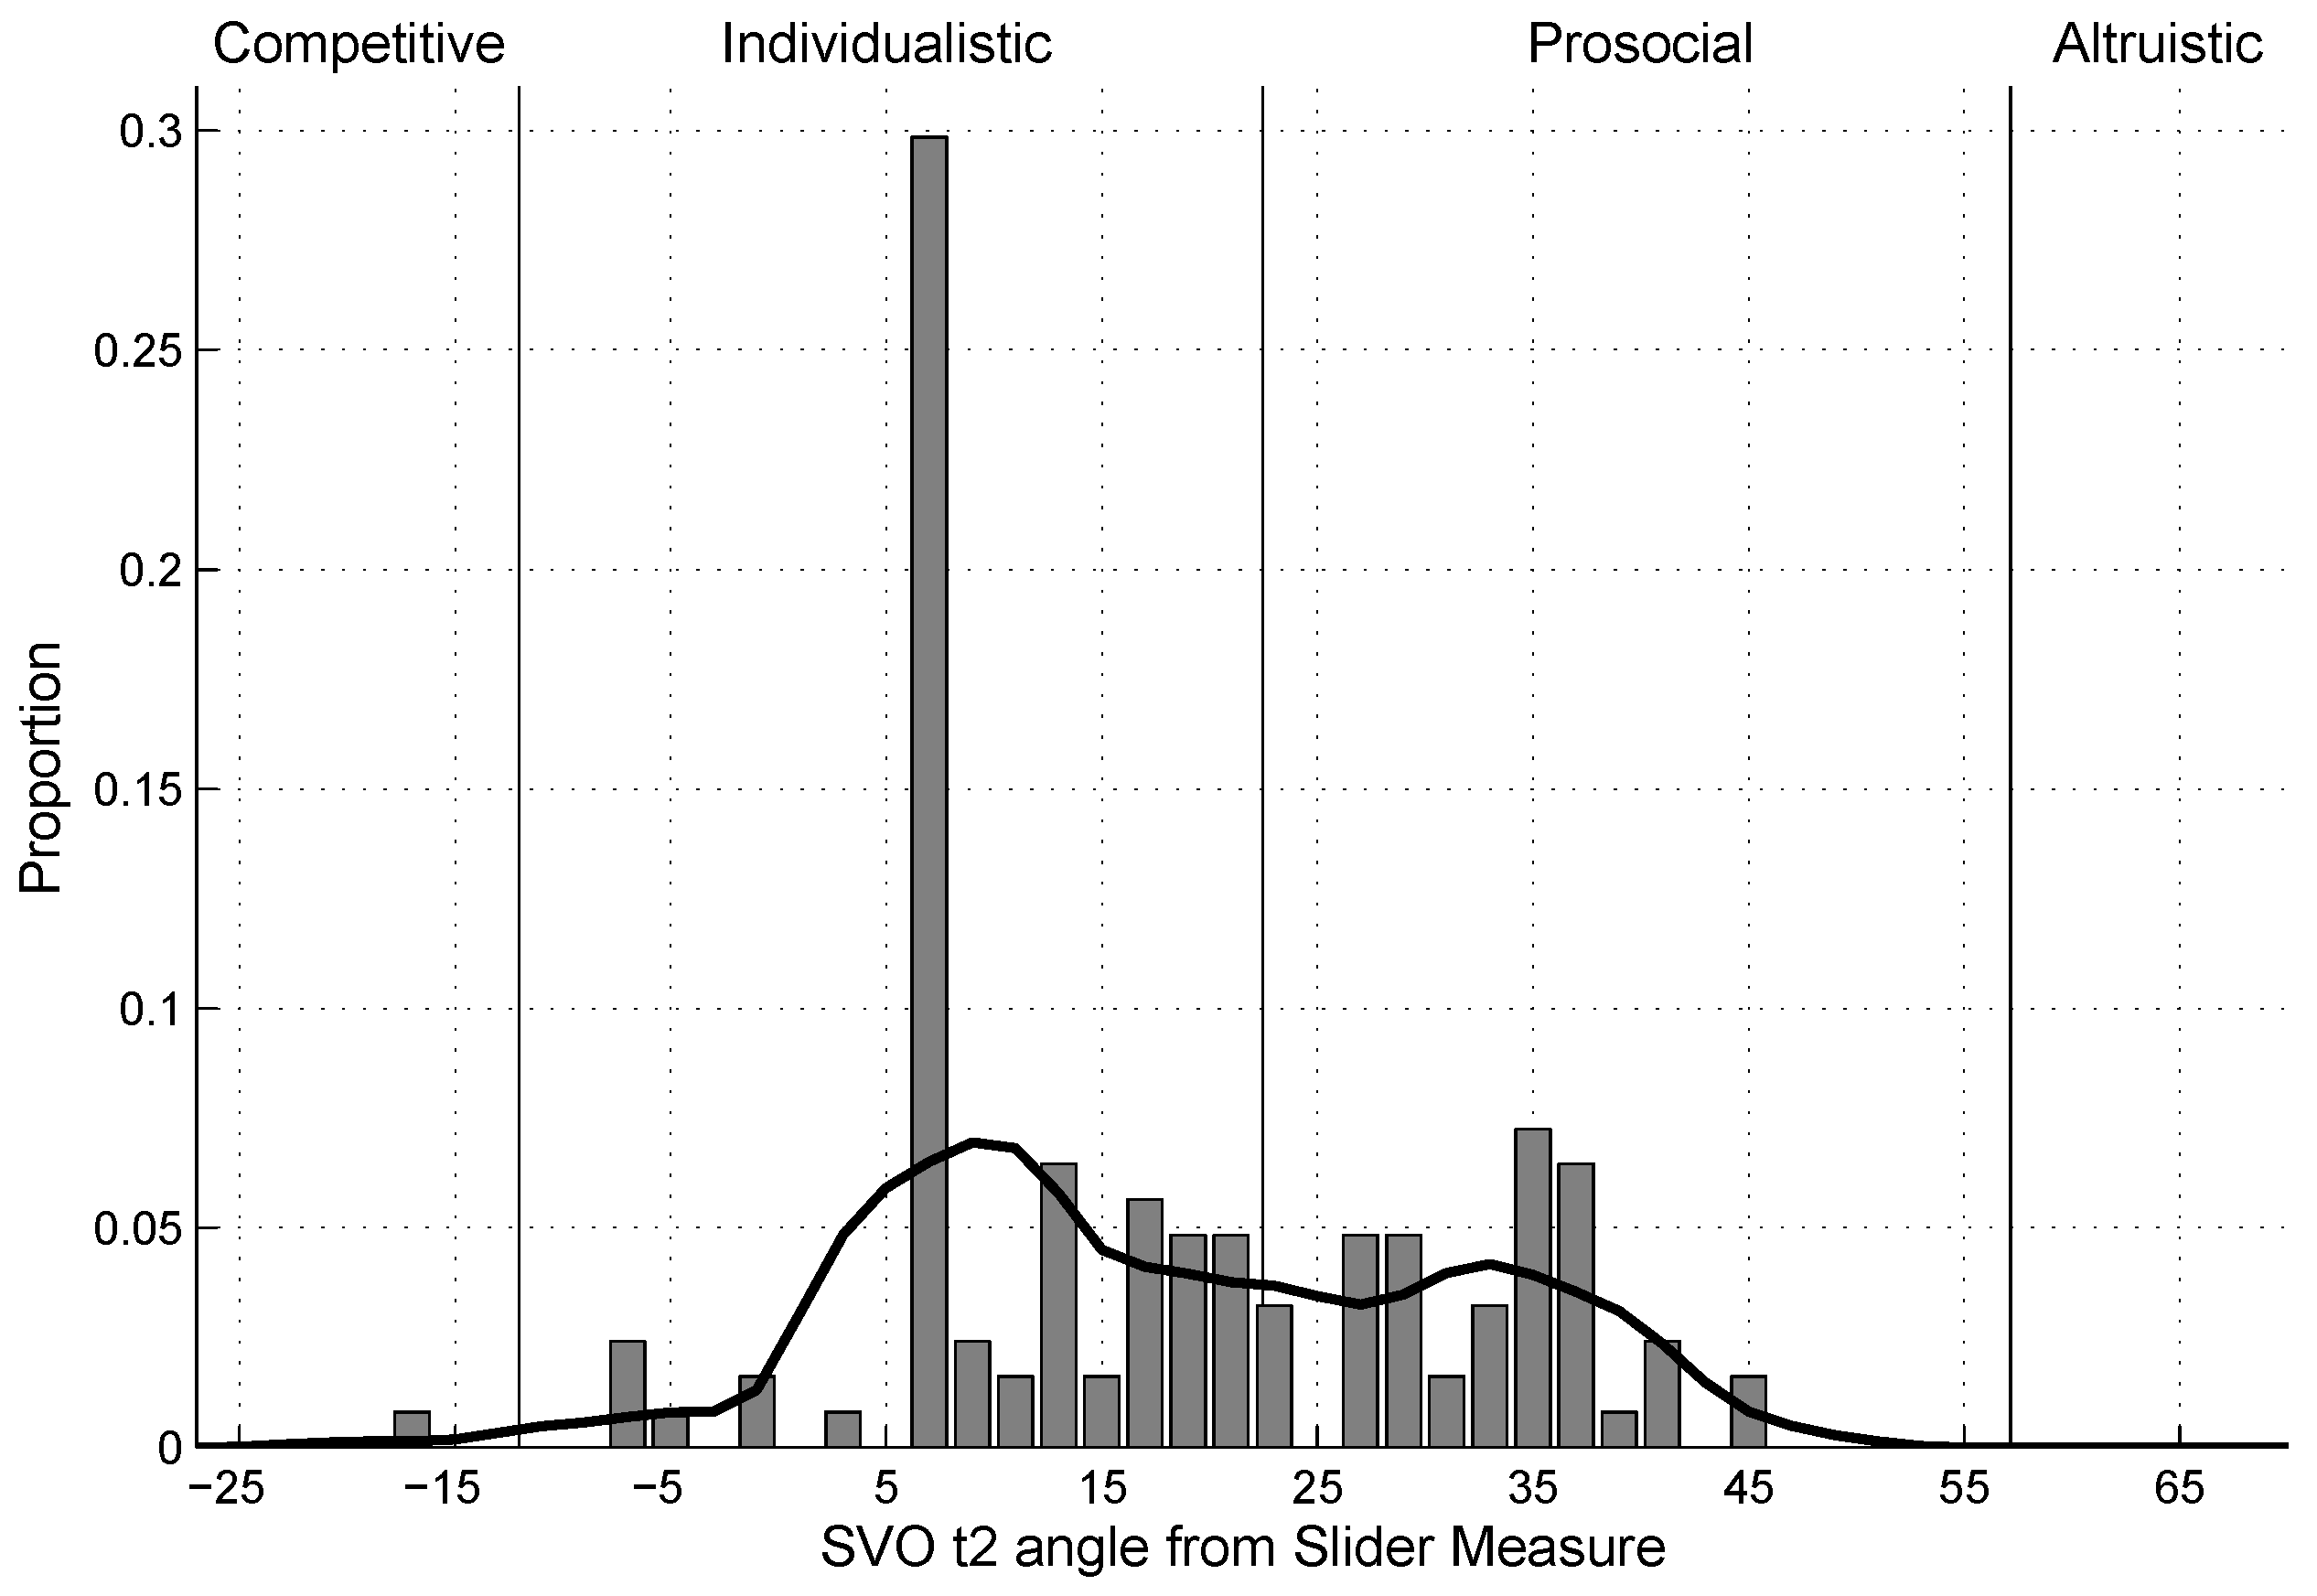
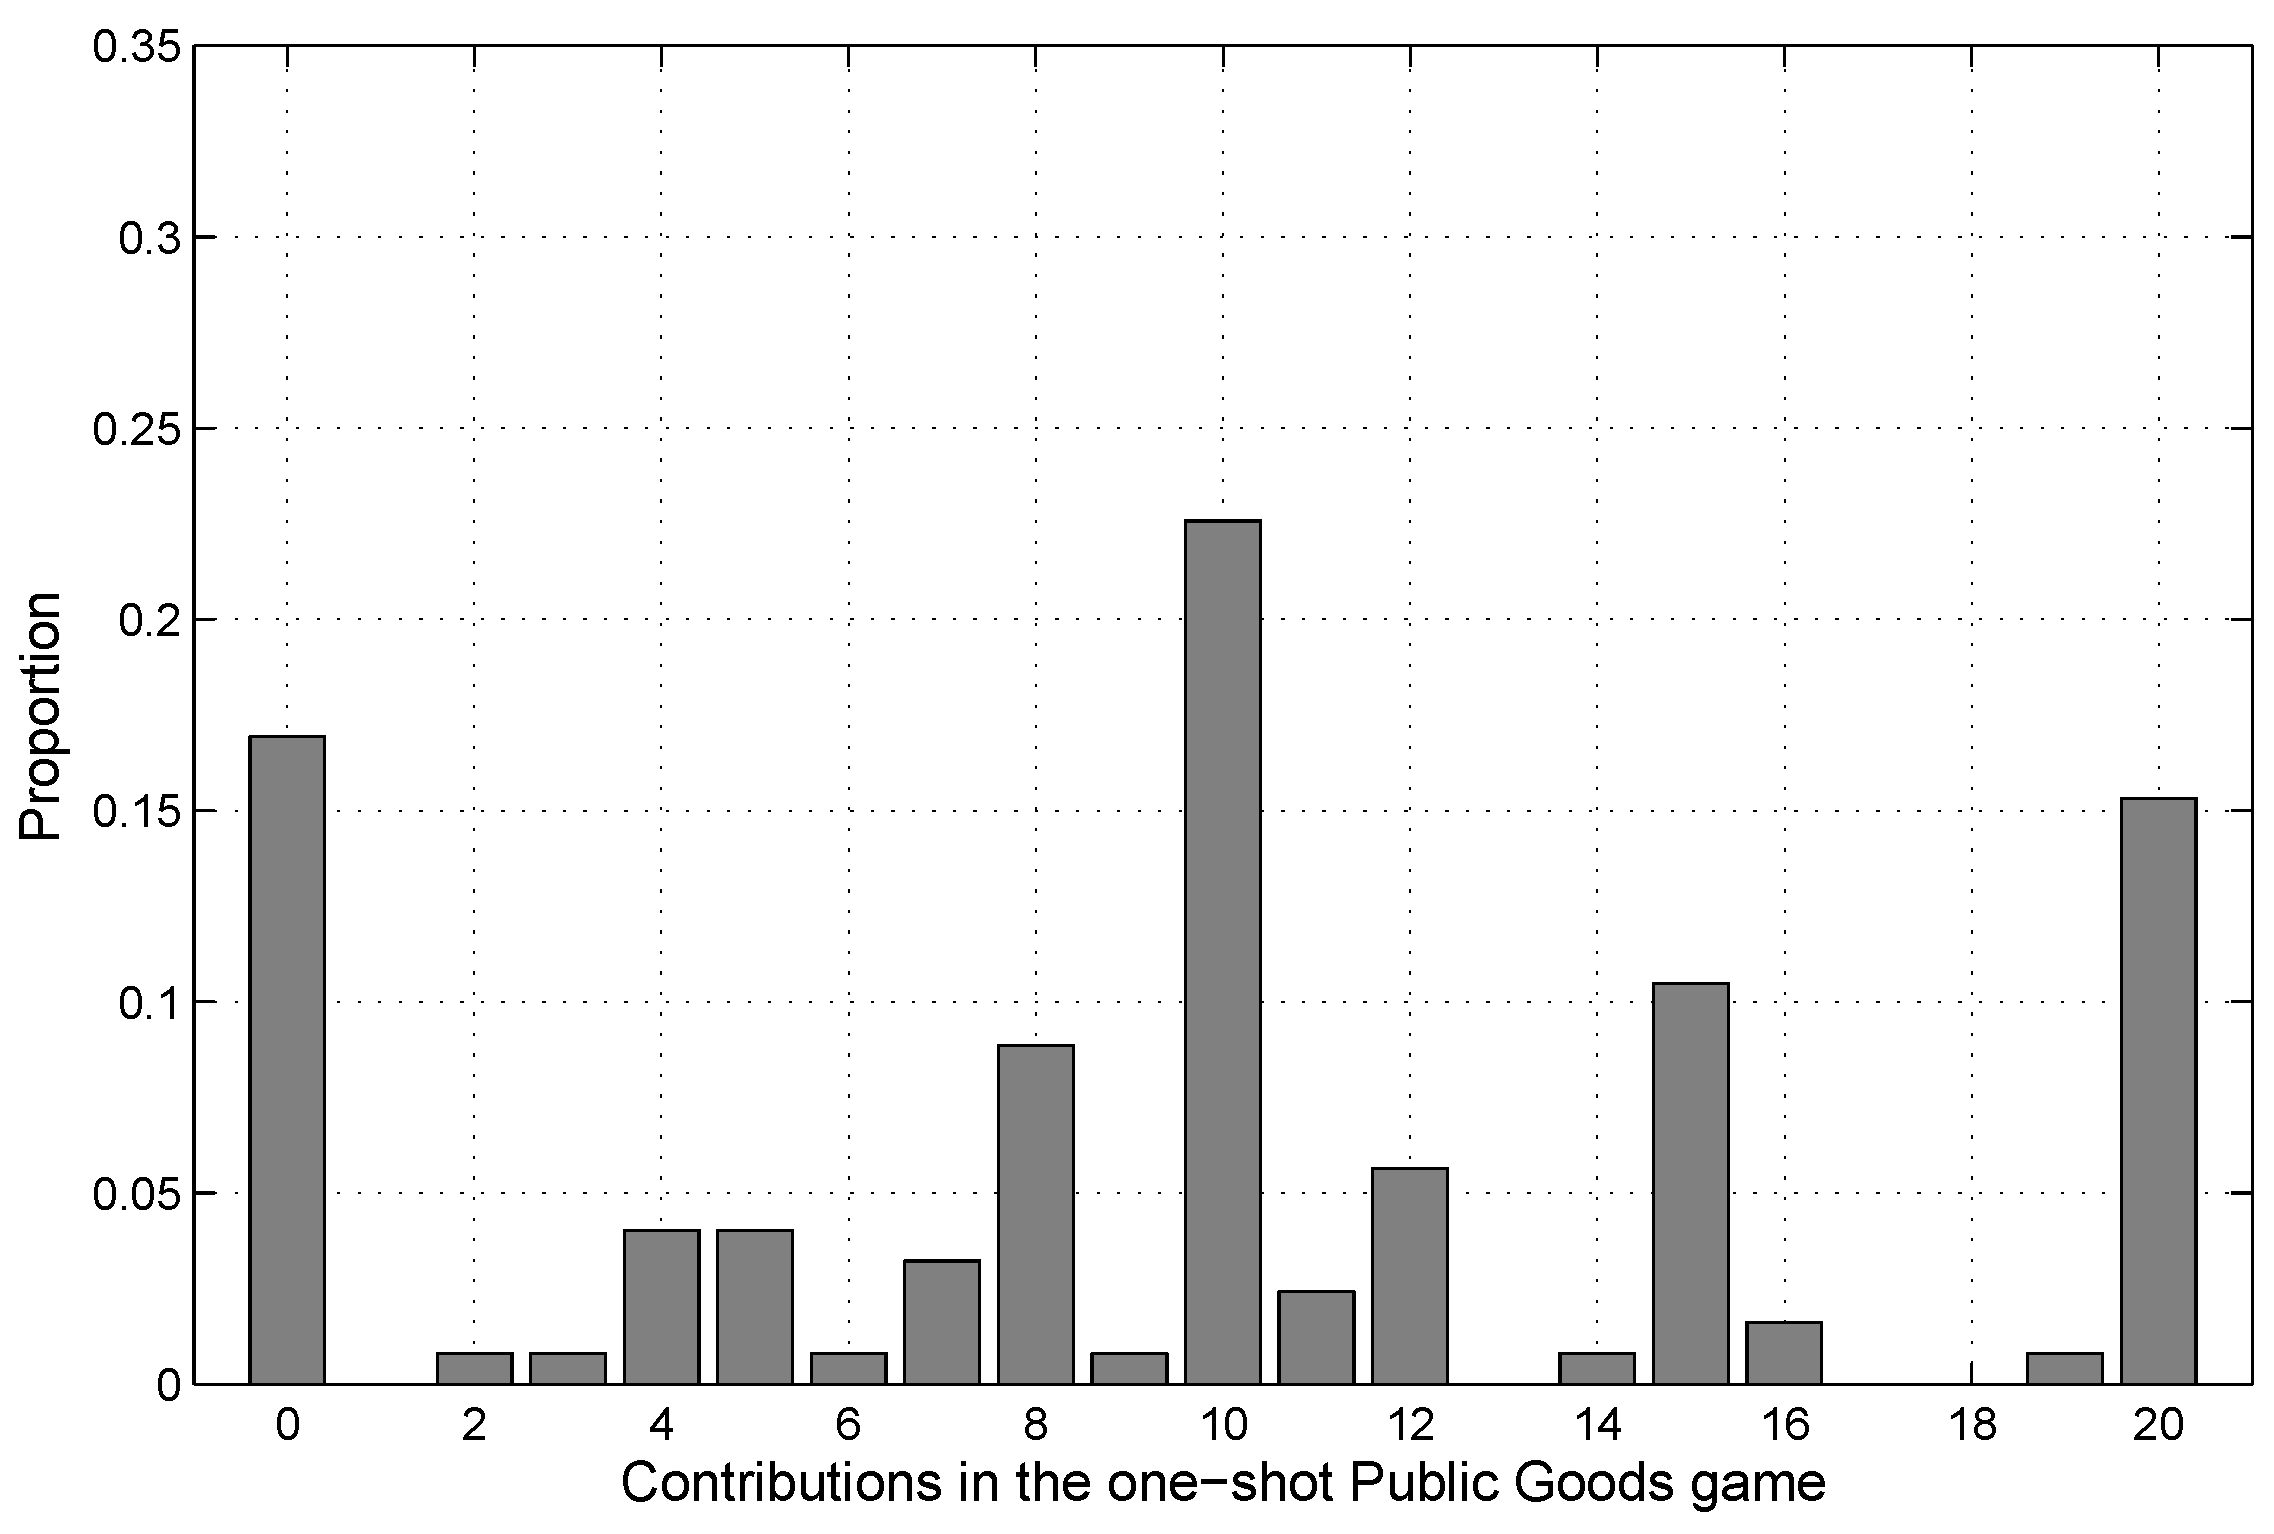
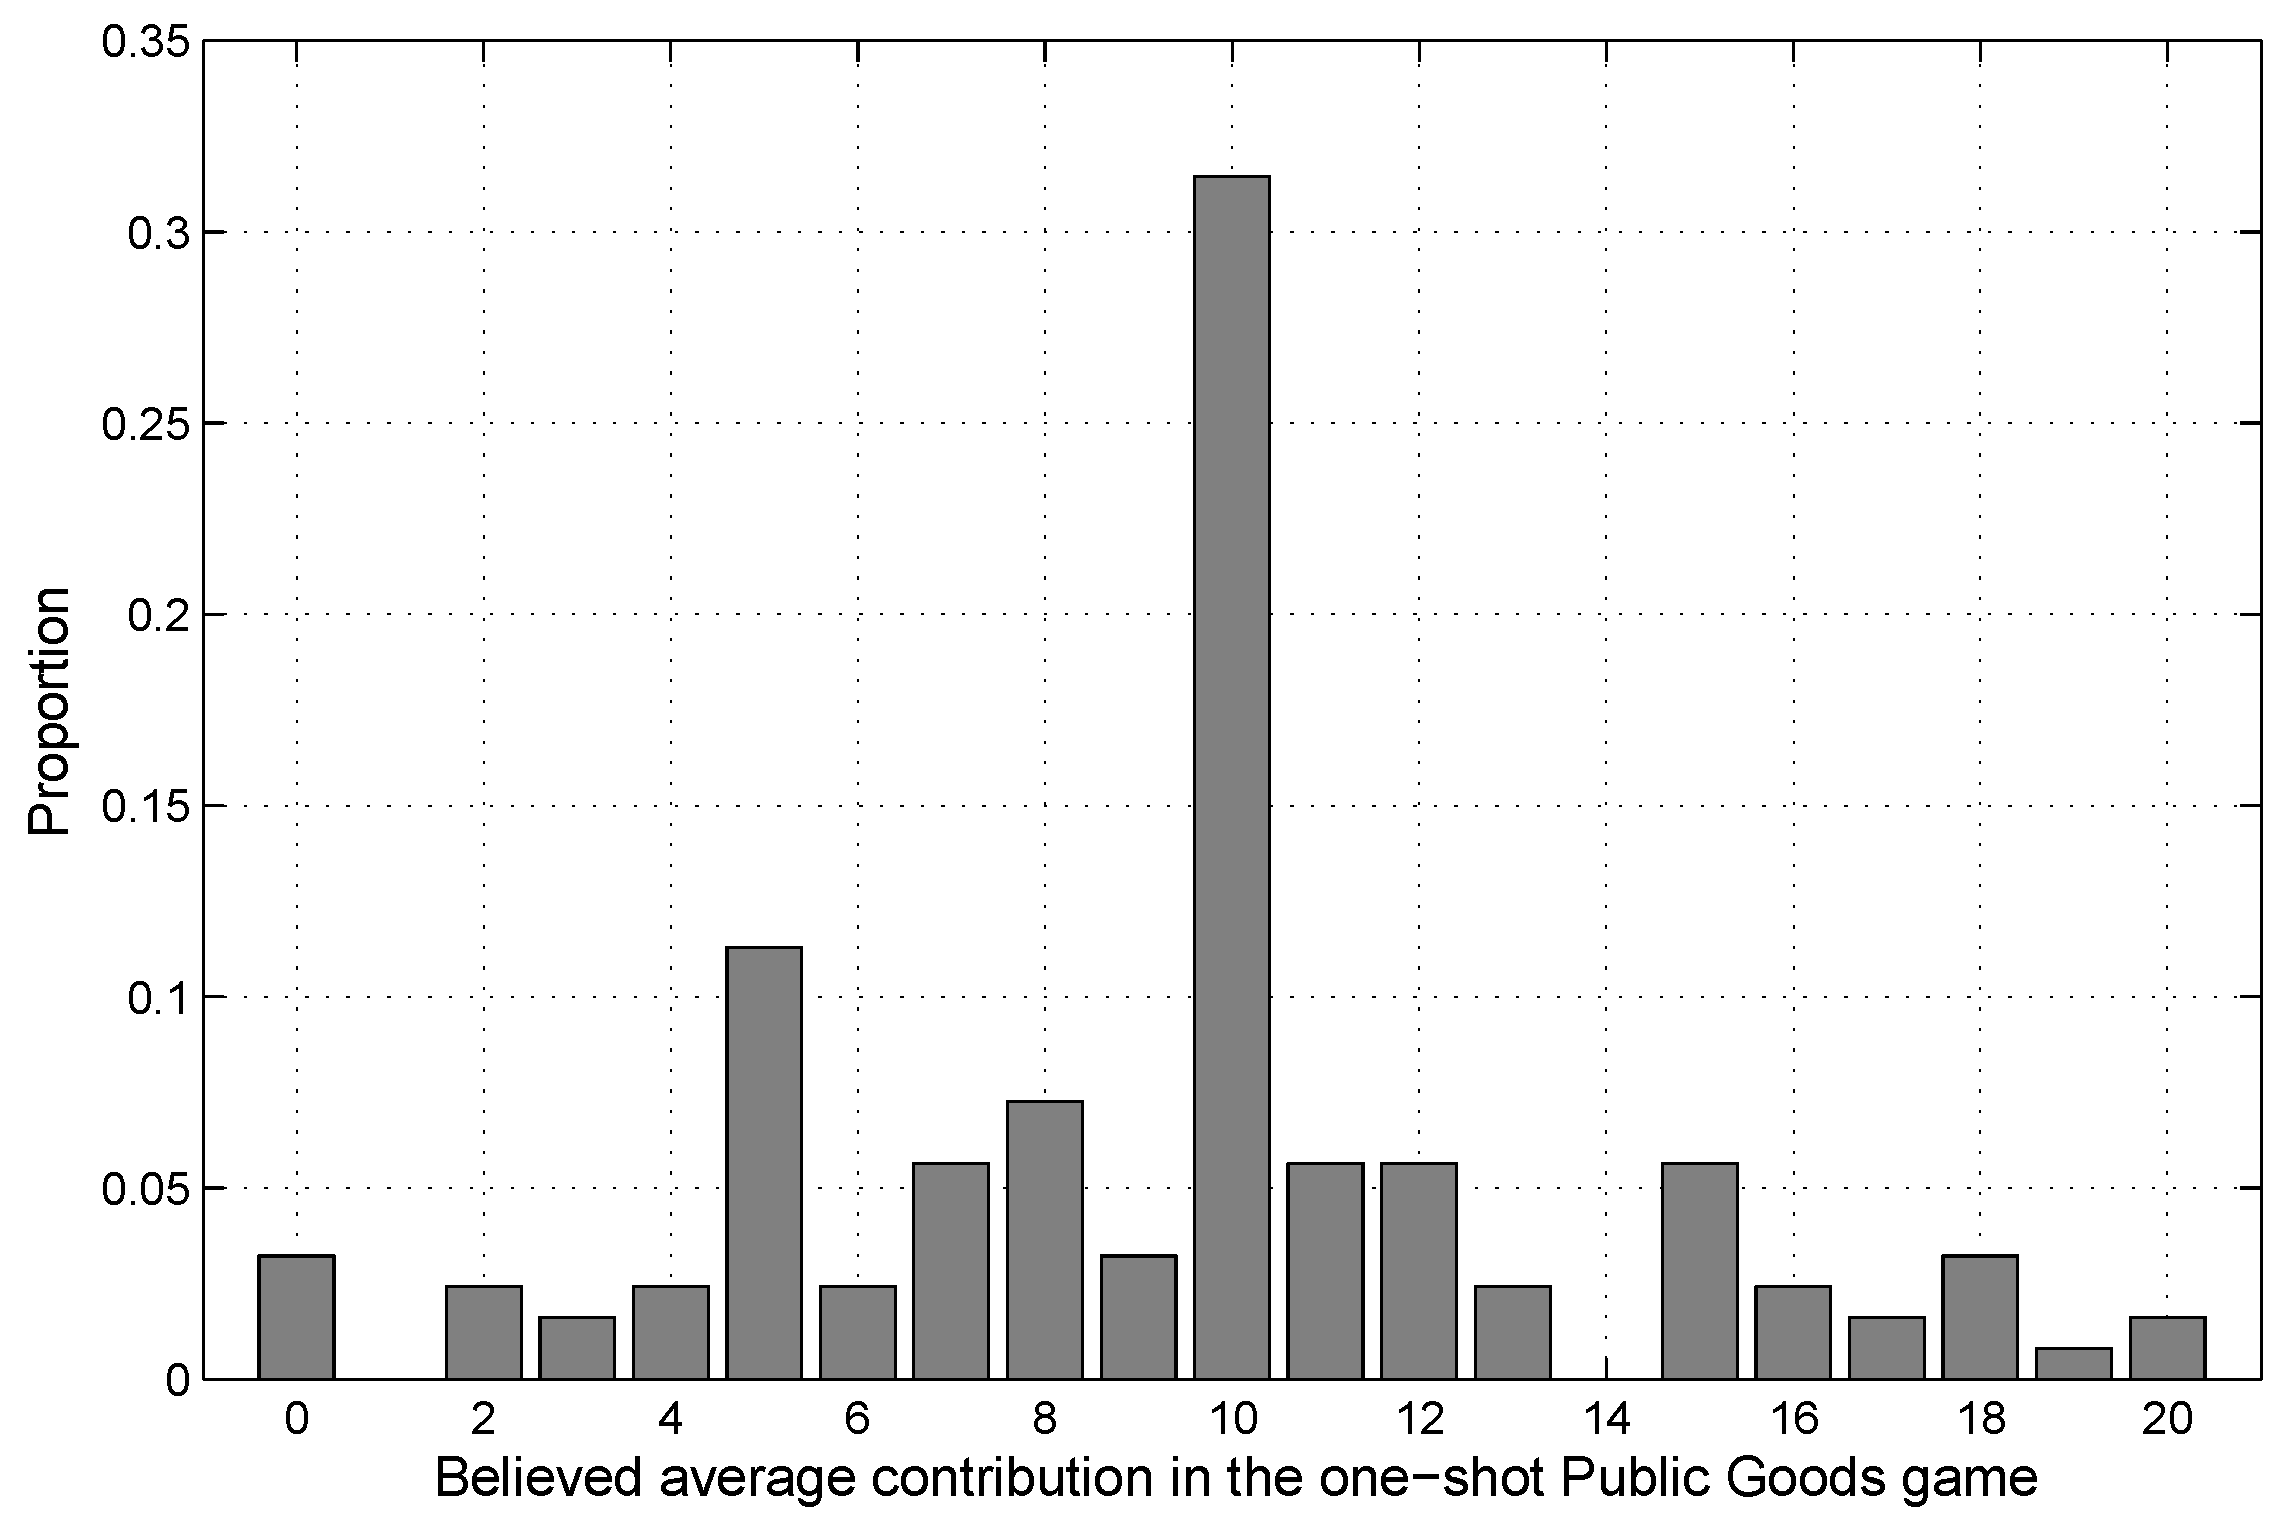
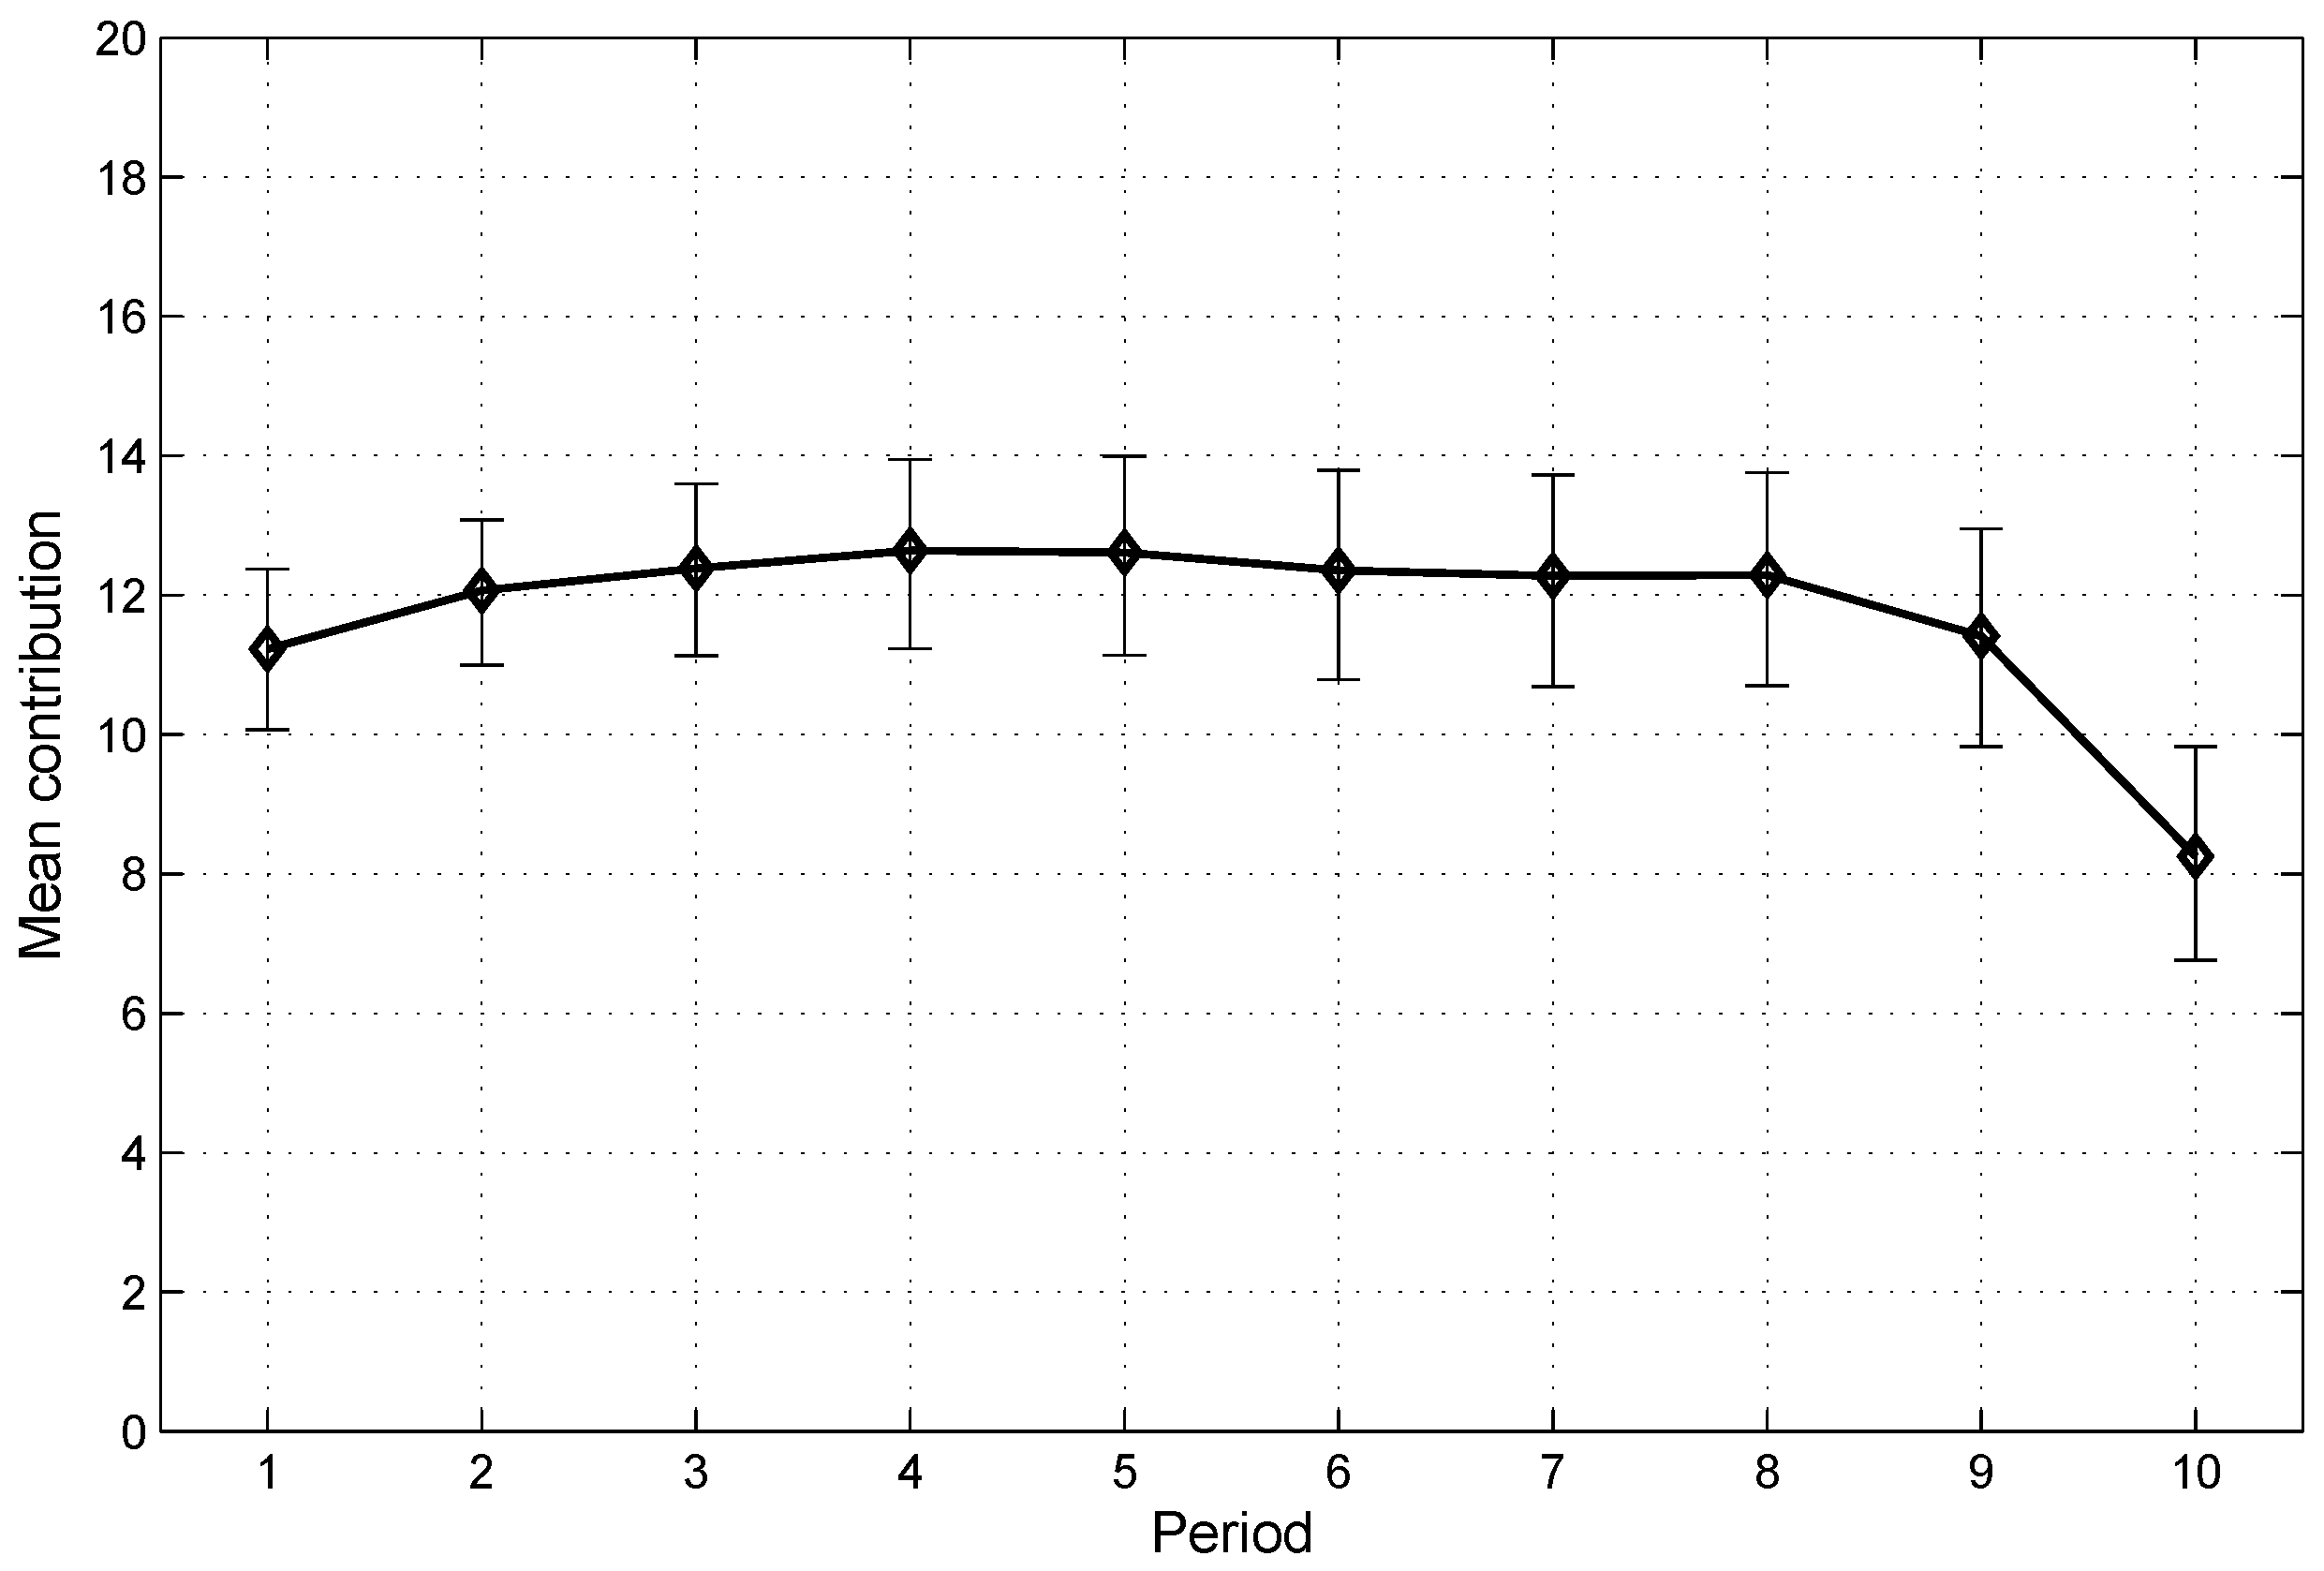
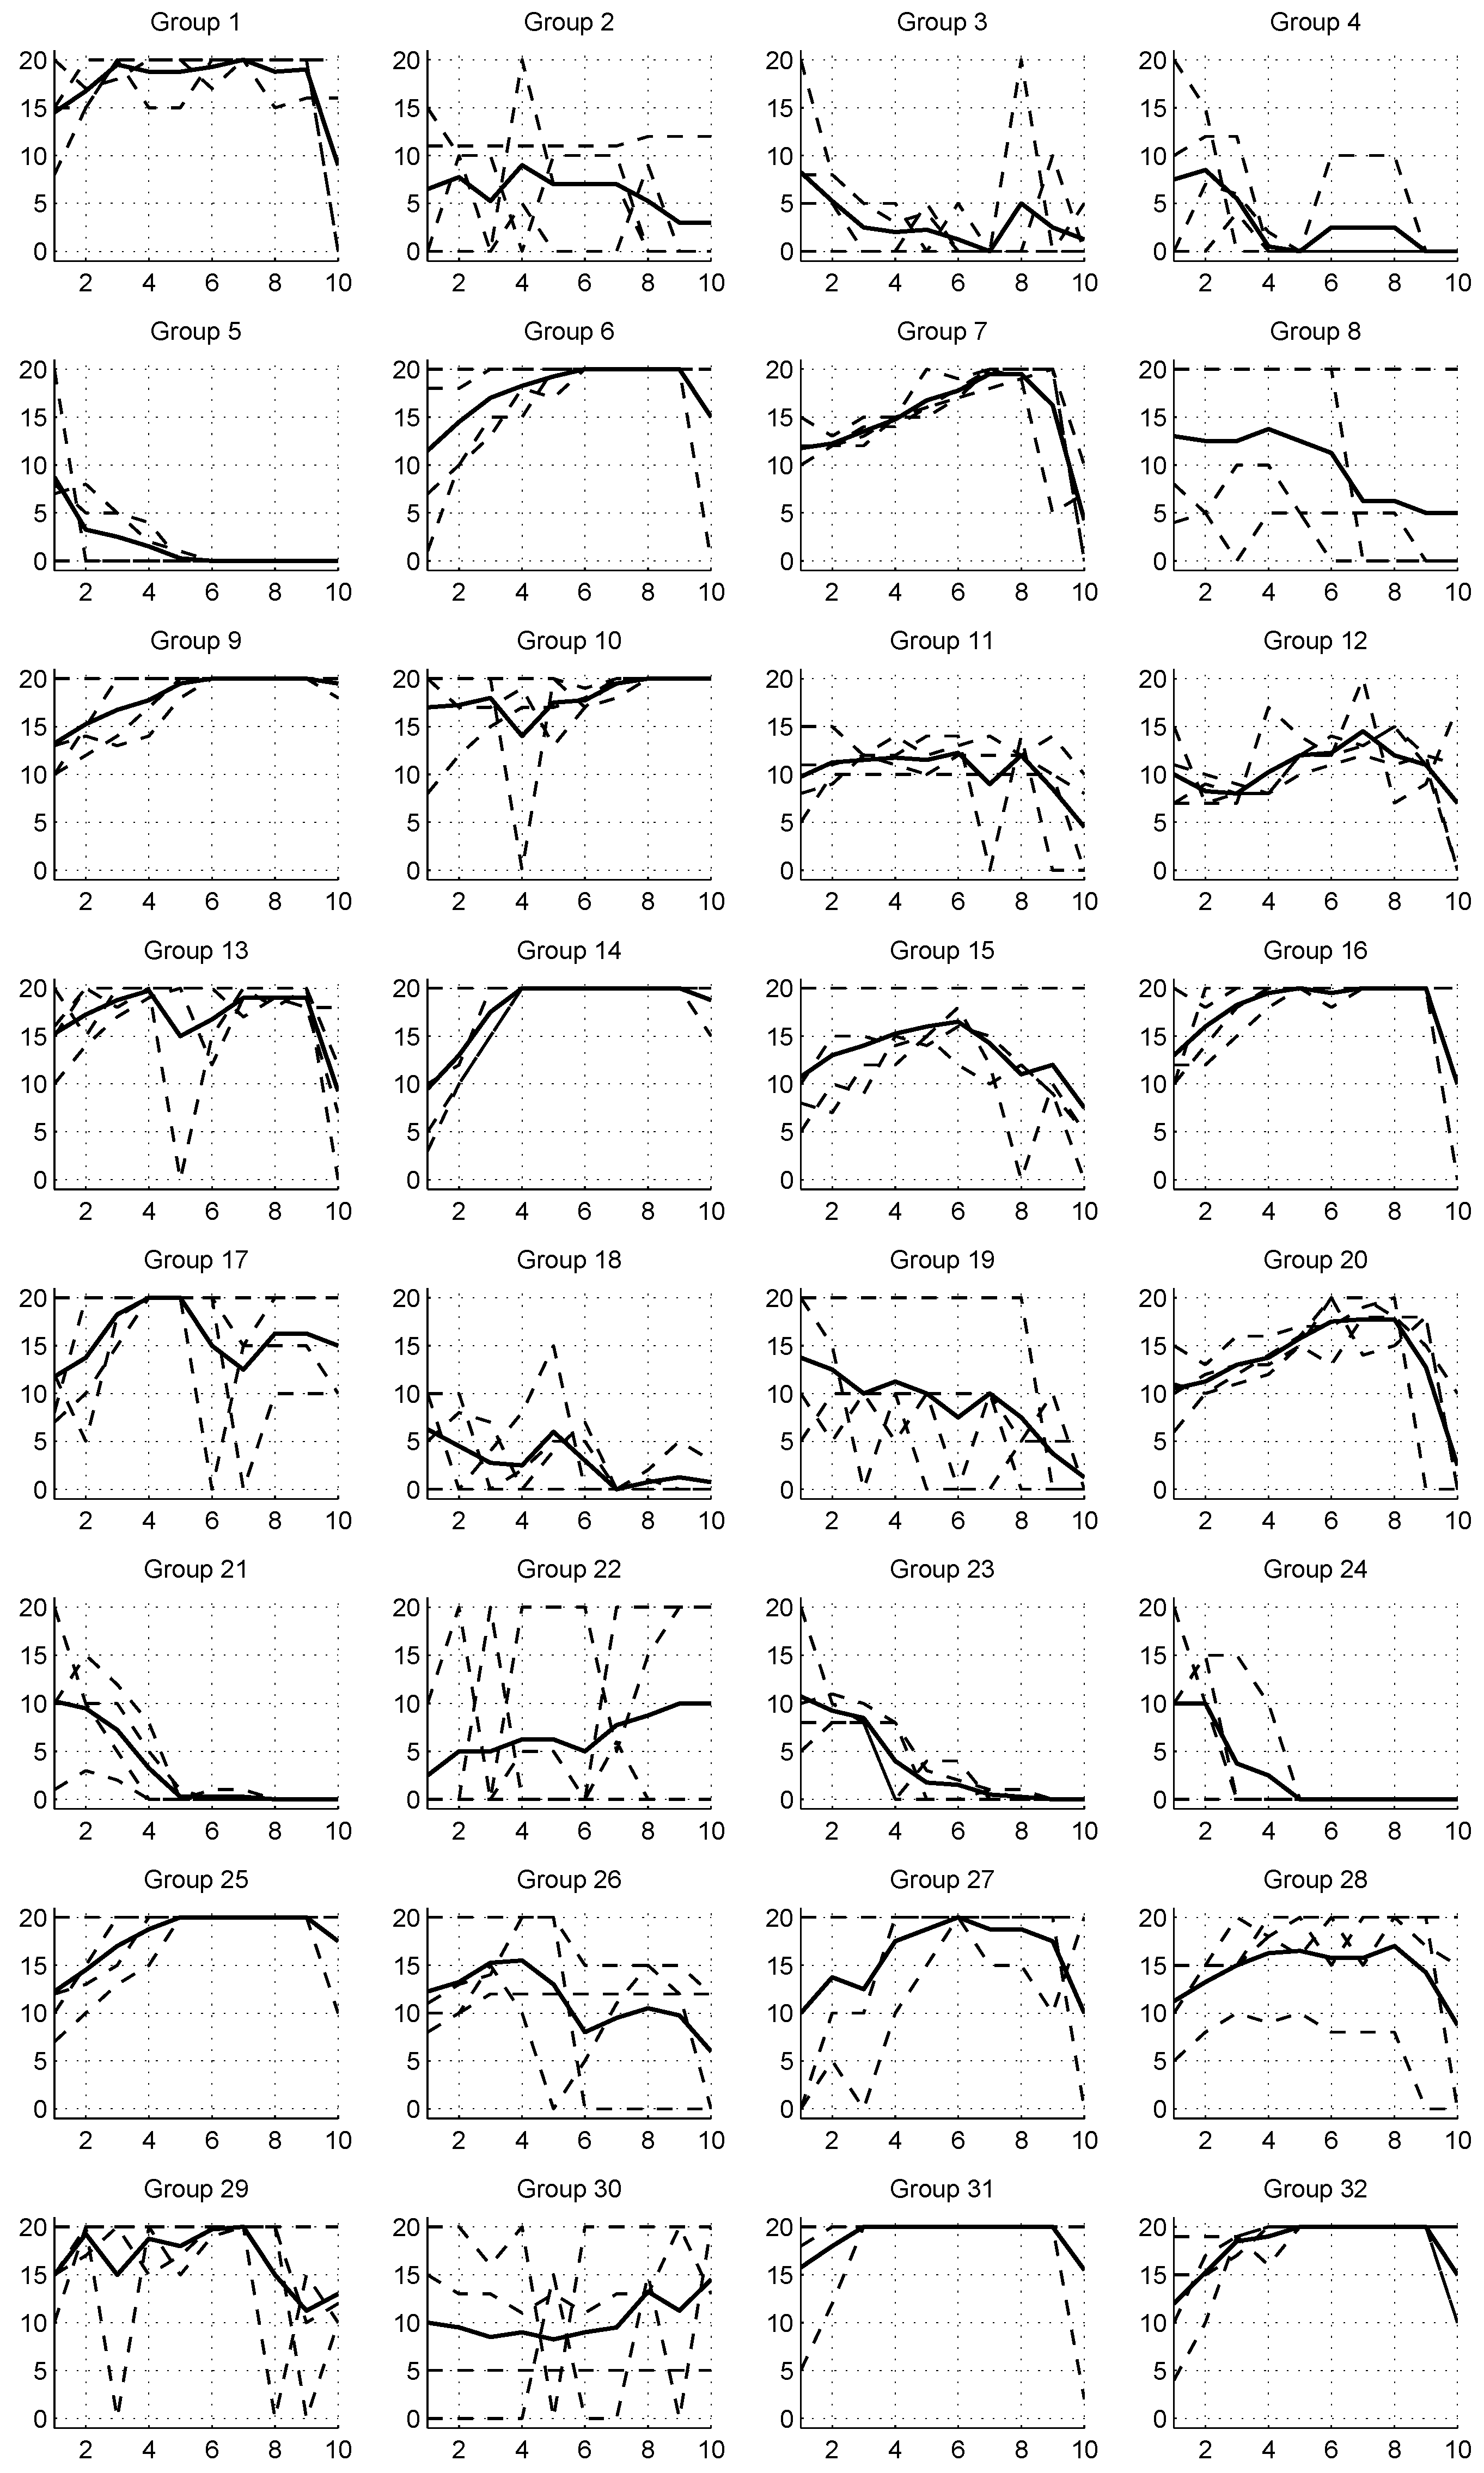
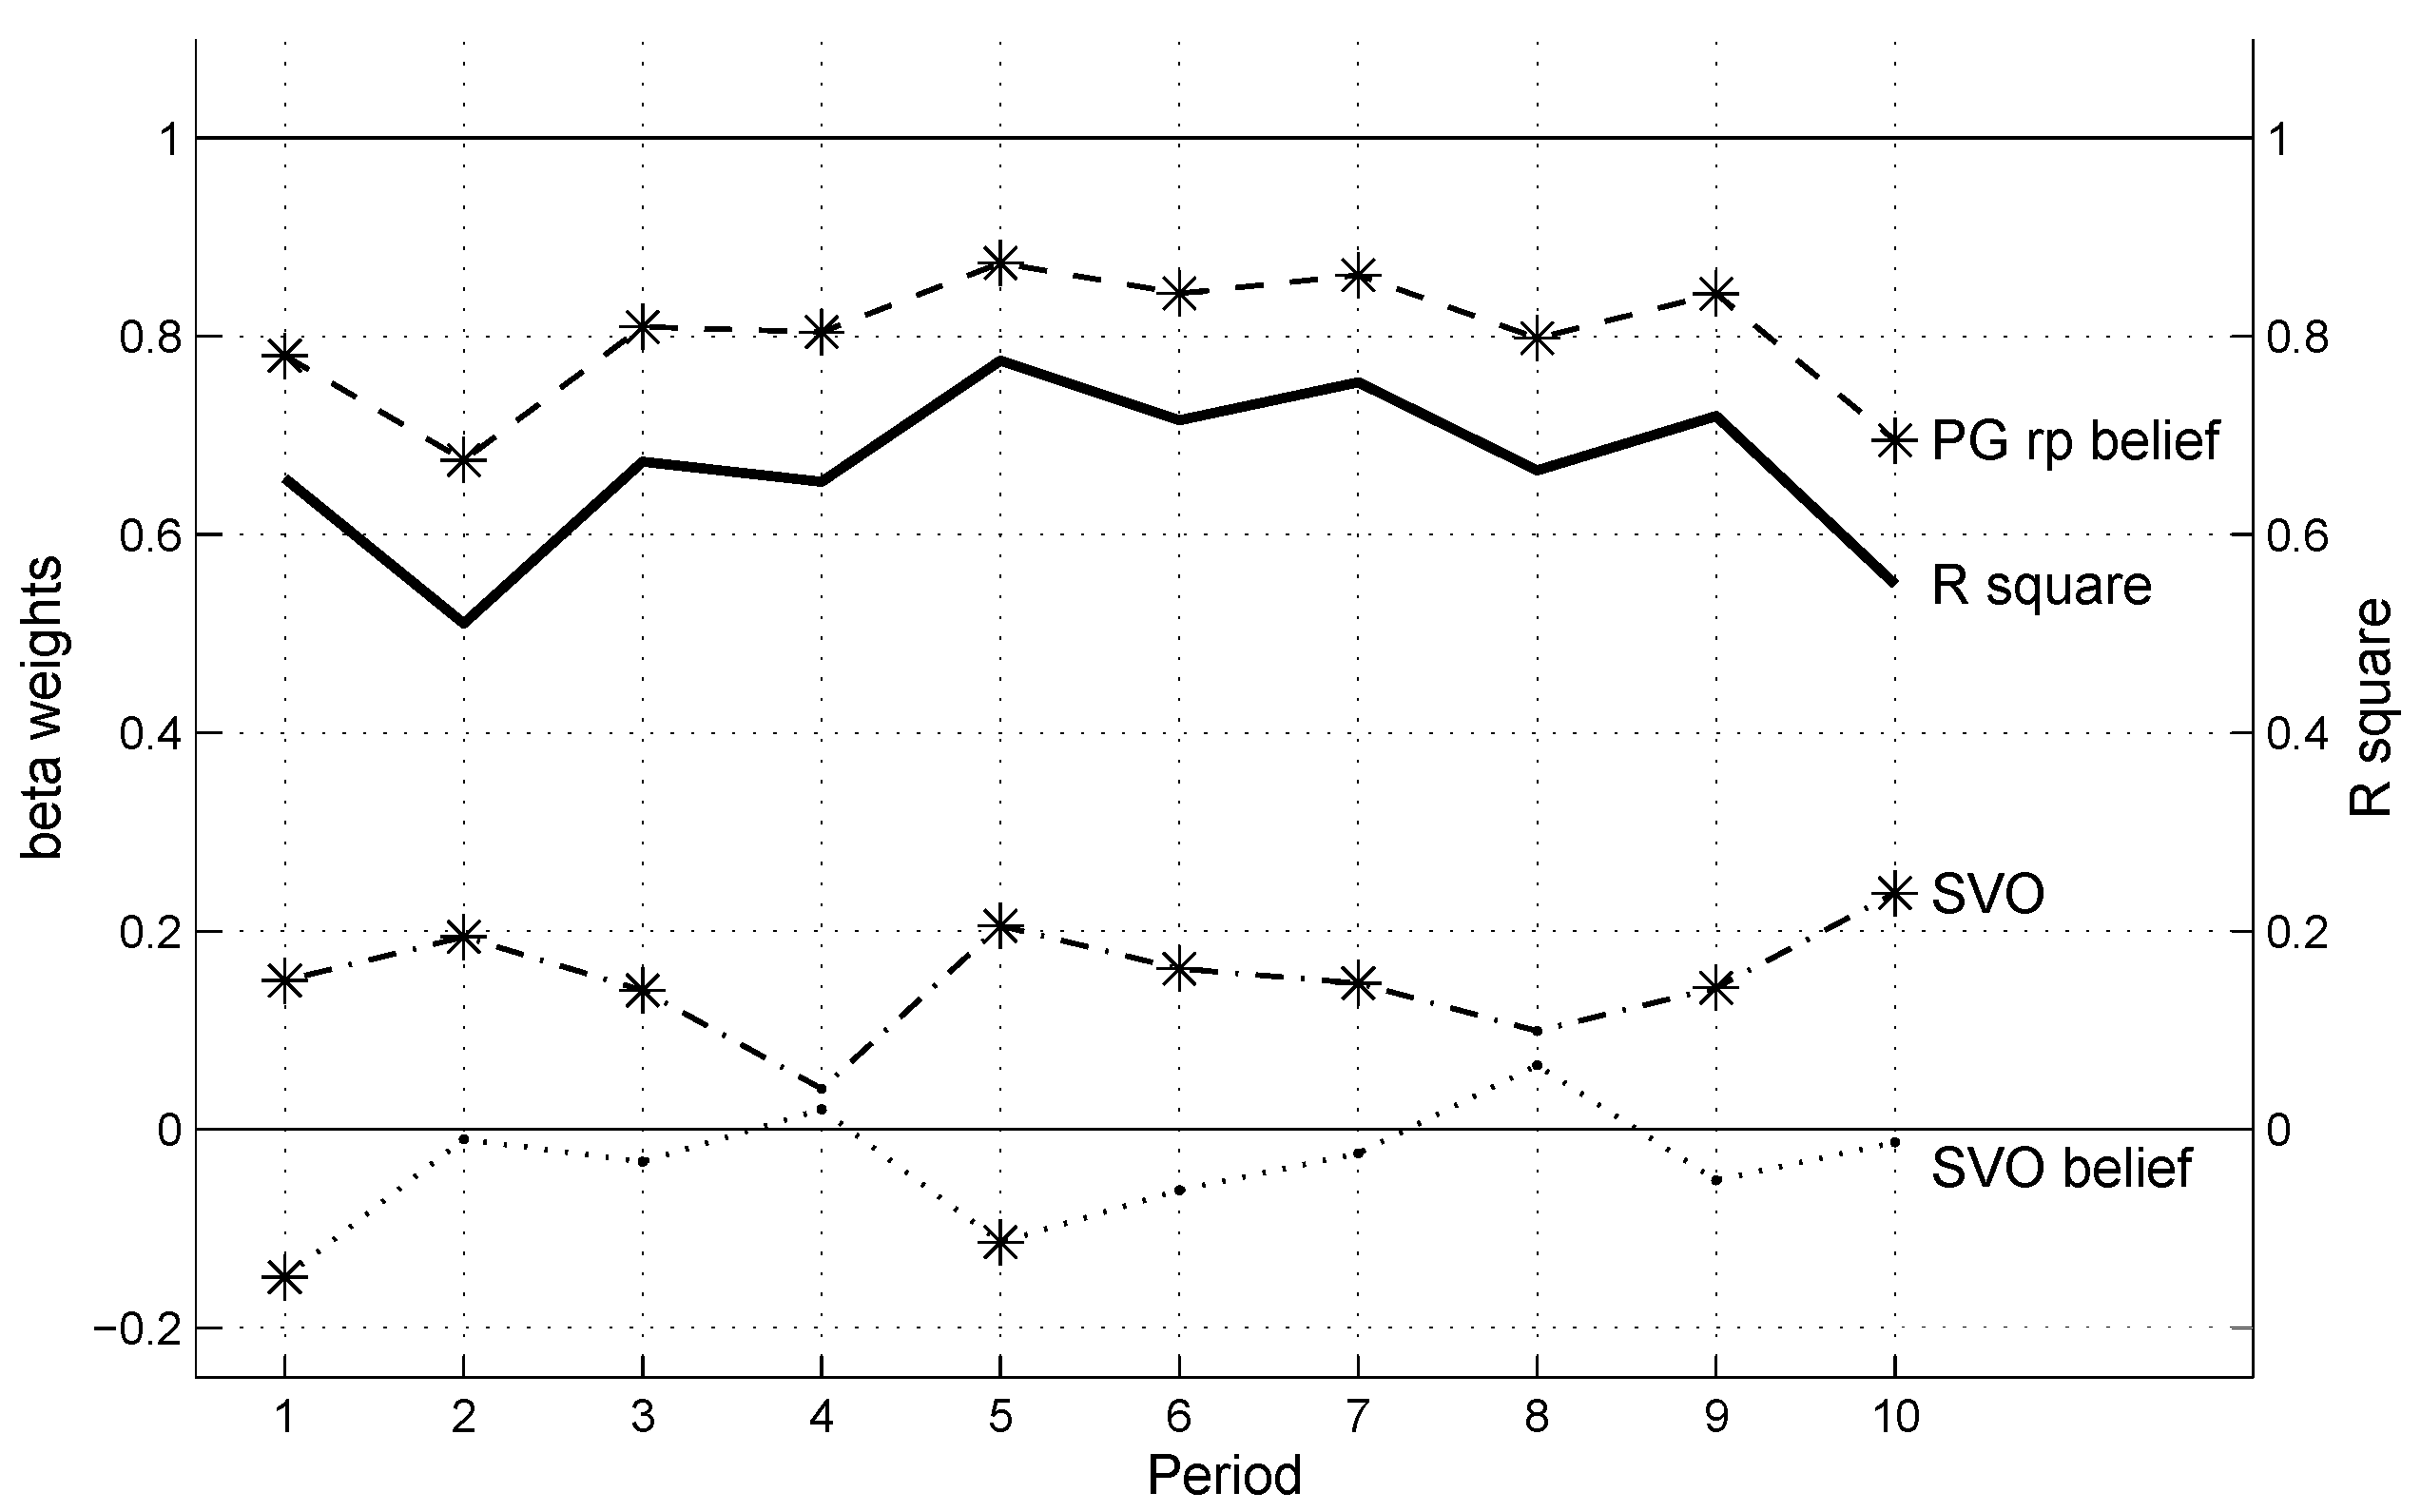
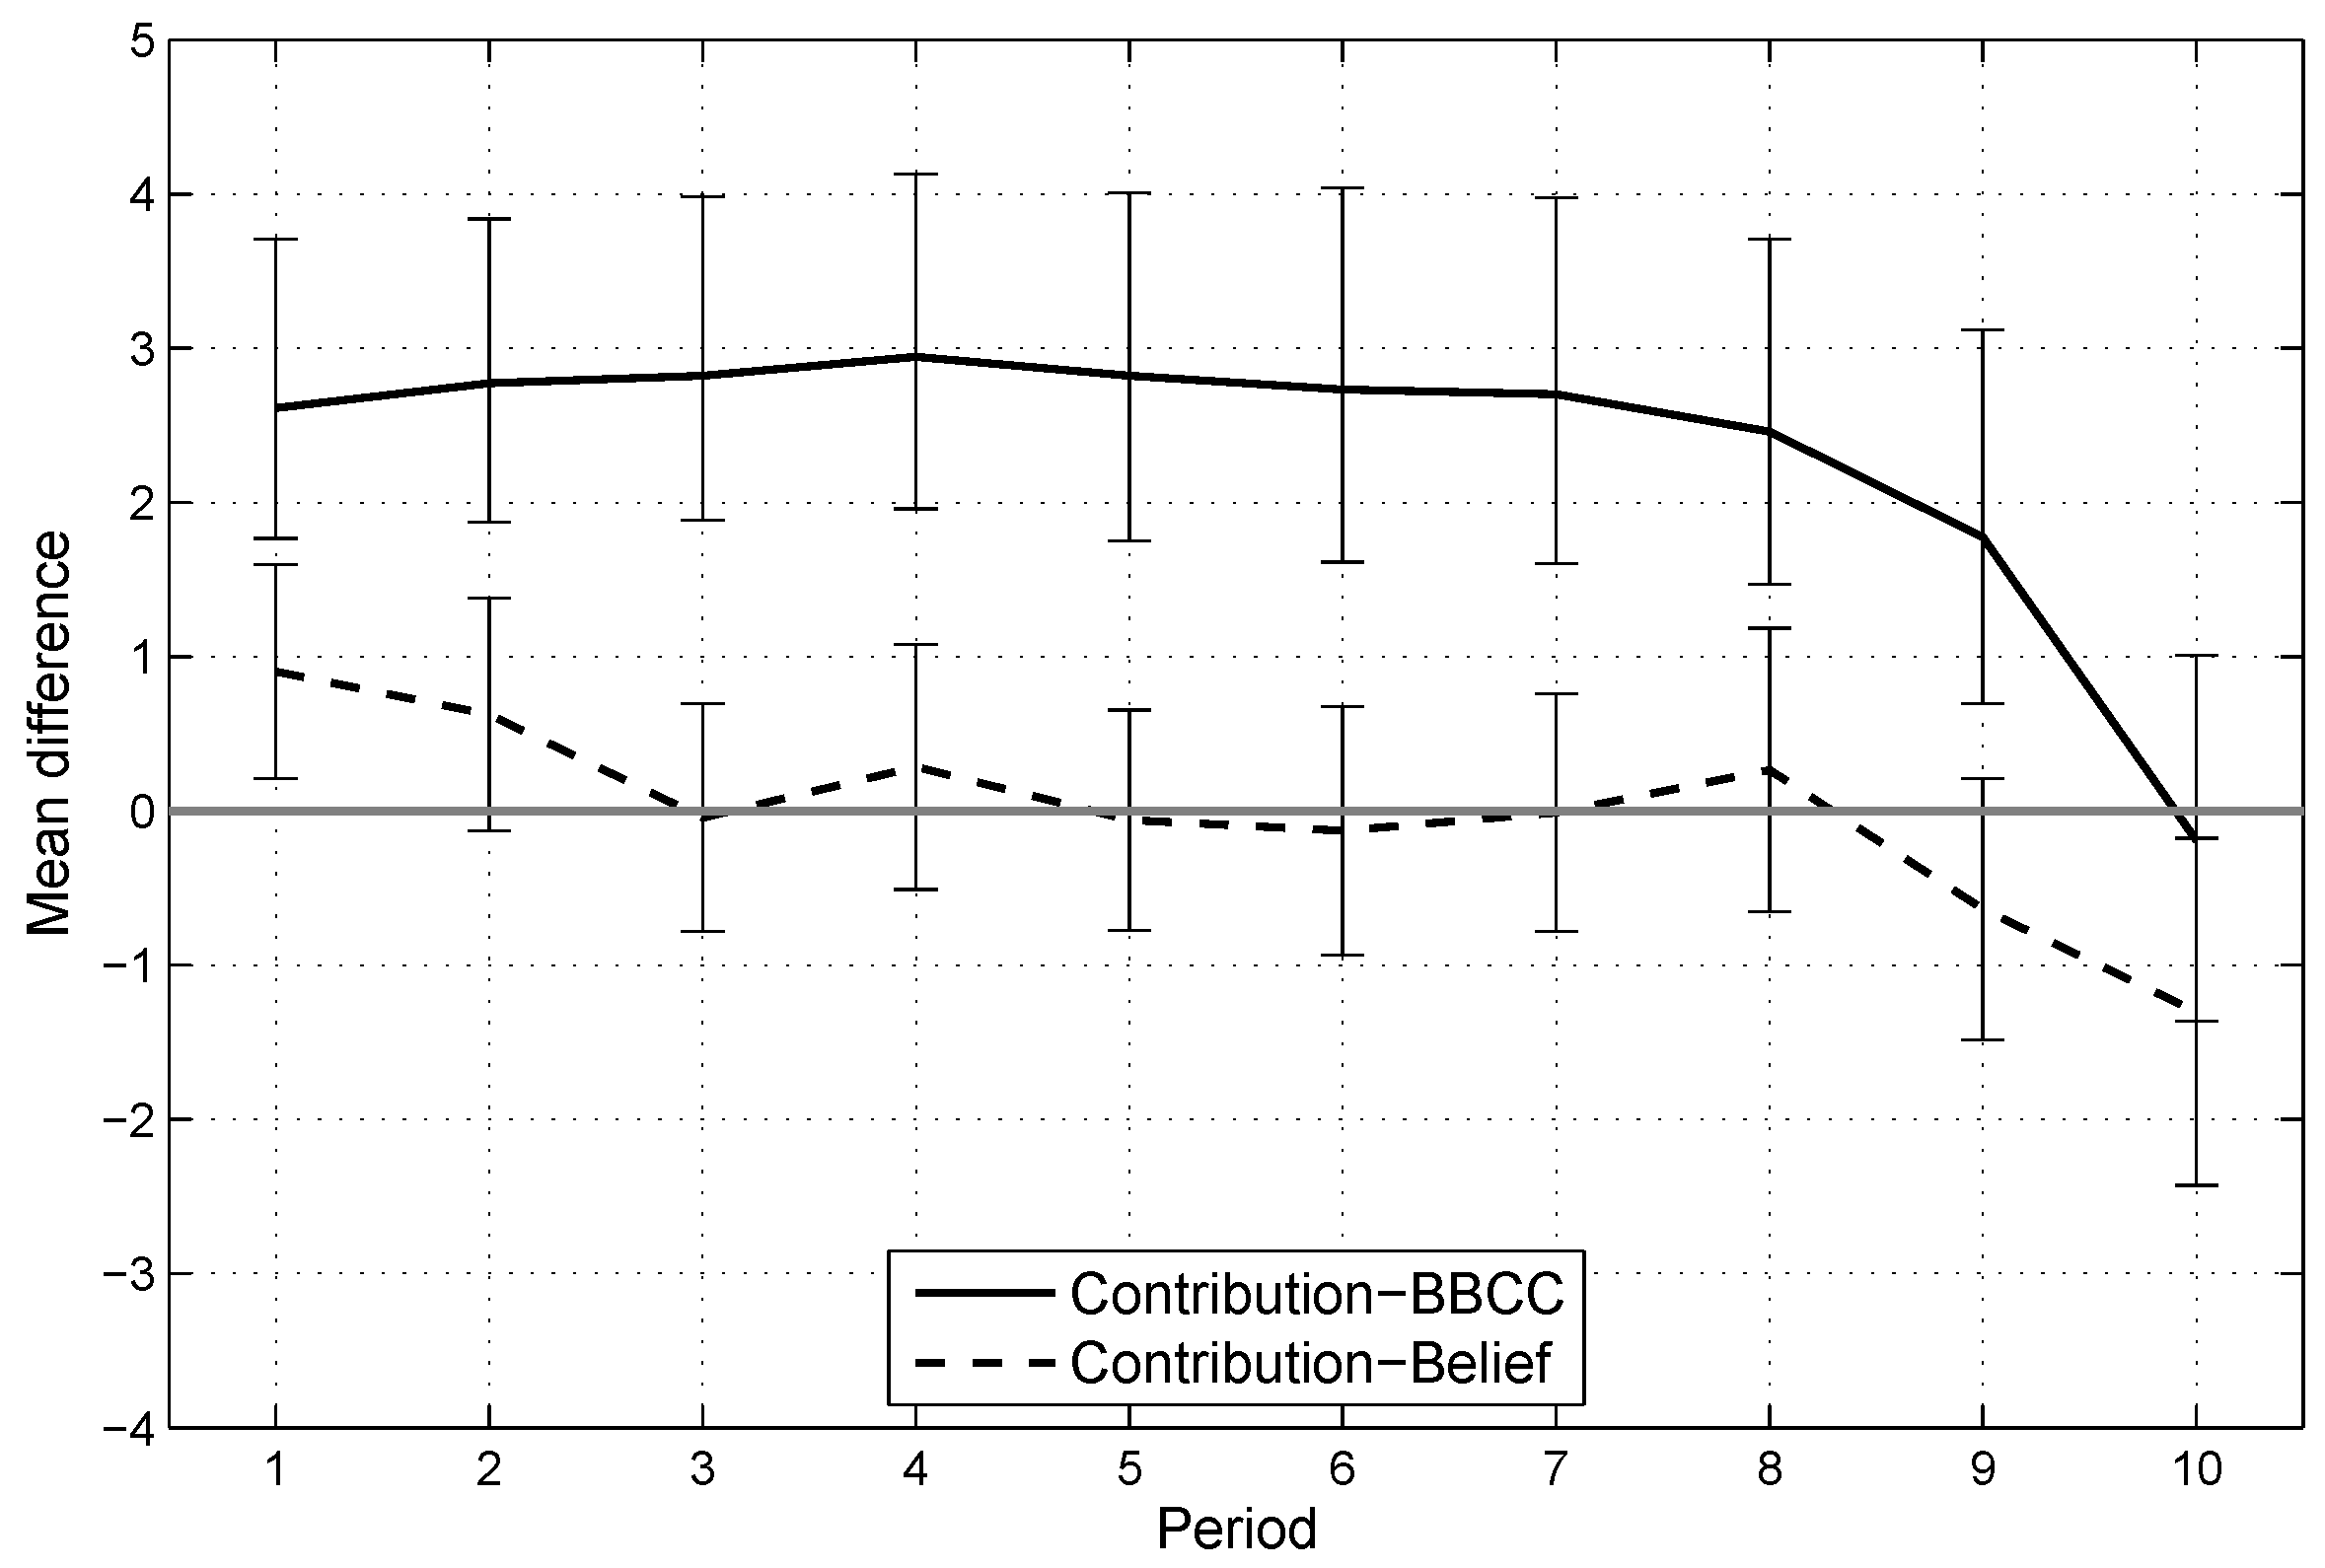
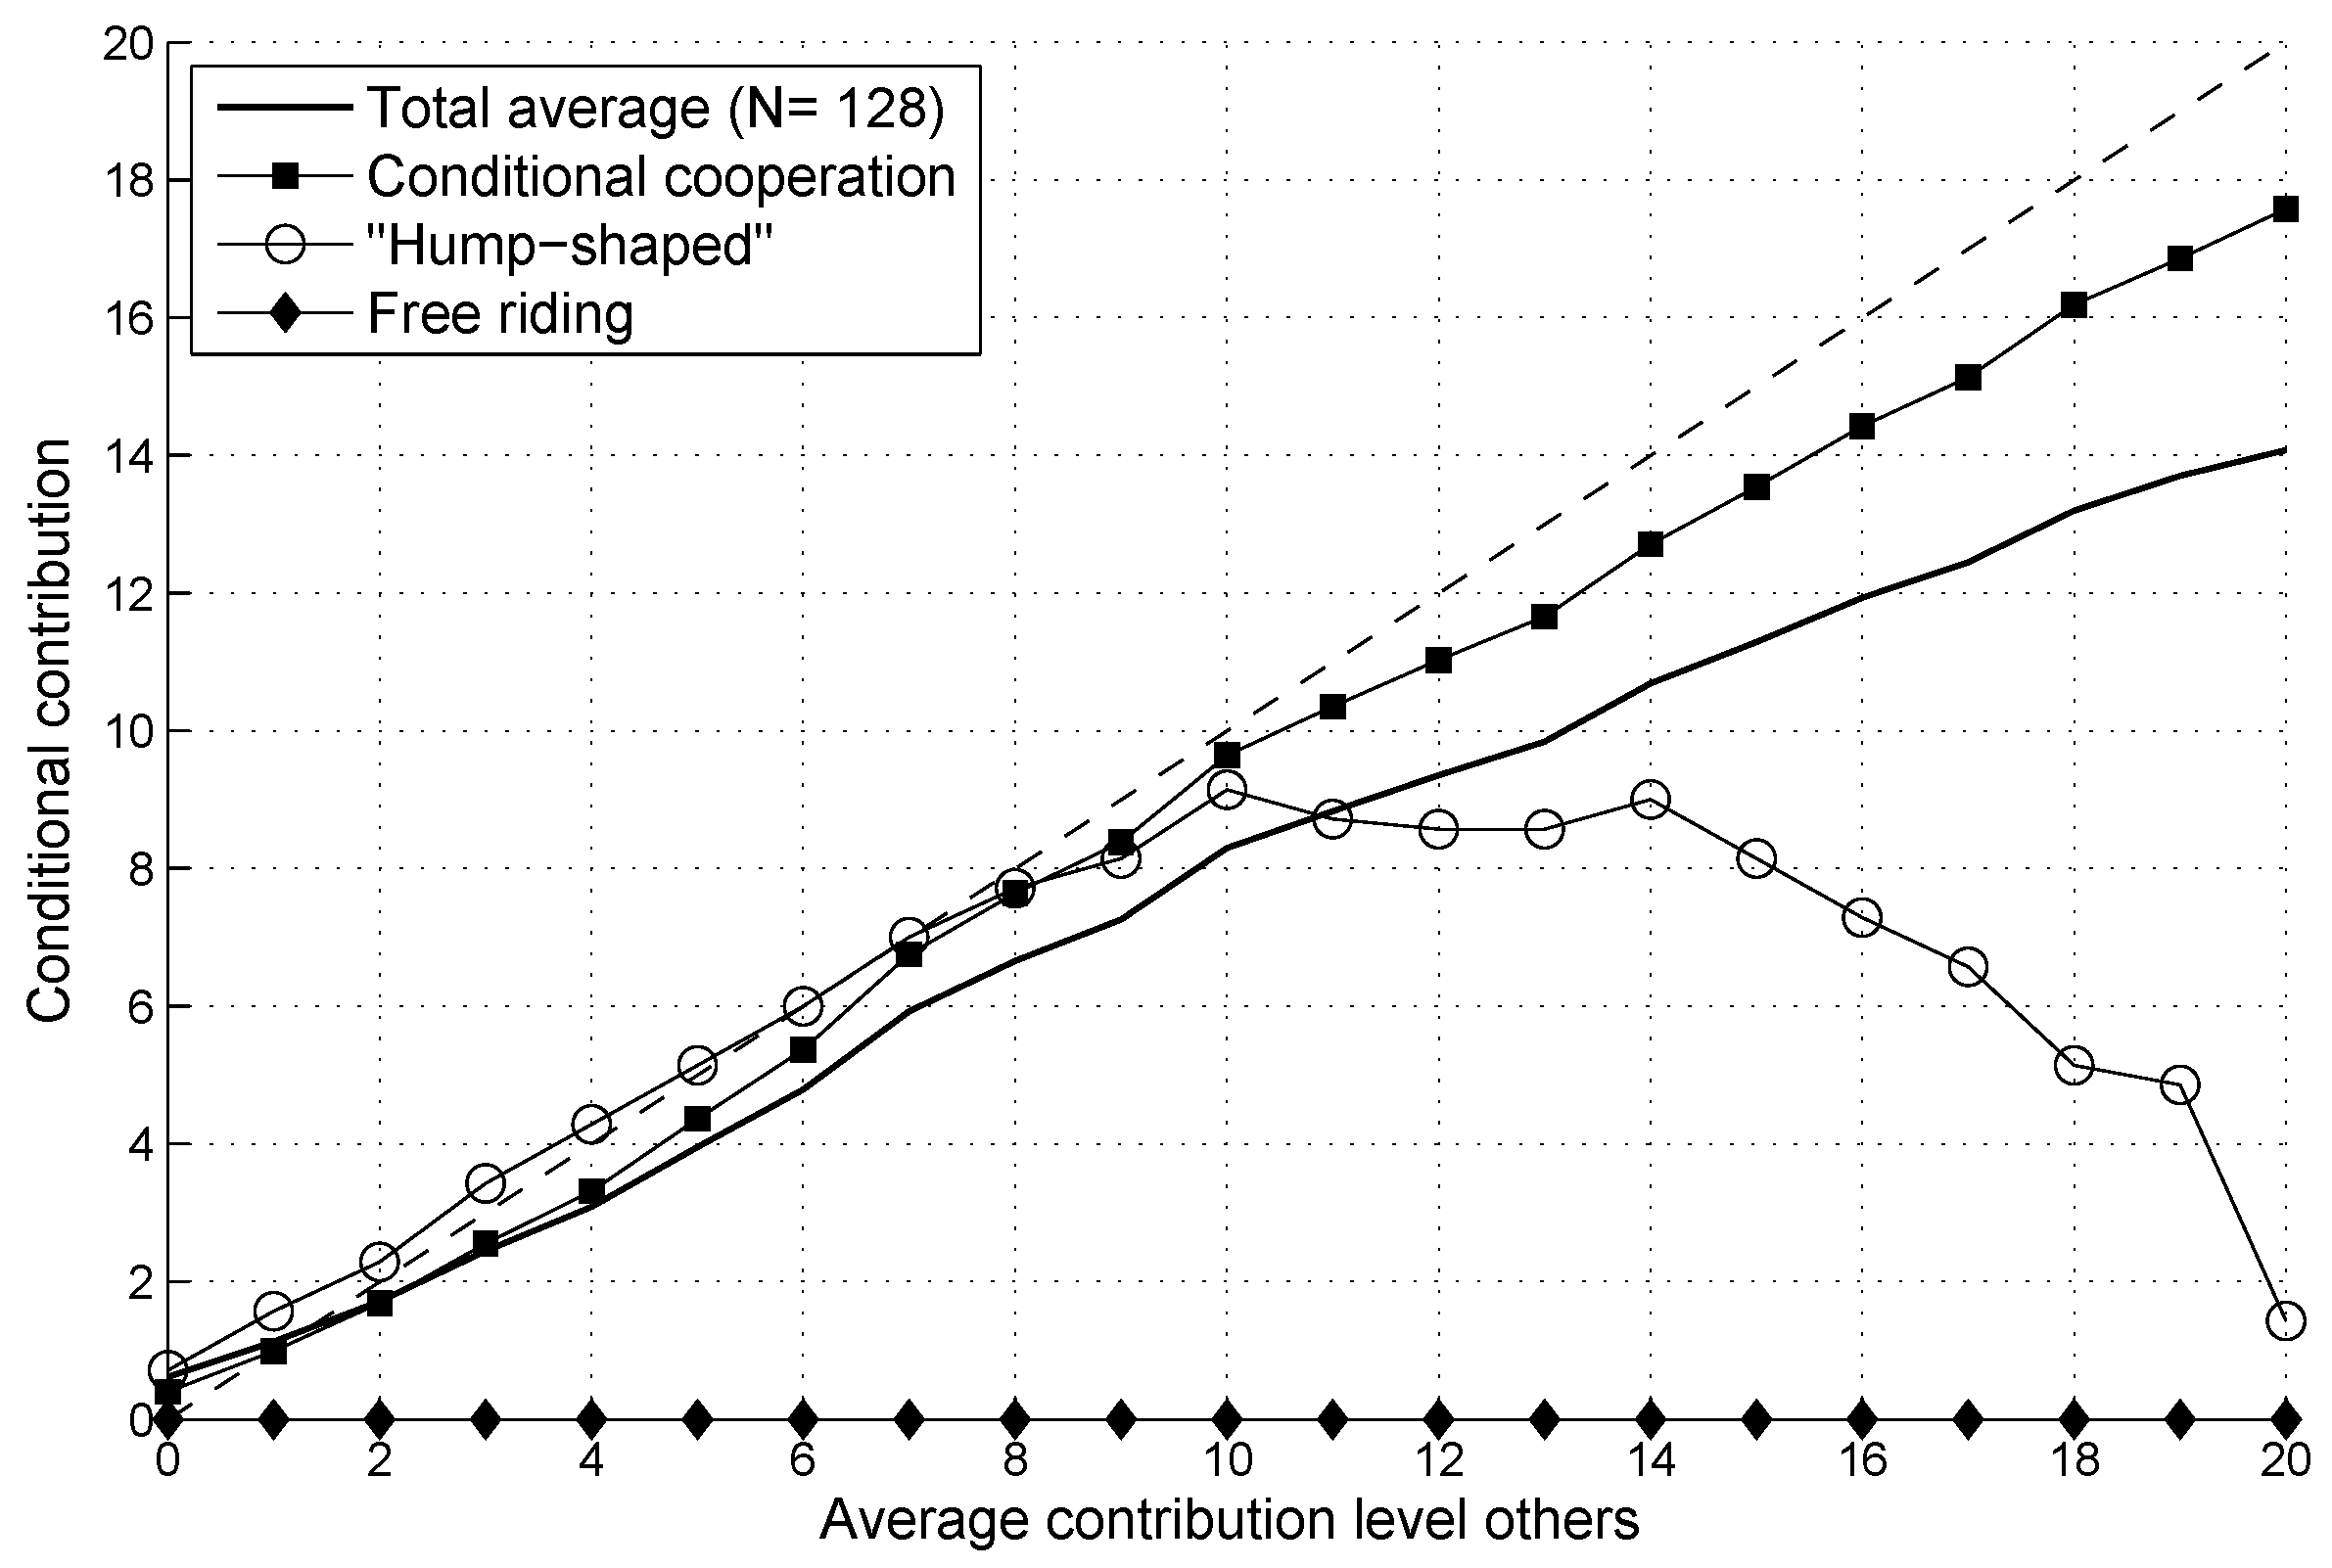
Table A1.
Bivariate correlations among preferences, beliefs, and behavior in the repeated PGG.
| PG1 | PG2 | PG3 | PG4 | PG5 | PG6 | PG7 | PG8 | PG9 | PG10 | BBCC1 | BBCC2 | BBCC3 | BBCC4 | BBCC5 | BBCC6 | BBCC7 | BBCC8 | BBCC9 | BBCC10 | PGb1 | PGb2 | PGb3 | PGb4 | PGb5 | PGb6 | PGb7 | PGb8 | PGb9 | PGb10 | CCA | SVOt1 | SVOt2 | SVOb | |
|---|---|---|---|---|---|---|---|---|---|---|---|---|---|---|---|---|---|---|---|---|---|---|---|---|---|---|---|---|---|---|---|---|---|---|
| PG1 | - | |||||||||||||||||||||||||||||||||
| PG2 | 0.74 | - | ||||||||||||||||||||||||||||||||
| PG3 | 0.52 | 0.74 | - | |||||||||||||||||||||||||||||||
| PG4 | 0.41 | 0.72 | 0.77 | - | ||||||||||||||||||||||||||||||
| PG5 | 0.34 | 0.59 | 0.72 | 0.83 | - | |||||||||||||||||||||||||||||
| PG6 | 0.35 | 0.68 | 0.73 | 0.83 | 0.85 | - | ||||||||||||||||||||||||||||
| PG7 | 0.33 | 0.56 | 0.75 | 0.78 | 0.76 | 0.86 | - | |||||||||||||||||||||||||||
| PG8 | 0.29 | 0.52 | 0.70 | 0.74 | 0.78 | 0.81 | 0.88 | - | ||||||||||||||||||||||||||
| PG9 | 0.32 | 0.54 | 0.71 | 0.74 | 0.74 | 0.80 | 0.86 | 0.84 | - | |||||||||||||||||||||||||
| PG10 | 0.15 | 0.31 | 0.44 | 0.52 | 0.58 | 0.56 | 0.60 | 0.63 | 0.67 | - | ||||||||||||||||||||||||
| BBCC1 | 0.64 | 0.50 | 0.39 | 0.31 | 0.30 | 0.30 | 0.28 | 0.28 | 0.32 | 0.32 | - | |||||||||||||||||||||||
| BBCC2 | 0.43 | 0.57 | 0.57 | 0.47 | 0.49 | 0.46 | 0.45 | 0.49 | 0.46 | 0.45 | 0.76 | - | ||||||||||||||||||||||
| BBCC3 | 0.33 | 0.50 | 0.63 | 0.55 | 0.56 | 0.53 | 0.52 | 0.56 | 0.51 | 0.46 | 0.64 | 0.88 | - | |||||||||||||||||||||
| BBCC4 | 0.32 | 0.49 | 0.60 | 0.66 | 0.67 | 0.62 | 0.62 | 0.65 | 0.62 | 0.53 | 0.57 | 0.78 | 0.90 | - | ||||||||||||||||||||
| BBCC5 | 0.31 | 0.45 | 0.59 | 0.64 | 0.68 | 0.61 | 0.62 | 0.65 | 0.60 | 0.52 | 0.54 | 0.76 | 0.89 | 0.96 | - | |||||||||||||||||||
| BBCC6 | 0.29 | 0.46 | 0.59 | 0.64 | 0.66 | 0.64 | 0.64 | 0.66 | 0.61 | 0.52 | 0.53 | 0.75 | 0.87 | 0.95 | 0.97 | - | ||||||||||||||||||
| BBCC7 | 0.27 | 0.42 | 0.56 | 0.59 | 0.64 | 0.62 | 0.67 | 0.69 | 0.61 | 0.52 | 0.50 | 0.74 | 0.85 | 0.92 | 0.95 | 0.96 | - | |||||||||||||||||
| BBCC8 | 0.30 | 0.48 | 0.59 | 0.65 | 0.69 | 0.66 | 0.69 | 0.72 | 0.66 | 0.58 | 0.55 | 0.76 | 0.82 | 0.91 | 0.92 | 0.94 | 0.95 | - | ||||||||||||||||
| BBCC9 | 0.31 | 0.48 | 0.59 | 0.65 | 0.68 | 0.64 | 0.67 | 0.70 | 0.68 | 0.58 | 0.57 | 0.76 | 0.81 | 0.91 | 0.92 | 0.93 | 0.93 | 0.98 | - | |||||||||||||||
| BBCC10 | 0.24 | 0.43 | 0.55 | 0.59 | 0.63 | 0.61 | 0.62 | 0.64 | 0.64 | 0.67 | 0.54 | 0.69 | 0.74 | 0.82 | 0.81 | 0.83 | 0.82 | 0.88 | 0.89 | - | ||||||||||||||
| PGb1 | 0.80 | 0.51 | 0.30 | 0.21 | 0.18 | 0.21 | 0.22 | 0.23 | 0.19 | 0.11 | 0.65 | 0.31 | 0.19 | 0.20 | 0.19 | 0.19 | 0.18 | 0.23 | 0.24 | 0.19 | - | |||||||||||||
| PGb2 | 0.46 | 0.69 | 0.60 | 0.54 | 0.49 | 0.51 | 0.50 | 0.47 | 0.43 | 0.29 | 0.36 | 0.63 | 0.53 | 0.51 | 0.51 | 0.49 | 0.51 | 0.53 | 0.52 | 0.46 | 0.40 | - | ||||||||||||
| PGb3 | 0.32 | 0.57 | 0.81 | 0.66 | 0.65 | 0.66 | 0.71 | 0.67 | 0.63 | 0.47 | 0.24 | 0.51 | 0.64 | 0.61 | 0.60 | 0.60 | 0.62 | 0.62 | 0.59 | 0.57 | 0.16 | 0.69 | - | |||||||||||
| PGb4 | 0.29 | 0.56 | 0.75 | 0.81 | 0.80 | 0.78 | 0.79 | 0.77 | 0.74 | 0.56 | 0.30 | 0.54 | 0.65 | 0.78 | 0.75 | 0.74 | 0.73 | 0.75 | 0.74 | 0.69 | 0.18 | 0.64 | 0.85 | - | ||||||||||
| PGb5 | 0.27 | 0.53 | 0.71 | 0.80 | 0.87 | 0.81 | 0.78 | 0.78 | 0.74 | 0.52 | 0.21 | 0.46 | 0.56 | 0.68 | 0.70 | 0.68 | 0.68 | 0.68 | 0.67 | 0.62 | 0.15 | 0.56 | 0.73 | 0.90 | - | |||||||||
| PGb6 | 0.23 | 0.49 | 0.70 | 0.77 | 0.84 | 0.84 | 0.82 | 0.80 | 0.76 | 0.56 | 0.20 | 0.42 | 0.53 | 0.65 | 0.66 | 0.71 | 0.68 | 0.68 | 0.67 | 0.63 | 0.13 | 0.48 | 0.71 | 0.87 | 0.94 | - | ||||||||
| PGb7 | 0.23 | 0.45 | 0.65 | 0.71 | 0.79 | 0.79 | 0.86 | 0.80 | 0.75 | 0.53 | 0.20 | 0.44 | 0.54 | 0.65 | 0.67 | 0.68 | 0.74 | 0.72 | 0.68 | 0.65 | 0.10 | 0.49 | 0.72 | 0.83 | 0.90 | 0.92 | - | |||||||
| PGb8 | 0.24 | 0.48 | 0.65 | 0.75 | 0.83 | 0.80 | 0.83 | 0.80 | 0.78 | 0.55 | 0.26 | 0.47 | 0.56 | 0.66 | 0.67 | 0.69 | 0.72 | 0.76 | 0.72 | 0.67 | 0.12 | 0.48 | 0.68 | 0.83 | 0.90 | 0.91 | 0.96 | - | ||||||
| PGb9 | 0.24 | 0.49 | 0.67 | 0.75 | 0.80 | 0.80 | 0.85 | 0.83 | 0.84 | 0.59 | 0.24 | 0.45 | 0.52 | 0.65 | 0.65 | 0.67 | 0.69 | 0.72 | 0.74 | 0.68 | 0.13 | 0.47 | 0.67 | 0.83 | 0.89 | 0.91 | 0.93 | 0.95 | - | |||||
| PGb10 | 0.15 | 0.38 | 0.53 | 0.61 | 0.69 | 0.66 | 0.68 | 0.68 | 0.70 | 0.70 | 0.36 | 0.52 | 0.58 | 0.68 | 0.68 | 0.70 | 0.71 | 0.76 | 0.76 | 0.86 | 0.08 | 0.39 | 0.58 | 0.72 | 0.75 | 0.77 | 0.79 | 0.83 | 0.83 | - | ||||
| CCA | 0.32 | 0.35 | 0.33 | 0.32 | 0.33 | 0.30 | 0.25 | 0.30 | 0.28 | 0.31 | 0.77 | 0.79 | 0.79 | 0.71 | 0.69 | 0.67 | 0.63 | 0.62 | 0.63 | 0.61 | 0.21 | 0.24 | 0.23 | 0.31 | 0.22 | 0.21 | 0.21 | 0.25 | 0.21 | 0.37 | - | |||
| SVOt1 | 0.30 | 0.24 | 0.14 | 0.08 | 0.12 | 0.09 | 0.11 | 0.14 | 0.11 | 0.26 | 0.34 | 0.25 | 0.22 | 0.16 | 0.16 | 0.13 | 0.14 | 0.15 | 0.14 | 0.13 | 0.32 | 0.07 | 0.02 | 0.03 | −0.02 | −0.04 | −0.02 | 0.00 | −0.00 | 0.04 | 0.30 | - | ||
| SVOt2 | 0.26 | 0.32 | 0.31 | 0.35 | 0.32 | 0.31 | 0.33 | 0.32 | 0.35 | 0.40 | 0.36 | 0.38 | 0.40 | 0.38 | 0.34 | 0.33 | 0.33 | 0.33 | 0.32 | 0.29 | 0.19 | 0.18 | 0.22 | 0.27 | 0.22 | 0.22 | 0.24 | 0.28 | 0.25 | 0.26 | 0.36 | 0.72 | - | |
| SVOb | 0.09 | 0.15 | 0.09 | 0.08 | 0.05 | 0.05 | 0.09 | 0.17 | 0.08 | 0.17 | 0.18 | 0.18 | 0.16 | 0.09 | 0.08 | 0.07 | 0.09 | 0.08 | 0.08 | 0.06 | 0.19 | 0.05 | 0.04 | 0.04 | 0.04 | 0.01 | 0.02 | 0.05 | 0.05 | 0.05 | 0.15 | 0.63 | 0.55 | - |
Note: Levels of significance are indicated by font, which is bold at the level, bold and italicized at the level, and italicized at the level. PGn = PG contribution in period n; BBCCn = BBCC in period n; PGbn = Belief about the average contribution of others in period n; CCA = Conditional cooperation area; SVOtn = SVO at time n, SVOb = SVO belief.
References
- Camerer, C.F. Behavioral Game Theory: Experiments in Strategic Interaction; Princeton University Press: Princeton, NJ, USA, 2003. [Google Scholar]
- Camerer, C.F.; Fehr, E. When does “economic man” dominate social behavior? Science 2006, 311, 47–52. [Google Scholar] [CrossRef] [PubMed]
- Camerer, C.F.; Thaler, R.H. Anomalies: Ultimatums, dictators and manners. J. Econ. Perspect. 1995, 9, 209–219. [Google Scholar] [CrossRef]
- Andreoni, J.; Miller, J.H. Giving according to GARP: An experimental test of the consistency of preferences for altruism. Econometrica 2002, 70, 737–753. [Google Scholar] [CrossRef]
- Fisman, R.; Kariv, S.; Markovits, D. Individual preferences for giving. Am. Econ. Rev. 2007, 97, 1858–1877. [Google Scholar] [CrossRef]
- Fischbacher, U.; Gächter, S. Social preferences, beliefs, and the dynamics of Free Riding in Public Goods experiments. Am. Econ. Rev. 2010, 100, 541–556. [Google Scholar] [CrossRef]
- Fischbacher, U.; Gächter, S.; Fehr, E. Are people conditionally cooperative? Evidence from a public goods experiment. Econ. Lett. 2001, 71, 397–404. [Google Scholar] [CrossRef] [Green Version]
- Dawes, R.M. Social dilemmas. Annu. Rev. Psychol. 1980, 31, 169–193. [Google Scholar] [CrossRef]
- Fehr, E.; Fischbacher, U. The nature of human altruism. Nature 2003, 425, 785–791. [Google Scholar] [CrossRef] [PubMed]
- Hamilton, W.D. The genetical evolution of social behavior. J. Theor. Biol. 1964, 7, 1–16. [Google Scholar] [CrossRef]
- Kollock, P. Social dilemmas: The anatomy of cooperation. Annu. Rev. Sociol. 1998, 24, 183–214. [Google Scholar] [CrossRef]
- Nowak, M.A. Five rules for the evolution of cooperation. Science 2006, 314, 1560–1563. [Google Scholar] [CrossRef] [PubMed]
- Ostrom, E. Collective action and the evolution of social norms. J. Econ. Perspect. 2000, 14, 137–158. [Google Scholar] [CrossRef]
- Sell, A.; Tooby, J.; Cosmides, L.; Orians, G.H. Formidability and the logic of human anger. Proc. Natl. Acad. Sci. USA 2009, 106, 15073–15078. [Google Scholar] [CrossRef] [PubMed] [Green Version]
- Tricomi, E.; Rangel, A.; Camerer, C.F.; O’Doherty, J.P. Neural evidence for inequality-averse social preferences. Nature 2010, 463, 1089–1091. [Google Scholar] [CrossRef] [PubMed]
- Fehr, E.; Gächter, S. Cooperation and punishment in public goods experiments. Am. Econ. Rev. 2000, 90, 980–994. [Google Scholar] [CrossRef]
- Frey, B.; Meier, S. Social comparisons and pro-social behavior: Testing “conditional cooperation” in a field experiment. Am. Econ. Rev. 2004, 94, 1717–1722. [Google Scholar] [CrossRef]
- Gächter, S.; Herrmann, B. Reciprocity, culture and human cooperation: Previous insights and a new cross-cultural experiment. Philos. Trans. R. Soc. B Biol. Sci. 2009, 364, 791–806. [Google Scholar] [CrossRef] [PubMed]
- Bolton, G.E.; Ockenfels, A. ERC: A theory of equity, reciprocity, and competition. Am. Econ. Rev. 2000, 90, 166–193. [Google Scholar] [CrossRef]
- Charness, G.; Rabin, M. Understanding Social Preferences with Simple Tests. Q. J. Econ. 2002, 117, 817–869. [Google Scholar] [CrossRef] [Green Version]
- Dufwenberg, M.; Kirchsteiger, G. A theory of sequential reciprocity. Games Econ. Behav. 2004, 47, 268–298. [Google Scholar] [CrossRef] [Green Version]
- Falk, A.; Fischbacher, U. A theory of reciprocity. Games Econ. Behav. 2006, 54, 293–315. [Google Scholar] [CrossRef]
- Fehr, E.; Schmidt, K.M. A theory of fairness, competition, and cooperation. Q. J. Econ. 1999, 114, 817–868. [Google Scholar] [CrossRef]
- Geanakoplos, J.; Pearce, D.; Stacchetti, E. Psychological games and sequential rationality. Games Econ. Behav. 1989, 1, 60–79. [Google Scholar] [CrossRef]
- Levine, D.K. Modeling altruism and spitefulness in experiments. Rev. Econ. Dyn. 1998, 1, 593–622. [Google Scholar] [CrossRef]
- Rabin, M. Incorporating fairness into game-theory and economics. Am. Econ. Rev. 1993, 83, 1281–1302. [Google Scholar]
- Cox, J.; Friedman, D.; Gjerstad, S. A tractable model of reciprocity and fairness. Games Econ. Behav. 2007, 59, 17–45. [Google Scholar] [CrossRef] [Green Version]
- Luce, R.D.; Raiffa, H. Games and Decisions. Introduction and Critical Survey; Wiley: New York, NY, USA, 1957. [Google Scholar]
- Andreoni, J.; Miller, J.H. Rational cooperation in the finitely repeated Prisoner’s Dilemma: Experimental evidence. Econ. J. 1993, 103, 570–585. [Google Scholar] [CrossRef]
- Cooper, R.; De Jong, D.V.; Forsythe, R.; Ross, T.W. Cooperation without reputation: Experimental evidence from prisoner’s dilemma games. Games Econ. Behav. 1996, 12, 187–218. [Google Scholar] [CrossRef]
- Rapoport, A.; Dale, P.S. The “end” and “start” effects in iterated Prisoner’s Dilemma. J. Confl. Resolut. 1966, 10, 363–366. [Google Scholar] [CrossRef]
- Ledyard, J. Public goods: A survey of experimental research. In Handbook of Experimental Economics; Kagel, J., Roth, A., Eds.; Princeton University Press: Princeton, NJ, USA, 1995. [Google Scholar]
- Rapoport, A. A note on index of cooperation for prisoners dilemma. J. Confl. Resolut. 1967, 11, 100–103. [Google Scholar] [CrossRef]
- Stivers, A.W.; Murphy, R.O.; Kuhlman, D.M. A Taxonomy of Prisoner’s Dilemma Indexes. In Working Paper; College of Arts & Sciences, Gonzaga University: Spokane, WA, USA, 2019. [Google Scholar]
- Isaac, R.M.; Walker, J.; Thomas, S. Divergent evidence on free riding: An experimental examination of possible explanations. Public Choice 1984, 43, 113–149. [Google Scholar] [CrossRef]
- Murphy, R.O.; Ackermann, K.A. Social preferences, positive expectations, and trust based cooperation. J. Math. Psychol. 2015, 67, 45–50. [Google Scholar] [CrossRef]
- Moisan, F.; ten Brincke, R.; Murphy, R.O.; Gonzalez, C. Not All Prisoner’s Dilemma Games Are Equal: Incentives, Social Preferences, and Cooperation. Decision 2018, 5, 306–322. [Google Scholar] [CrossRef]
- Axelrod, R.; Hamilton, W.D. The evolution of cooperation. Science 1981, 211, 1390–1396. [Google Scholar] [CrossRef] [PubMed]
- Santos, F.C.; Santos, M.D.; Pacheco, J.M. Social diversity promotes the emergence of cooperation in public goods games. Nature 2008, 454, 213. [Google Scholar] [CrossRef] [PubMed]
- Javarone, M.A.; Atzeni, A.E. The role of competitiveness in the Prisoner’s Dilemma. Comput. Soc. Netw. 2015, 2, 15. [Google Scholar] [CrossRef]
- Javarone, M.A.; Antonioni, A.; Caravelli, F. Conformity-driven agents support ordered phases in the spatial public goods game. EPL (Europhys. Lett.) 2016, 114, 38001. [Google Scholar] [CrossRef] [Green Version]
- Murphy, R.O.; Ackermann, K.A. Social value orientation: Theoretical and measurement issues in the study of social preferences. Pers. Soc. Psychol. Rev. 2014, 18, 13–41. [Google Scholar] [CrossRef] [PubMed]
- Blanco, M.; Engelmann, D.; Normann, H.T. A within-subject analysis of other-regarding preferences. Games Econ. Behav. 2011, 72, 321–338. [Google Scholar] [CrossRef] [Green Version]
- Engelmann, D.; Strobel, M. Inequality aversion, efficiency, and maximin preferences in simple distribution experiments. Am. Econ. Rev. 2004, 94, 857–869. [Google Scholar] [CrossRef]
- Erlei, M. Heterogeneous social preferences. J. Econ. Behav. Organ. 2008, 65, 436–457. [Google Scholar] [CrossRef] [Green Version]
- Kohler, S. Altruism and fairness in experimental decisions. J. Econ. Behav. Organ. 2011, 80, 101–109. [Google Scholar] [CrossRef]
- Ones, U.; Putterman, L. The ecology of collective action: A public goods and sanctions experiment with controlled group formation. J. Econ. Behav. Organ. 2007, 62, 495–521. [Google Scholar] [CrossRef] [Green Version]
- Burlando, R.M.; Guala, F. Heterogeneous agents in public goods experiments. Exp. Econ. 2005, 8, 35–54. [Google Scholar] [CrossRef]
- Offerman, T.; Sonnemans, J.; Schram, A. Value orientations, expectations, and voluntary contributions in public goods. Econ. J. 1996, 106, 817–845. [Google Scholar] [CrossRef]
- Van Winden, F.; Van Dijk, F.; Sonnemans, J. Intrinsic motivation in a public good environment. In Handbook of Experimental Economics Results; Plott, C., Smith, V., Eds.; North-Holland: Amsterdam, The Netherlands, 2008; Volume 1. [Google Scholar]
- Fehr, E.; Williams, T. Social norms, endogenous sorting and the culture of cooperation. In Working Paper; Department of Economics, University of Zurich: Zurich, Switzerland, 2018. [Google Scholar]
- Murphy, R.O.; Ackermann, K.A.; Handgraaf, M.J.J. Measuring social value orientation. Judg. Decis. Mak. 2011, 6, 771–781. [Google Scholar] [CrossRef]
- Balliet, D.; Parks, C.; Joireman, J. Social Value Orientation and Cooperation in Social Dilemmas: A Meta-Analysis. Group Process. Intergroup Relat. 2009, 12, 533–547. [Google Scholar] [CrossRef]
- Croson, R. Theories of commitment, altruism, and reciprocity: Evidence from linear public goods games. Econ. Inq. 2007, 45, 199–216. [Google Scholar] [CrossRef]
- Neugebauer, T.; Perote, J.; Schmidt, U.; Loos, M. Selfish-biased conditional cooperation: On the decline of contributions in repeated public goods experiments. J. Econ. Psychol. 2009, 30, 52–60. [Google Scholar] [CrossRef] [Green Version]
- Andreoni, J. Why free ride? J. Public Econ. 1988, 37, 291–304. [Google Scholar] [CrossRef]
- Andreoni, J. Cooperation in Public-Goods experiments: Kindness or confusion? Am. Econ. Rev. 1995, 85, 891–904. [Google Scholar]
- Burlando, R.M.; Hey, J.D. Do Anglo-Saxons free ride more? J. Public Econ. 1997, 64, 41–60. [Google Scholar] [CrossRef]
- Brandts, J.; Schram, A. Cooperation and noise in public goods experiments: Applying the contribution function approach. J. Public Econ. 2001, 79, 399–427. [Google Scholar] [CrossRef]
- Croson, R. Partners and strangers revisited. Econ. Lett. 1996, 53, 25–32. [Google Scholar] [CrossRef] [Green Version]
- Carpenter, J. Punishing free-riders: How group size affects mutual monitoring and the provision of public goods. Games Econ. Behav. 2007, 60, 31–51. [Google Scholar] [CrossRef] [Green Version]
- Isaac, R.M.; McCue, K.F.; Plott, C.R. Public goods provision in an experimental environment. J. Public Econ. 1985, 26, 51–74. [Google Scholar] [CrossRef] [Green Version]
- Isaac, R.M.; Walker, J.M. Group size effects in public goods provision: The voluntary contributions mechanism. Q. J. Econ. 1988, 103, 179–199. [Google Scholar] [CrossRef]
- Keser, C.; Van Winden, F. Conditional cooperation and voluntary contributions to public goods. Scand. J. Econ. 2000, 102, 23–39. [Google Scholar] [CrossRef]
- Kim, O.; Walker, M. The free rider problem: Experimental evidence. Public Choice 1984, 43, 3–24. [Google Scholar] [CrossRef]
- Laury, S.K.; Walker, J.M.; Williams, A.W. Anonymity and the voluntary provision of public goods. J. Econ. Behav. Organ. 1995, 27, 365–380. [Google Scholar] [CrossRef]
- Weimann, J. Individual behavior in a free riding experiment. J. Public Econ. 1994, 54, 185–200. [Google Scholar] [CrossRef]
- Selten, R. Die Strategiemethode zur Erforschung des eingeschränkten rationalen Verhaltens im Rahmen eines Oligopolexperimentes. In Beiträge zur Experimentellen Wirtschaftsforschung; Sauermann, H., Ed.; J.C.B. Mohr: Tübingen, Germany, 1967; pp. 136–168. [Google Scholar]
- Kachelmeier, S.T.; Shehata, M. Internal auditing and voluntary cooperation in firms: A cross-cultural experiment. Account. Rev. 1997, 72, 407–431. [Google Scholar]
- Andreoni, J. Impure altruism and donations to public goods: A theory of warm-glow giving. Econ. J. 1990, 100, 464–477. [Google Scholar] [CrossRef]
- Ashley, R.; Ball, S.; Eckel, C. Motives for giving: A reanalysis of two classic public goods experiments. South. Econ. J. 2010, 77, 15–26. [Google Scholar] [CrossRef]
- Palfrey, T.R.; Prisbrey, J.E. Anomalous behavior in Public Goods experiments: How much and why? Am. Econ. Rev. 1997, 87, 829–846. [Google Scholar]
- Bardsley, N.; Moffatt, P.G. The experimetrics of public goods: Inferring motivations from contributions. Theory Decis. 2007, 62, 161–193. [Google Scholar] [CrossRef]
- Goeree, J.K.; Holt, C.A.; Laury, S.K. Private costs and public benefits: Unraveling the effects of altruism and noisy behavior. J. Public Econ. 2002, 83, 255–276. [Google Scholar] [CrossRef]
- Stevens, S.S. On the theory of scales of measurement. Science 1946, 103, 677–680. [Google Scholar] [CrossRef] [PubMed]
- Gächter, S. Conditional cooperation. Behavioral regularities from the lab and the field and their policy implications. In Economics and Psychology. A Promising New Cross-Disciplinary Field; Frey, B., Stutzer, A., Eds.; MIT Press: Cambridge, MA, USA, 2007. [Google Scholar]
- Kurzban, R.; Houser, D. Experiments investigating cooperative types in humans: A complement to evolutionary theory and simulations. Proc. Natl. Acad. Sci. USA 2005, 102, 1803–1807. [Google Scholar] [CrossRef] [PubMed] [Green Version]
- Hermann, B.; Thöni, C. Measuring conditional cooperation: A replication study in Russia. Exp. Econ. 2009, 12, 87–92. [Google Scholar] [CrossRef]
- Kocher, M.G.; Cherry, T.; Kroll, S.; Netzer, R.J.; Sutter, M. Conditional cooperation on three continents. Econ. Lett. 2008, 101, 175–178. [Google Scholar] [CrossRef] [Green Version]
- Falk, A.; Fehr, E.; Fischbacher, U. Testing theories of fairness—Intentions matter. Games Econ. Behav. 2008, 62, 287–303. [Google Scholar] [CrossRef] [Green Version]
- Stanca, L.; Bruni, L.; Corazzini, L. Testing theories of reciprocity: Do motivations matter? J. Econ. Behav. Organ. 2009, 71, 233–245. [Google Scholar] [CrossRef] [Green Version]
- Ackermann, K.A.; Fleiß, J.; Murphy, R.O. Reciprocity as an individual difference. J. Confl. Resolut. 2016, 60, 340–367. [Google Scholar] [CrossRef]
- Nax, H.H.; Murphy, R.O.; Ackermann, K.A. Interactive preferences. Econ. Lett. 2015, 135, 133–136. [Google Scholar] [CrossRef] [Green Version]
- Nyarko, Y.; Schotter, A. An experimental study of belief learning using elicited beliefs. Econometrica 2002, 70, 971–1005. [Google Scholar] [CrossRef]
- Fischbacher, U. z-Tree: Zurich toolbox for ready-made economic experiments. Exp. Econ. 2007, 10, 171–178. [Google Scholar] [CrossRef] [Green Version]
- Crosetto, P.; Weisel, O.; Winter, F. A flexible z-Tree implementation of the Social Value Orientation Slider Measure (Murphy et al. 2011)—Manual. In Jena Economic Research Paper; Friedrich Schiller University and Max Planck Institute of Economics: Jena, Germany, 2012; Volume 62. [Google Scholar]
- Greiff, M.; Ackermann, K.; Murphy, R.O. Playing a Game or Making a Decision? Methodological Issues in the Measurement of Distributional Preferences. Games 2018, 9, 80. [Google Scholar] [CrossRef]
- Gunnthorsdottir, A.; McCabe, K.; Smith, V. Using the Machiavellianism instrument to predict trustworthiness in a bargaining game. J. Econ. Psychol. 2002, 23, 49–66. [Google Scholar] [CrossRef]
- Christie, R.; Geis, F.L. Studies in Machiavellianism; Academic Press: New York, NY, USA, 1970. [Google Scholar]
- Dalbert, C.; Montada, L.; Schmitt, M. Belief in a just world: Validity correlates of two scales. Psychol. Beiträge 1987, 29, 596–615. [Google Scholar]
- Perugini, M.; Gallucci, M.; Presaghi, F.; Ercolani, A.P. The personal norm of reciprocity. Eur. J. Pers. 2003, 17, 251–283. [Google Scholar] [CrossRef] [Green Version]
- Ross, L.; Greene, D.; House, P. The false consensus effect: An egocentric bias in social perception and attribution processes. J. Exp. Soc. Psychol. 1977, 13, 279–301. [Google Scholar] [CrossRef]
- Ebbinghaus, H. On Memory: A Contribution to Experimental Psychology; Teachers College: New York, NY, USA, 1913. [Google Scholar]
- Atkinson, R.C.; Shiffrin, R.M. Human memory: A proposed system and its control processes. In The Psychology of Learning and Motivation: Advances in Research And Theory; Spence, K., Spence, J., Eds.; Academic Press: New York, NY, USA, 1968; Volume 2, pp. 89–195. [Google Scholar]
- Axelrod, R. The Evolution of Cooperation; Basic Books: New York, NY, USA, 1984. [Google Scholar]
- Sonnemans, J.; van Dijk, F.; van Winden, F. On the dynamics of social ties structures in groups. J. Econ. Psychol. 2006, 27, 187–204. [Google Scholar] [CrossRef] [Green Version]
- Fleeson, W. Toward a structure-and process-integrated view of personality: Traits as density distributions of states. J. Pers. Soc. Psychol. 2001, 80, 1011. [Google Scholar] [CrossRef] [PubMed]
- Fleeson, W. Moving personality beyond the person-situation debate: The challenge and the opportunity of within-person variability. Curr. Direct. Psychol. Sci. 2004, 13, 83–87. [Google Scholar] [CrossRef]
- Nax, H.H.; Perc, M. Directional learning and the provisioning of public goods. Sci. Rep. 2015, 5, 8010. [Google Scholar] [CrossRef] [PubMed] [Green Version]
- Burton-Chellew, M.N.; Nax, H.H.; West, S.A. Payoff-based learning explains the decline in cooperation in public goods games. Proc. R. Soc. B Biol. Sci. 2015, 282, 20142678. [Google Scholar] [CrossRef] [PubMed]
- Nax, H.H.; Burton-Chellew, M.N.; West, S.A.; Young, H.P. Learning in a black box. J. Econ. Behav. Organ. 2016, 127, 1–15. [Google Scholar] [CrossRef] [Green Version]
| 1. | P, R, S, and T stand for Punishment payoff (resulting from mutual defection), Reward payoff (resulting from mutual cooperation), Sucker payoff (resulting from unilateral cooperation), and Temptation payoff (resulting from unilateral defection), respectively. |
| 2. | Offerman et al. ([49] , p. 818). explicitly point out the importance of an independent measure of social preferences for precisely the reasons brought out above. |
| 3. | Please note that this also means that free riders do not cause the decline of cooperation per se, but their presence does accelerate it. |
| 4. | For example, referring to phenomena observed in PGGs, Palfrey and Prisbrey [72], p. 843, wrote:
|
| 5. | SVO data collected in previous experiments served as the reference data for evaluating accuracy. |
| 6. | We did not mention the term “public goods game” in the instructions, but rather used the neutral term “task”. Also, we did not use the term “contribute”, but rather “transfer to the group account” to minimize potential demand effects. |
| 7. | When a participant answered a question incorrectly, a pop-up window appeared on that participant’s computer screen explaining the task once more and then giving the participant another opportunity to answer the question. An experimental session continued only if all participants had answered the questions correctly. |
| 8. | However, representing a contribution profile with a single number discards information, i.e., a subject’s CCA () is ambiguous. A CCA of 1, for instance, can result from perfect conditional cooperation, but may also be a result of a radically different contribution profile, such as contributing zero for average contributions of others between 0 and 9, matching an average contribution of 10 exactly, and contributing 20 for any average contribution of others strictly above 10. Hence, the CCA should be interpreted with some caution, but it is still a useful approximate representation of the subjects’ general tendencies to condition their own contributions on the average contribution of others. |
| 9. | If we add BCC in addition to CCA in model 2 of the regression, then BBCC takes over all of the variance explained by CCA, thereby rendering the relative effect of CCA non-significant. This is not surprising, since both variables are computed on the basis of the same data, namely subjects’ indications of contribution decisions in the strategy method, while BBCC—as it is informed by the subject’s elicited beliefs in the one-shot PGG—is by far a more specific indicator of behavior compared to the general CCA index. |
| 10. | An non-significant Kolmogorov-Smirnov test corroborates this null result. |
| 11. | Again, a non-significant Kolmogorov-Smirnov test also supports this conclusion. |
| 12. | The pattern of results does not change when the groups with subjects who showed intransitive choice patterns in the Slider Measure are excluded from the analyses. |
| 13. | The mean CCA per group is also quite predictive of a group’s average contribution in the final period, but the minimum CCA turns out to show more predictive power than the mean. |
| 14. | If the average contribution in period 9 is used as dependent variable, the two variables together explain almost half () of the variance. |
| 15. | Since average contributions in period 1 are used as predictor, we only use the average contributions across periods 2 to 10 as dependent variable in order to avoid artificial inflation of . |
| 16. | For this analysis, we included all the subjects. |
| 17. | For example, one subject indicated to unconditionally contribute the full endowment, and another subject to unconditionally contribute 10. |
| 18. | This conclusion is also supported by the fact that in our sample, the subjects’ average contribution in the one-shot PGG was 9.80 tokens (i.e., almost 50% of the endowment), compared to 6.7 tokens (33.5% of the endowment) reported by Fischbacher et al. [7]. |
| 19. | PR shows a significantly positive relation with contribution levels in the final period of the repeated PGG (), though, but since this is the only instance where PR shows a significant correlation with any of the variables we have assessed or computed (except Machiavellianism)—including several measures of reciprocity, such as CCA, mean difference between own contribution and believed average contribution of others, and further variables of this kind—we do not pay serious attention to this one single correlation which may have reached significance just by chance alone. |
Figure 1.
A visualization of the sequence of tasks subjects had to perform during the experimental session. Importantly, subjects had no feedback about the outcome of the one-shot PGG or their accuracy in estimating other peoples’ contributions or SVOs when starting to interact with others in the repeated PGG. SVO: social value orientation; PGG: public goods game.

Figure 2.
Exemplary primary item of the Slider Measure. Payoffs in the upper row denote the payoffs for the other, while payoffs in the bottom row denote the payoffs for the self. Each own–other payoff allocation connected via a vertical line constitutes one option. In total, the Slider Measure consists of six items and a DM must choose the most preferred option among the nine options provided per item.

Figure 3.
Distribution of SVO angles at t. The bars indicate the proportion of subjects (y-axis) showing a corresponding SVO angle (x-axis). The black line indicates a smoothed density estimation.
Figure 3.
Distribution of SVO angles at t. The bars indicate the proportion of subjects (y-axis) showing a corresponding SVO angle (x-axis). The black line indicates a smoothed density estimation.
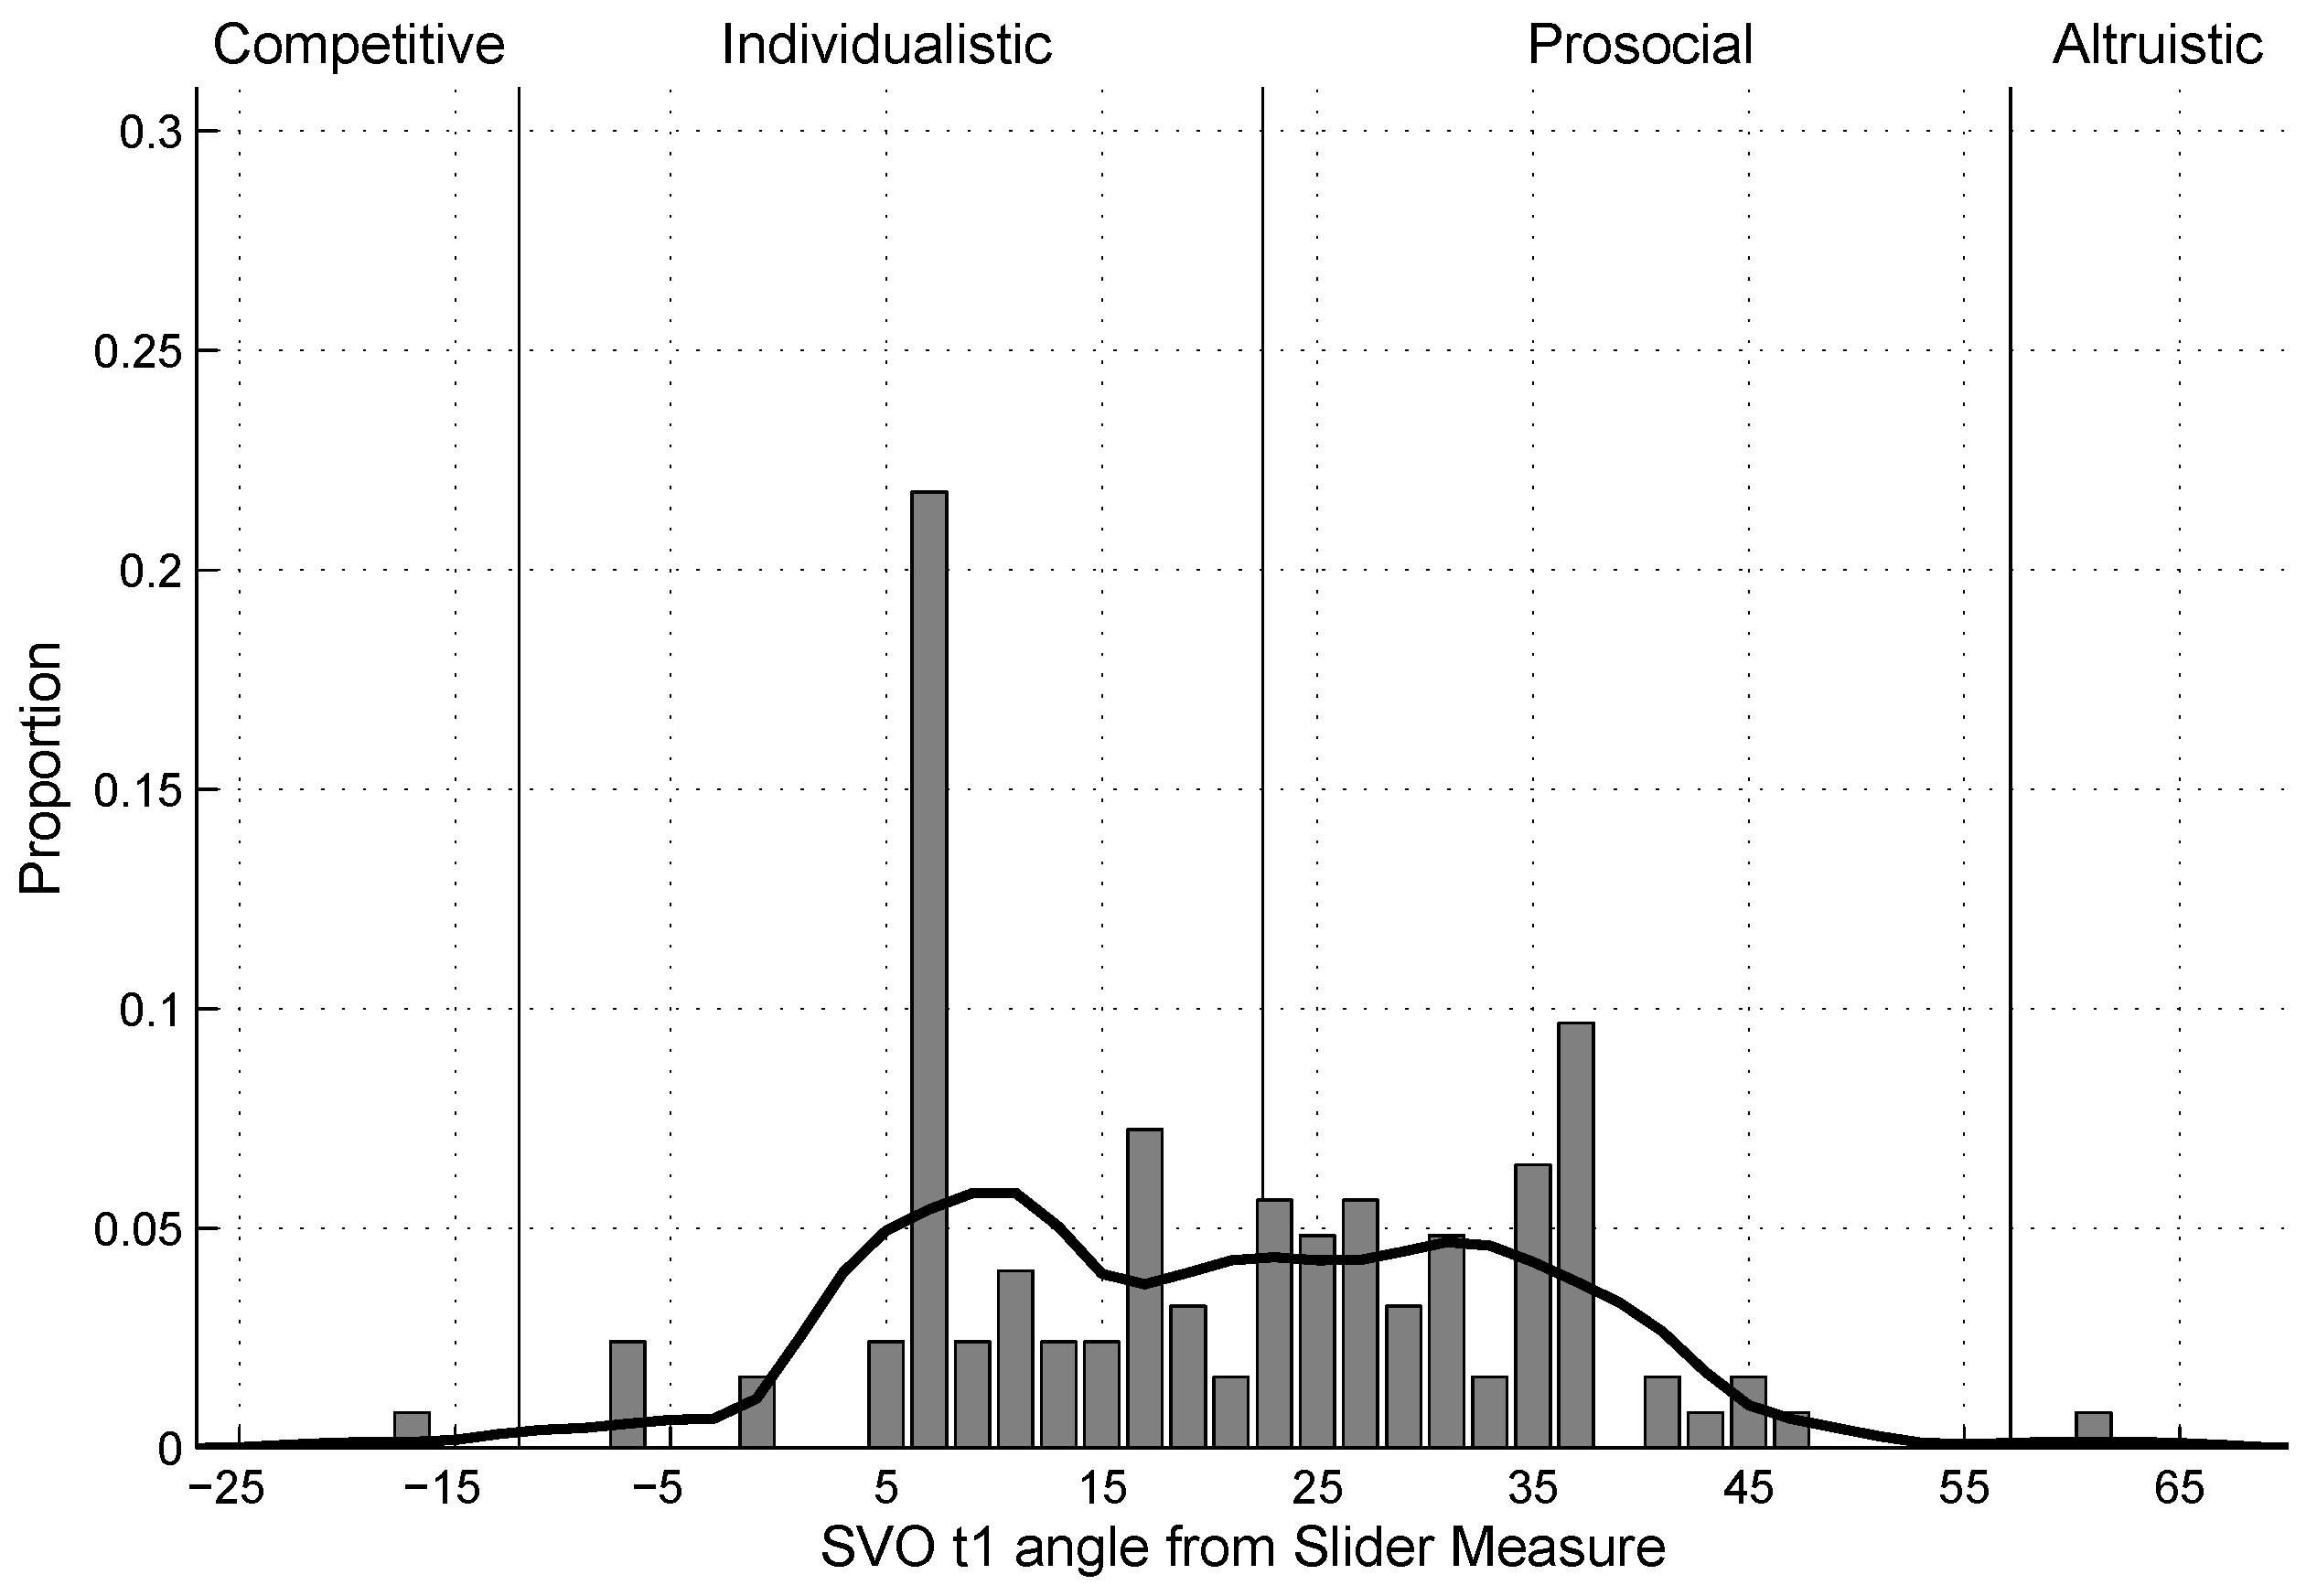
Figure 4.
Distribution of SVO angles at t. The bars indicate the proportion of subjects (y-axis) showing a corresponding SVO angle (x-axis). The black line indicates a smoothed density estimation.
Figure 4.
Distribution of SVO angles at t. The bars indicate the proportion of subjects (y-axis) showing a corresponding SVO angle (x-axis). The black line indicates a smoothed density estimation.

Figure 5.
Distribution of SVO beliefs . The bars indicate the proportion of subjects (y-axis) believing that most people show a corresponding SVO angle (x-axis). The black line indicates a smoothed density estimation.
Figure 5.
Distribution of SVO beliefs . The bars indicate the proportion of subjects (y-axis) believing that most people show a corresponding SVO angle (x-axis). The black line indicates a smoothed density estimation.
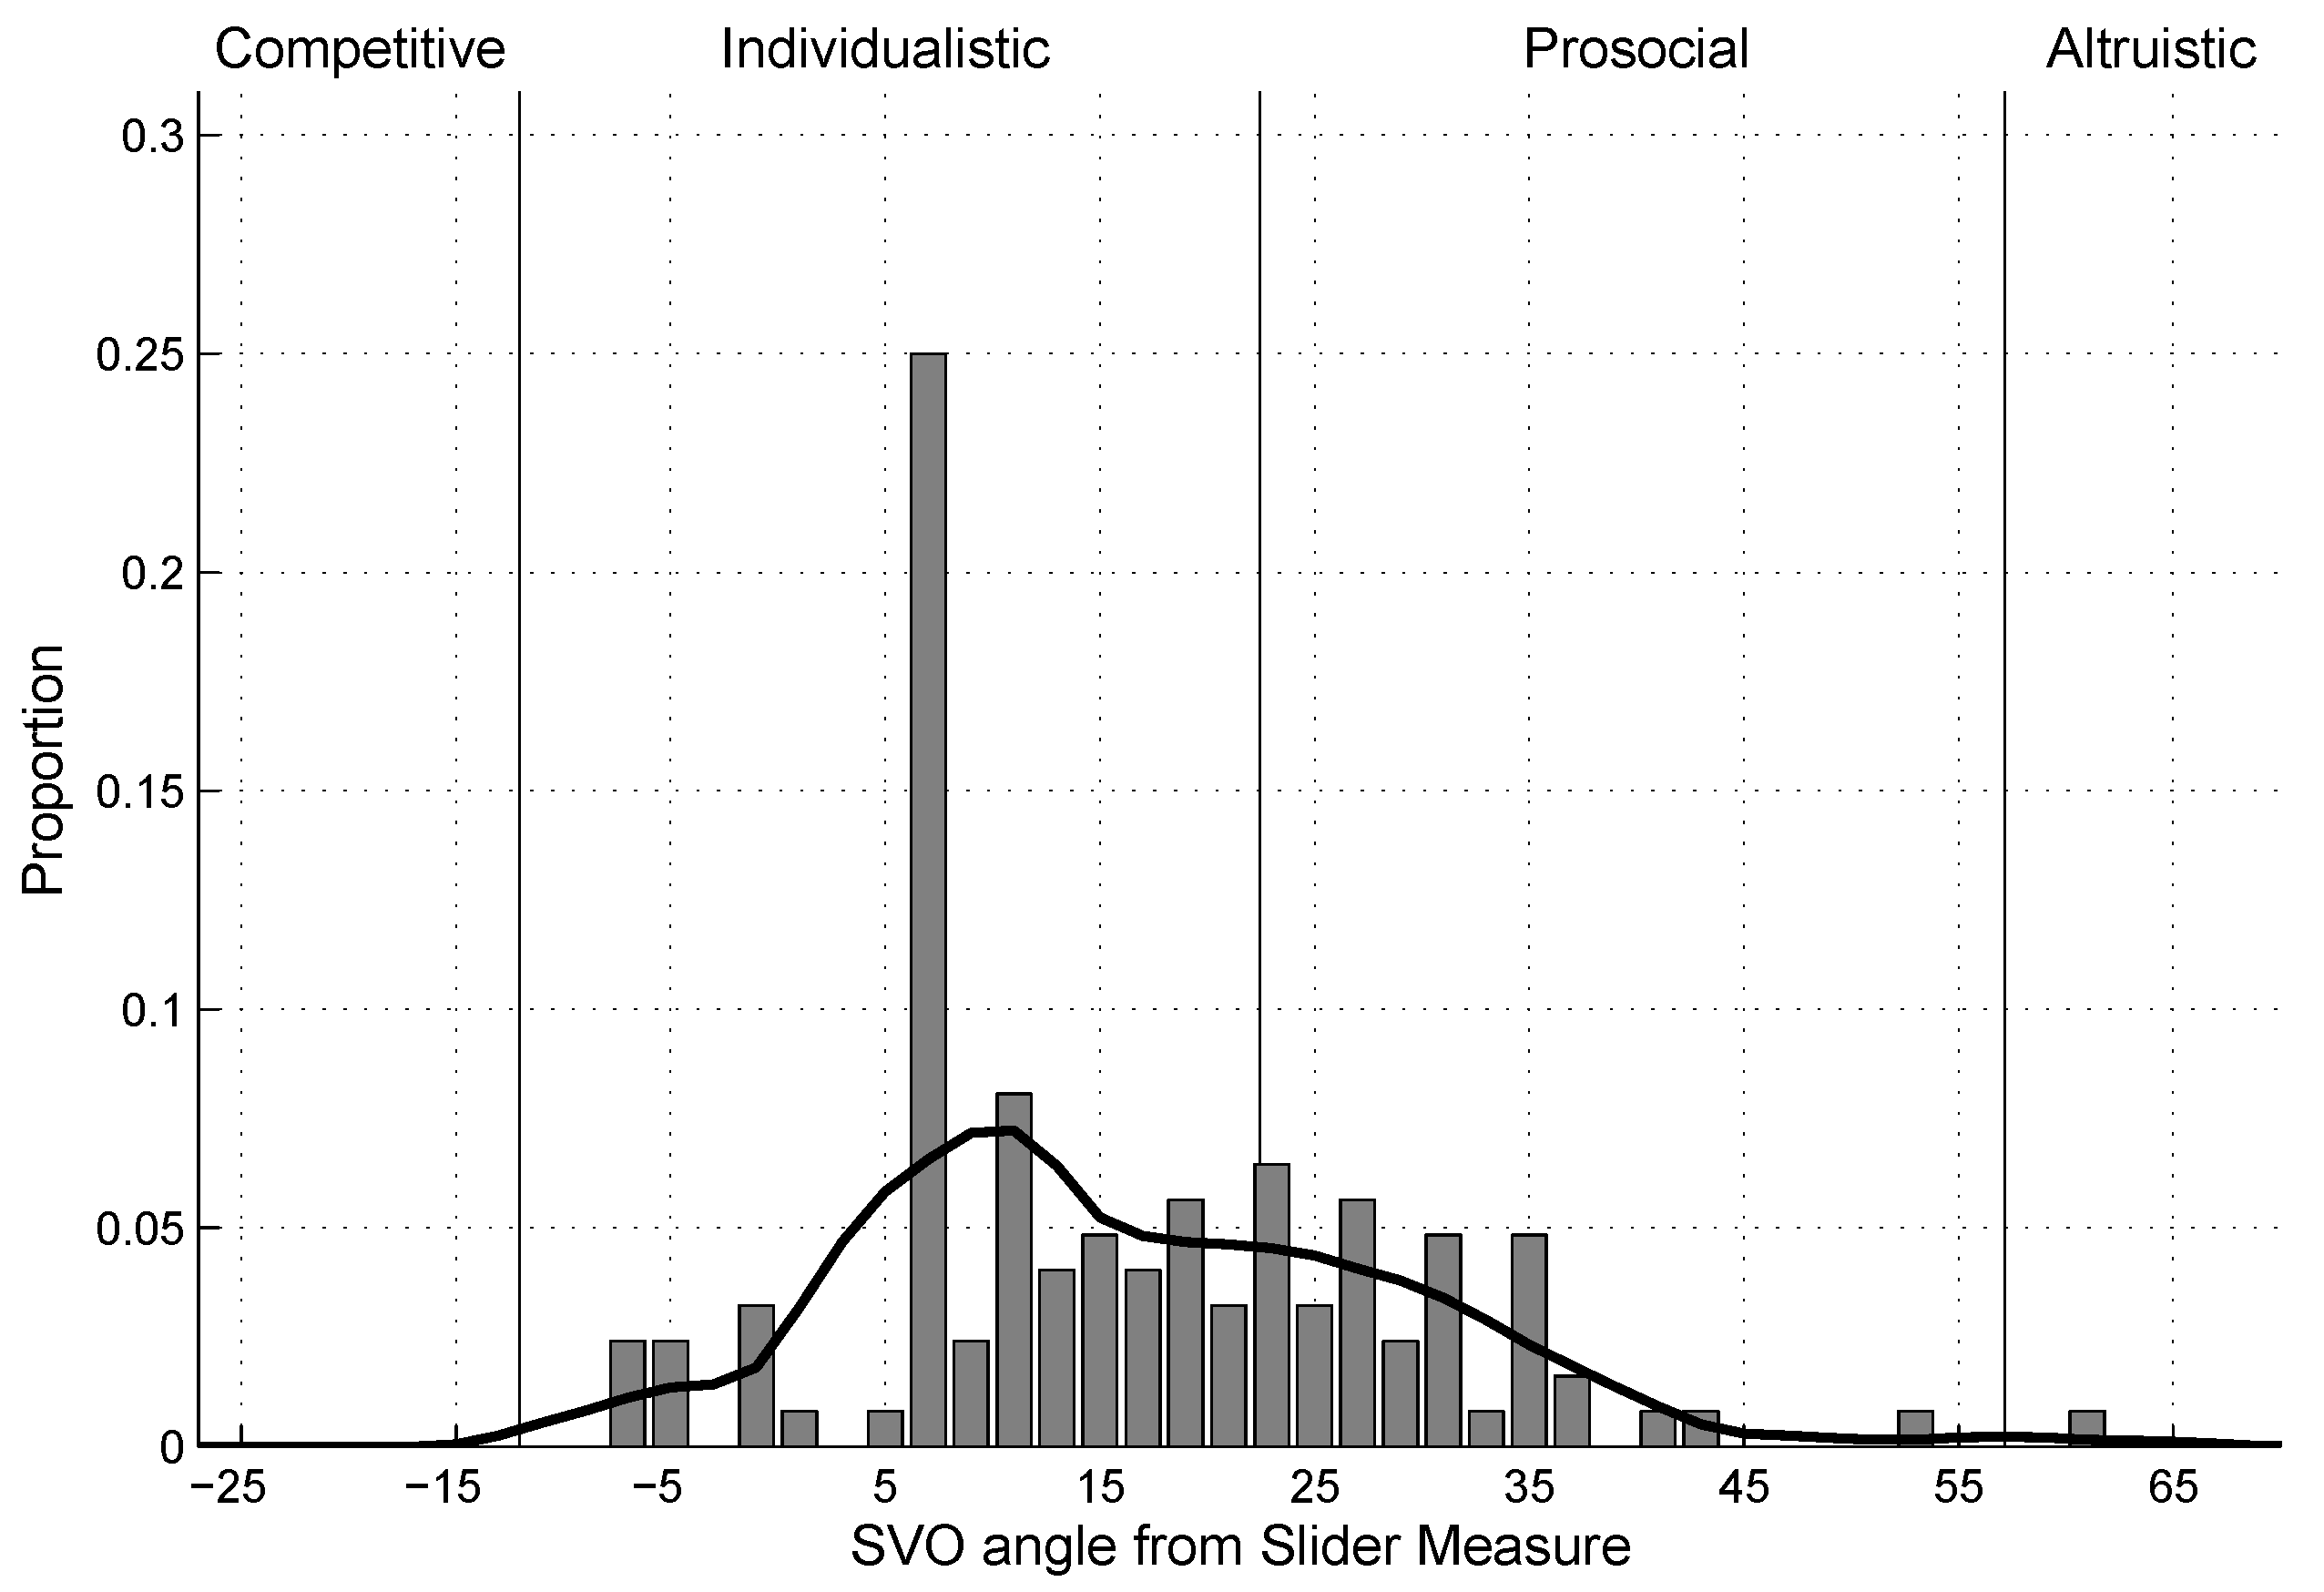
Figure 6.
Distribution of contributions in the one-shot PGG (). The bars indicate the proportion of subjects (y-axis) contributing a corresponding amount (x-axis) in the one-shot Public Goods game.
Figure 6.
Distribution of contributions in the one-shot PGG (). The bars indicate the proportion of subjects (y-axis) contributing a corresponding amount (x-axis) in the one-shot Public Goods game.

Figure 7.
Distribution of contribution beliefs from one-shot PGG (). The bars indicate the proportion of subjects (y-axis) believing that others contributed a corresponding amount (x-axis) in the one-shot Public Goods game.
Figure 7.
Distribution of contribution beliefs from one-shot PGG (). The bars indicate the proportion of subjects (y-axis) believing that others contributed a corresponding amount (x-axis) in the one-shot Public Goods game.

Figure 8.
Distribution of conditional contributions from strategy method (). The bars indicate the proportion of subjects (z-axis) contributing a corresponding amount (y-axis) given a corresponding average contribution from others (x-axis) as assessed by means of the strategy method.
Figure 8.
Distribution of conditional contributions from strategy method (). The bars indicate the proportion of subjects (z-axis) contributing a corresponding amount (y-axis) given a corresponding average contribution from others (x-axis) as assessed by means of the strategy method.
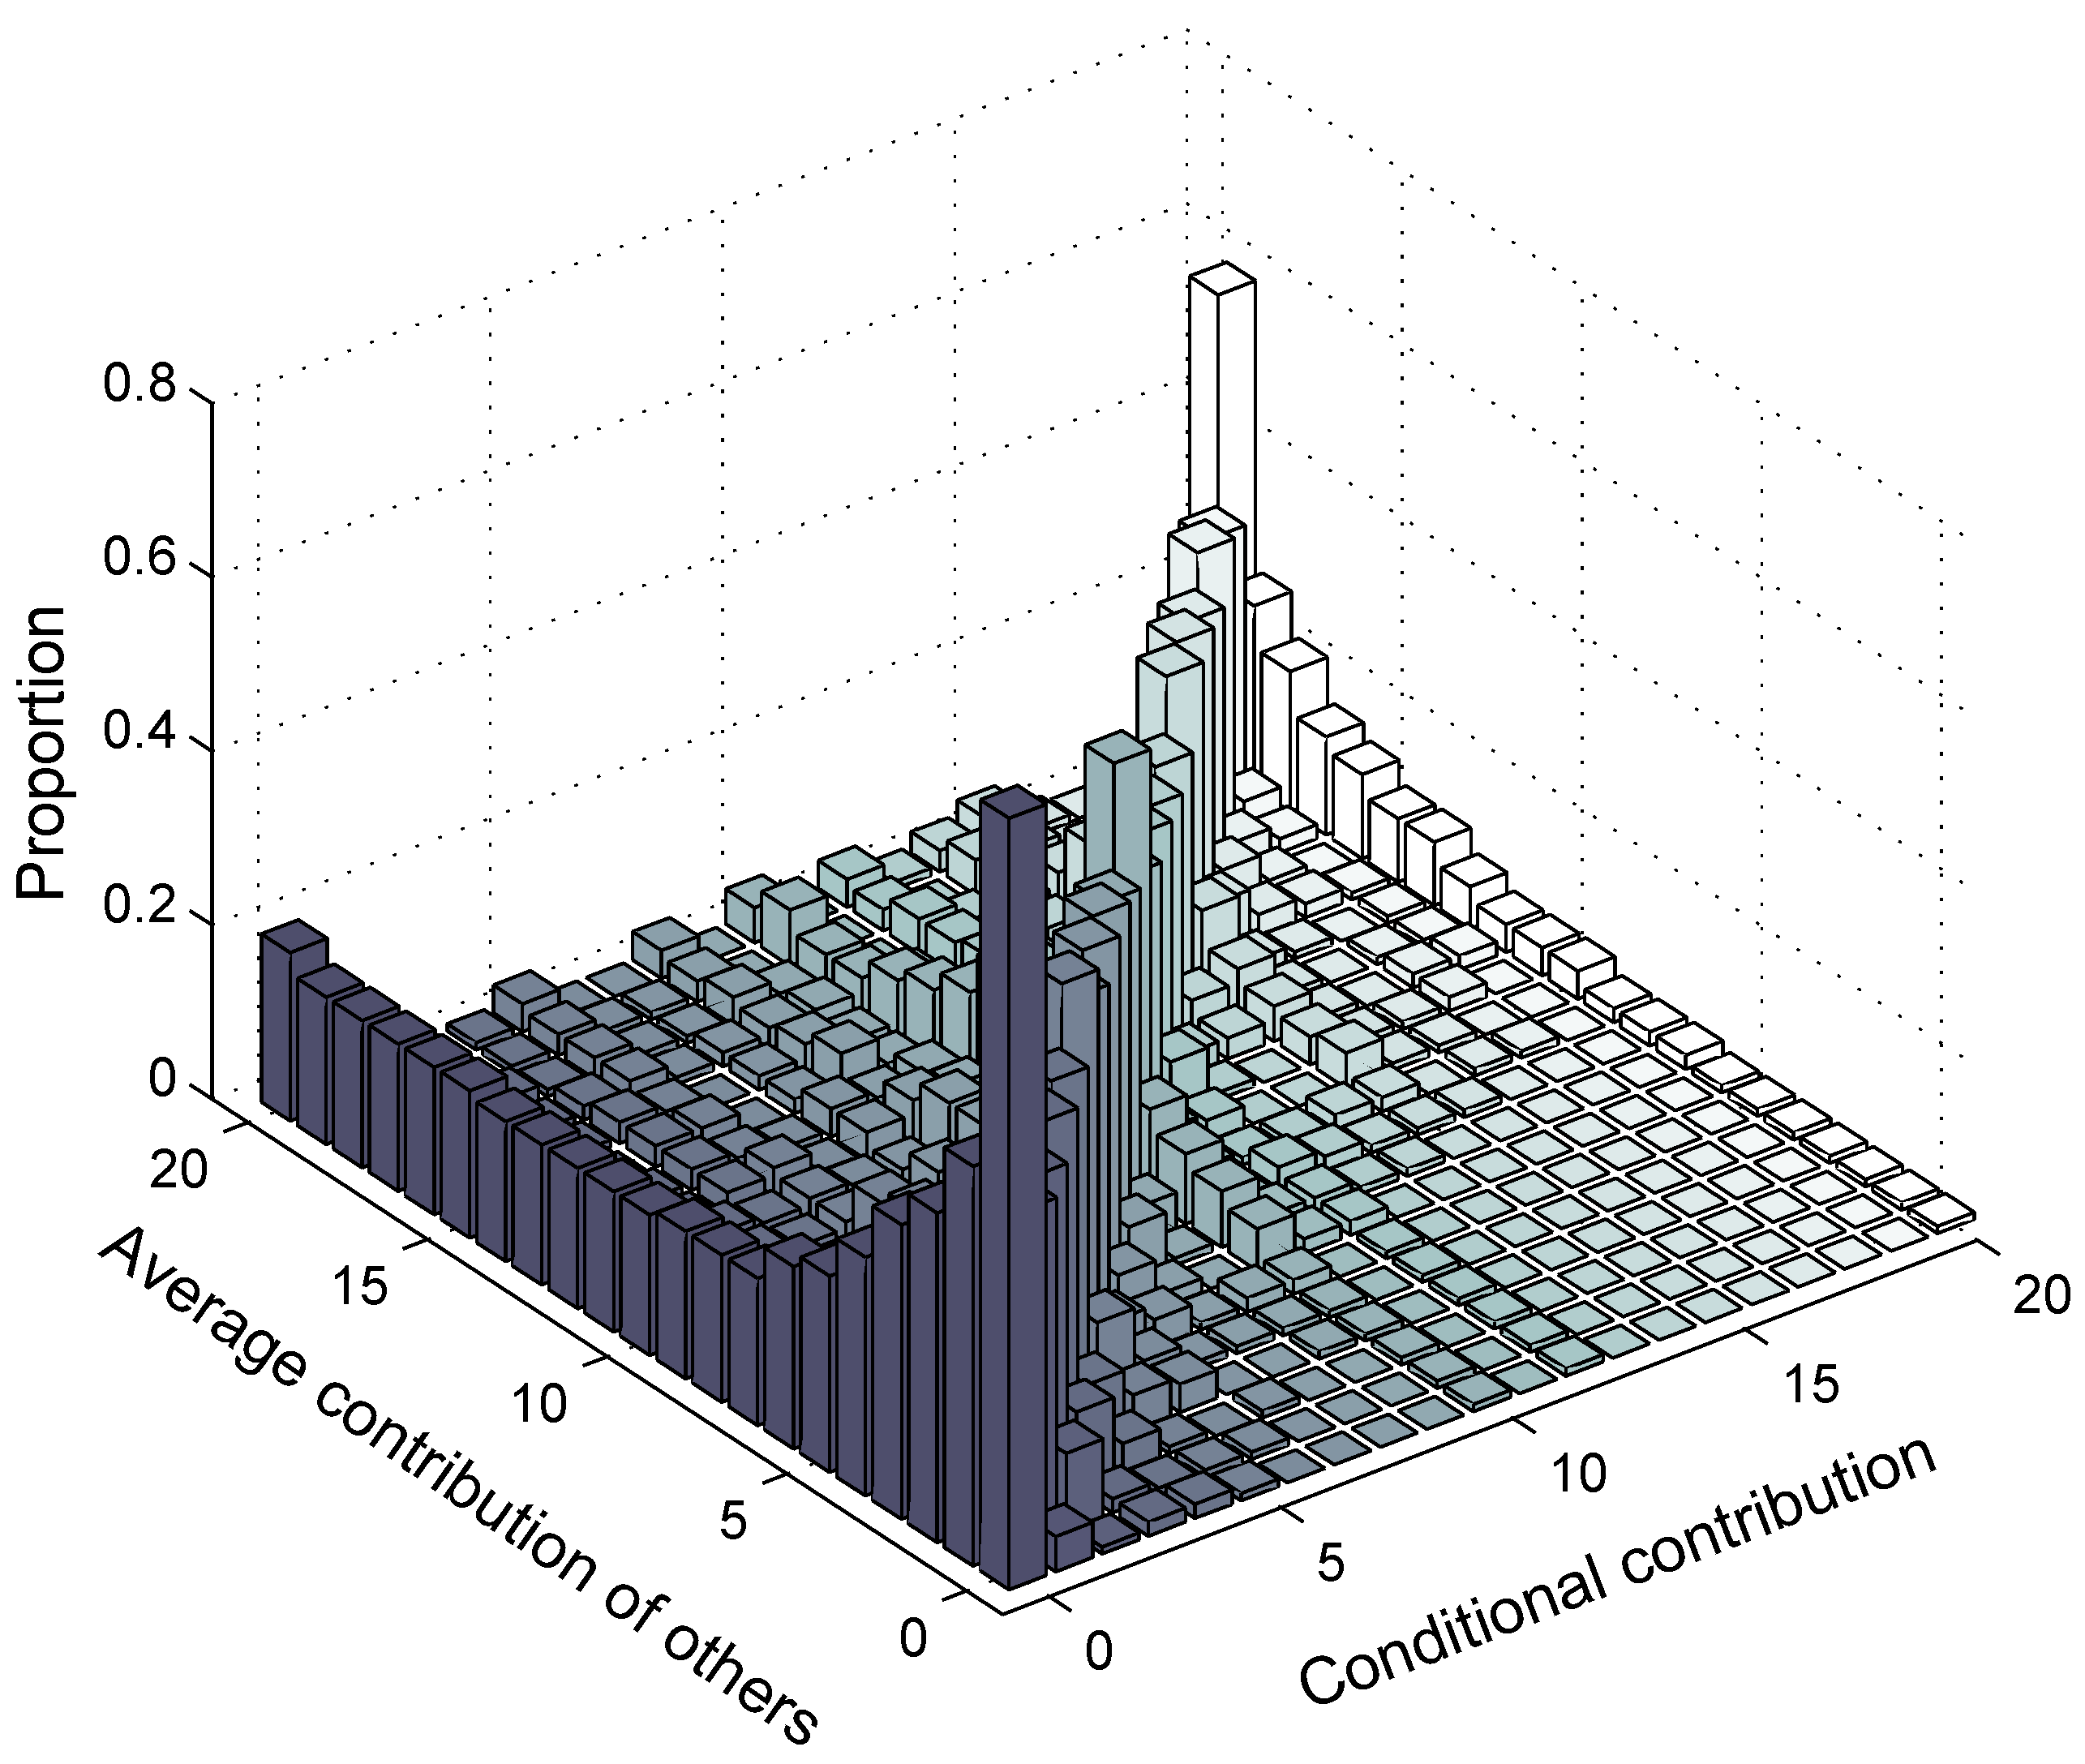
Figure 9.
Distribution of contributions across the 10 periods in the repeated PGG (). The bars indicate the proportion of subjects (z-axis) contributing a corresponding amount (y-axis) in the corresponding period of the repeated Public Goods game (x-axis).
Figure 9.
Distribution of contributions across the 10 periods in the repeated PGG (). The bars indicate the proportion of subjects (z-axis) contributing a corresponding amount (y-axis) in the corresponding period of the repeated Public Goods game (x-axis).
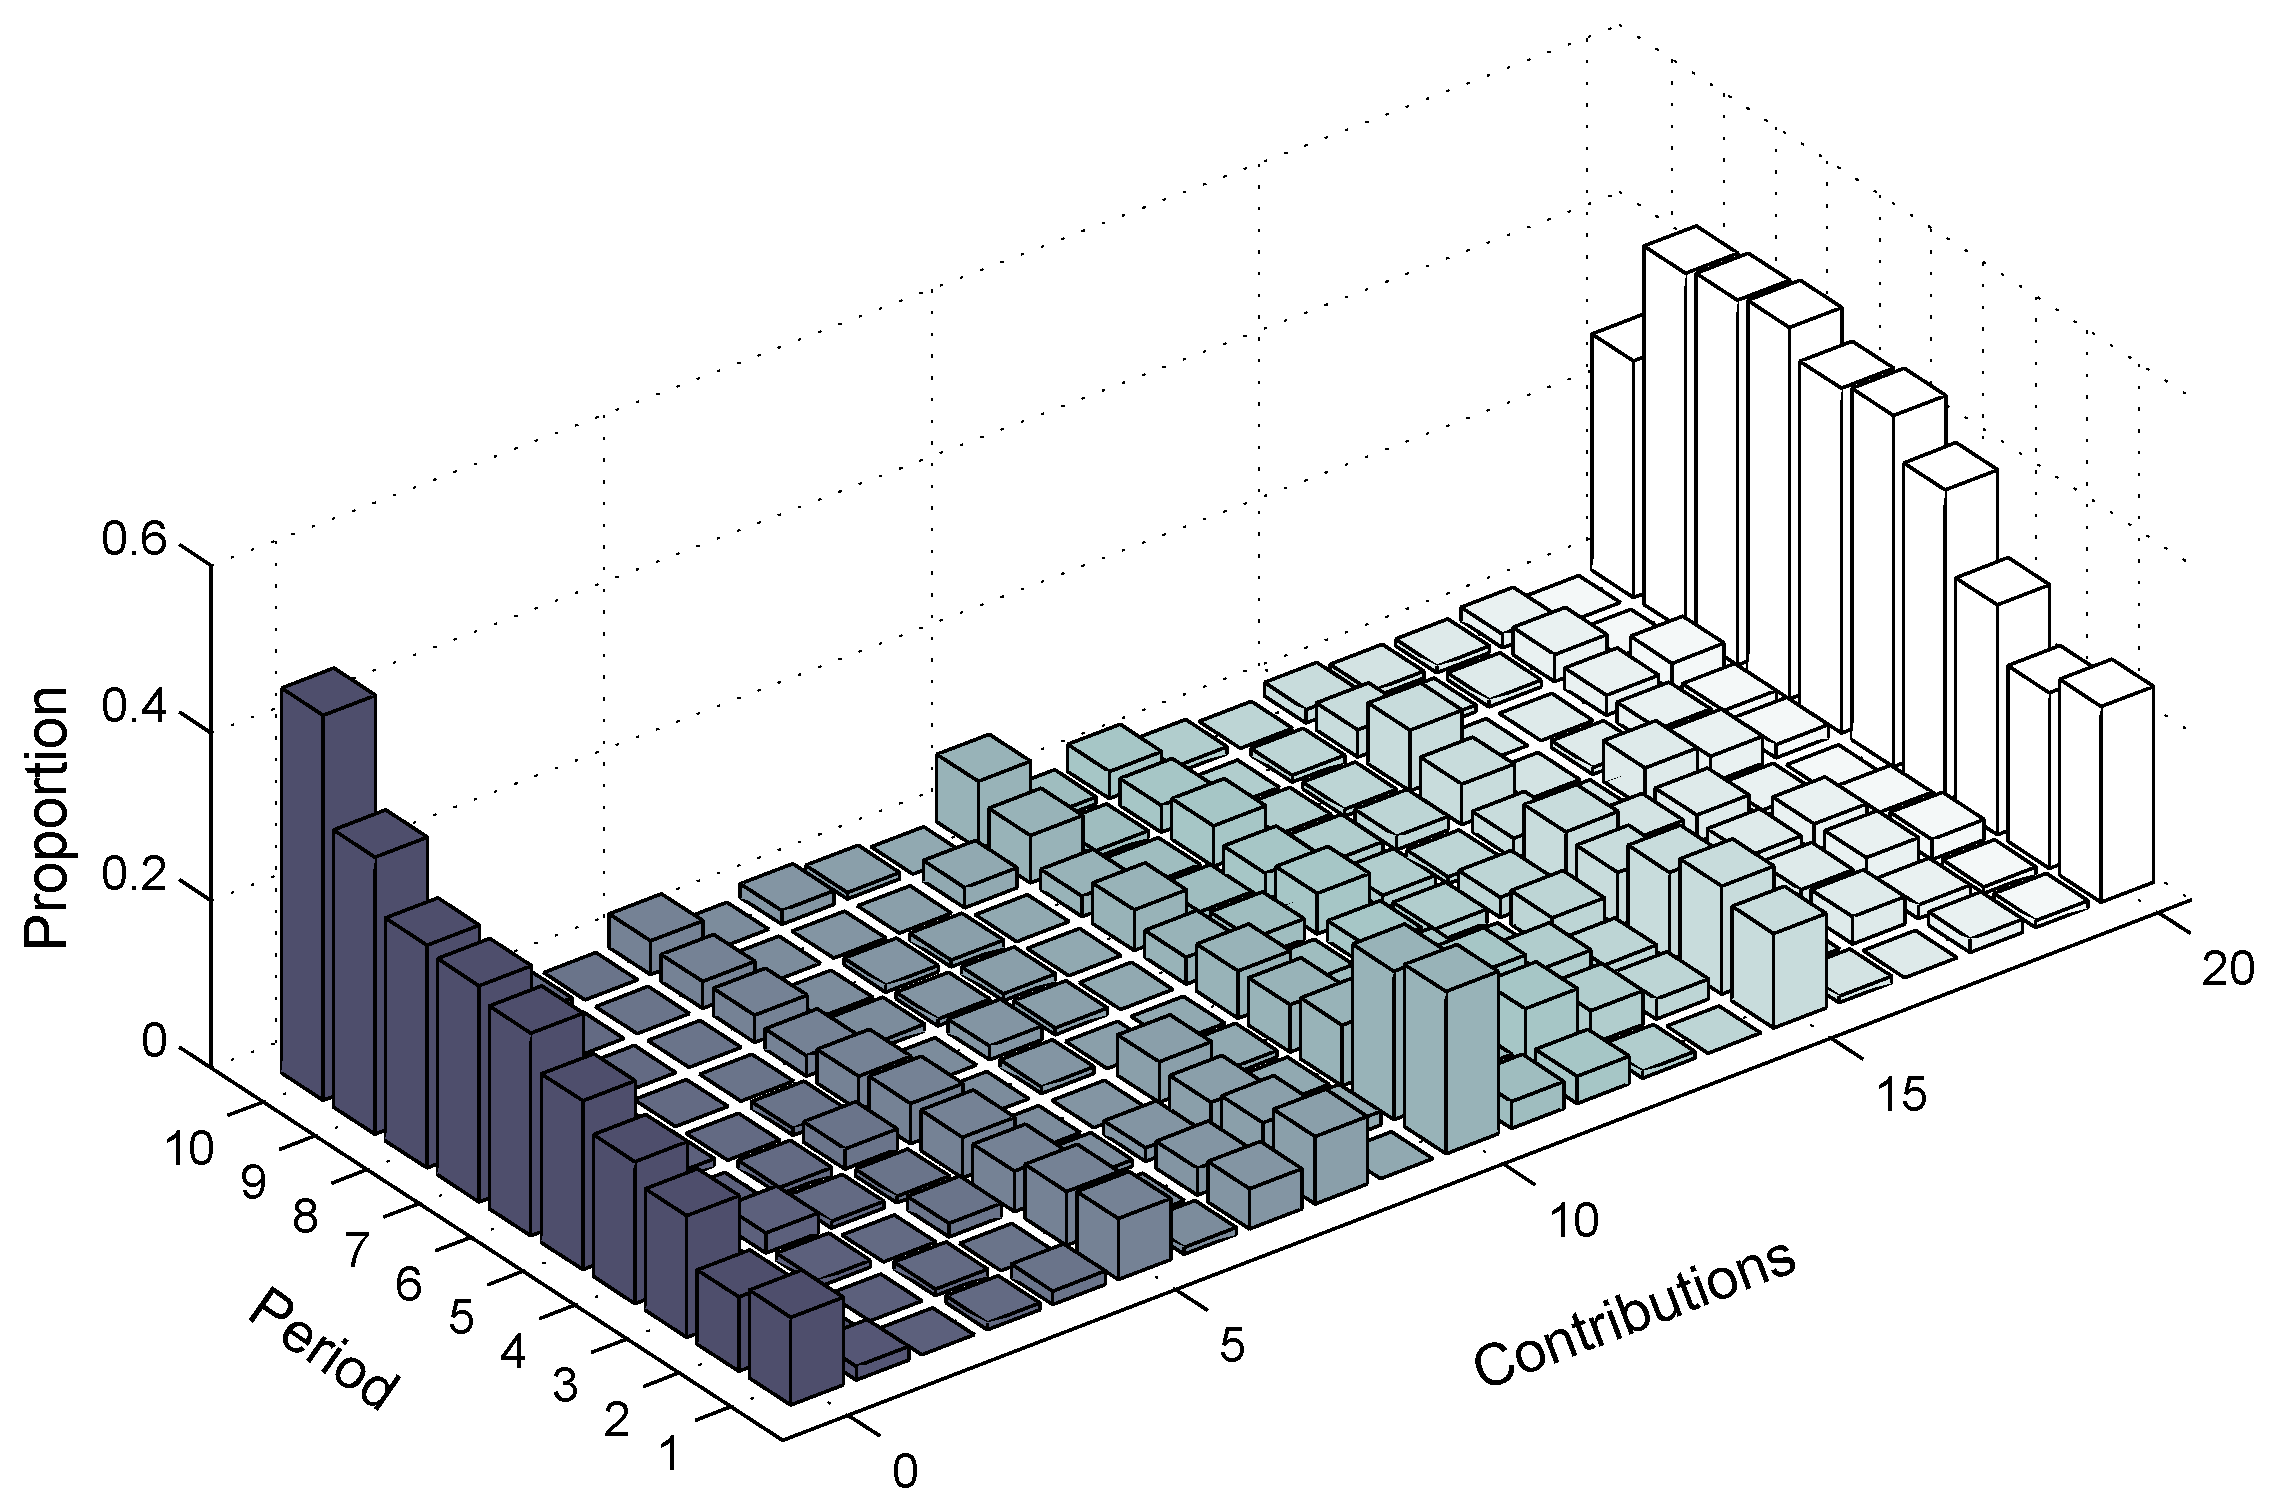
Figure 10.
Mean contribution per period in the repeated PGG with 95% confidence intervals around the means (). The figure shows the mean contribution of all subjects (y-axis) per period of the repeated Public Goods game (x-axis). The error bars indicate 95% confidence intervals around the means as derived by means of bootstrapping.

Figure 11.
Contribution profiles of the 32 groups across the 10 periods of the repeated PGG (). The x-axis for each subplot shows the 10 periods of the repeated PGG; the y-axis of each subplot shows the contribution amount of each individual. The thick line in each subplot indicates the group’s mean contribution, and dashed lines indicate individual contributions.

Figure 12.
Beta weights and from OLS regression with contributions in the repeated PGG as dependent variable and SVO (t), SVO belief, and PG belief (per period) as independent variables across the 10 periods (). Asterisks (*) indicate significance . Obviously, beta weights and values are in different metrics; however, this plot shows the relative stability of these components and the total model over periods of the iterated game.

Figure 13.
s from OLS regressions with beliefs about average contributions of others in the repeated PGG (period 2–10) as dependent variable. For each period, the independent variables average contribution of others in period p-1, PG rp belief in period p-1, and own contribution in period p-1 are inserted into the regression in nested blocks in the respective order (). Asterisks (*) indicate a significant increase in with .
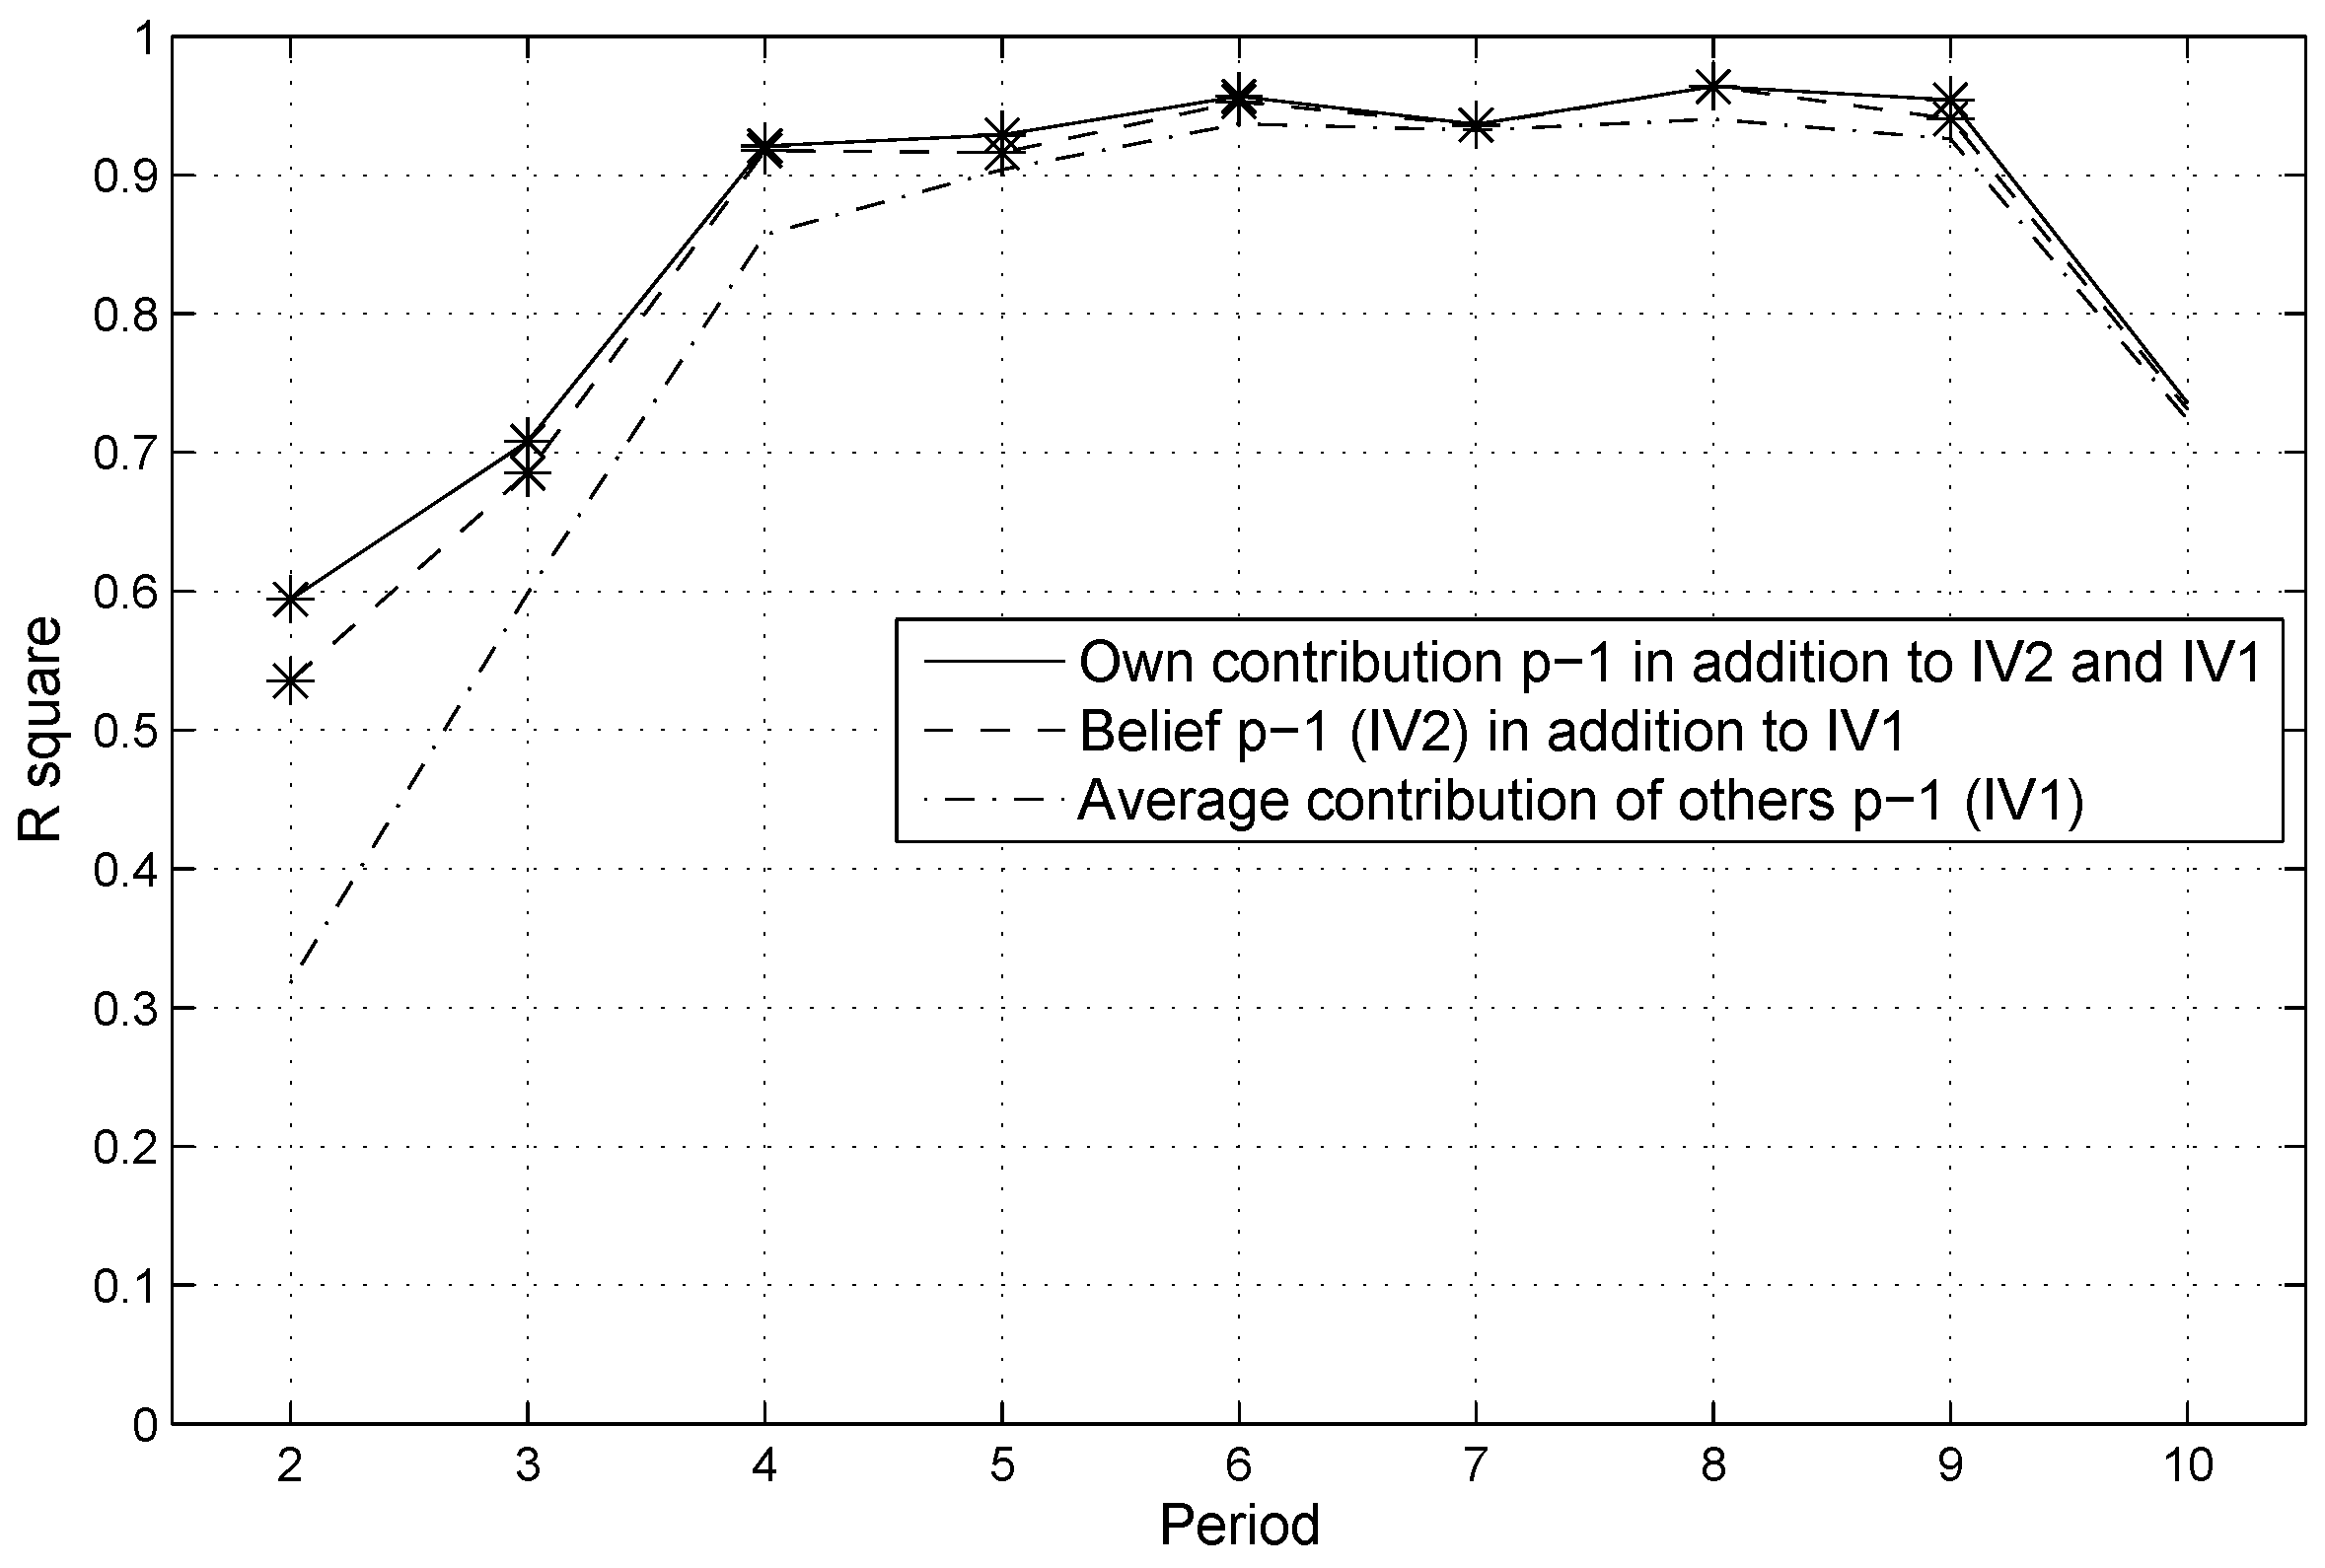
Figure 14.
s from OLS regressions with individual contributions in the repeated PGG per period as dependent variable. For each period, the independent variables BBCC, PG rp belief per period, and SVO are inserted into the regression in the respective order (). Circles (o) indicate a significant increase in with .
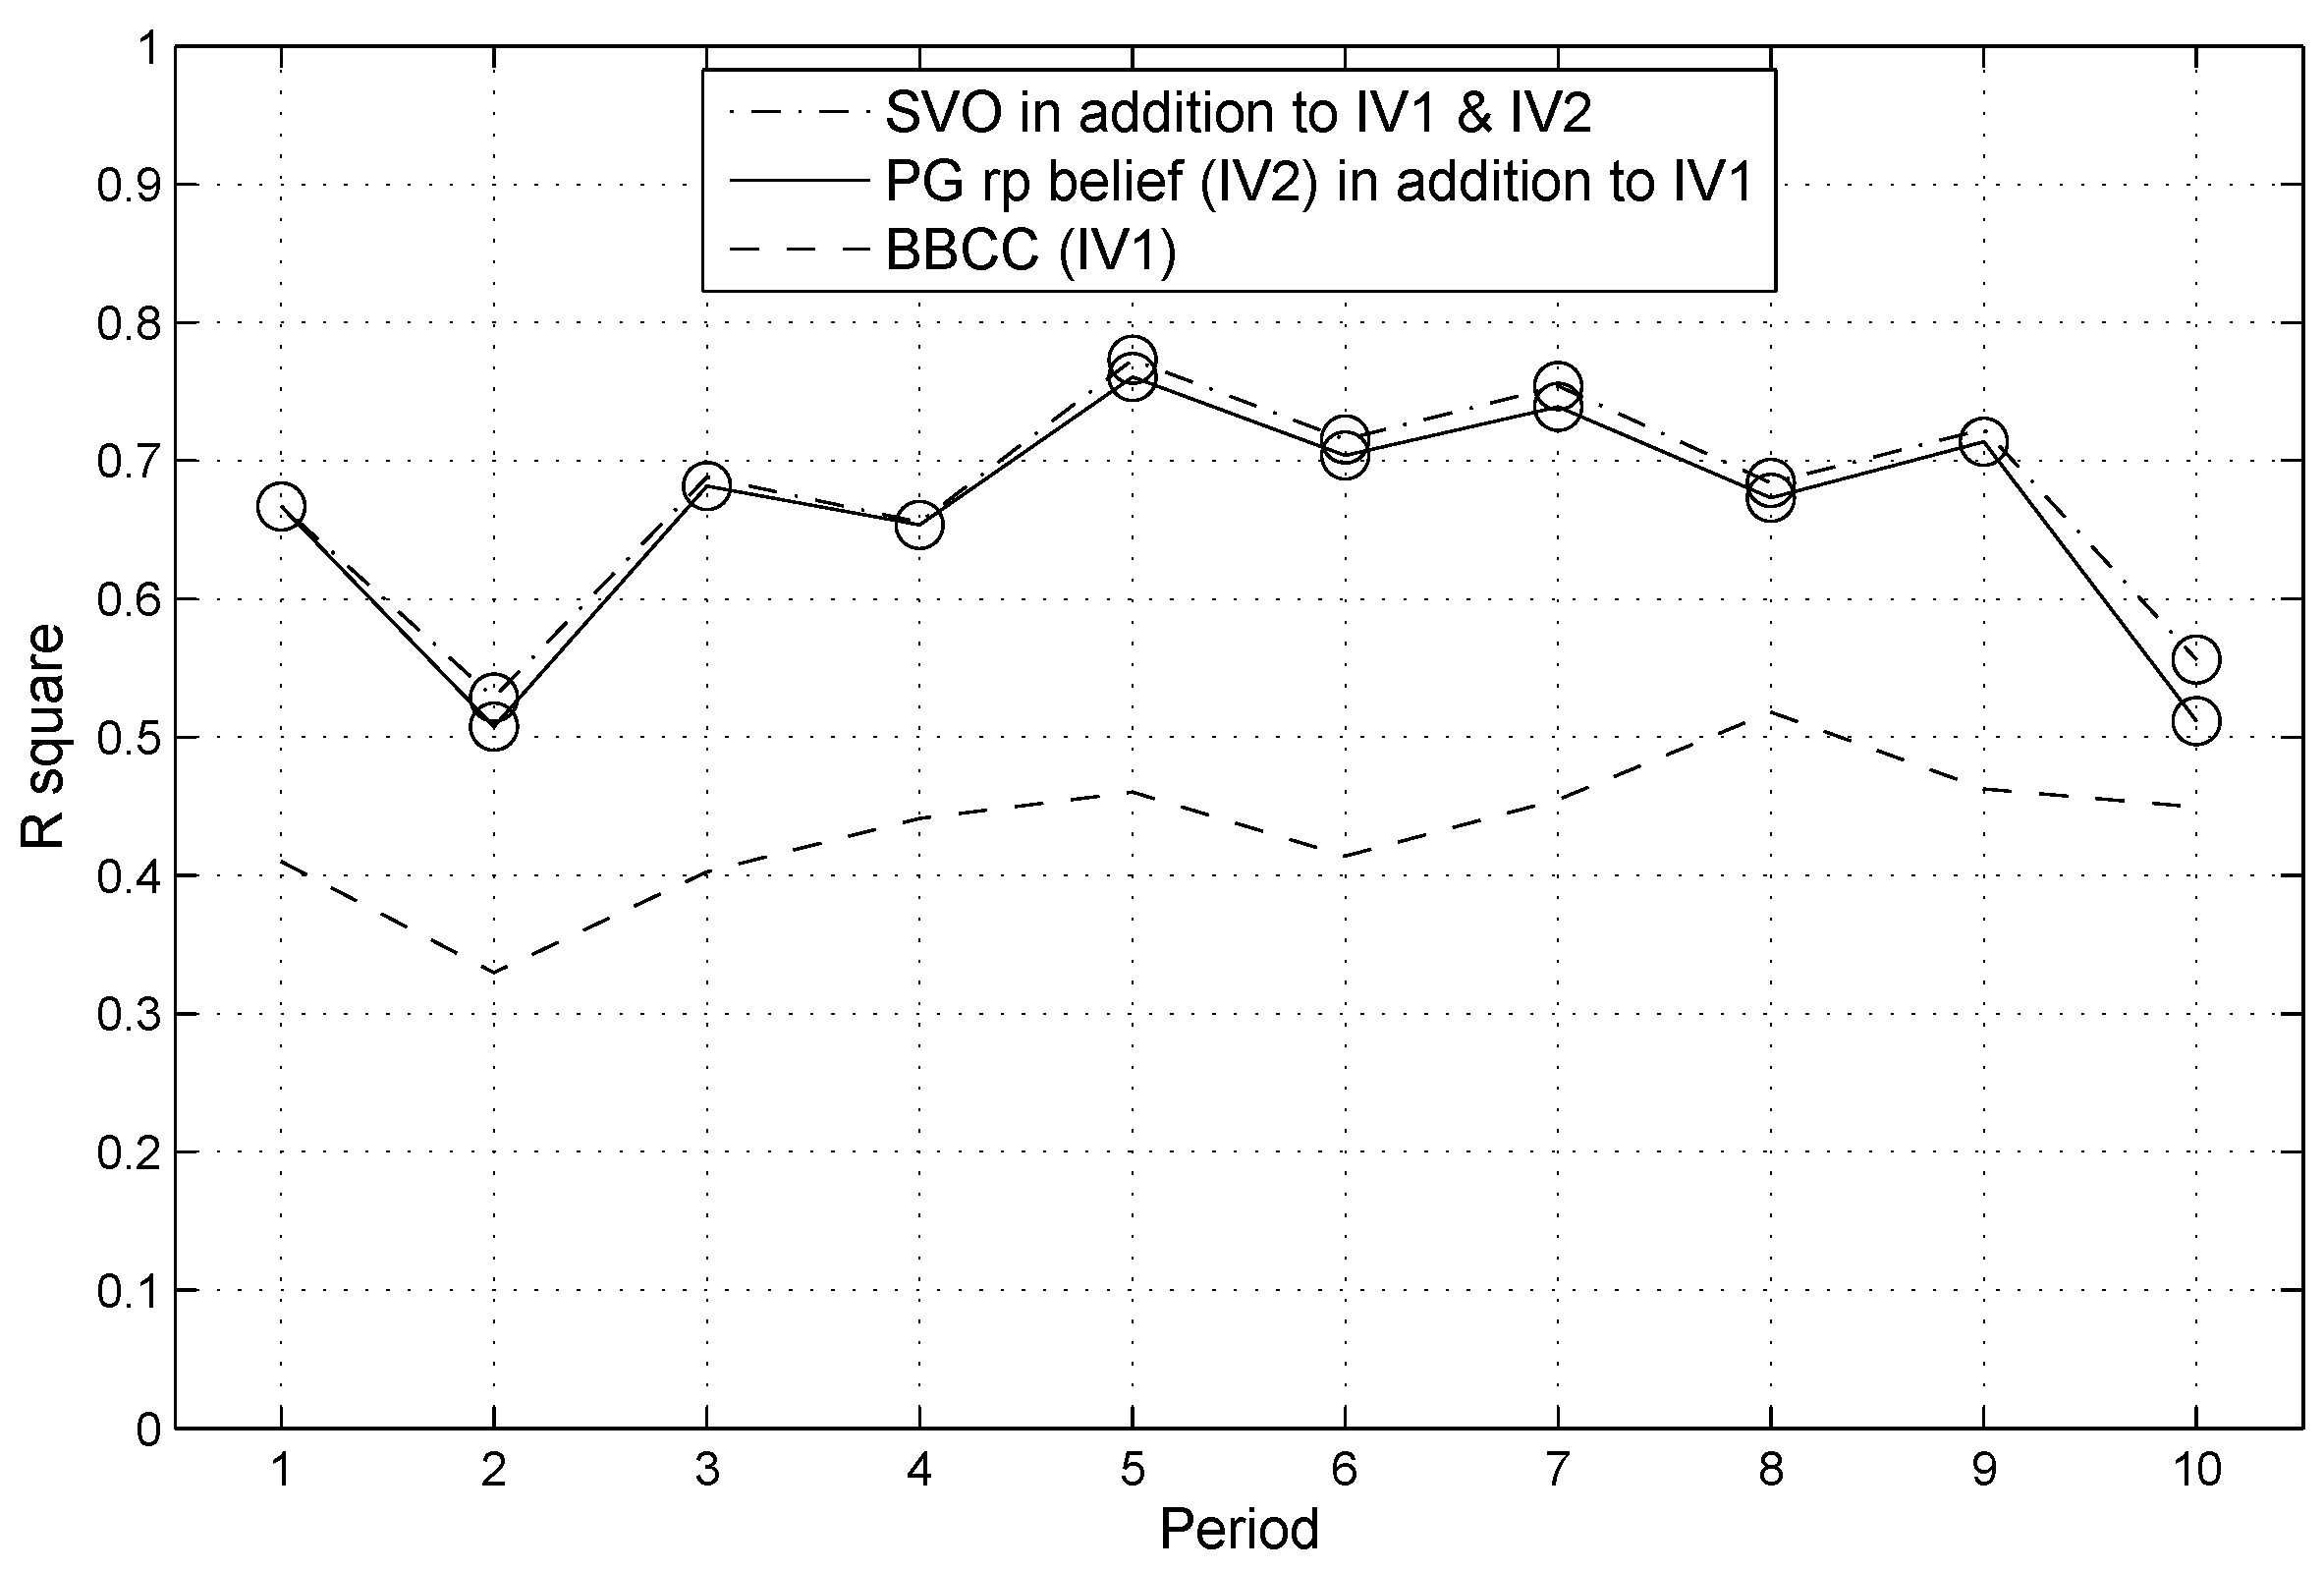
Figure 15.
Mean differences between actual individual contributions and BBCC on the one hand, and between actual individual contributions and beliefs about the average contribution of others on the other hand per period, with 95% confidence intervals around the mean differences ().
Figure 15.
Mean differences between actual individual contributions and BBCC on the one hand, and between actual individual contributions and beliefs about the average contribution of others on the other hand per period, with 95% confidence intervals around the mean differences ().

Figure 16.
Conditional contribution means from the strategy method.

Figure 17.
Distribution of SVO ().
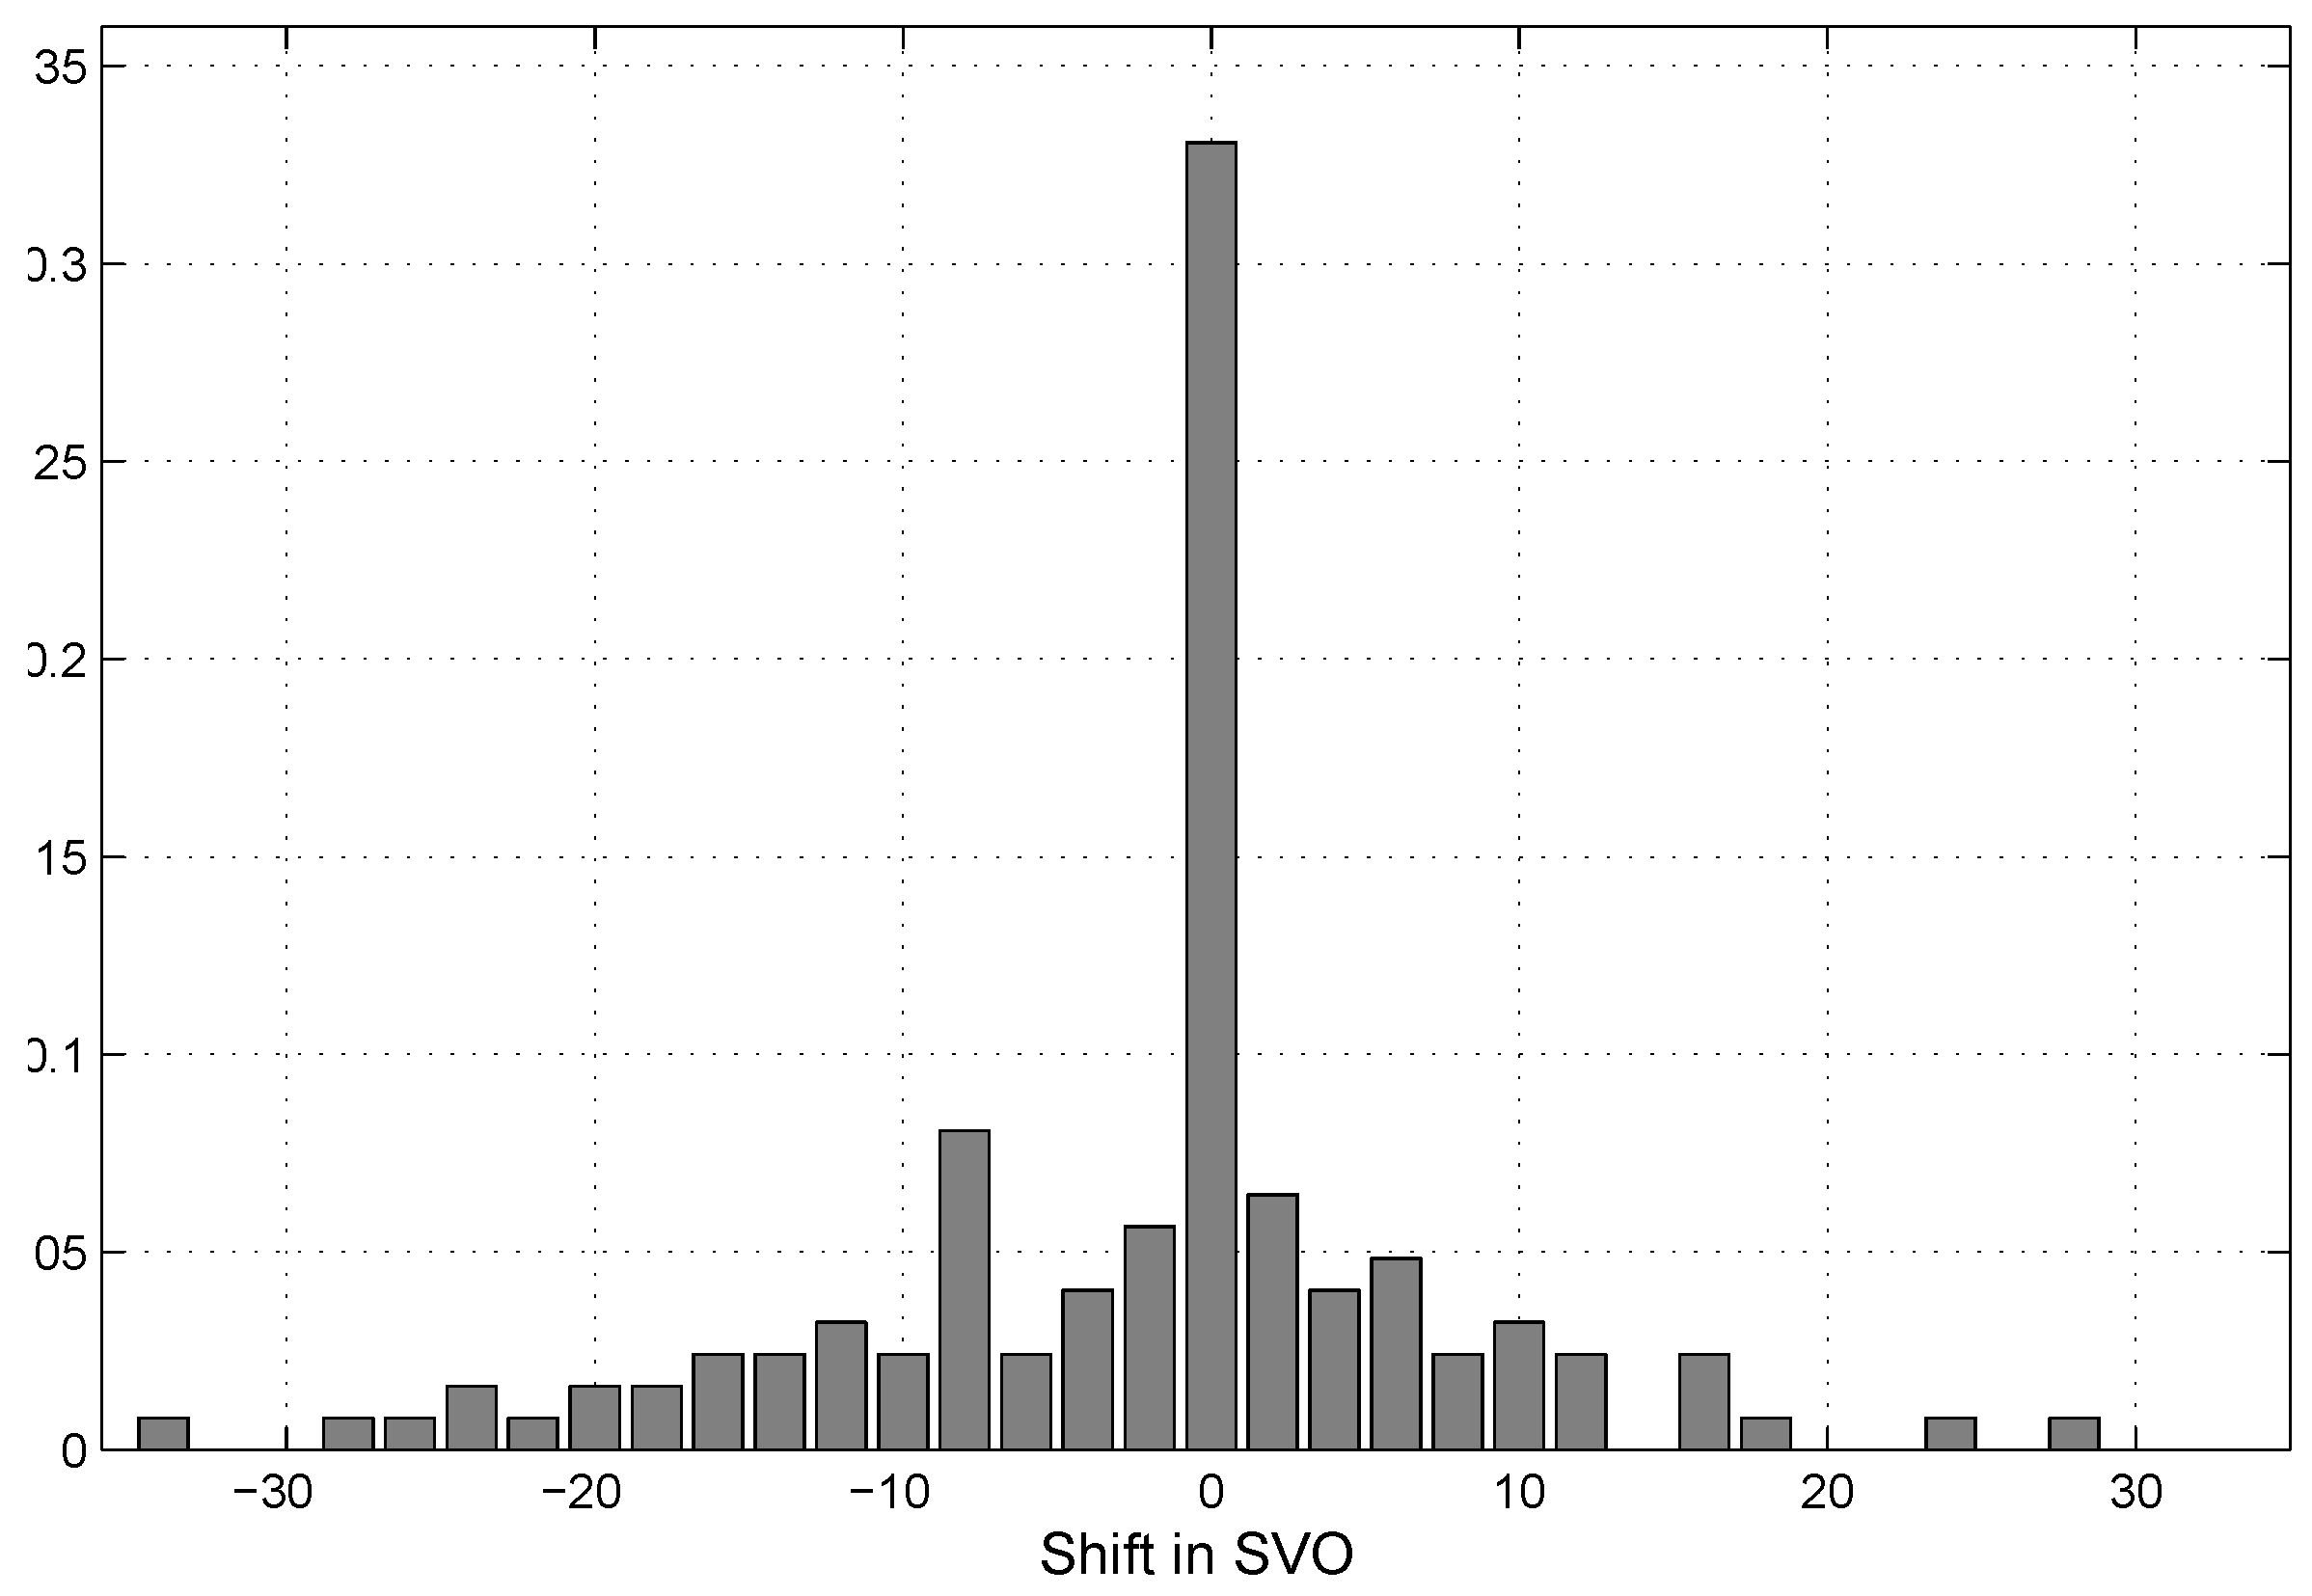
Table 1.
Bivariate correlations among preferences, beliefs, and behavior.
| PG os | SVO | PG os | SVO | CCA | PG rp | PG rp | PG rp | PG rp | SVO | |
|---|---|---|---|---|---|---|---|---|---|---|
| t1 | Belief | Belief | p1 | Belief p1 | p10 | Belief p10 | t2 | |||
| PG os | - | |||||||||
| SVO t | 0.32 *** | - | ||||||||
| PG os belief | 0.75 *** | 0.26 ** | - | |||||||
| SVO belief | 0.09 | 0.63 *** | 0.16 | - | ||||||
| CCA | 0.47 *** | 0.30 *** | 0.39 *** | 0.15 | - | |||||
| PG rp p | 0.70 *** | 0.30 *** | 0.59 *** | 0.09 | 0.32 *** | - | ||||
| PG rp belief p | 0.58 *** | 0.32 *** | 0.69 *** | 0.19 * | 0.21 * | 0.80 *** | - | |||
| PG rp p | 0.27 ** | 0.26 ** | 0.20 * | 0.17 | 0.31 *** | 0.15 | 0.11 | - | ||
| PG rp belief p | 0.27 ** | 0.04 | 0.21 * | 0.05 | 0.37 *** | 0.15 | 0.08 | 0.70 *** | - | |
| SVO t | 0.32 *** | 0.72 *** | 0.25 ** | 0.55 *** | 0.36 *** | 0.26 ** | 0.19 * | 0.40 *** | 0.26 ** | - |
Levels of significance are indicated as *** at the level, ** at the level, and * at the level. PG os = Contribution in the one-shot PGG; SVO tn = SVO angle at time n; CCA = Conditional cooperation area; PG rp pn = Contribution in period n of the repeated PGG; PG rp belief pn = Belief about the average contribution of others in period n of the repeated PGG.
Table 2.
OLS main effects on contributions in the one-shot PGG ().
| Dependent Variable: Contributions in the One-Shot PGG | |||
|---|---|---|---|
| Model | (1) | (2) | (3) |
| SVO | 0.26 *** | 0.22 ** | 0.23 ** |
| PG belief | 0.71 *** | 0.66 *** | 0.54 *** |
| SVO belief | −0.19 * | −0.18 * | −0.19 ** |
| CCA | 0.17 ** | ||
| BBCC | 0.25 ** | ||
| 0.60 | 0.63 | 0.63 | |
| 0.59 | 0.61 | 0.62 | |
Note: Standardized regression coefficients are reported. Levels of statistical significance are indicated as p *** < 0.001; p ** < 0.01; p * < 0.05. BBCC: belief-based conditional contribution.
Table 3.
Random-effects GLS regression on contribution levels in the repeated PGG.
| Dependent Variable: Contributions across the Repeated PGG | ||||||
|---|---|---|---|---|---|---|
| Model 1 | Model 2 | Model 3 | ||||
| SVO | 0.09 | (0.04) * | 0.09 | (0.04) * | 0.07 | (0.04) |
| PG belief | 0.84 | (0.04) *** | 0.84 | (0.04) *** | 0.70 | (0.07) *** |
| SVO belief | −0.03 | (0.02) | −0.03 | (0.02) | −0.02 | (0.02) |
| Period | −0.17 | (0.05) ** | −0.17 | (0.05) *** | ||
| BBCC | 0.20 | (0.06) ** | ||||
| Constant | 0.57 | (0.55) | 1.52 | (0.57) ** | 1.53 | (0.59) * |
| 0.66 | 0.66 | 0.67 | ||||
Note: Number of observations is 1280. Robust standard errors adjusted for 32 clusters in PGG groups are reported in parentheses. Levels of statistical significance are indicated as p *** < 0.001; p ** < 0.01; p * < 0.05. “Period” refers to the period number (1–10) in the repeated PGG.
Table 4.
SVO and conditional cooperation.
| Low SVO | Medium SVO | High SVO | |
|---|---|---|---|
| Free Rider | 7 (19.4 ∣ 38.9) | 7 (14.3 ∣ 38.9) | 4 (10.3 ∣ 22.2) |
| Perfect CC | 7 (19.4 ∣ 23.3) | 13 (26.5 ∣ 43.3) | 10 (25.6 ∣ 33.3) |
| Excessive CC | 1 (2.8 ∣ 7.7) | 4 (8.2 ∣ 30.8) | 8 (20.5 ∣ 61.5) |
| Imperfect CC | 15 (41.7 ∣ 45.5) | 11 (22.4 ∣ 33.3) | 7 (17.9 ∣ 21.2) |
| Mixed CC | 4 (11.1 ∣ 20.0) | 7 (14.3 ∣ 35.0) | 9 (23.1 ∣ 45.0) |
| Hump Shaped | 1 (2.8 ∣ 14.3) | 6 (12.2 ∣ 85.7) | 0 (0.0 ∣ 0.0) |
| Other | 1 (2.8 ∣ 33.3) | 1 (2.0 ∣ 33.3) | 1 (2.6 ∣ 33.3) |
Note: The table shows counts and proportions (in parentheses) of subjects that have SVO angles in a particular range (low, medium, high) per conditional cooperation category. The proportions in parentheses that are on the left side of the vertical bar (∣) denote the frequency of subjects per conditional cooperation category relative to the frequency of subjects within the corresponding SVO category, while the proportions in parentheses that are on the right side of the bar denote the frequency of subjects per SVO category relative to the frequency of subjects in the corresponding conditional cooperation category.
© 2019 by the authors. Licensee MDPI, Basel, Switzerland. This article is an open access article distributed under the terms and conditions of the Creative Commons Attribution (CC BY) license (http://creativecommons.org/licenses/by/4.0/).
Share and Cite
MDPI and ACS Style
Ackermann, K.A.; Murphy, R.O. Explaining Cooperative Behavior in Public Goods Games: How Preferences and Beliefs Affect Contribution Levels. Games 2019, 10, 15. https://0-doi-org.brum.beds.ac.uk/10.3390/g10010015
AMA Style
Ackermann KA, Murphy RO. Explaining Cooperative Behavior in Public Goods Games: How Preferences and Beliefs Affect Contribution Levels. Games. 2019; 10(1):15. https://0-doi-org.brum.beds.ac.uk/10.3390/g10010015
Chicago/Turabian StyleAckermann, Kurt A., and Ryan O. Murphy. 2019. "Explaining Cooperative Behavior in Public Goods Games: How Preferences and Beliefs Affect Contribution Levels" Games 10, no. 1: 15. https://0-doi-org.brum.beds.ac.uk/10.3390/g10010015
Note that from the first issue of 2016, this journal uses article numbers instead of page numbers. See further details here.