Public Information: Relevance or Salience?


Political Science Department, Columbia University, 420 W 118th St., New York, NY 10027, USA
†
I would like to offer my special thanks to Alessandra Casella, Judd Kessler, Mark Dean, Silvio Ravaioli, Pietro Ortoleva and participants of the Experimental Economics Seminar at Columbia for valuable and constructive suggestions. I thank participants to seminars and conferences in Harvard HEWG, Princeton PE research group, SWEET New York, BMP Rice and EITM Summer Institute for their helpful comments.
Games 2020, 11(1), 4; https://0-doi-org.brum.beds.ac.uk/10.3390/g11010004
Submission received: 27 July 2019
/
Revised: 17 November 2019
/
Accepted: 19 November 2019
/
Published: 6 January 2020
(This article belongs to the Special Issue Political Games: Strategy, Persuasion, and Learning)
Abstract
:How does salient public information affect voters’ behavior? In a majoritarian voting game with common preferences, rational voters could use public information as an information device (depending on accuracy) or as a coordination device (regardless of accuracy). A simple lab experiment contradicts both hypotheses – subjects tend to follow public information when it is salient, regardless of the information’s accuracy, but fail to use it as a source of coordination. In particular, it matters whether the information is recent – subjects are more likely to follow public information when it is provided closer to the voting decision. These findings are important because the salience of public information is easily manipulable by political actors.
1. Introduction
When voters have to decide over issues of common interest, they often find themselves influenced by visible events of debatable direct relevance. Before winning the Democratic nomination in 2008, Obama was endorsed by Oprah Winfrey in Iowa, and the endorsement was one of the most widely covered developments of the campaign—Reference [1] estimated that Oprah’s endorsement was responsible for approximately 1 million additional votes for Obama. During the 2016 EU referendum in England, Roger Daltrey (lead singer of the iconic rock band The Who) explained in an interview by The Mirror why he thought Brexit was the right thing to do.1 These examples share the attribute that the information provided is public and salient, particularly noticeable. In the case of the endorsement to Obama, voters might have seen it as an informative public signal, thinking that Oprah had precise information about the candidate, or as a coordination device, believing that everyone else observed it. Alternatively, they could have paid attention to the endorsement because it was extremely noticeable, as Oprah is a famous celebrity and the endorsement happened right before the election.
This paper uses a laboratory experiment to study salient public information and voters’ decision: the main finding of the experiment is that recency bias largely affects collective decision making.
There are three main explanations for why salient public information could be influential. First, if the information provided is more accurate than voters’ private information, then voters may trust the public source more. Second, public information can serve as a coordination mechanism for voters, who may then rationally choose to disregard their private information and follow the public source even when the latter is not accurate. Finally, salient public information can be influential because of biases or heuristics affecting voters’ decision. This paper analyzes each of these explanations.
Salience of information affects how people focus their limited cognitive resources. Salience bias (or perceptual salience) refers to the fact that individuals focus more on information that is striking and perceptible and ignore information that is less so.2 One attribute of salience that is particularly effective in politics is recency. According to the recency bias (or availability heuristic), people tend to heavily weight their judgments towards information received more recently, making new opinions biased toward latest news.3 Public information delivered close to the vote (as Oprah’s endorsement) can be overweighted by voters, who have it readily available in their short-term memory. In real-world situations it is hard to tell why voters respond to salient public information. In particular, it is difficult to separate the importance of the way information is framed from its content, as typically the two come together.4 This experiment is designed precisely to overcome this challenge.
I begin with the canonical majority rule committee setting, where voting aggregates members’ independent signals about the state of the world [9,10]. When in addition a public signal is observed by everyone, voters could use the public information as an information device (depending on accuracy) or as a coordination device (regardless of accuracy). In a recent paper, Reference [11]—henceforth KV—noticed that if the public signal is more precise than each private signal, then majority rule no longer leads to an equilibrium in which every voter always votes according to the private signal. In this setting, there exist a responsive equilibrium where voters change their vote as a function of their own private signals with positive probability, for values of the public signal’s accuracy below a certain threshold. Moreover, for any relative accuracy of the two signals, (non-responsive) conformist equilibria exist where voters coordinate on the basis of the public information without considering their private signals.
To these two possible roles of the public signal—information and coordination—a laboratory experiment superimposes a third element: salience. Subjects face structurally equivalent games which differ in the salience of the information provided. One salience treatment is designed to explicitly capture subjects’ attention, by emphasizing the information with graphics and music. Another treatment changes the relative timing of private and public signals. If subjects behaved according to the equilibrium predictions, their behavior would not change substantially across different salience treatments. If, on the other hand, subjects were to process information according to salience bias, we would expect more votes for the public signal when this is salient.
The experimental results show that subjects’ behavior is responsive to signals’ precision: when the public signal is more accurate than the private, subjects follow it more than when it is less accurate than the private one. Yet, the behavior observed is far from the responsive equilibrium predictions. Subjects’ behavior also contradicts the coordination mechanism: although the conformist equilibrium is not responsive to signals’ relative precision, subjects’ behavior is. Results, instead, point towards the role of salience of information. In particular, the order of message delivery matters: subjects tend to follow the public signal more when it is the most recent signal observed before voting. Recency has a substantive and statistically significant impact on subjects’ behavior: in all the experimental sessions subjects follow the most recent signal (the last signal observed before voting) of the time, regardless of the signal’s precision. Moreover, recency has a striking homogeneous effect: the proportion of votes with the public signal under the recency treatment is greater than the proportion of votes with the public signal when this is displayed before the private one, for almost every subject in the experiment and regardless of signals’ relative accuracy. Interestingly, this result is robust to additional sessions where subjects do not vote in committees over issues of common interest, making individual choices instead. Finding the same behavior in the individual sessions suggests that coordination on public information does not explain subjects’ behavior.
This paper relates to the literature studying salience bias in voters’ decisions. In particular, recency effects have been studied in the context of electoral campaigns. Reference [12] analyze a sender-receiver game connecting the timing of information release with voter beliefs prior to elections. They formally derive an equilibrium in which fabricated scandals are only released close to the election date, and confirm their equilibrium prediction using data on the release of US presidential scandals. Timing of message delivery in electoral campaigns has also been the subject of field experiments [13,14]. Reference [13] studies the effect of phone calls by volunteers on voter turnout. The experiment shows how calls made during the final days prior to the election are most effective in mobilizing voters, and that the specific content of the conversation is less important than the timing of the call. This paper’s contribution is to provide a controlled experimental test of the role of salient public information on voting. While in field experiments it is hard to isolate the importance of salience from the informational content a message provides, this experimental design overcomes this challenge.
The paper also relates to the literature on committee decision making in voting experiments. Specifically, KV focus on the information and coordination mechanisms with private and public signals and show with a laboratory experiment that voters might be drawn to inefficient conformist equilibria where private information is ignored and voters conform to the public signal. While the main focus of this experiment is the role of salience of the public signals, some of the findings replicate the general result and other specific findings in KV: one treatment considers a public signal that is less precise than voters’ private signals, and another one presents the same public information as a common asymmetric prior instead of a public signal.
The fundamental contribution of this paper is its focus on the role of salience. The treatments are designed to raise the salience of the public message by changing when it is displayed (recency) and by using entertaining music and animations—which makes this experimental design unique. Interestingly, results show that salience treatment effects decayed over time. One interpretation of this result is that salience represents novelty, and as such it should decline with repeated treatments. Furthermore, it is noteworthy that the same salience effects hold when subjects face an individual-decision making problem, without involving groups or pivotality calculations.
Finally, the experiment shows that recency bias is a persistent presence in voters’ decision-making. When making important decisions such as voting, people may focus on features that are easy to process and vivid because available in short-term memory, rather than more informative but less salient ones. This bias in information processing can lead to suboptimal decisions. Knowing this, politicians and media can shift voters’ attention to events that take place at crucial times. As Oprah’s endorsement illustrated, endorsements are strategically timed to be maximally effective. The fact that such signals may be more effective the closer they are to voters’ decision is important, and a novel fining for empirical research on endorsements.
The remainder of the paper is organized as follows. The next section describes the theoretical model and equilibrium predictions. The following sections present experimental design and results. The last section concludes. Proofs, additional data and a copy of the experimental instructions are reported in Appendix A.
2. The Model
This section formally derives the theoretical predictions that are tested in the laboratory experiment. The same results have been derived in KV and Reference [15], and have been recently extended in Reference [16].
Consider a committee that consists of n members, where n is odd. Agents make a collective decision over two alternatives. The state of the world is ∈. Both events are ex ante equally likely: , where is the common prior.
Each agent casts a vote for one of the two alternatives :5 we define the individual vote if the agent votes in favor of alternative A, and otherwise. The committee decides by majority voting. Committee members have identical preferences, and payoffs are normalized without loss of generality to 0 or 1. Specifically, I denote by the utility to voter i of decision d in state and assume and for each member of the committee. This means each agent wants the collective decision to match the state of the world.
Agents receive two pieces of information before voting: a private and a public signal. The private signal is denoted by . The probability of the signal matching the state is symmetric across the two states and given by . The public signal is denoted by , with . Private signals are conditionally independent across voters, and the public signal is conditionally independent from the private signals.
Notice that, without public signals, there exists an equilibrium where each voter follows her private signal and—as the number of committee members grows—the probability that the majority takes the correct decision tends to one [9,10].
The timing of the game is as follows:
- Nature determines the state of the world .
- Each voter observes a private signal and the public signal (observed by everyone).
- Agents cast their votes and the collective decision d is determined according to the majority of votes.
- The true state is revealed and agents receive their payoffs.
A (mixed) voting strategy defines the probability that each agent votes for the public signal , given the realization of both private and public signals. For instance, indicates the probability that i votes for B given that and .
The next section considers how voting behavior changes depending on the signals agents receive. Agent i’s vote depends on the content of the two signals observed, and whether they agree () or disagree (). Notice that the case is equivalent to , because the model is symmetric with respect to the two states A and B. Similarly, is equivalent to .
Equilibrium Analysis
Define by the probability that a voter votes according to the public signal when the two signals agree, and the probability that she votes according to the public signal when private and public signals disagree.
Definition 1.
A voting strategy is symmetric if and for every i.
Definition 2.
A voting strategy is responsive if for every .
Definition 3.
A profile of strategies is more informative than if
That is, an equilibrium is more informative than another if it uses more information and gets to the right decision more often. I will first restrict the analysis to the most informative symmetric equilibrium, which can be (but not necessarily is) responsive to private information. In a symmetric responsive equilibrium, voters’ strategies are sensitive to private signals (and all individuals use the same strategy).
The first result shows that, when the public signal’s precision is low enough, in the most informative equilibrium voters always follow the private signal.
Lemma 1.
When , the most informative symmetric equilibrium is the unique responsive equilibrium where agents always vote with their private signal.
Proof.
All proofs are in the Appendix A, unless otherwise noted. □
To get the intuition for Lemma 1, consider the decision of a voter. Under the event of pivotality, half of the other voters vote for A and half for B. The voter observes the public and private signals, which differ. Given that the other votes are collectively uninformative, the voter follows the most precise signal between the private and the public. Hence, if the private signal is more precise than the public one, following the public signal is strictly dominated.
In what follows, consider the case in which the public signal is more precise than the private, that is, . The next result shows that there exist a mixed strategy equilibrium in which voters follow the public signal with positive probability (smaller than one), provided that the precision of the public signal is lower than a threshold, , defined below.
Proposition 1
(Symmetric Responsive Equilibrium). When the most informative symmetric equilibrium is the unique responsive equilibrium where when private and public signals agree; when private and public signals disagree, agents vote according to the public signal with probability
where . The threshold is given by
Notice that the voting profile described by Proposition 1 prescribes to vote according to the public signal with positive probability only if . When , Lemma lemma 1 shows that the voter’s dominant strategy is to follow the private signal. The last case to consider is when the public signal precision is above .
Corollary 1.
When there exists no symmetric responsive equilibrium, and in the most informative symmetric equilibrium agents always vote with the public signal.
We can summarize the predictions for the most informative symmetric equilibrium as follows:
- if , players’ best response is to follow both signals
- if , then:
- (a)
- if , always follow the private signal (),
- (b)
- if , follow with probability ,
- (c)
- if always follow the public signal ().
Besides the most informative symmetric equilibrium, which can be responsive or not, there exist other symmetric equilibria where voters conform to the public signal. Notice that these equilibria are not responsive, that is, agents do not change their vote as a function of their own signal with positive probability.
Proposition 2
(Conformist Equilibrium). There exists a symmetric Bayesian Nash equilibrium in which every agent votes according to (against) the public signal.
Proof.
Consider the choice of an individual i. If every other agent votes according to (against) the public signal, agent i is not pivotal and therefore she is indifferent about which alternative to vote for. Thus every agent voting according to (against) the public signal is an equilibrium. □
Conformist equilibria can be very inefficient, especially when the public signal is below the threshold determined above. That is, introducing a public signal may be deleterious because the public signal might be seen as a focal point which makes coordination easier for committee members, thus hindering information aggregation.
In addition to the two symmetric equilibria in Proposition 2, there exist several asymmetric ones where voters conform to the public signal.6 However, these equilibria do not seem to be very plausible. In particular, as described in the experimental setting below, groups are randomly matched in each period: because it is difficult to coordinate on asymmetric equilibria with random matching, these asymmetric equilibria are very unlikely to emerge.
3. Experimental Design
The experiment is designed to answer two questions. The first asks to what extent subjects’ behavior responds to signals’ precision. In particular, the experiment tests whether subjects vote according to the public signal when they know that it is less precise than their private ones. The first treatment of interest changes the relative precision of the private and public signals. Since there is no evidence of learning in the data (see Appendix A), I report the results below aggregating over all rounds of the same treatment. The second question asks how salience of public information affects voting behavior. To understand the impact of salience, I create five structurally equivalent games (corresponding to different treatments), in which public information is provided in different ways.
The experiment was organized in ten separate sessions, all held at the Columbia Experimental Laboratory (CELSS). Subjects were registered students, recruited through the laboratory web site. No subject participated in more than one session. Overall, 157 subjects participated in the experiment. The experiment was conducted using the software Z-Tree [17], and a copy of the instructions is presented in Appendix A. Each session lasted about one hour, and earnings ranged from to , with an average of (including a show-up fee).
Each session was comprised of 70 rounds. In every round, participants were randomly matched with each other to form a committee of 5 members.7 Subjects were told that their group’s task was to find a prize (worth 70 experimental dollars) which was hidden in one of two boxes, one red, one blue. The computer placed the prize in the red box with probability , and each subject received two pieces of information: a private message and a public message. To make clear that the public message was common knowledge, all public messages were displayed on the two central screens of the laboratory. The private messages were displayed on each subjects’ monitor. After receiving the information, subjects voted for either the red box or the blue box.8 The alternative that received the majority of votes was selected. After every round, subjects received feedback about the number of votes cast by their group for the red and blue box, whether the group decision was correct or not, and their earnings for the round. Individual payoffs were based on whether the group decision was correct or incorrect: 70 experimental dollars for each correct decision, 10 experimental dollars for a wrong decision. Subjects were paid the sum of their round earnings.
Table 1 shows which sessions had high public signal accuracy (), and low (). The accuracy of the private signal was set to throughout all sessions. The committee size was set to for the entire experiment. For these parameters, the equilibrium predictions for the symmetric responsive equilibrium are to follow the public signal of the time when this is more precise than the private (), and never follow it when . According to the equilibrium in which subjects coordinate on (against) the public signal, everybody (nobody) follows the public signal when the two signals disagree, even when the public signal is less accurate than the private.
In addition to testing how subject behavior changes with signal relative accuracy, this experiment studies how salience affects voting decision. Salience is defined along two dimensions. The first is recency, or timing relative to voting. I hypothesize that subjects follow more the message that is closer to the vote, because they have the information more readily available in their short-term memory [18,19,20]. The second dimension refers to how information is presented. Information that is visibly stunning is salient, because individuals focus more on items that are striking and perceptible [21]: as a consequence, subjects should overemphasize the information on which their minds focus.9 The experimental treatments varying the two dimensions of recency and emphasis are described below.
Recency. This treatment varied whether the public signal was displayed before or after the private signal.
Asymmetric Prior. The least salient way to convey the public message is not to show it at all. This treatment corresponds to the last 10 rounds of each session. In these rounds, an asymmetric prior was provided instead of a symmetric ( prior, and no public signal was displayed. Subjects were told that the computer placed the prize in the blue box with probability (or , depending on the session), and in each round each subject received only a private signal. From a Bayesian standpoint, these ten rounds conveyed the same information as the previous ones: having a symmetric prior and a public signal with accuracy is identical to having an asymmetric prior and no public signal. After receiving the private message, subjects were asked to vote for one of the two boxes, as in the first part of the experiment.
Jingle. This treatment varied the way the public signal was projected on the central screens. In the absence of this treatment, the public signal was displayed with the picture of a blue or red box (as for the private signals projected on subjects’ monitors). With the jingle treatment, the public message was projected on the central screen with a video displaying a star jumping within an empty, white box, which then became either red or blue. The video was accompanied by a striking soundtrack, and to make the jingle treatment less repetitive, the music theme varied. I used famous music pieces such as Also sprach Zarathustra by Strauss, Eye of the tiger, The final Countdown, Thrift Shop and the Game of Thrones’ soundtrack.10 I hypothesize that salience of the public signal is increasing in both recency and emphasis.
Subjects in different sessions were presented with the same five treatments.11 Each subject played thirty rounds with the public signal displayed before the private, and thirty with the private displayed before the public. Among each of these thirty rounds, eight displayed the public message with the jingle, so that it is possible to evaluate the interaction between jingle and recency treatments. I decided to keep the number of jingle rounds small to ensure novelty and subjects’ interest. These conditions (recency, jingle) were randomly selected in every round, a feature designed to keep subjects engaged in the task. The only condition that was not randomly assigned is the asymmetric prior treatment, which consisted in the last ten rounds that every subject played. This design feature was chosen for feasibility, as it would not be possible to switch priors and signal structure in every round. Table 2 shows the number of rounds for each of the treatments.
4. Results
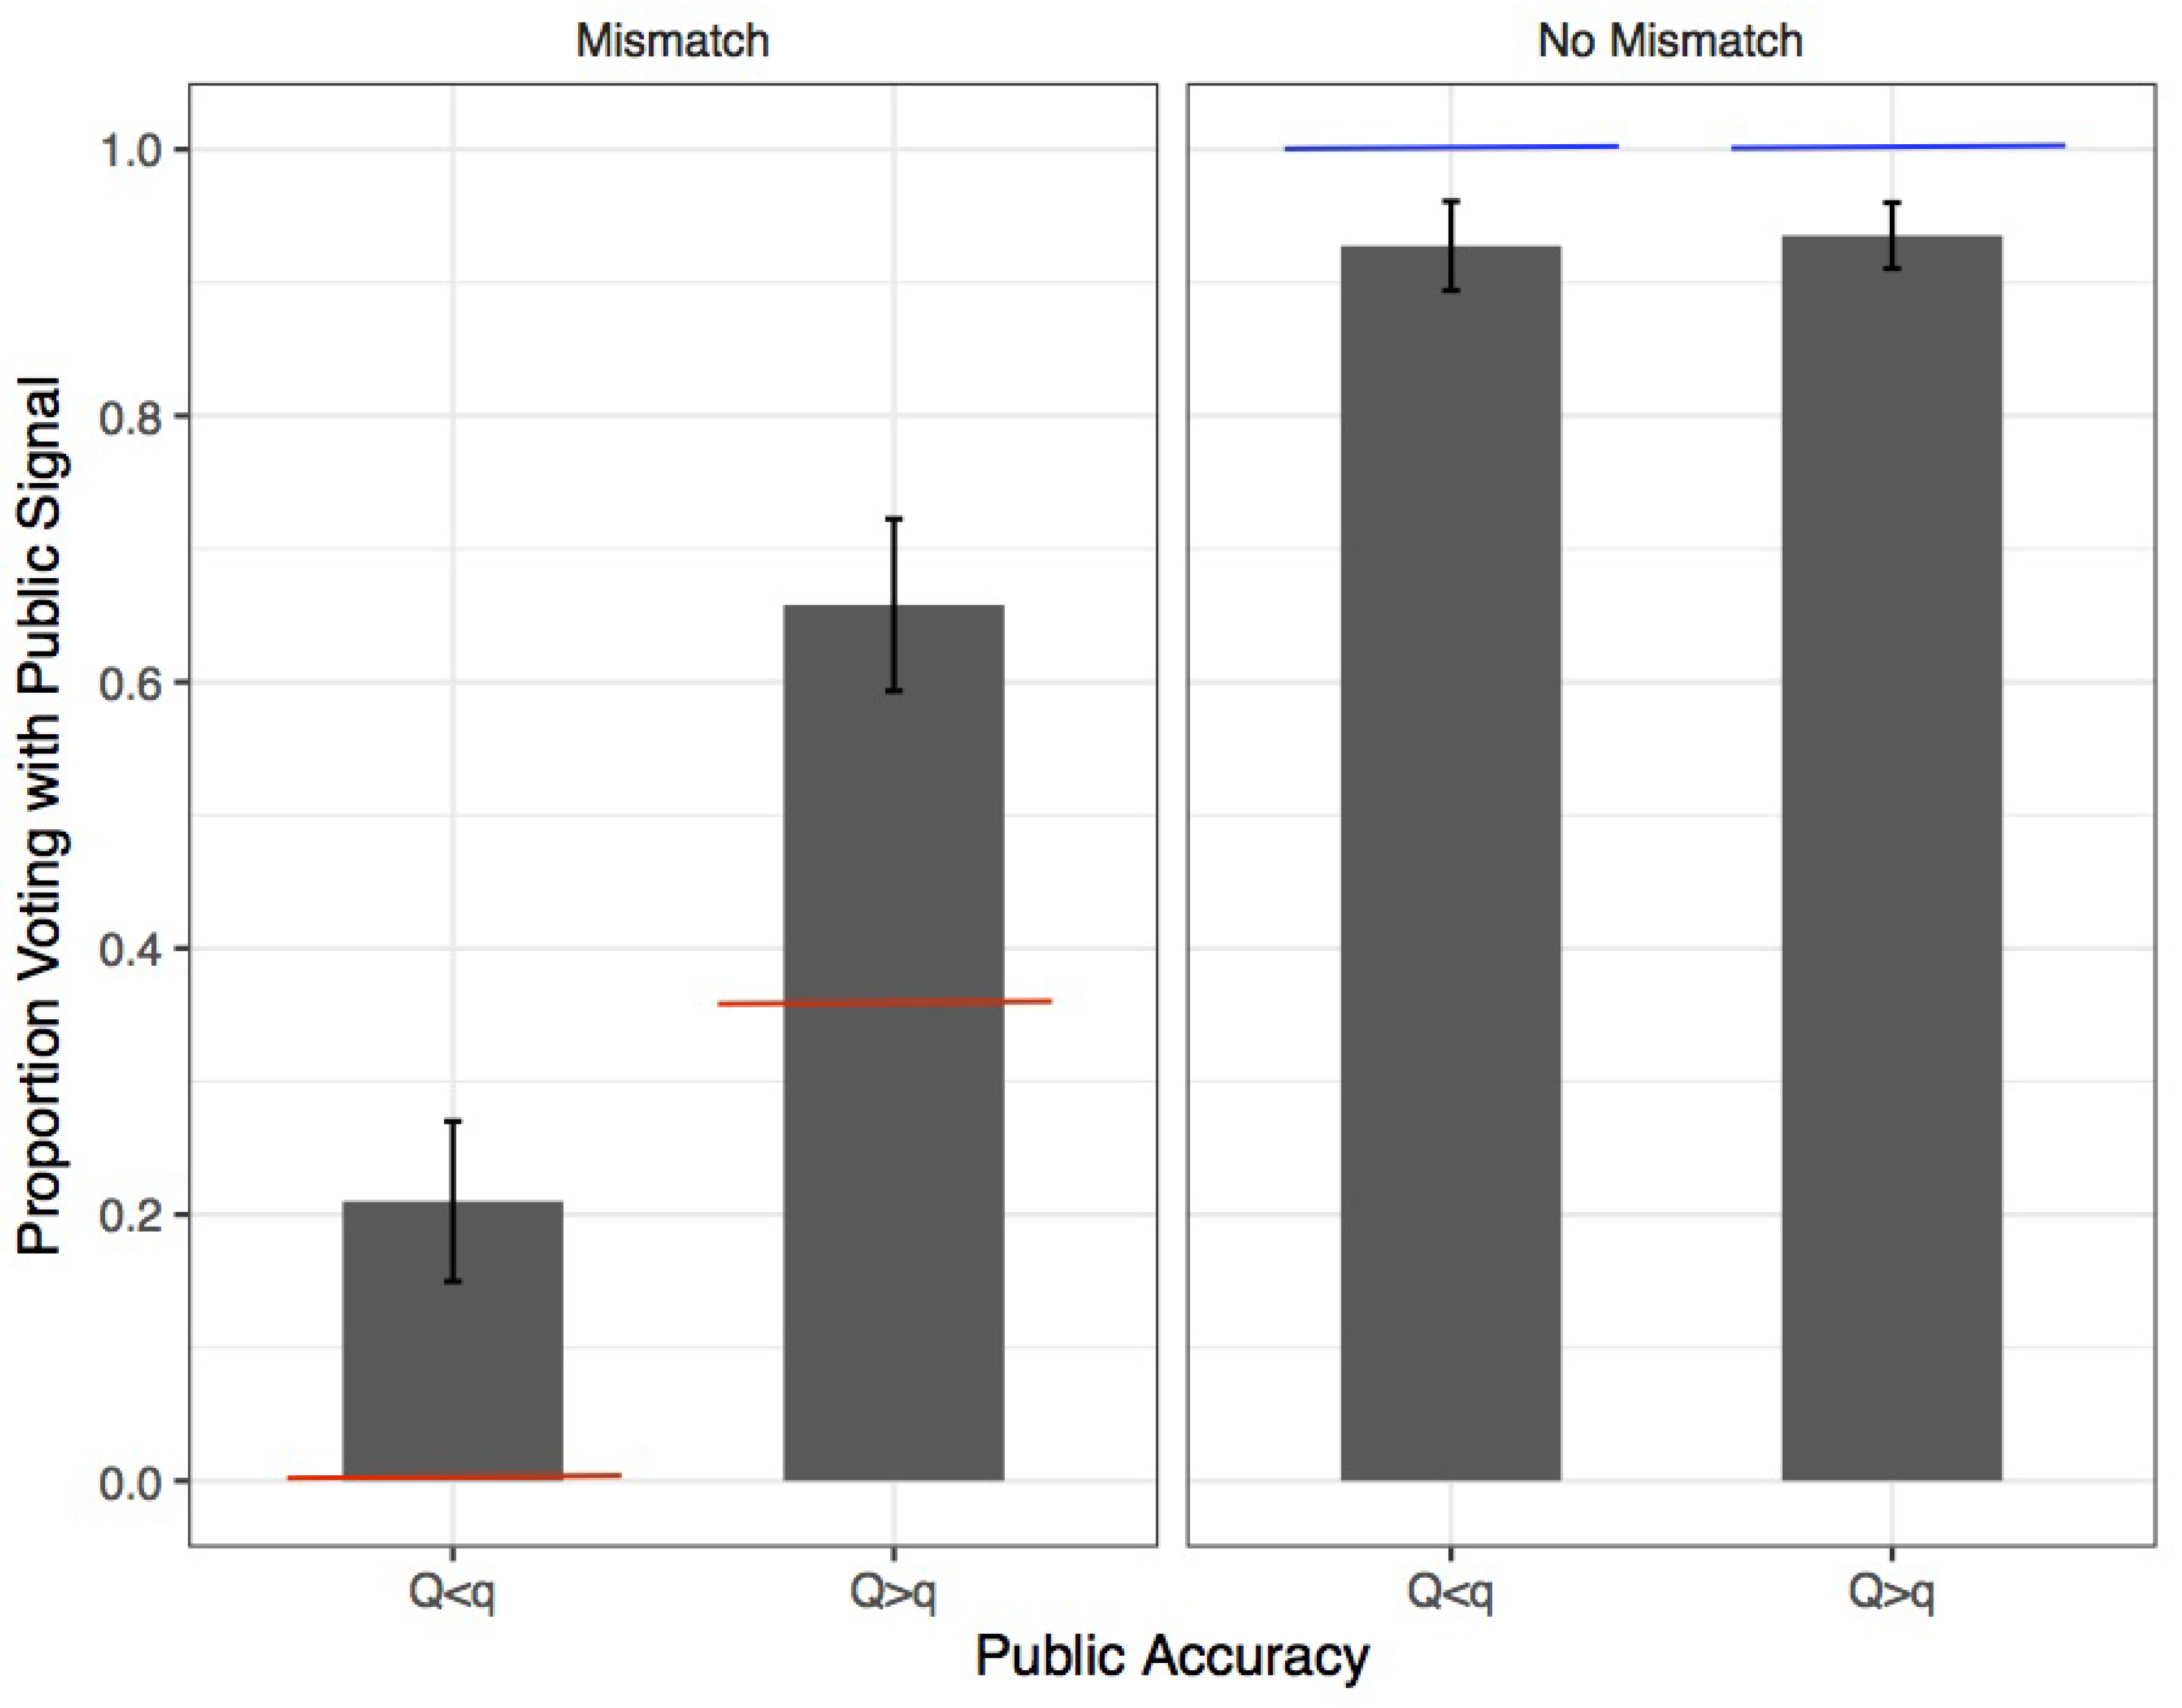
The first treatment of interest is designed to test whether subjects in committees follow more the public signal when it is more accurate than the private. I begin by aggregating the data across the salience treatments, given that salience is irrelevant according to the theory. Figure 1 displays the fraction of votes cast according to the public signal when the private and public signals disagree (estimated ), as well as when the two signals agree. The second panel gives us a measure of the extent of pure noise in the experiment.
The first thing to notice is that the treatment effect goes in the expected direction: subjects vote more with the public signal when this is more precise than the private one ( vs. , statistically significant at any conventional level). However, the observed behavior is far from the symmetric responsive equilibrium predictions (red line in Figure 1), as well as from the conformist equilibria. In particular, it is worth noting that of the subjects vote according to the public signal even when this is less precise than the private one, when the two disagree (left column, left plot). When presented with the trivial choice of voting after receiving two identical signals, subjects tend to vote according to both. Nevertheless, even in this case subjects commit mistakes, quantified in the right plot by the distance between the bars and the blue lines (less than ).
Given this result, the mechanism according to which voters follow public signals because of their informativeness seems to lack explanatory power.12 It might be that subjects are influenced by public information because of conformity, or because of bias in information processing. We know there exist two symmetric conformist equilibria with coordination on (or against) the public signal, and several asymmetric equilibria. However, all of these equilibria are not responsive to the relative precision of the two signals. Since we clearly see that the behavior of voters responds to signals’ relative precision (treatment effect in Figure 1), all the non-responsive equilibria do not reflect subjects’ behavior.
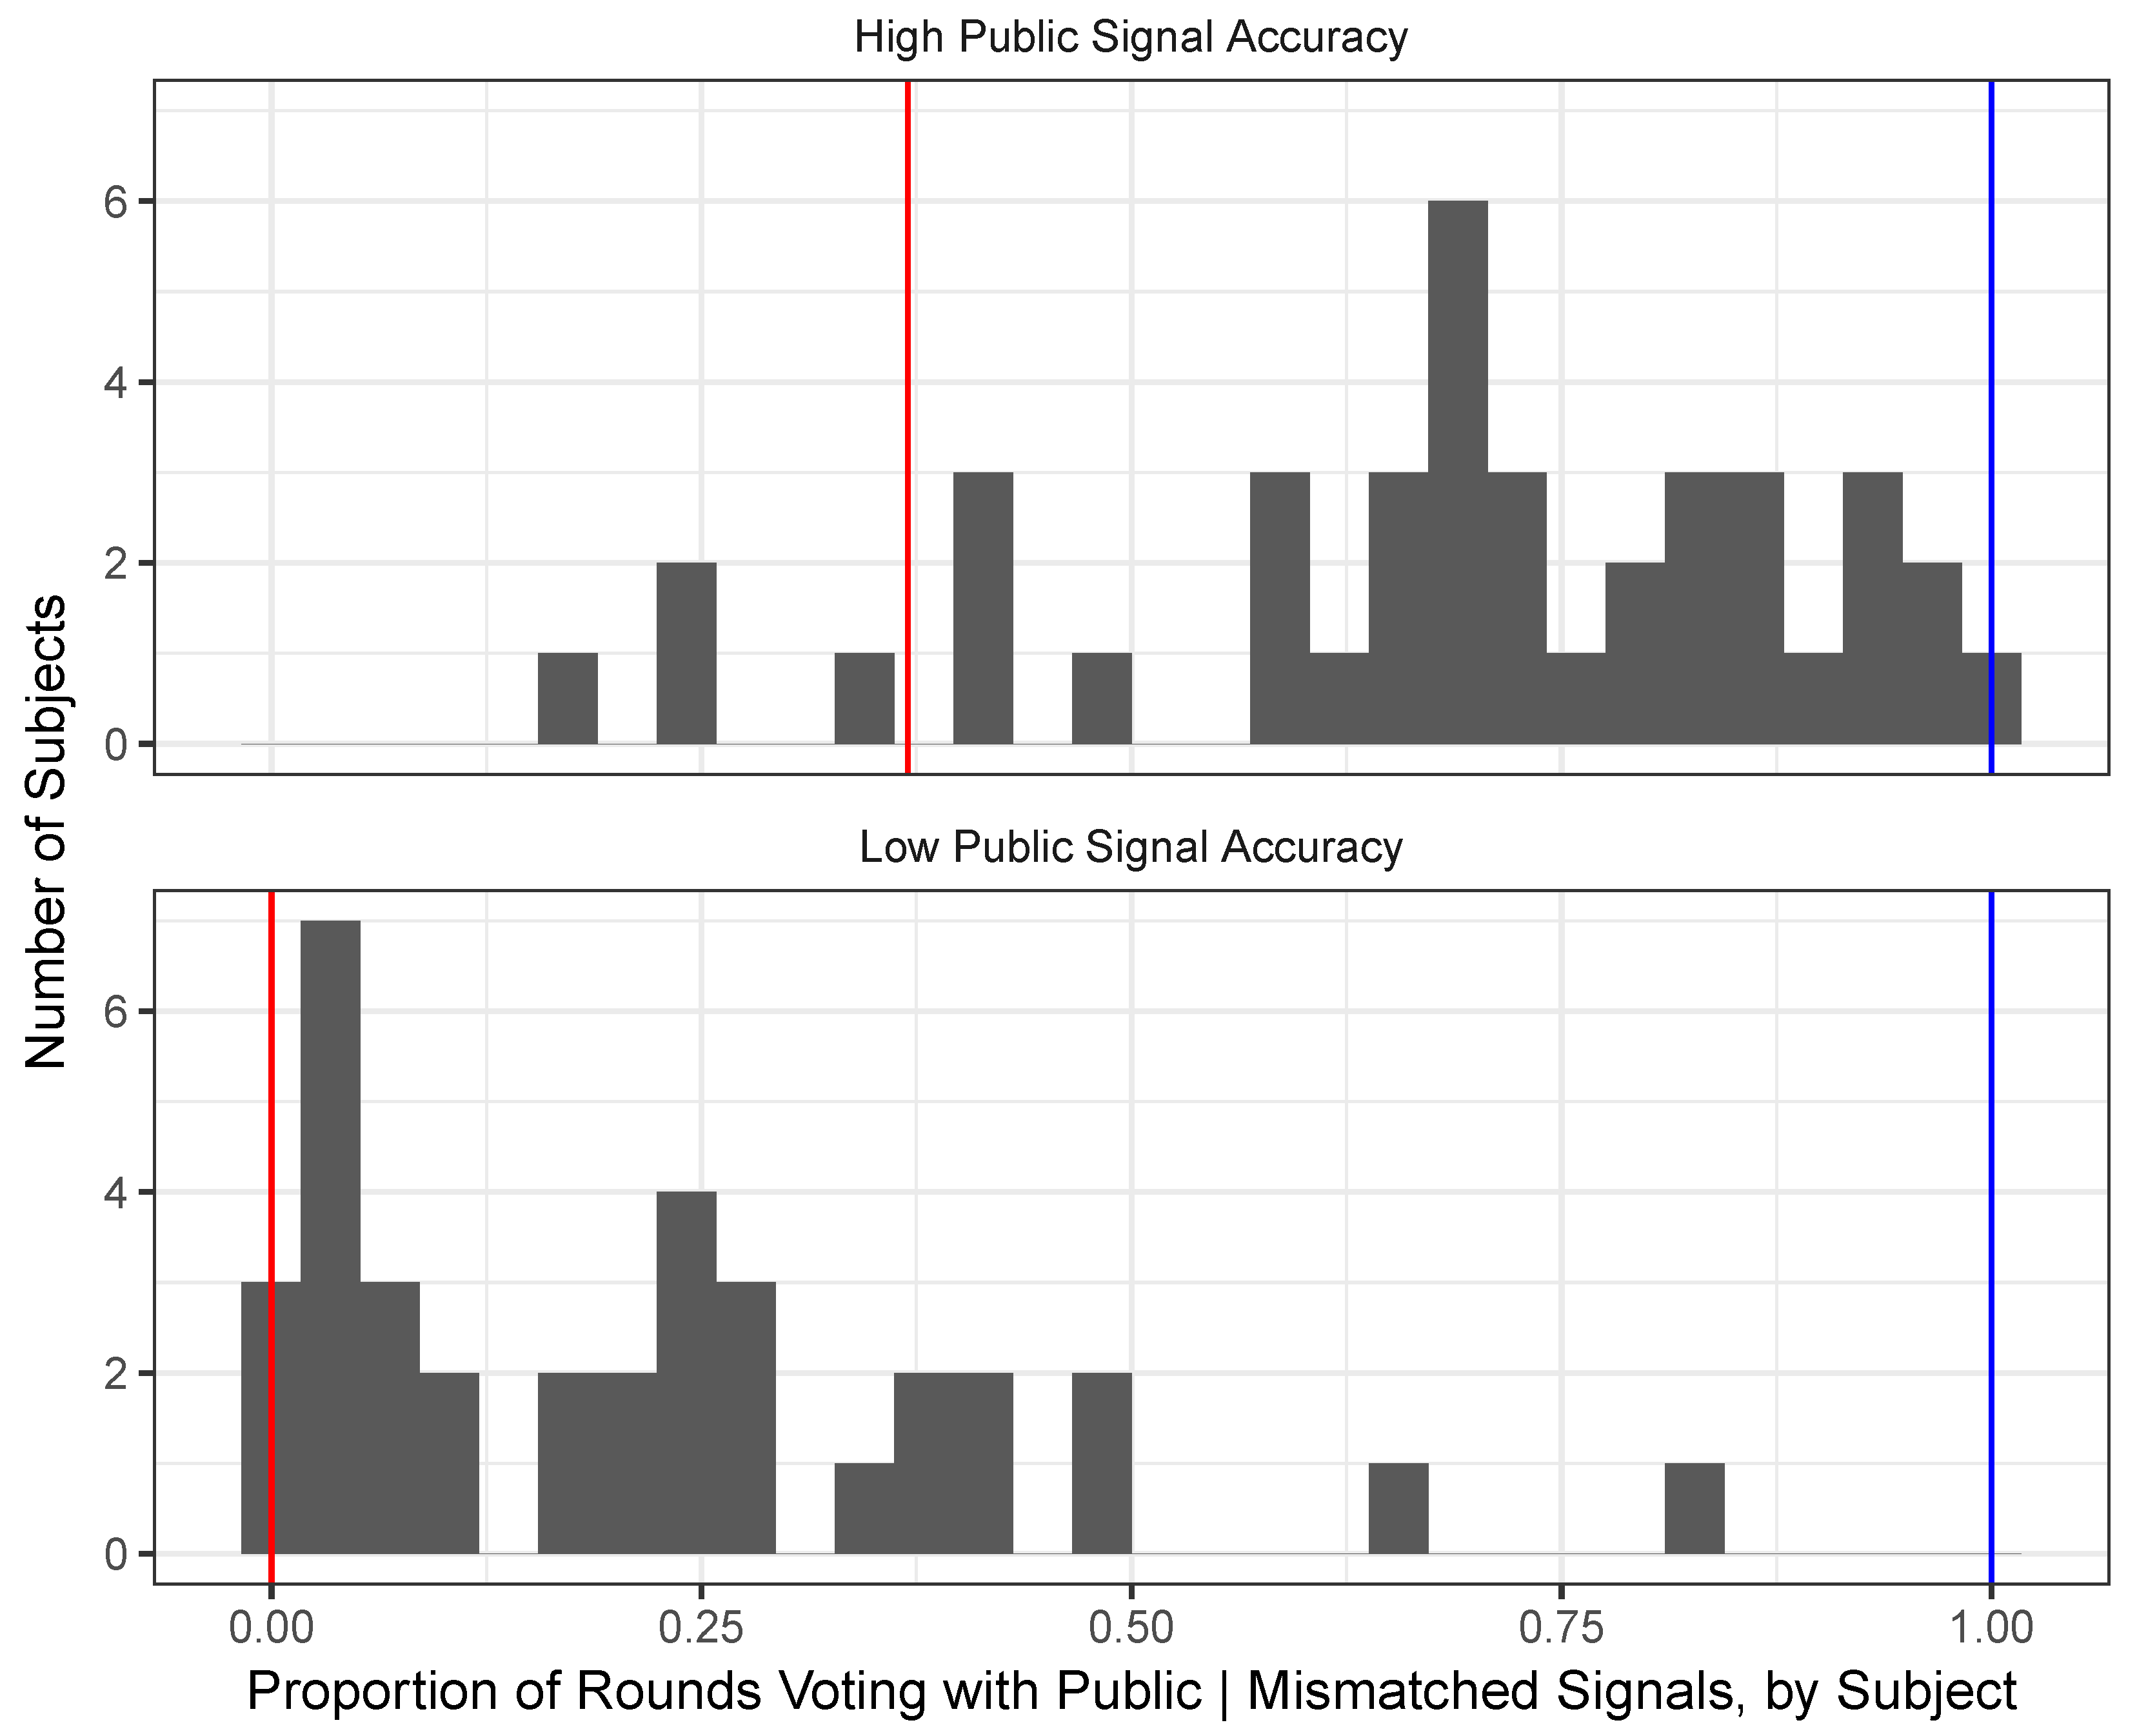
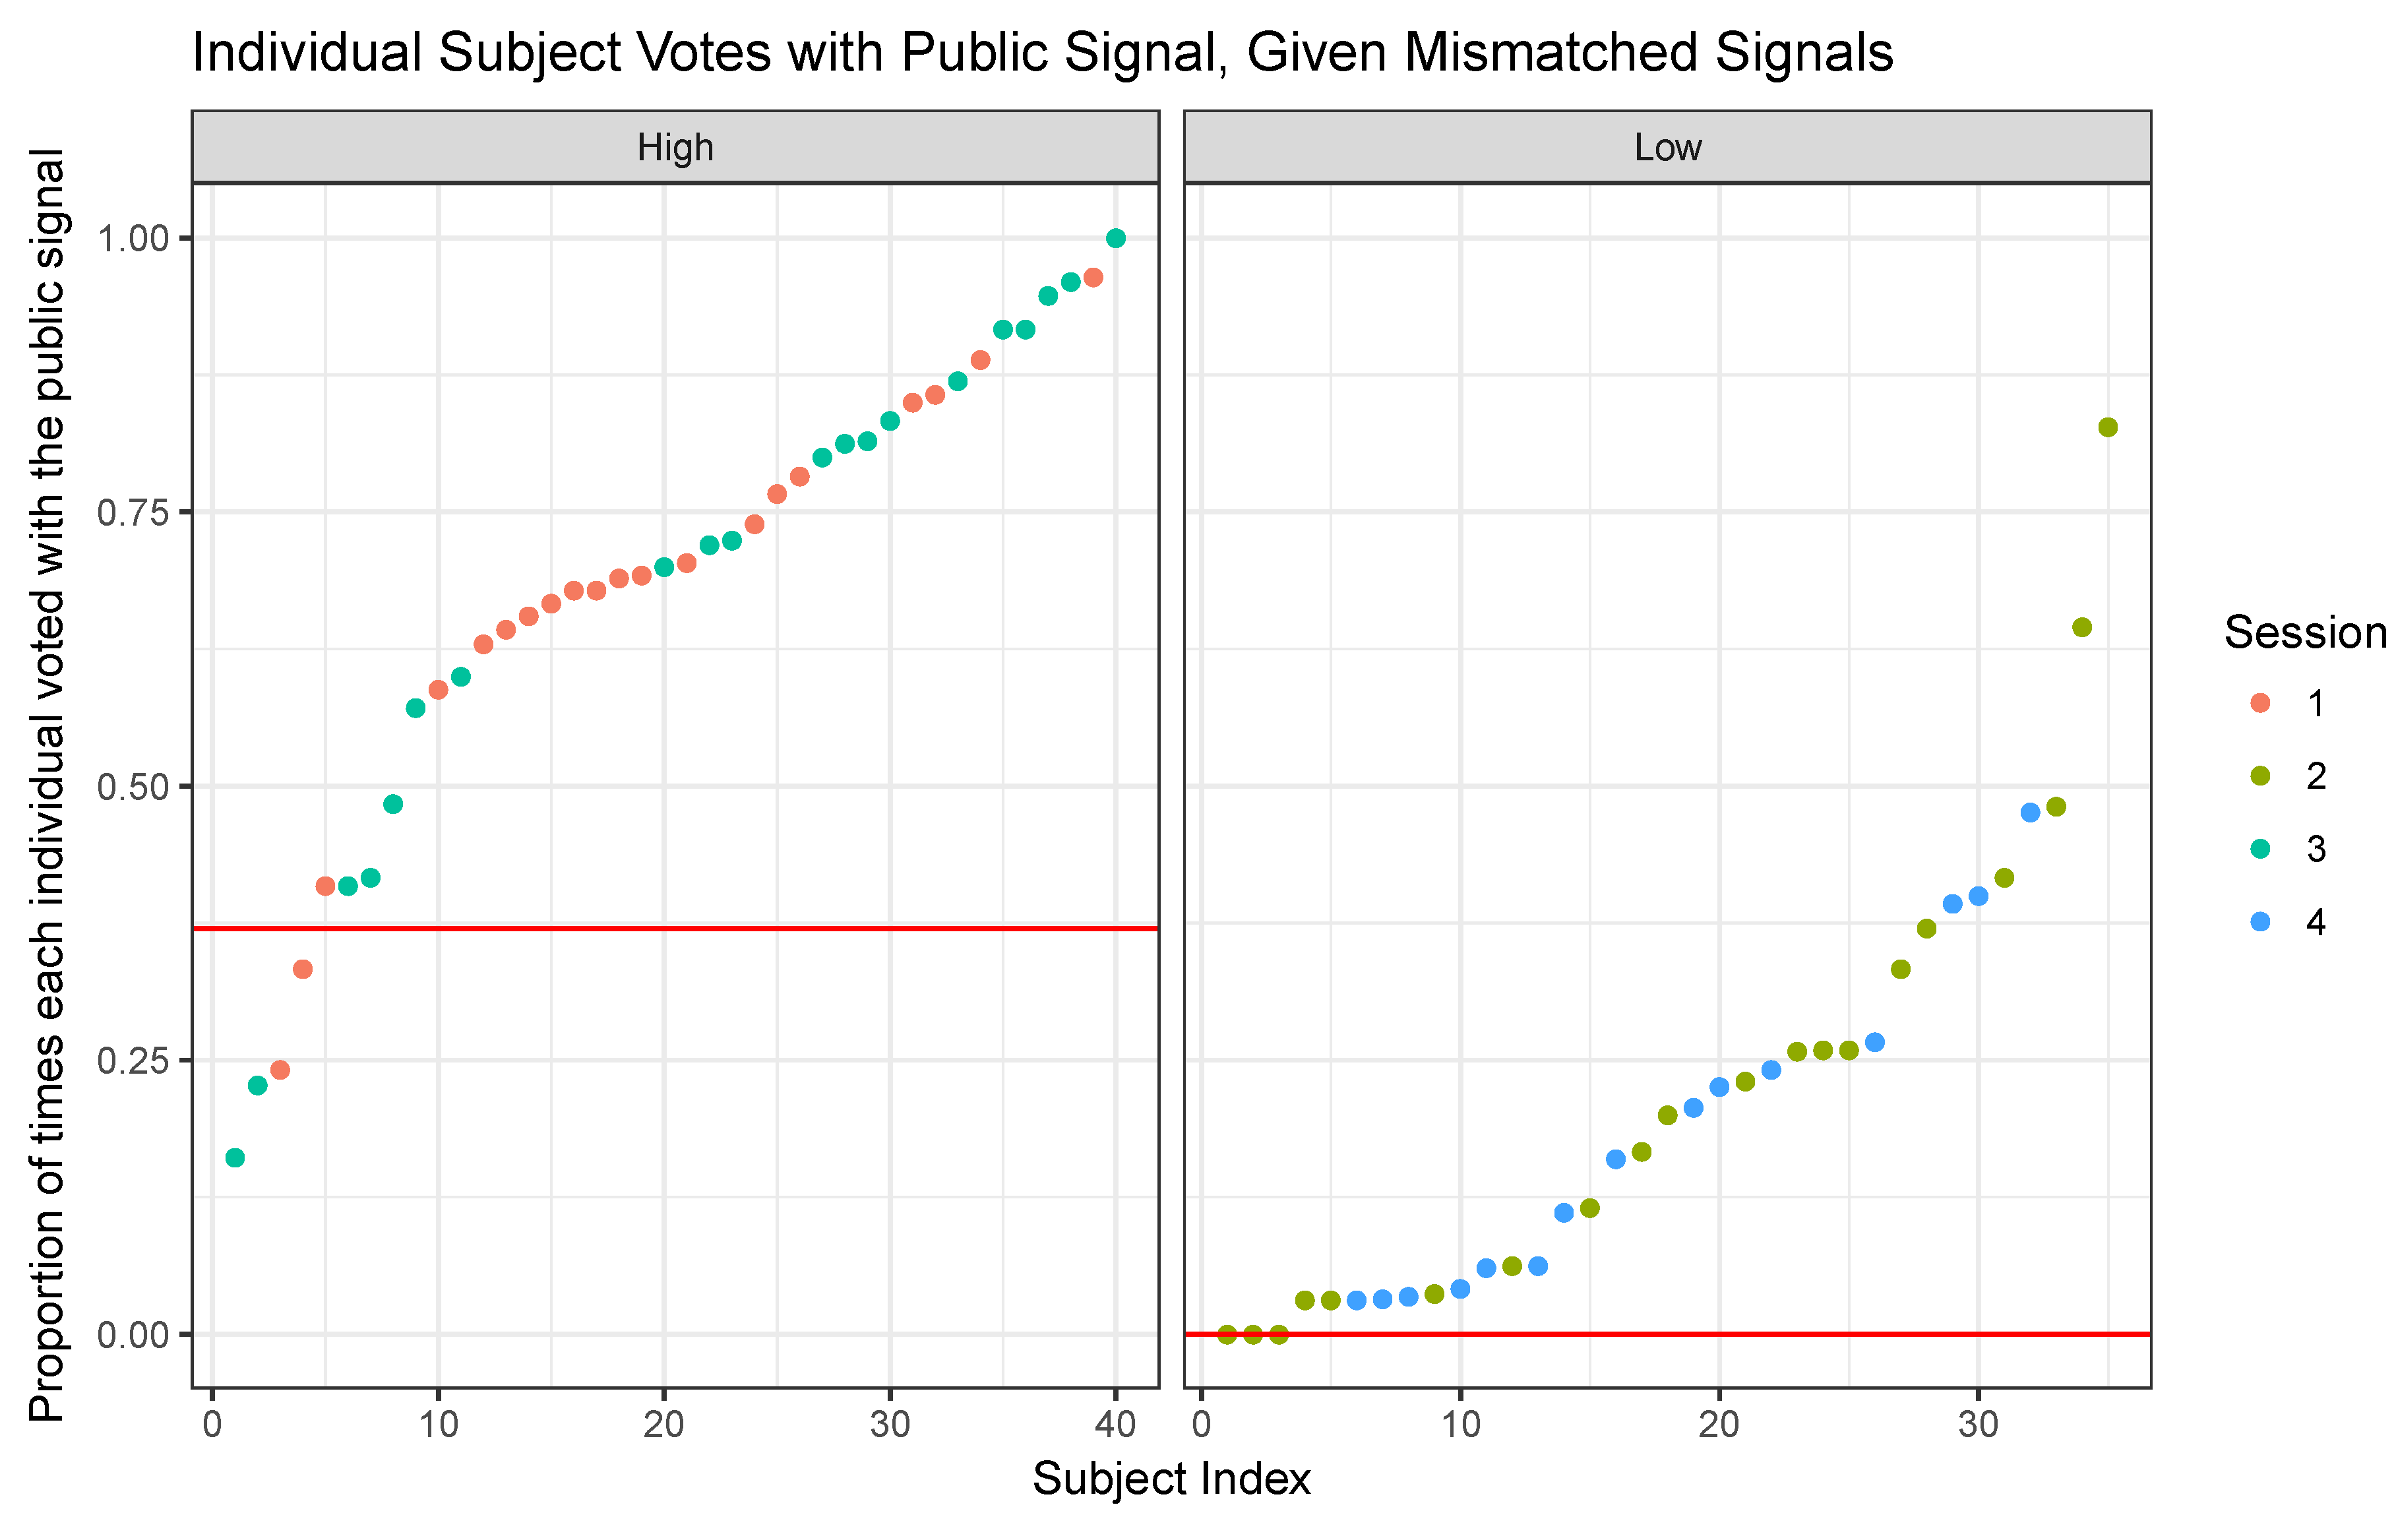
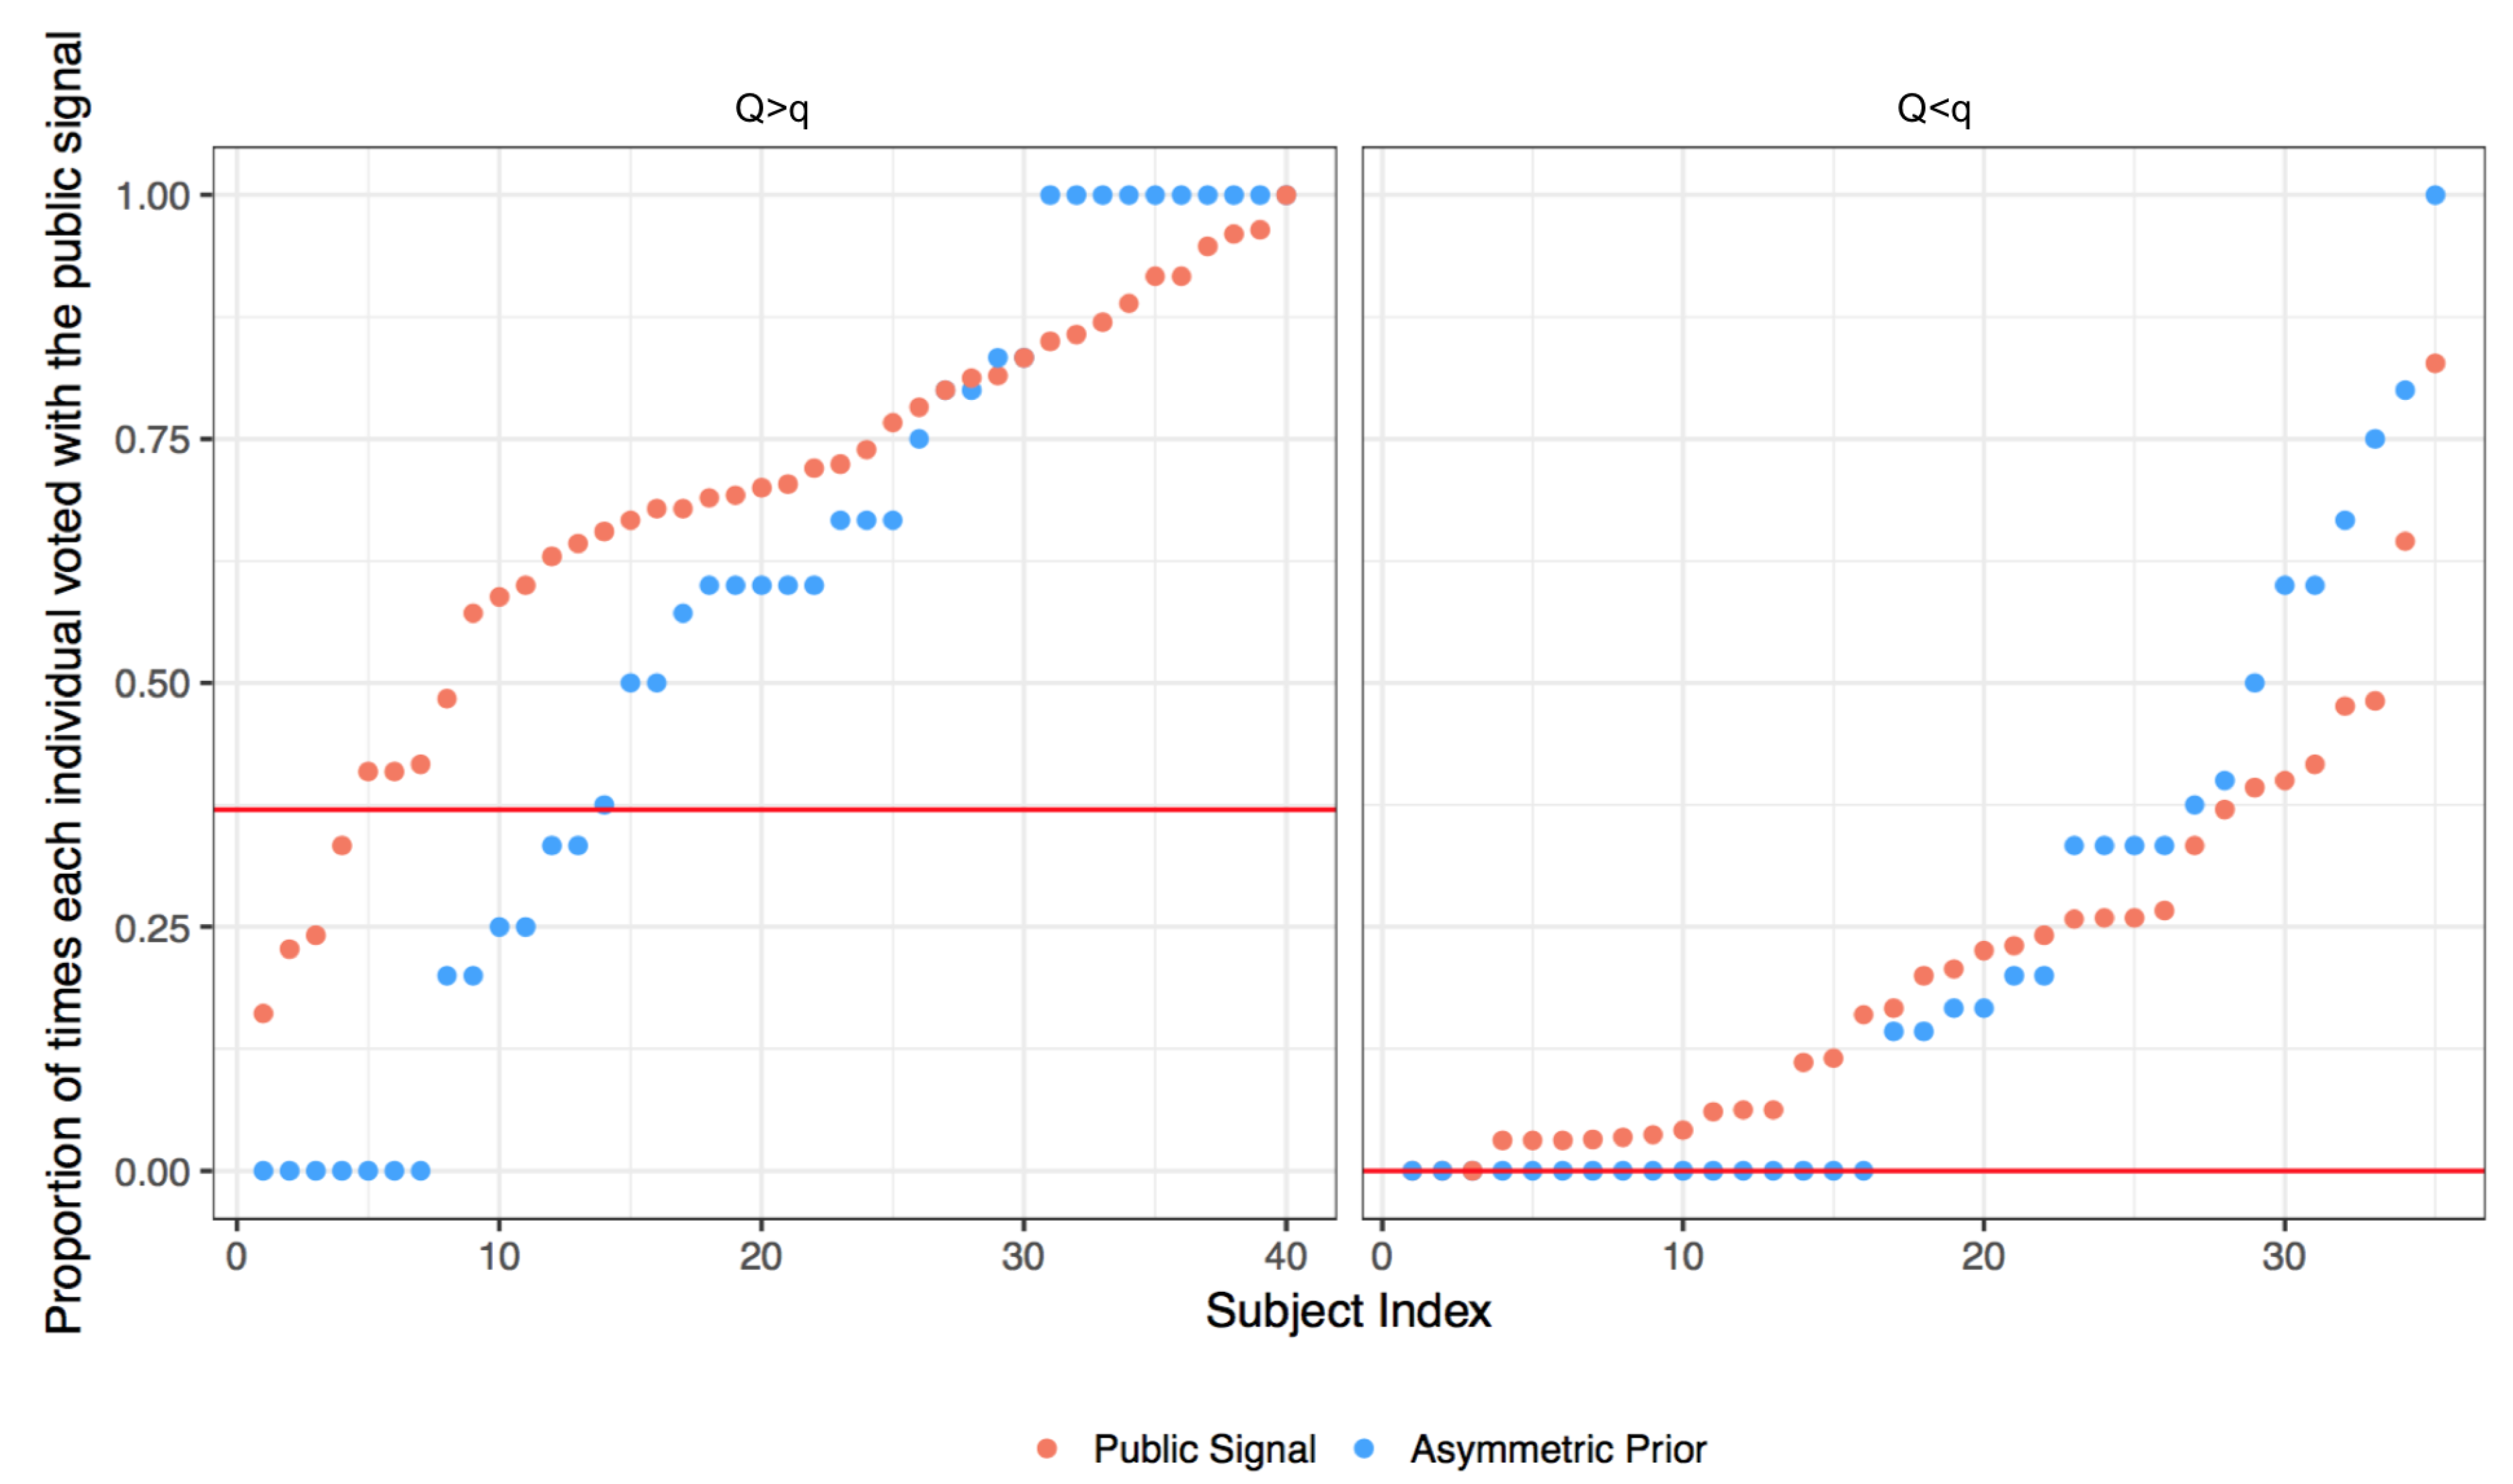
The results in Figure 1 can be disaggregated to shed light on individual behavior.13 Figure 2 plots the proportion of times each subject votes according to the public signal. We know that in the symmetric responsive equilibrium this proportion should be when and zero when (when the public and private signals disagree). On the other hand, were people playing the conformist equilibrium, the proportion would be close to one for both values of signal precision. Figure 2 show these equilibrium predictions and subjects’ deviations from them, which are bigger as the distance between the equilibrium predictions and the bars increase. This result again contradicts the coordination motive of players, as more subjects vote following the public signal when its precision is higher (upper graph) than when it is lower than the private one (lower graph).
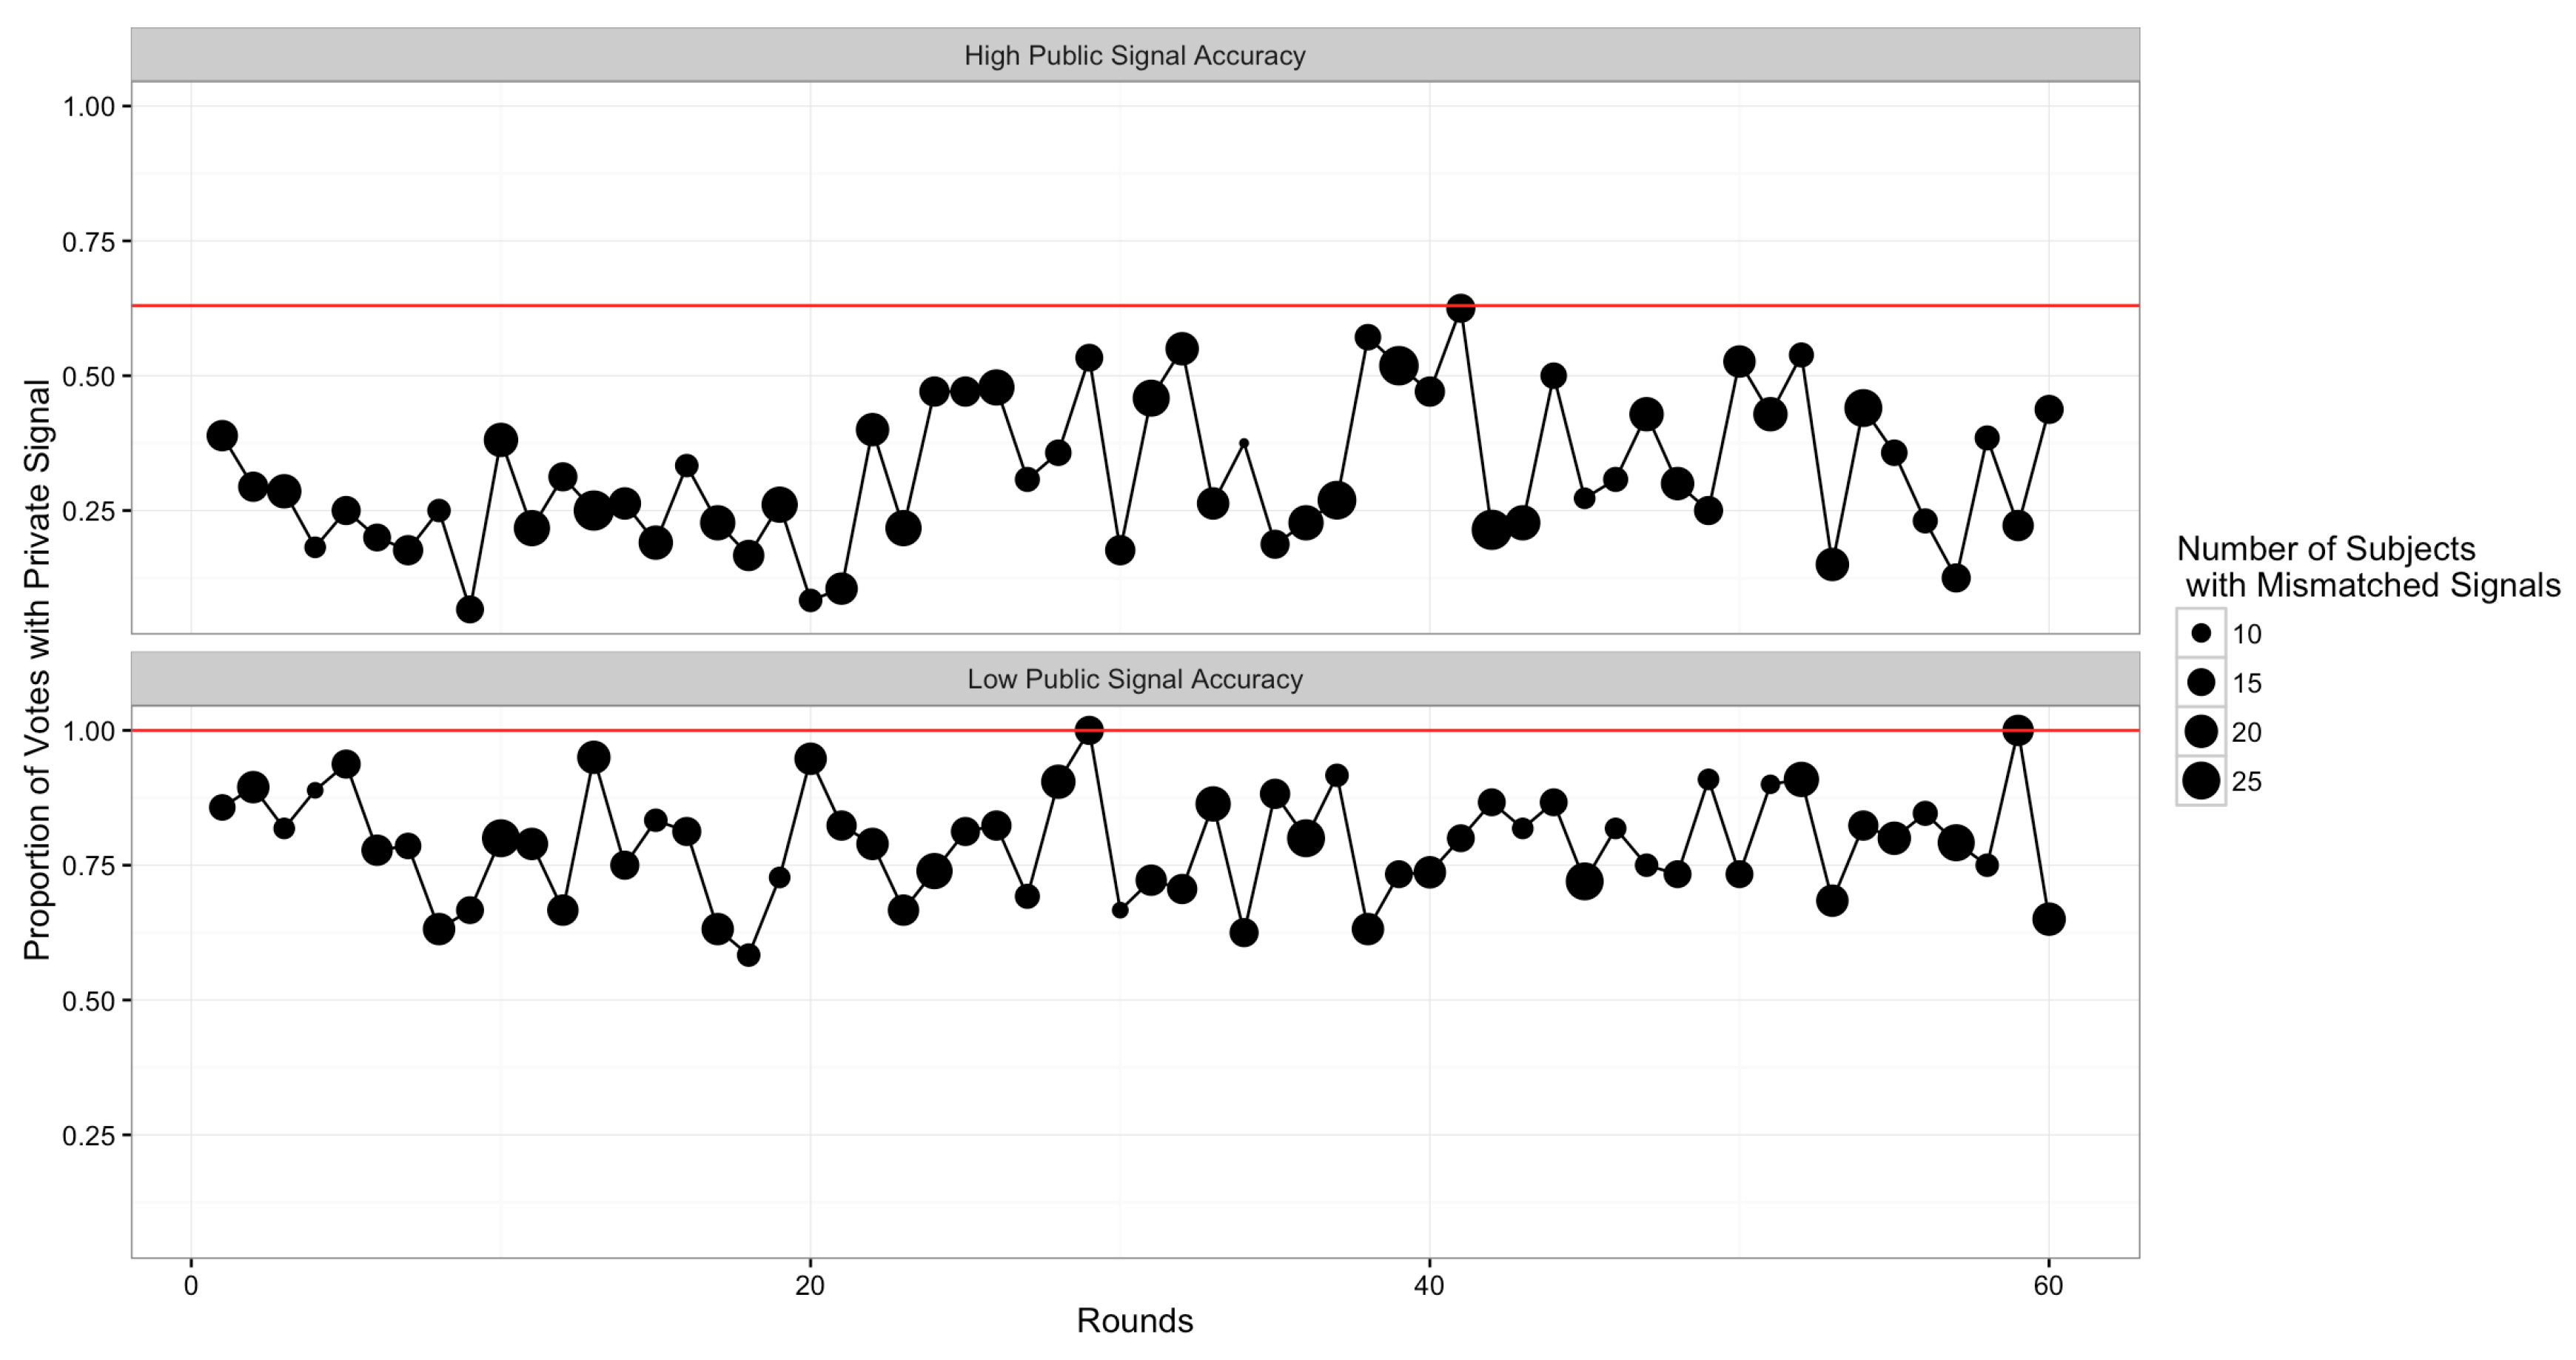
One concern that could arise is that subjects’ behavior changed over time, approaching the theoretical predictions of the equilibria analyzed. Figure A9 in Appendix A analyzes the dynamics of subjects’ behavior over time, showing that there is no convergence to equilibrium predictions as the final rounds approach.
The next section describes how subjects responded to salience of public signals. According to the salience mechanism, framing leads subjects to select a strategy based on the frame itself, even if it is strategically irrelevant.
4.1. Subjects’ Response to Salience
This section reports separately the results for each salience treatment, starting from the asymmetric prior, which is the treatment where the public message is least salient (as it is not displayed at all), and continuing with the more salient treatments (recency and jingle).
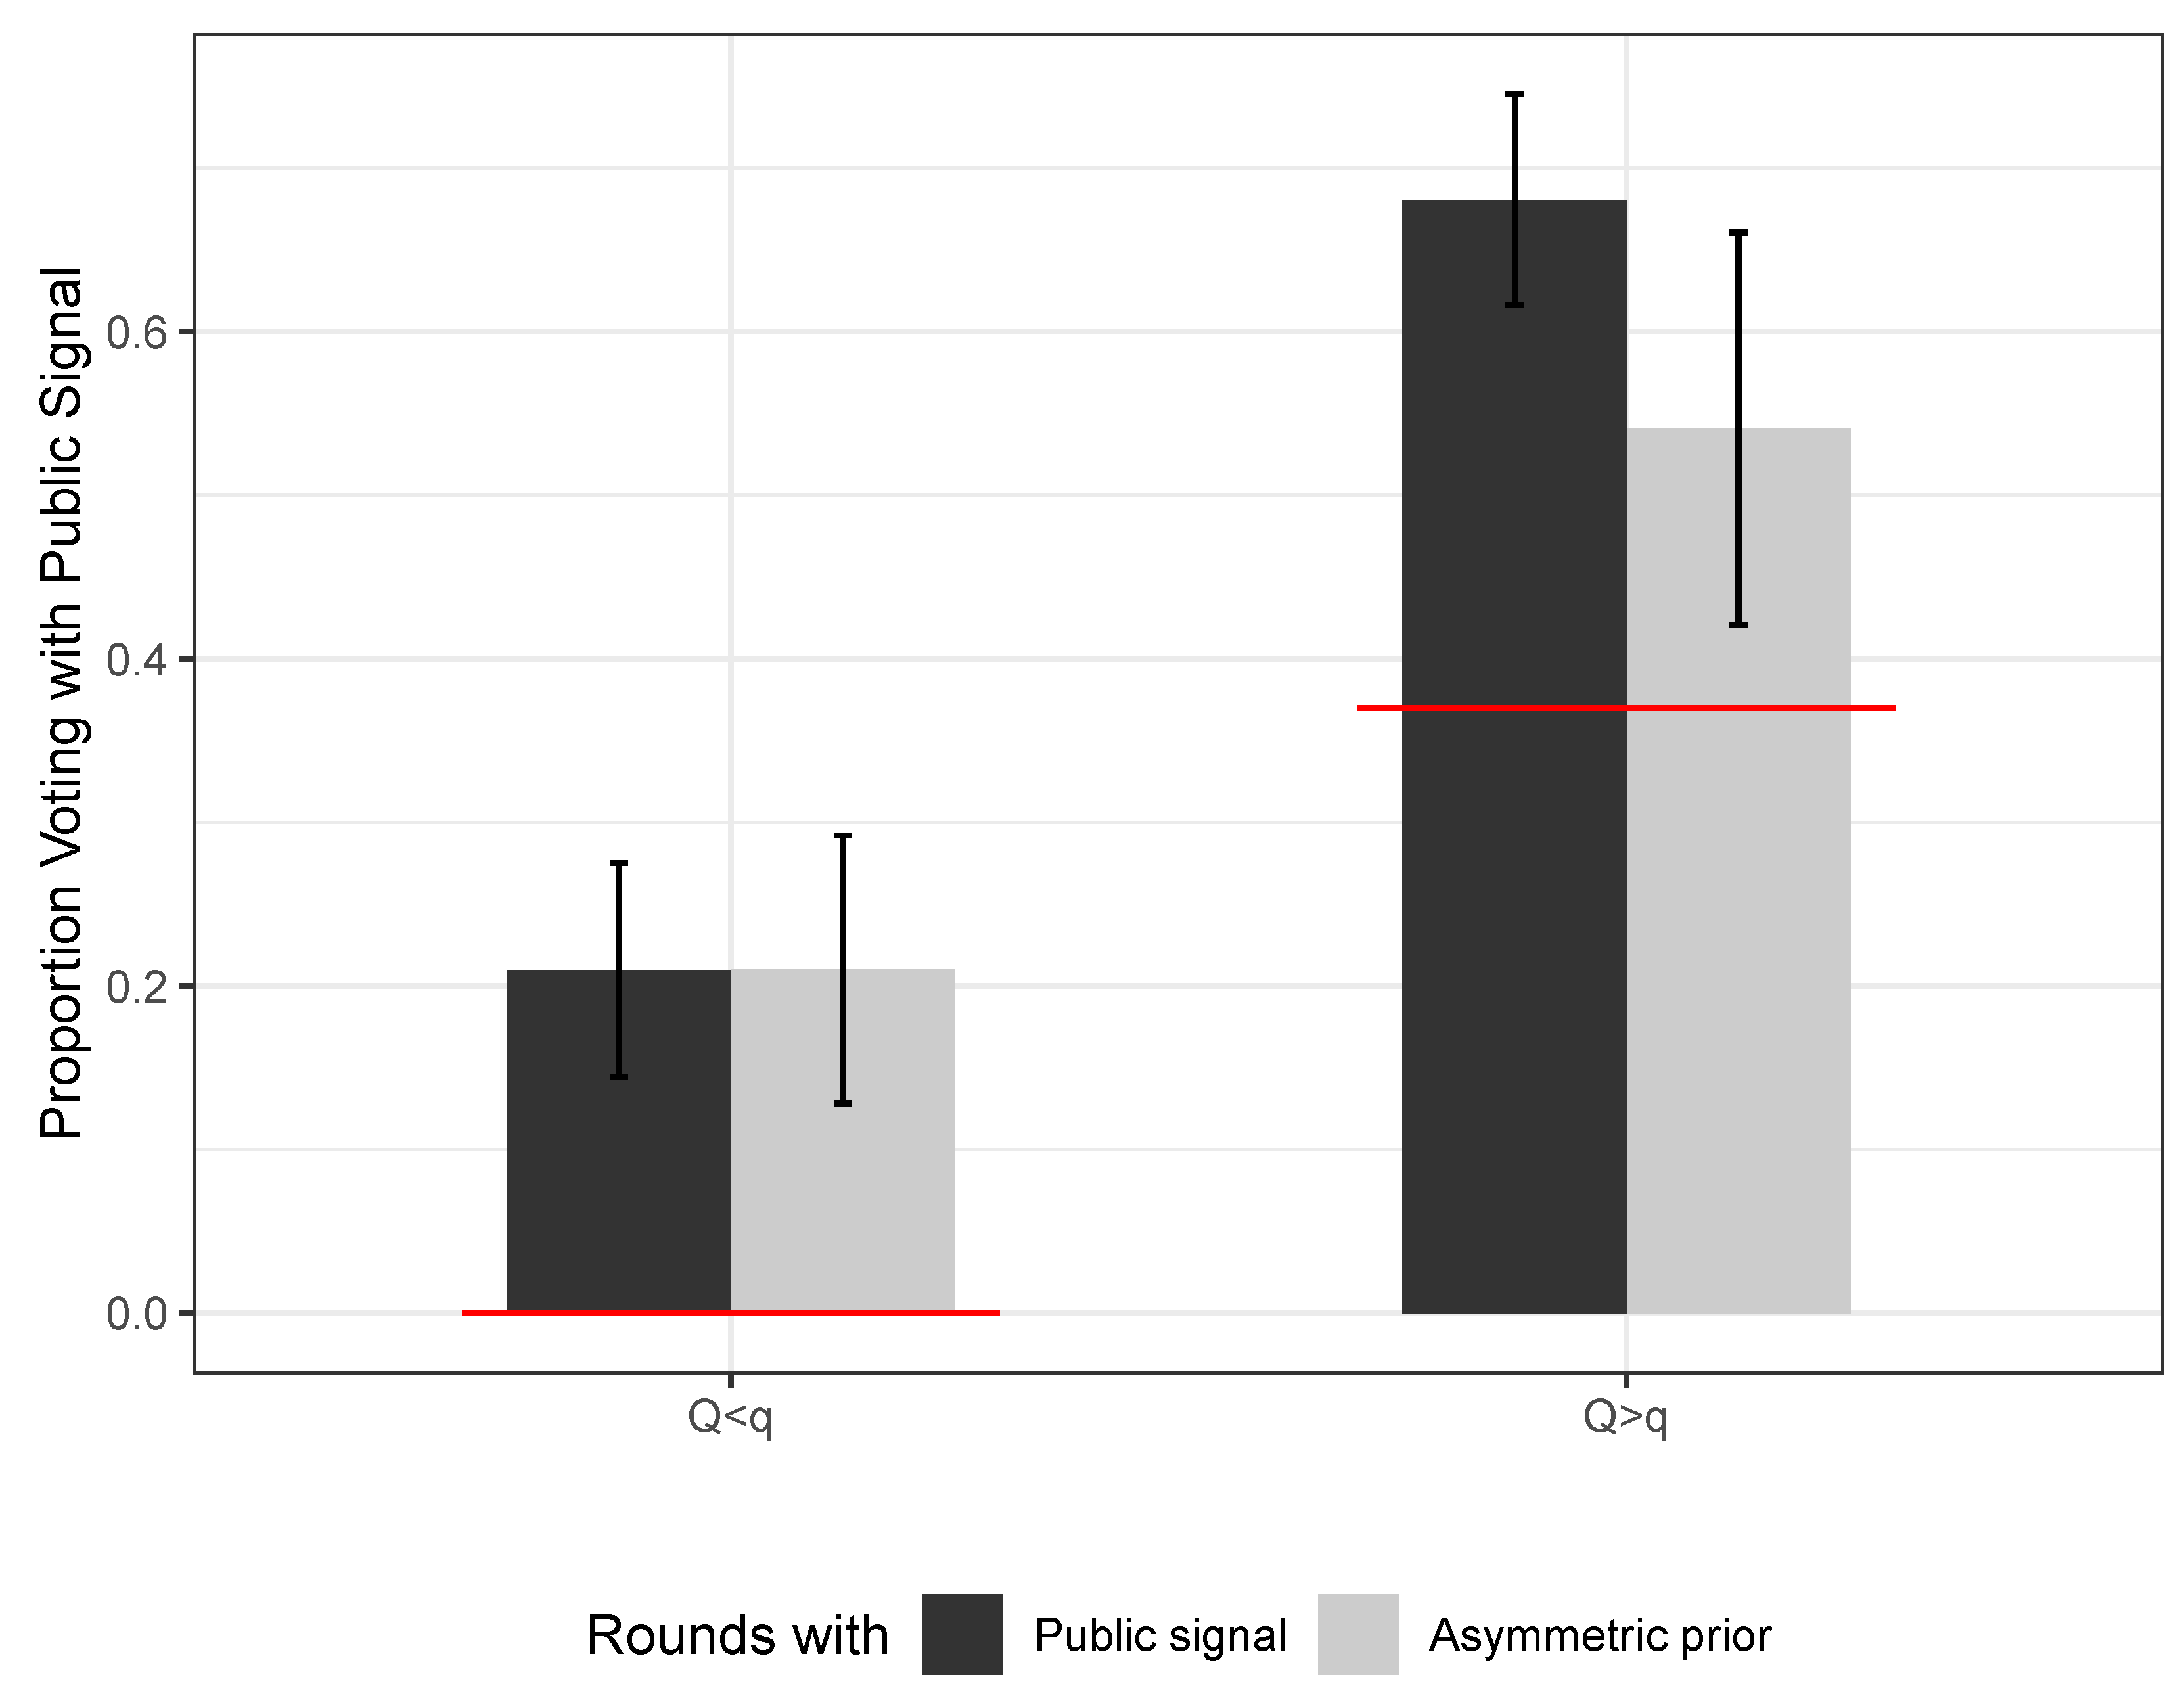
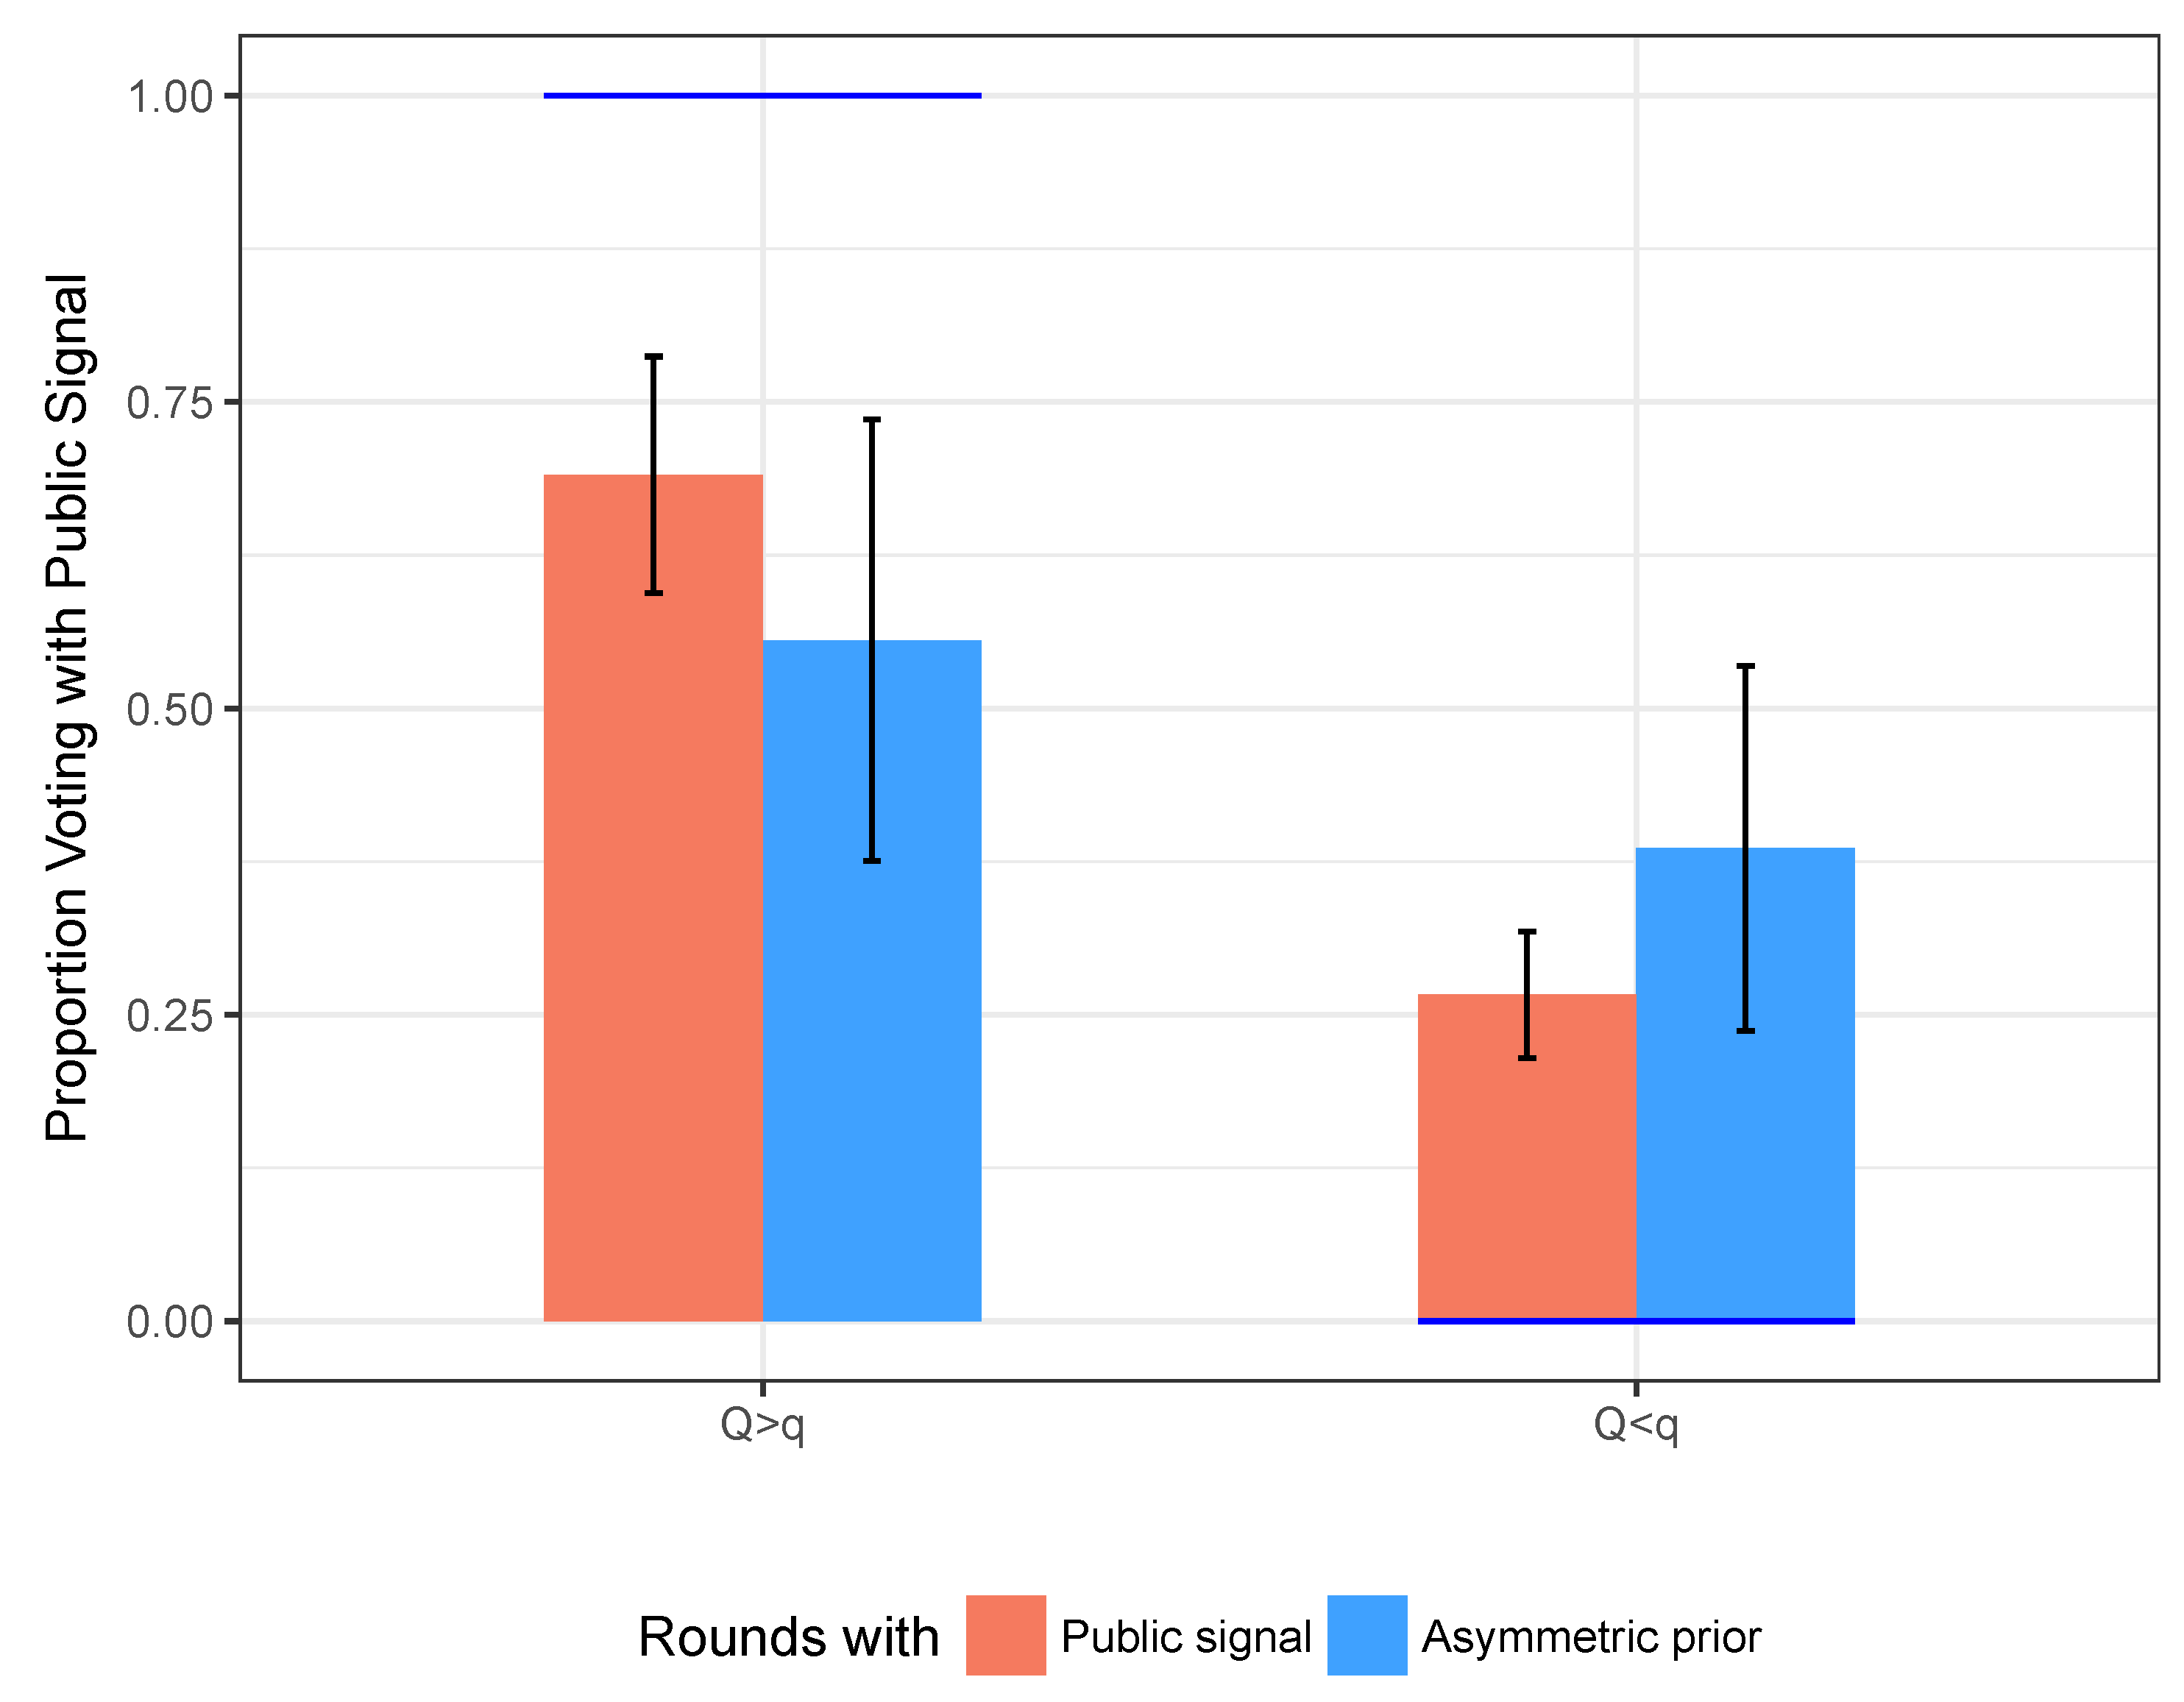
Asymmetric Prior.Figure 3 shows the proportion of votes with the public signal (under mismatch) in the treatment with public signal calculated by aggregating over the other salience treatments vs. the treatment with asymmetric prior.
The left bars correspond to the public signal being less accurate than the private (), and we see no difference. When instead, subjects follow the public signal more (as we saw earlier), and the treatment effect of showing the public signal is high and significant: showing the public signal correlates with subjects voting for it of the times more than when the same signal is conflated in the prior. This difference is significant at the ten percent level. This treatment effect has the same direction of what found in KV,14 although the magnitude is much smaller. One concern might be that any effect of the asymmetric prior treatment is driven by it being administered during the last ten rounds of each session. I performed the same comparison as in Figure 3 considering only the last ten rounds of the first part of the experiment, when the public signal was displayed. Even with this reduced sample, there is no difference when the public signal is less precise. When the public signal is more precise, this difference is reduced to 11 percentage points, significant at the ten percent level.
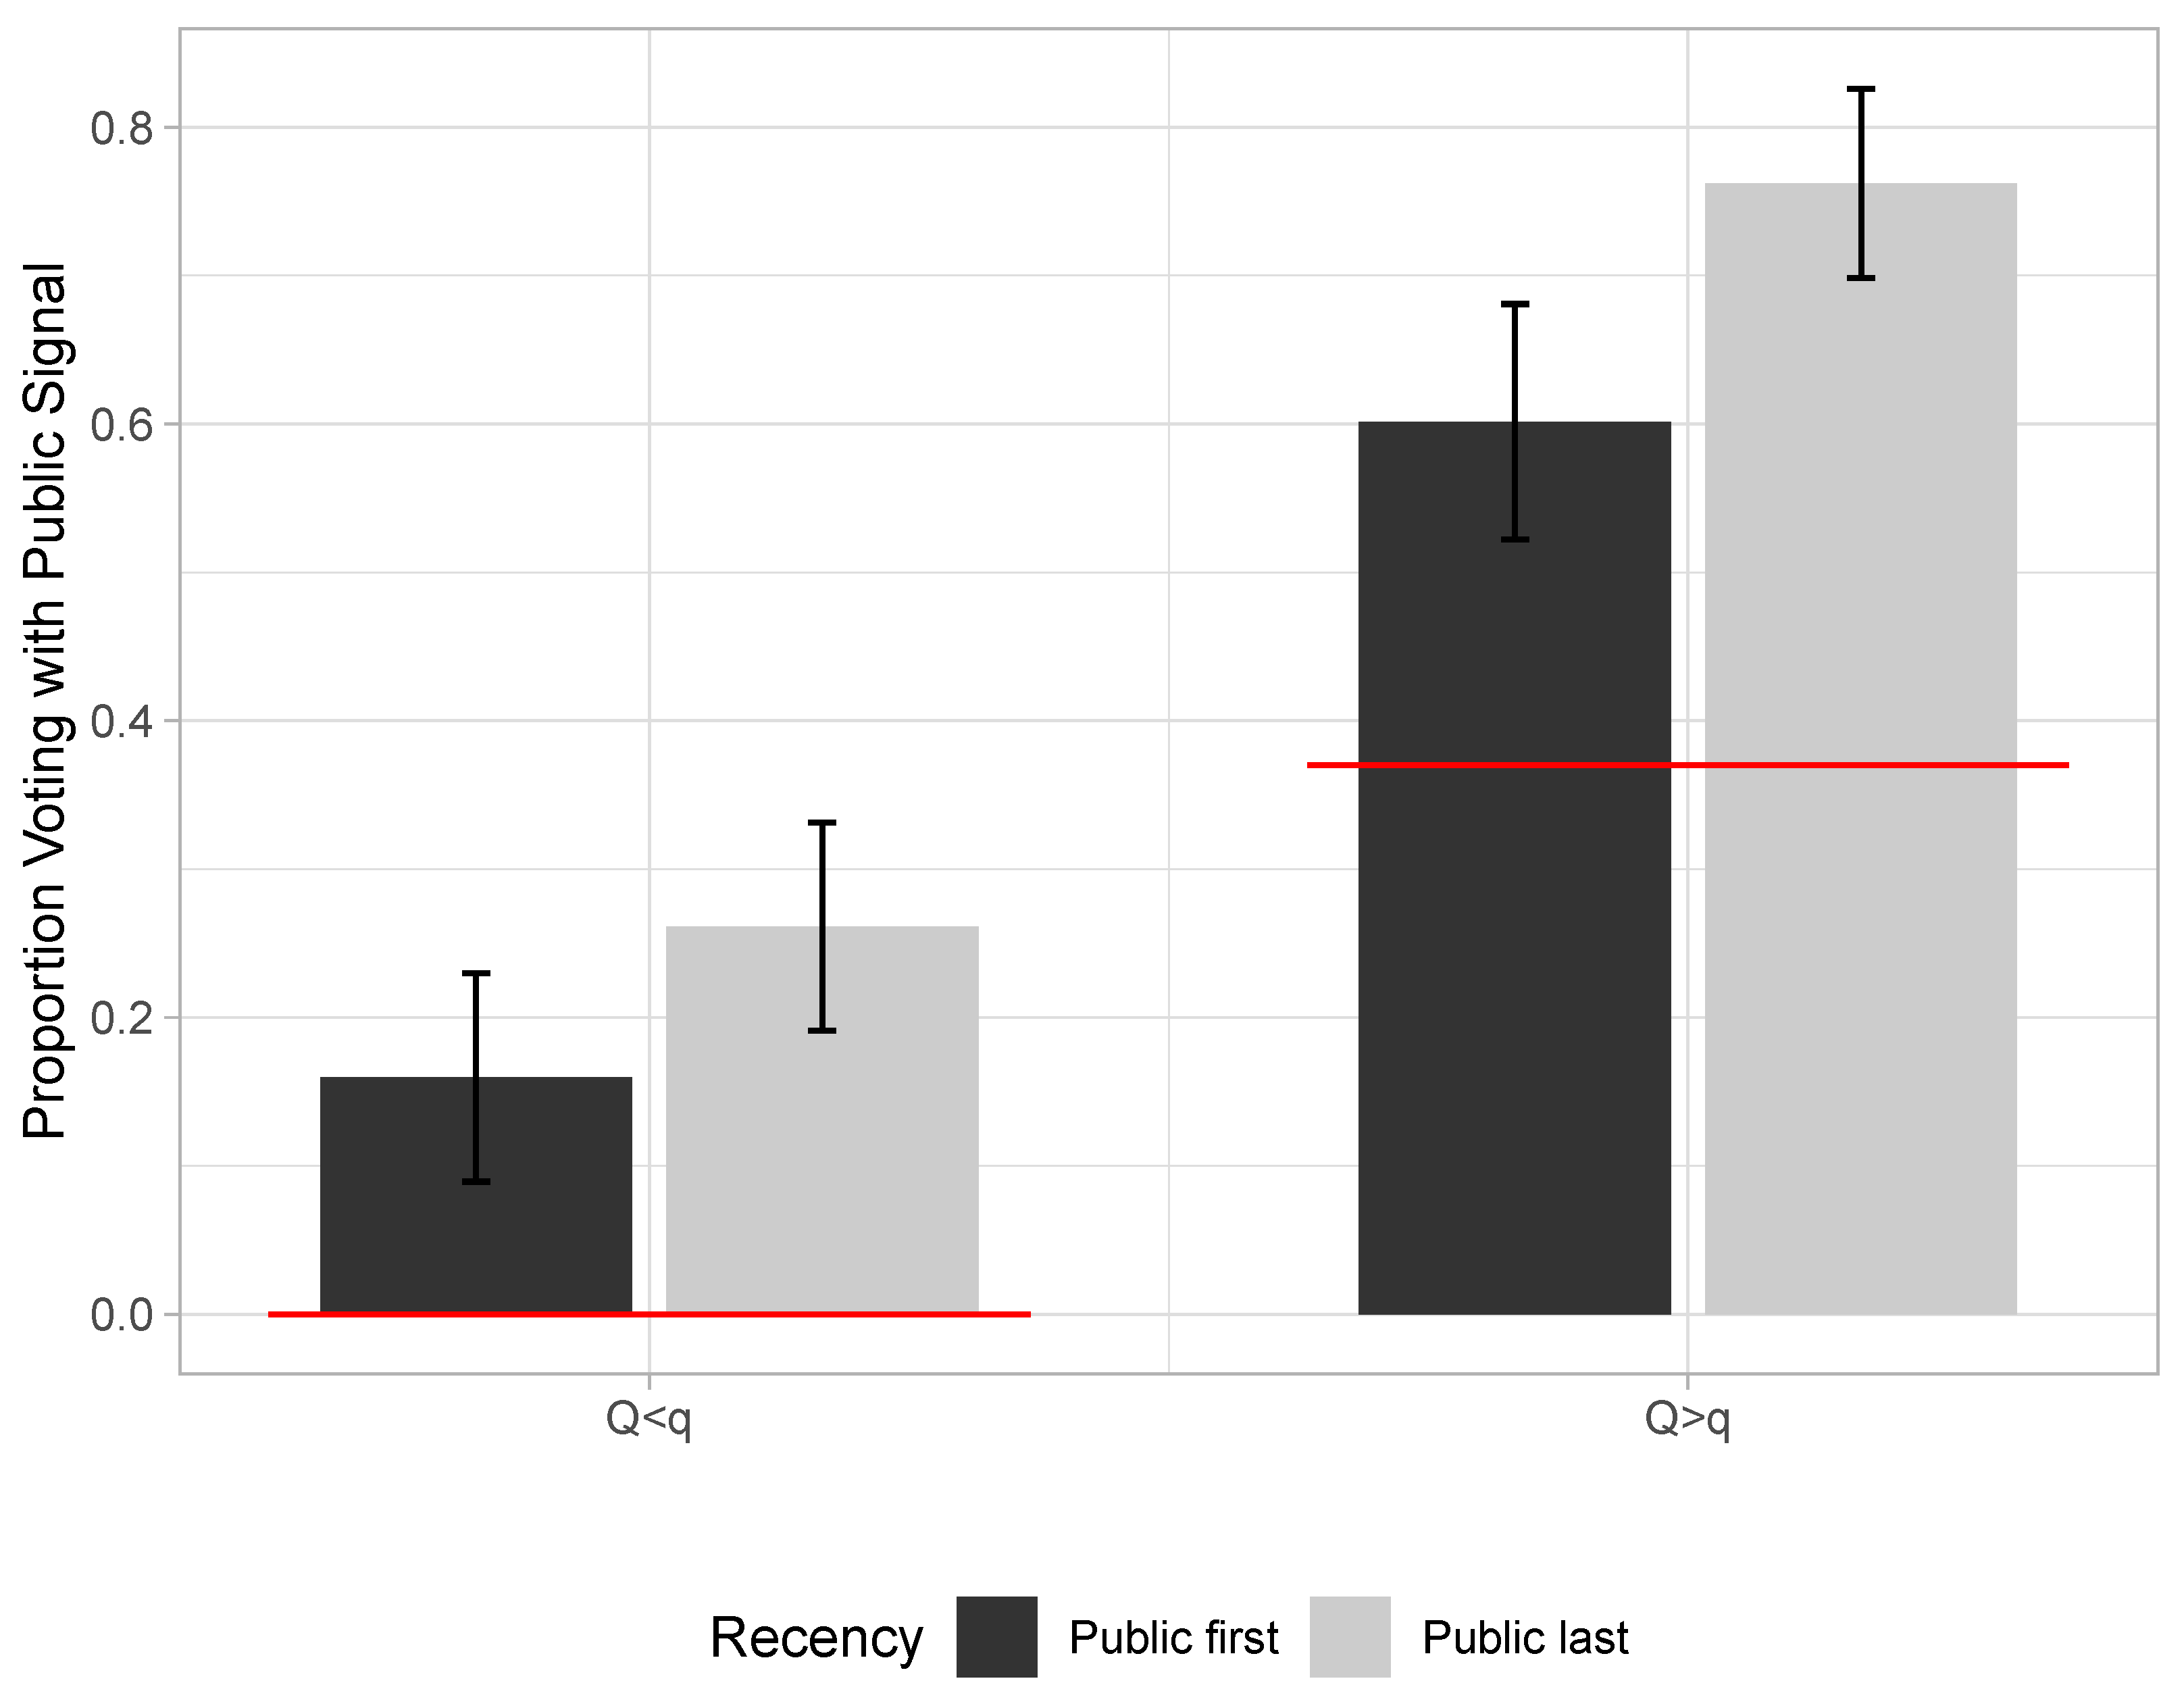
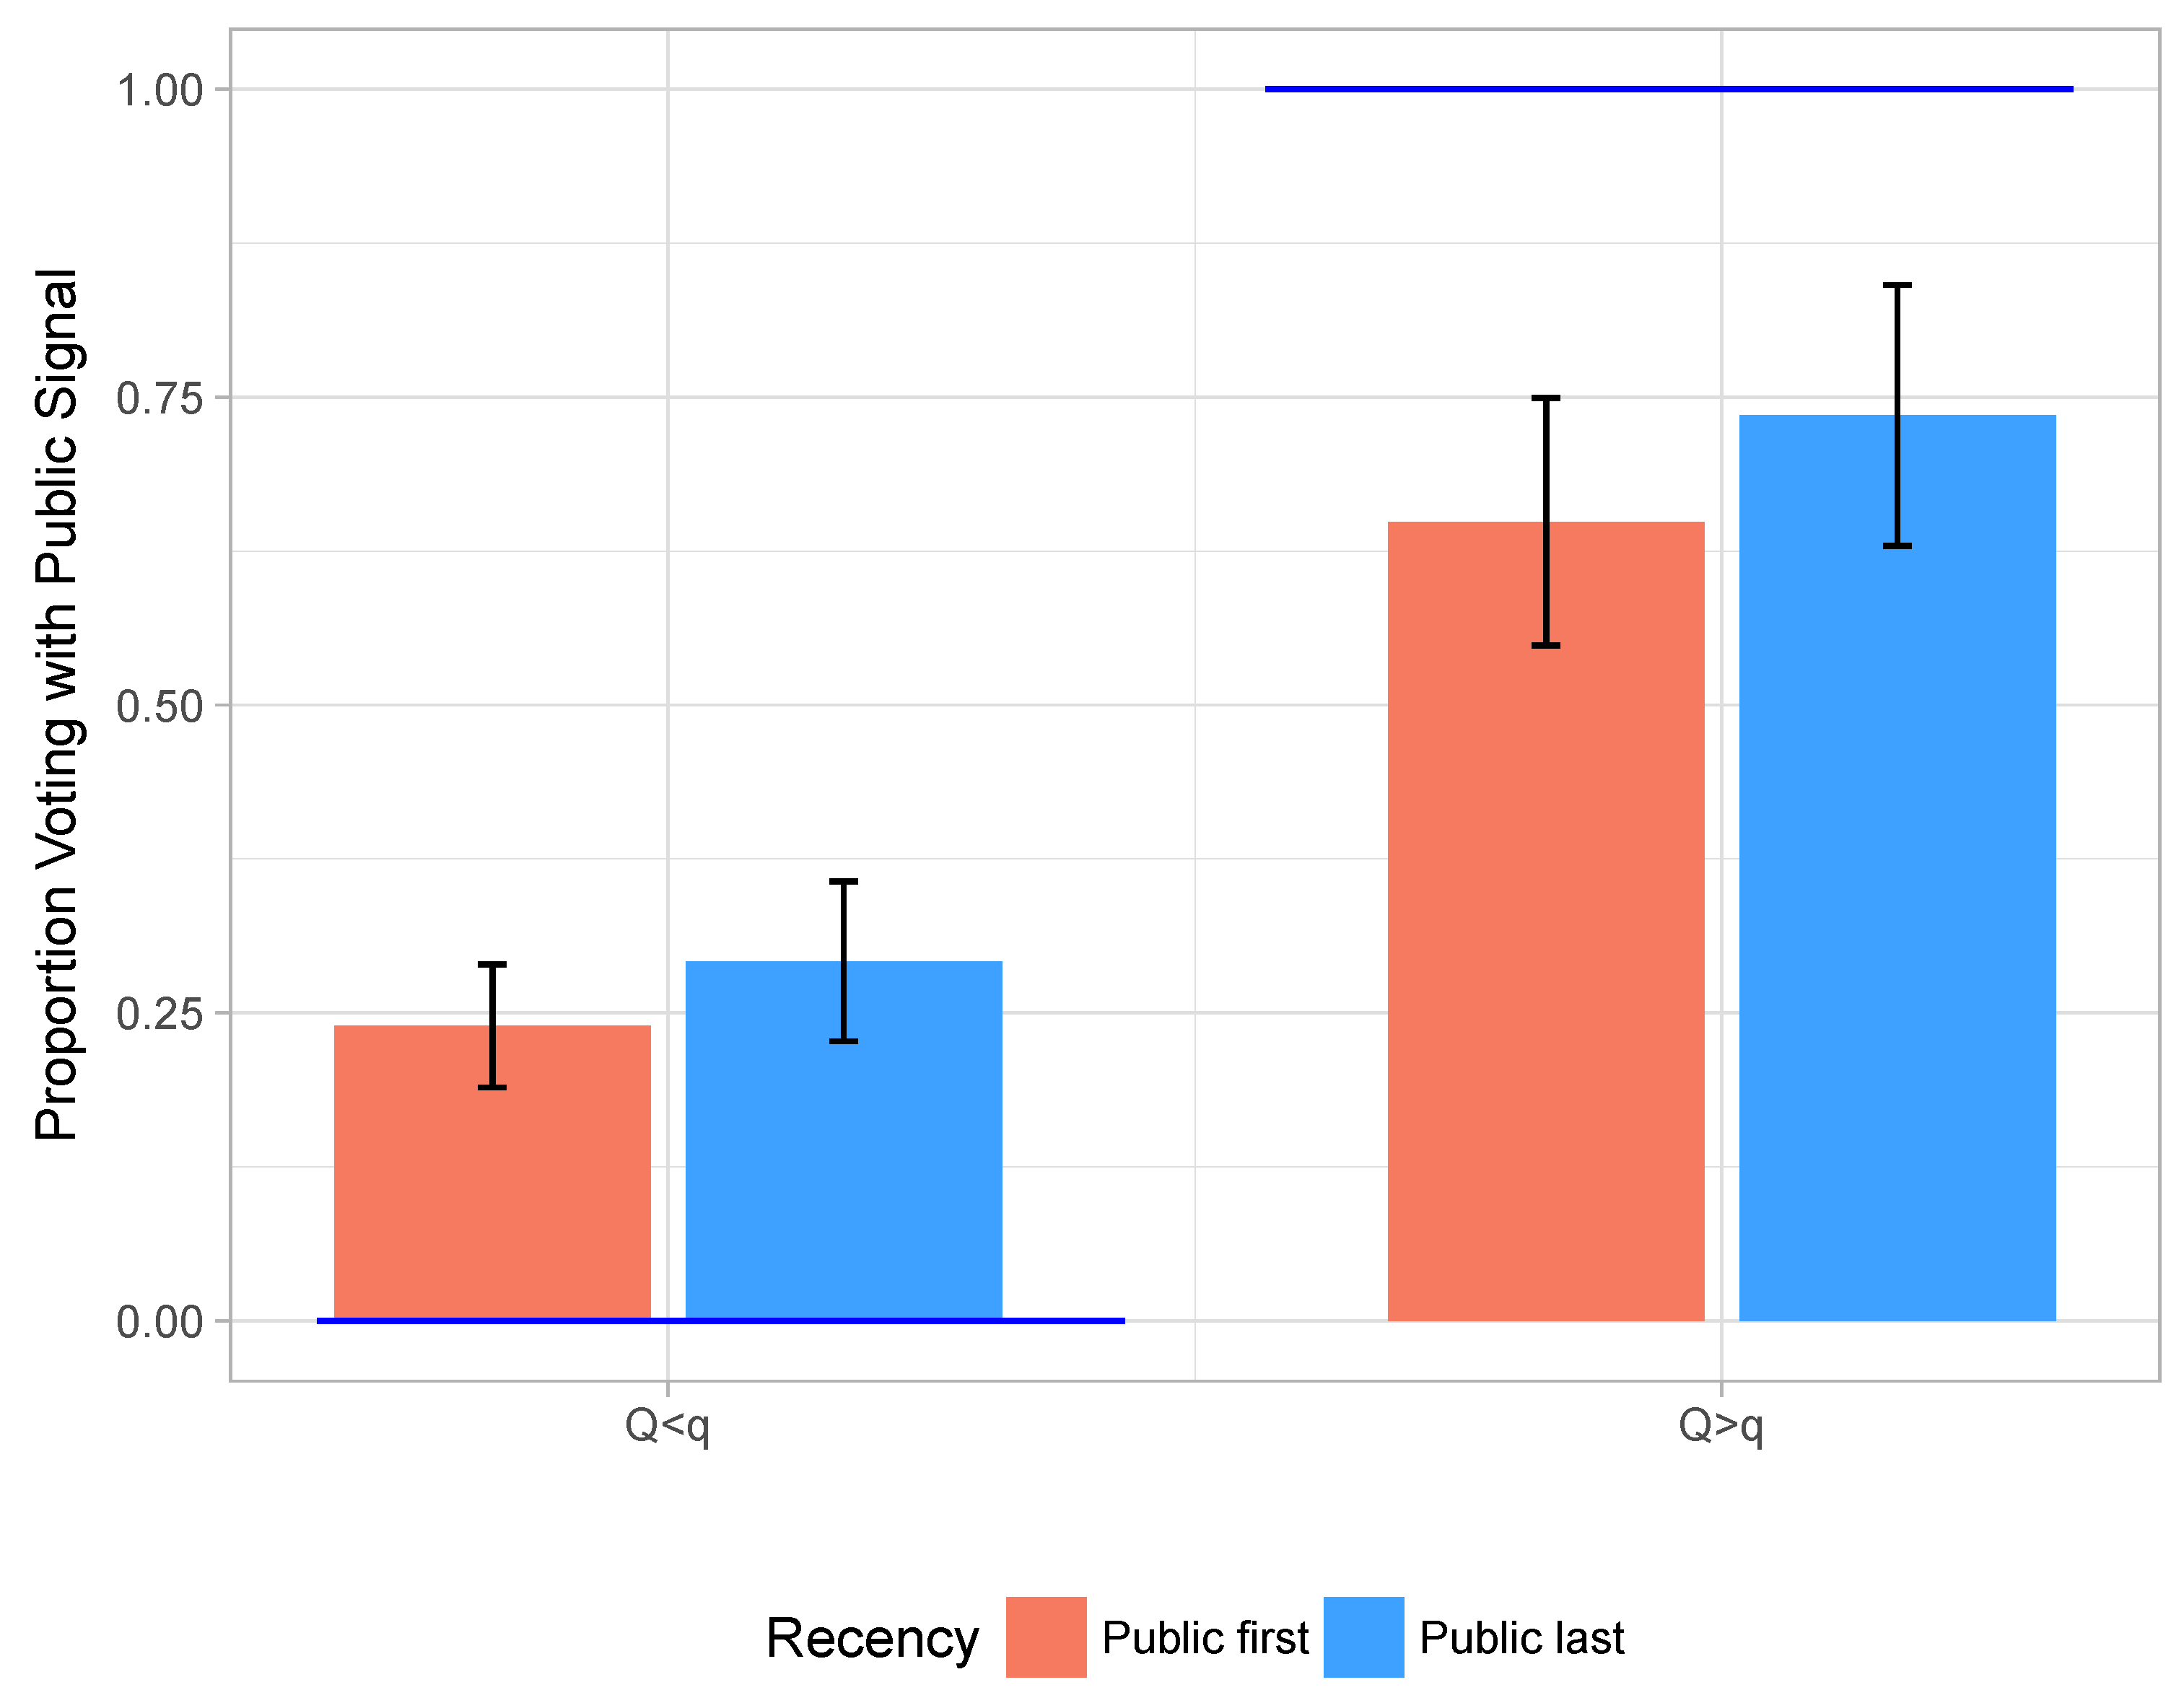
Recency. The recency treatment varied whether the public signal was projected on the central screens of the laboratory before or after the private signals were displayed on the subjects’ monitors. Recency effects were substantively and statistically significant. In particular, when the public signal accuracy is higher (right columns in Figure 4), there is a difference between the fraction of times subjects followed the public signal when it was displayed before the private () as opposed to after the private (). When the public signal accuracy is lower than the private (left columns), there is a difference. Both differences are significant at any conventional level.
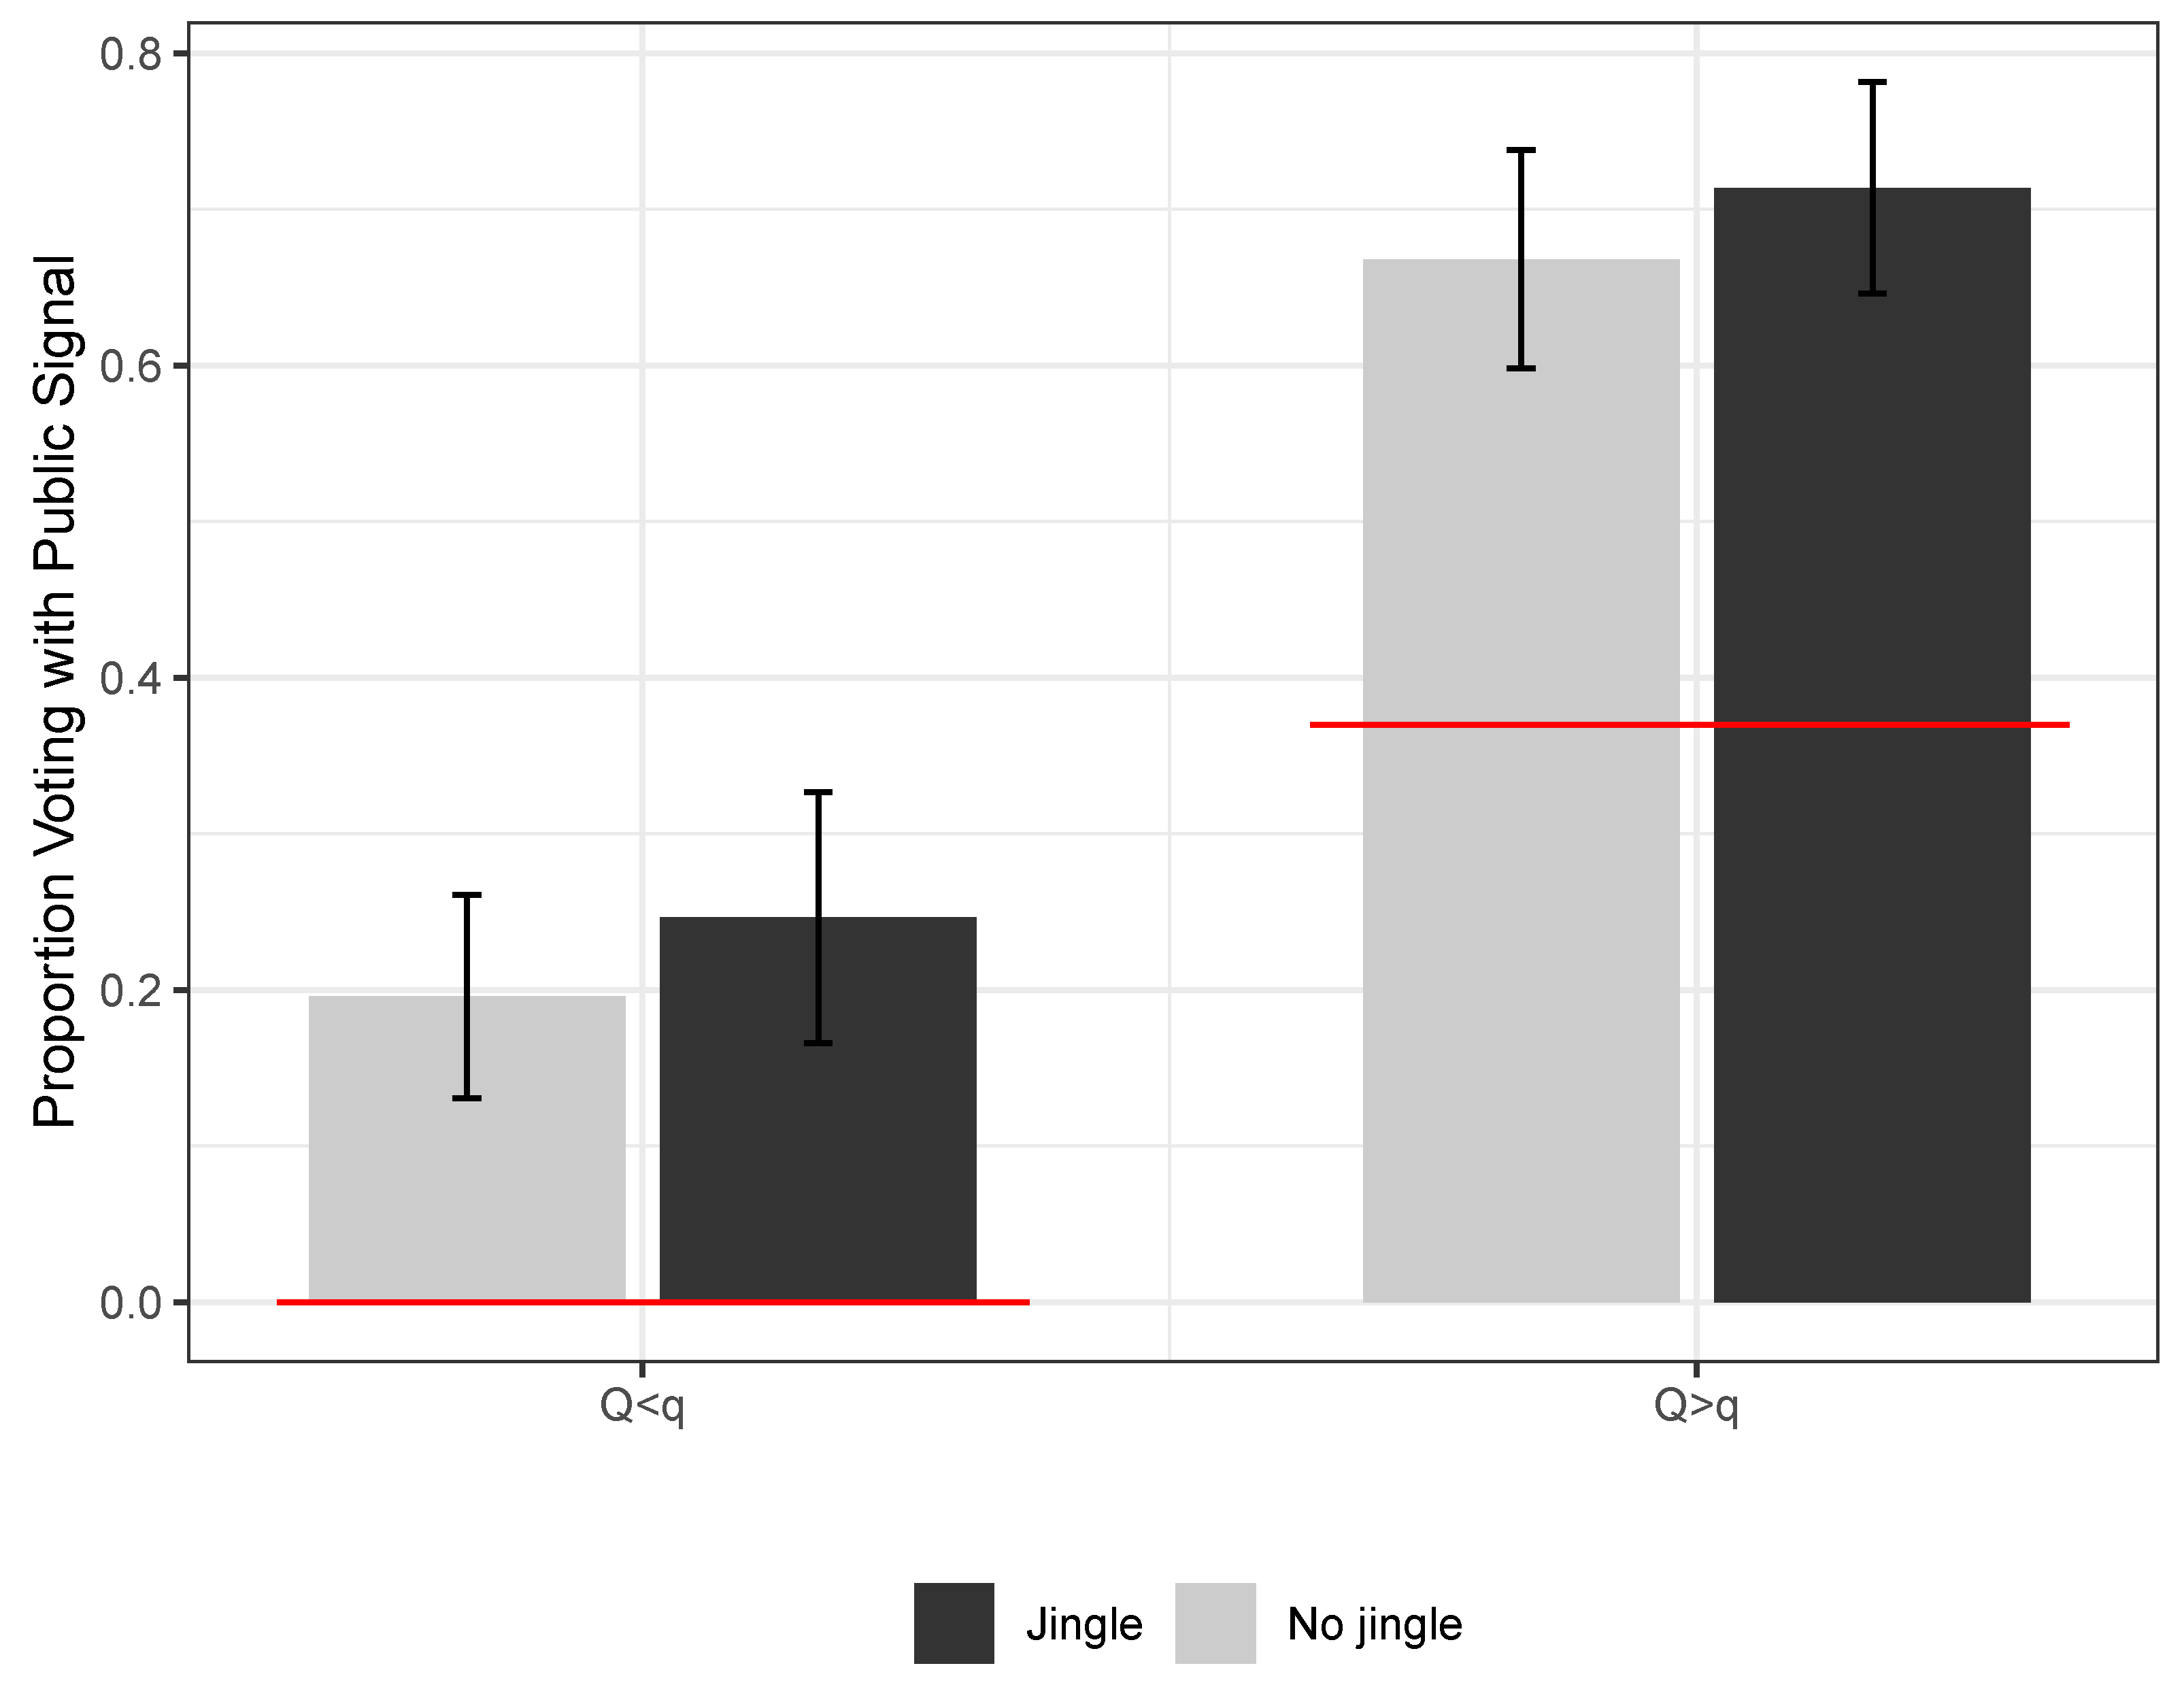
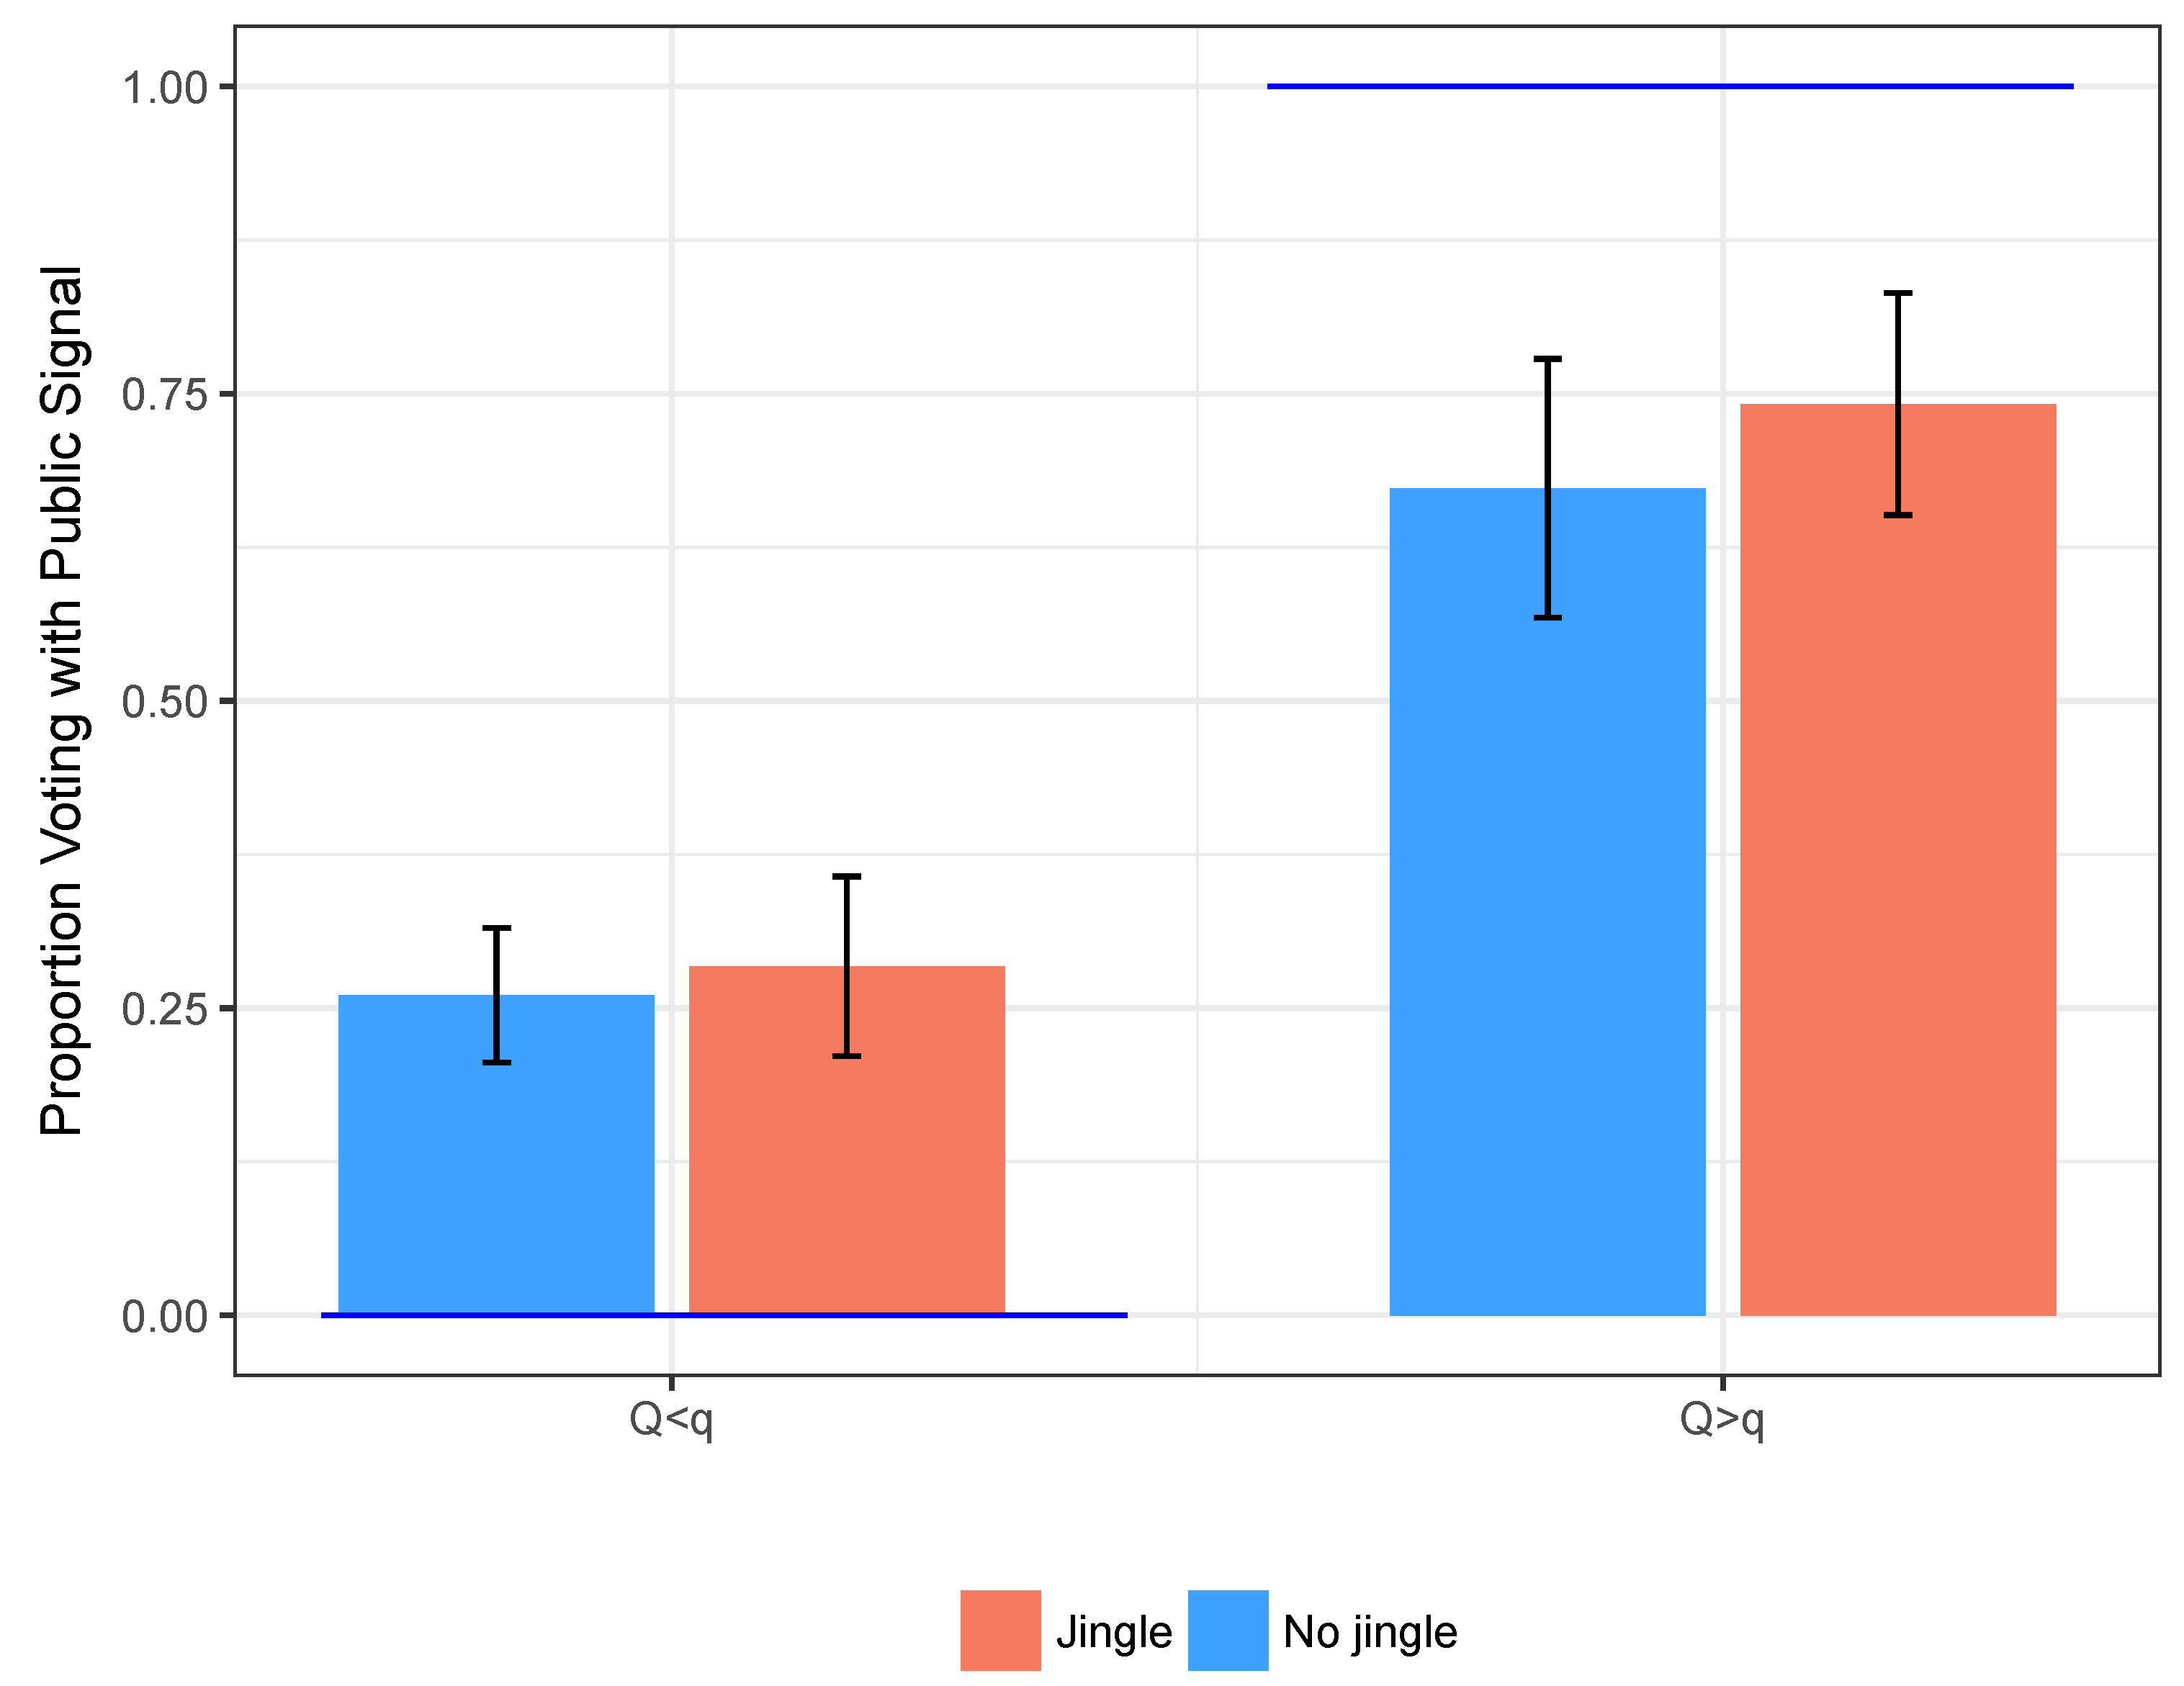
Jingle. For what concerns the jingle treatment effect, the direction is the one expected and it is in line with the recency treatment effect. The magnitude is smaller, as Figure 5 shows. When the public signal accuracy is higher (right columns in Figure 5), there is a difference between the fraction of times subjects followed the public signal when it was displayed before the private () as opposed to closer to the vote (). When the public signal accuracy is lower than the private (left columns), there is a difference.
Table 3 shows an OLS regression of the probability of following the public signal under mismatch, regressed on the jingle treatment and the recency treatment. When the public signal is presented as a flashy video, subjects vote for it of the time more. When we interact the jingle with recency, the effect increases to . Even though the aggregate effect of the jingle is not significant, there is a pattern of response to it: subjects react more to the initial jingles. In particular, if the jingles are shown within the first 15 periods, subjects follow the public signal more than public signal displayed in later periods ( difference, ).
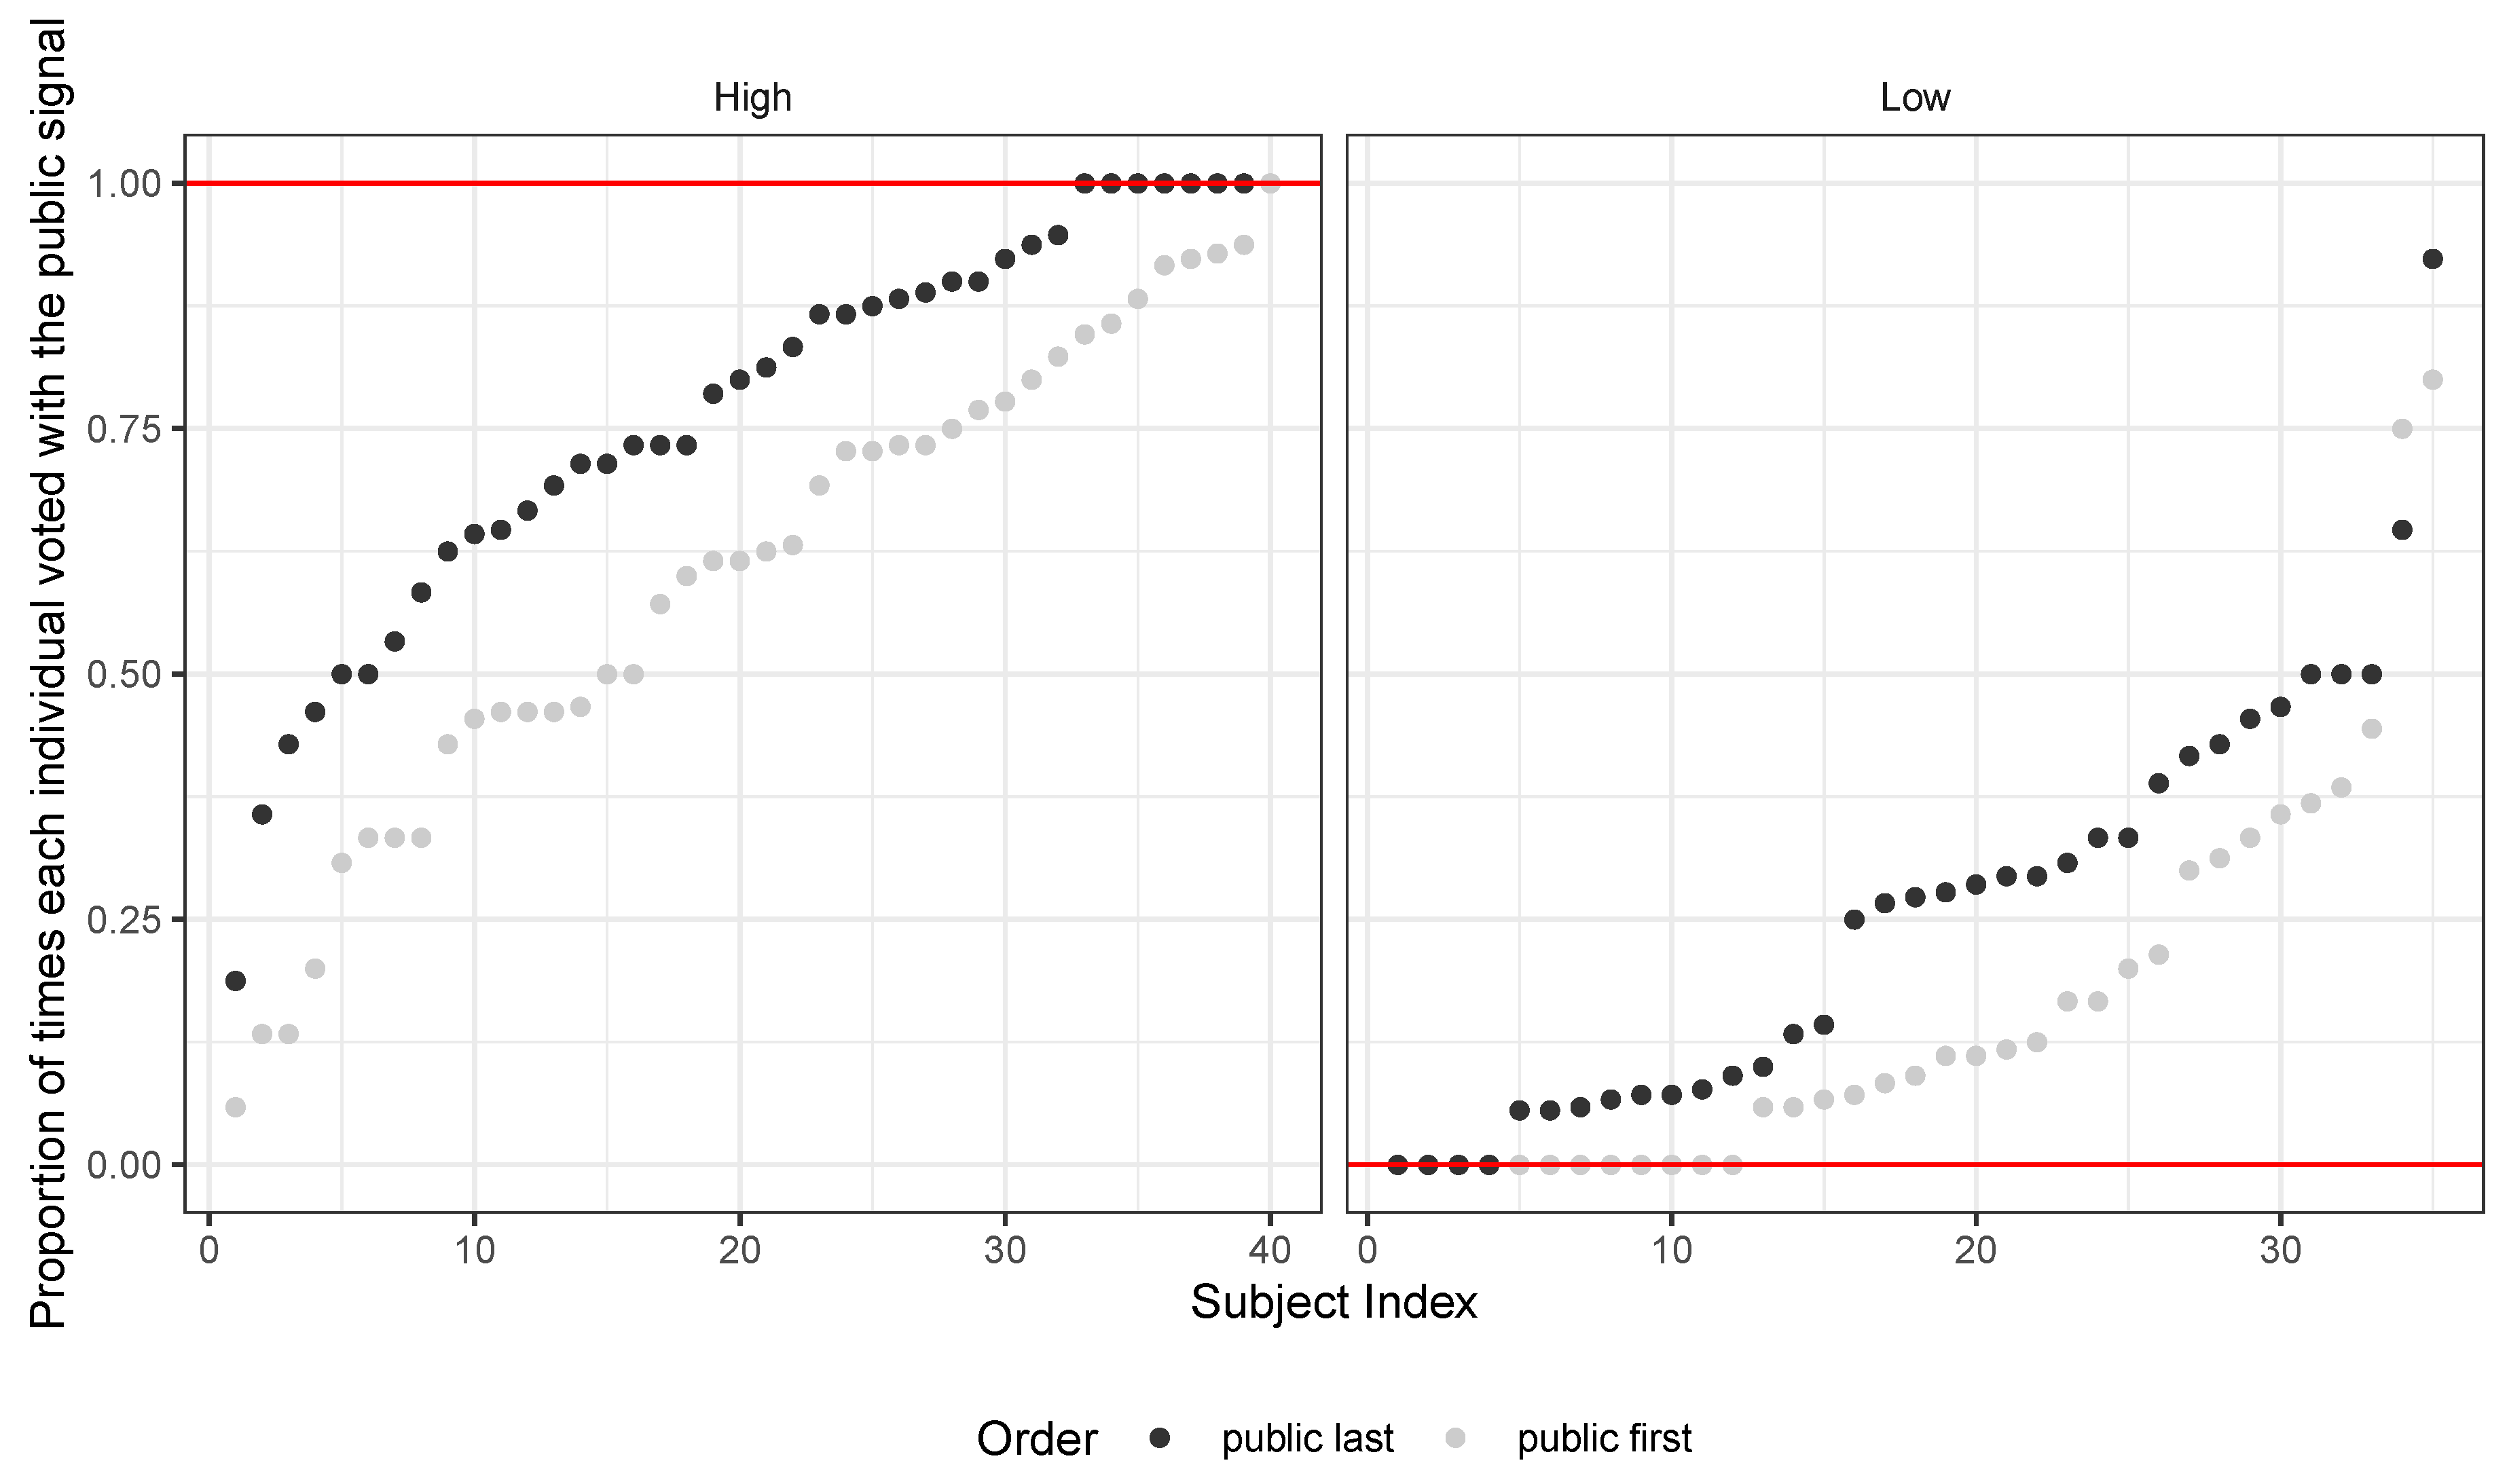
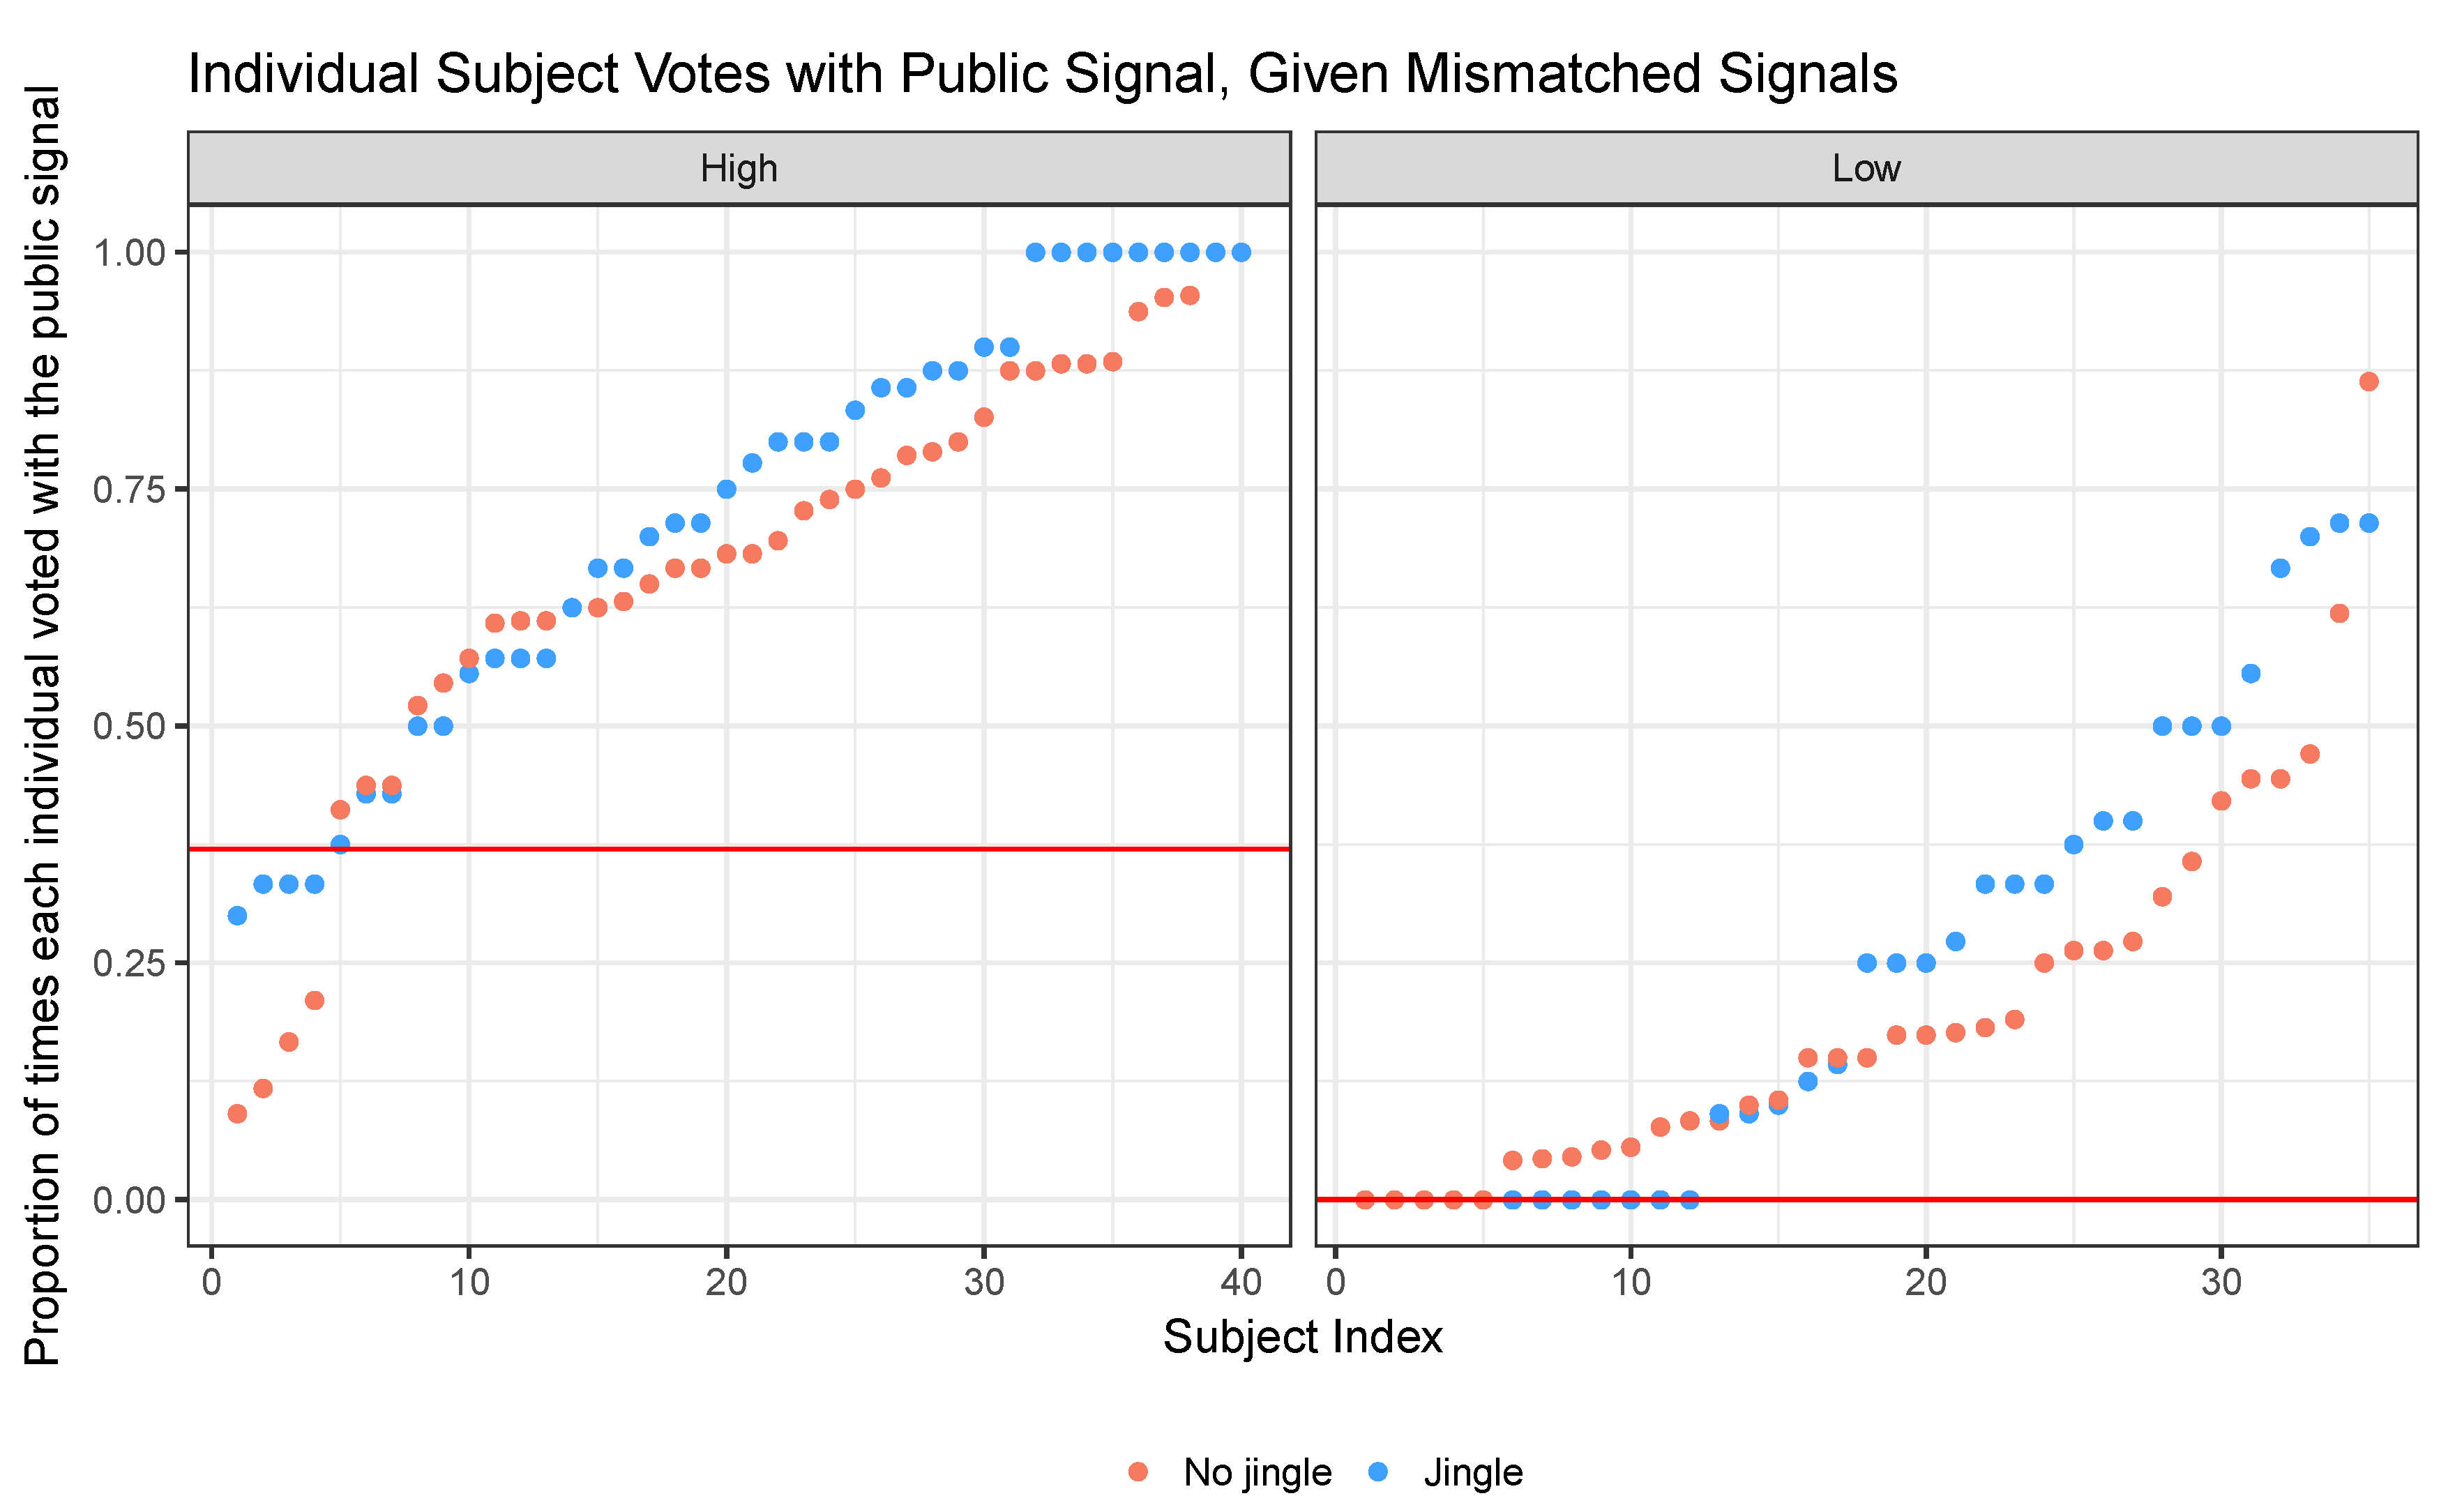
Given the magnitude and significance of the recency treatment effect, the question that arises is whether this effect is homogeneous across subjects. Figure 6 shows the individual treatment effect of recency of the public signal. Each dot represents the proportion of times each subject voted with the public signal. The vertical distance between red and blue dots is the individual average treatment effect of providing a public signal before vs. after the private one. The left panel corresponds to a more precise public signal. Recency of the public signal has a striking homogeneous, positive effect on the proportion of time each individual votes with the public signal.
We can see this effect from the proportion of times each individual voted with the public signal when it is displayed closer to the vote (dark dots), which is always above the same proportion when the public signal is displayed before the private signal (light dots): the “Public Last” (recency) treatment first order stochastically dominates the “Pubic First” treatment.15
Overall, there is a substantial fraction of subjects who always vote according to the most recent signal. In particular, votes match the most recent signal in of individual decision, which is a remarkable result given that from a theoretical standpoint behavior should not be affected by the time a message is released. Moreover, subjects’ behavior is homogeneous across different sessions.16
4.2. Individual Treatment Sessions
In the previous section, I show that the way subjects responded to the signals’ relative precision rules out the coordination mechanism, which is a possibility that might arise (see conformity equilibrium in the theory section). Sessions 5–10 were designed to fully control for this coordination mechanism. The structure of these sessions was identical to the previous four, except that subjects were paid for their individual decisions, and were not part of any group. Instructions were given to subjects in the same way as in the first sessions, with the only difference that no groups were mentioned. The absence of groups made the decision much easier, being absent any calculus of pivotality or coordination problem. The decision problem was straightforward, as it only required to compare the relative precision of the signals received: the expected payoff maximizing decision was to always follow the information contained in the more accurate message.
If less subjects followed the public signal in these individual sessions, we would have evidence that subjects used the public signal as a coordination device: voters would conform to the public signal’s content as long as they were in groups, but would stop to conform when the task was individual. If, on the other hand, the fractions of people voting for the public signal were similar in the individual and group treatments, it would be evidence that subjects did not use the public signal as a coordination device.
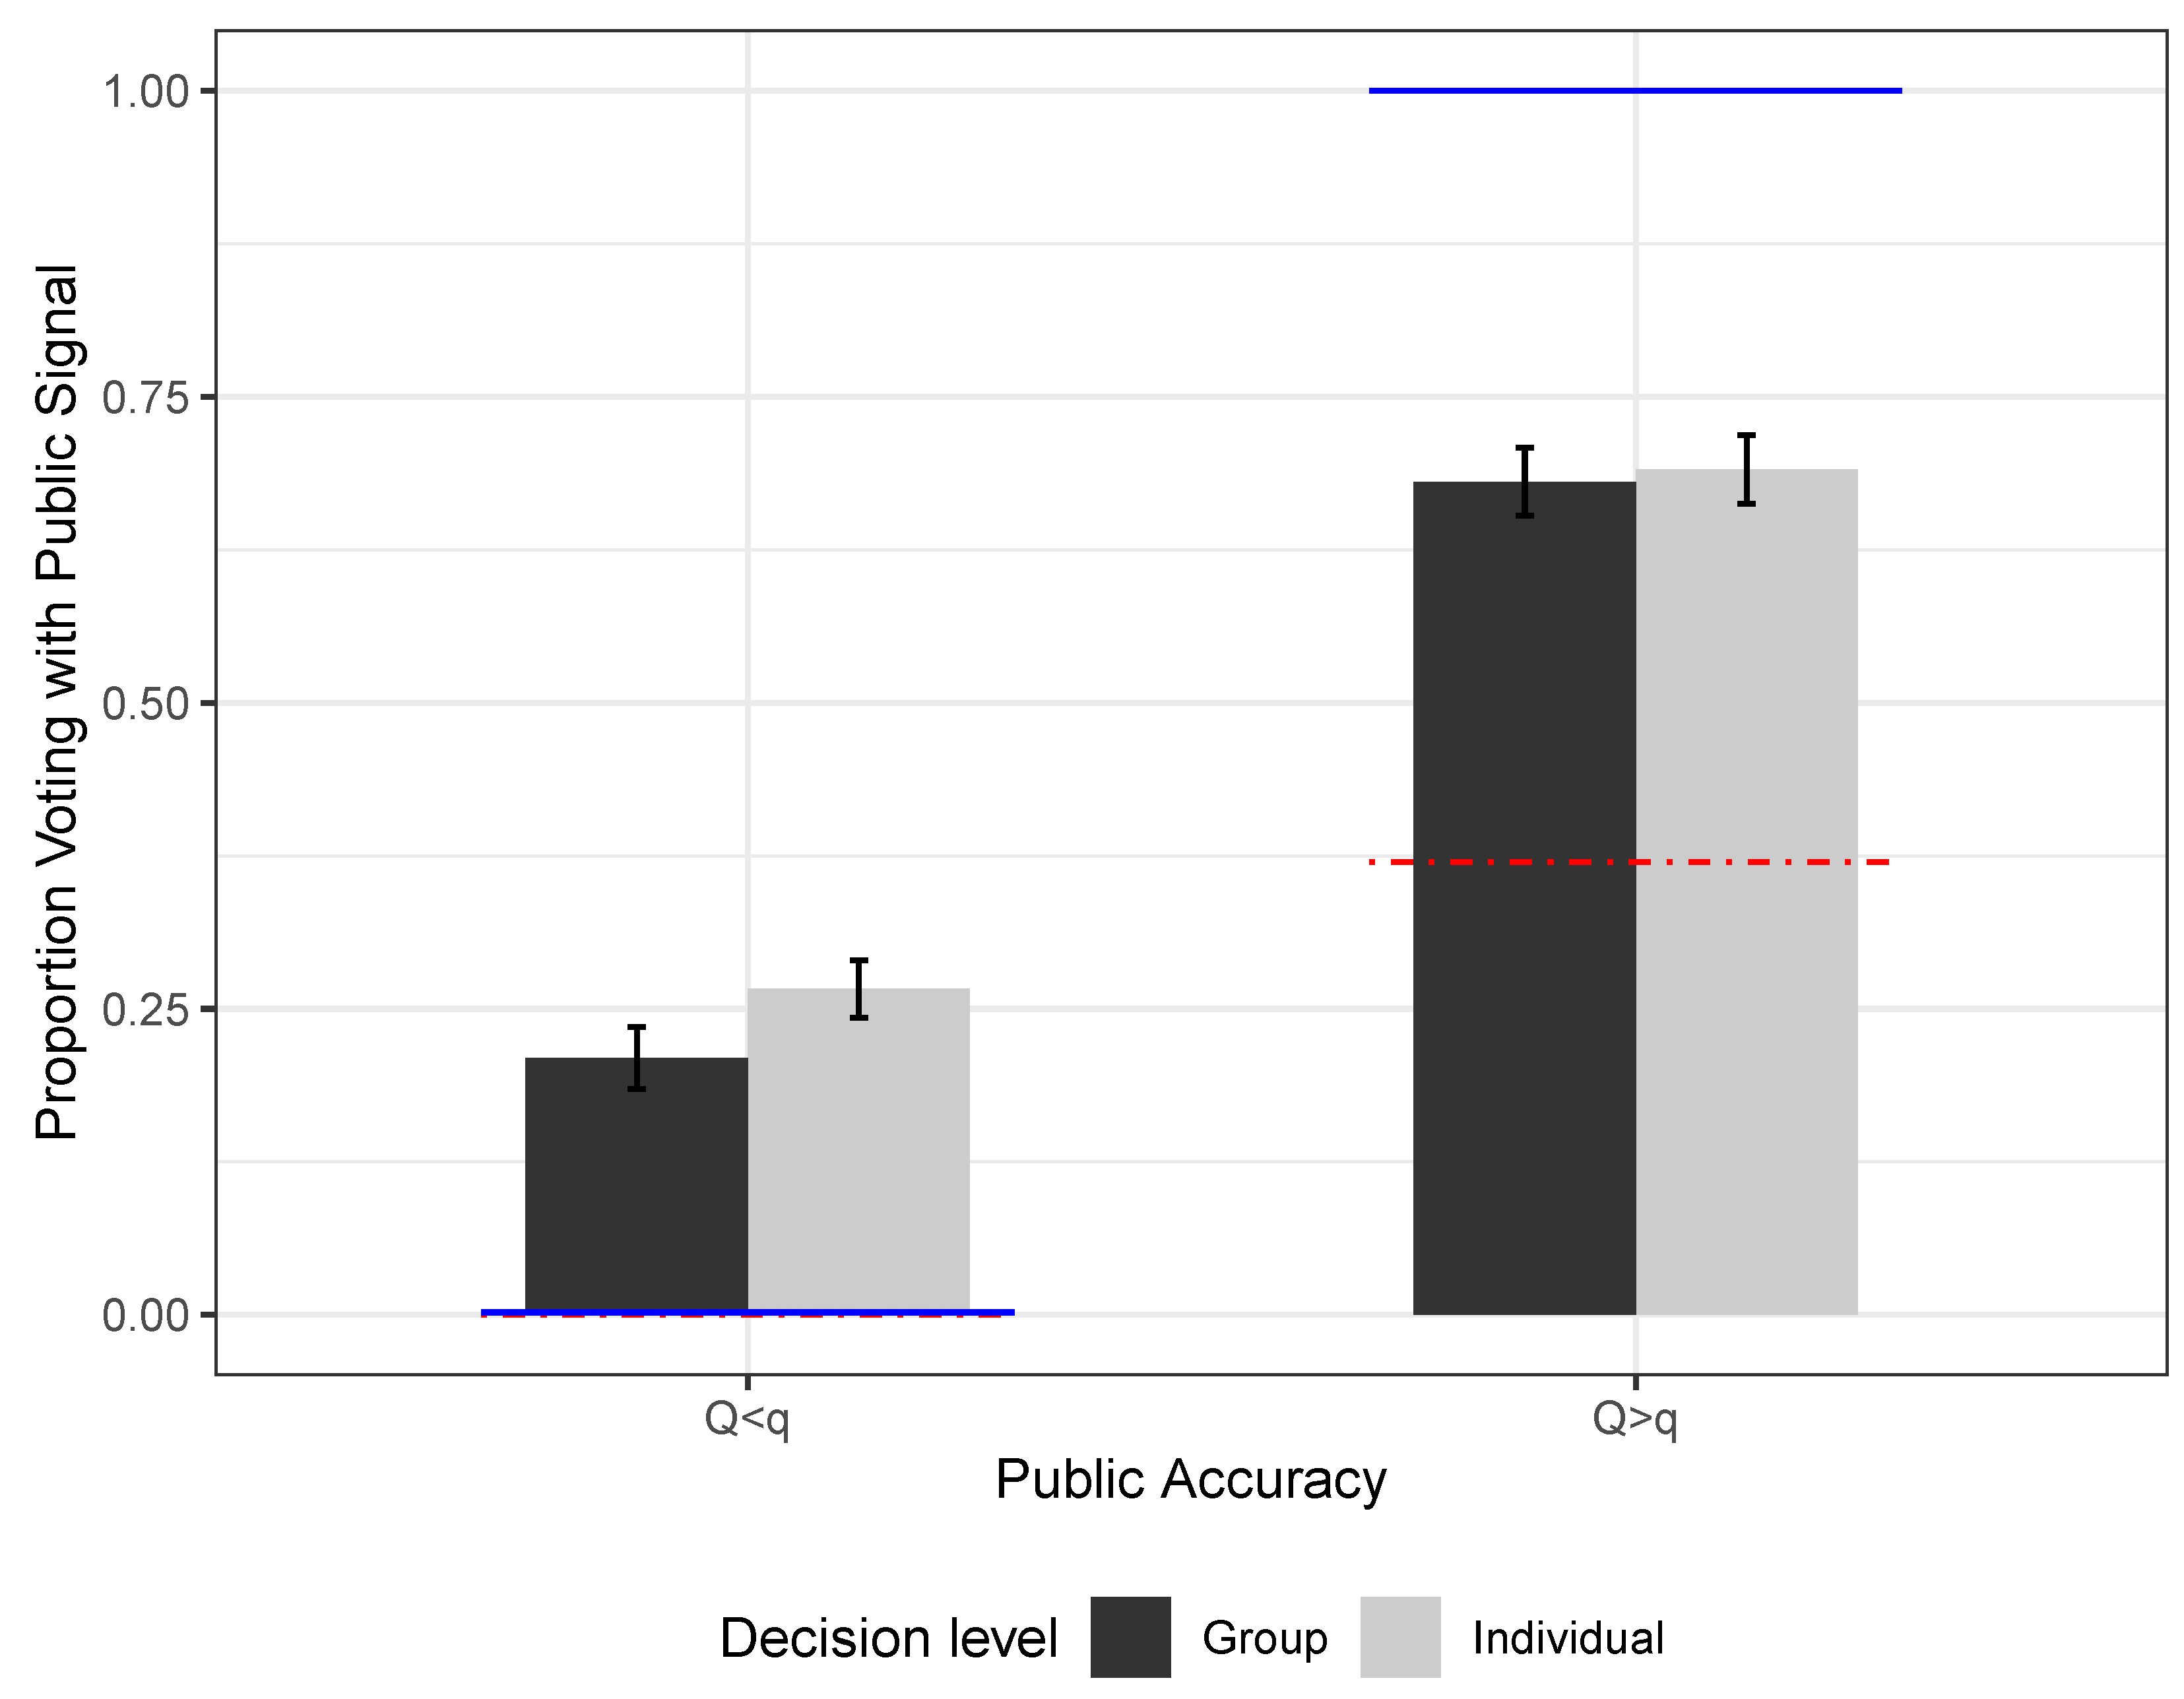
Aggregate data for these individual sessions show that there is no substantive difference between the fraction of votes cast according to the public signal in the individual task treatment versus the treatment with committees and group decisions (see Figure 7).
The aggregate data show that, when the public signal is less precise than the private, subjects tend to over-follow the public (the optimal decision is to never vote with the public in both group and individual treatments). The treatment effect of relative signal precision remains in the correct direction even in the individual sessions. The similar results that we observe in the group task and individual task sessions provide evidence against the coordination mechanism in the group treatment. Yet, the fact that individuals vote too little with the public signal when it is more informative than the private is surprising, given the very simple task they are given. This result might be due to the way subjects were exposed to the messages during the experiment. Although preserving the same experimental design used in the first sessions with the group task was the most linear way to compare the two treatment conditions, some subjects might have been confused by receiving a public signal common to everyone in the room, when their payoff was determined uniquely by their decision. Hence, despite very clear instructions, the individual task might have confused some subjects. This confusion presumably did not arise in the group sessions, where the presence of a public signal observed by all subjects was intuitively related to group decision making.
As Figure 8 shows, individual data for the individual sessions show the same stochastic dominance that we saw in group sessions for the recency treatment. Even for these subjects, recency of the public signal has a homogeneous and positive effect on the proportion of time each individual votes with the public signal. We can see this effect from the distribution of individual votes when the public signal is displayed closer to the vote (dark dots), which stochastically dominates the votes when the public signal is displayed before the private (light dots). Even the jingle has an effect that is similar to the group sessions: when the public signal is presented as a flashy video with salient music, the probability that subjects vote for it is higher (p-value lower than ), although when interacted with recency, this effect is not significant anymore (Table A1 in Appendix A shows the OLS regression coefficients for the individual sessions). Overall, the individual sessions show that salience treatment effects (particularly in the form of recency) are robust to the nature of the task: whether subjects vote in groups or individually, they are clearly affected by the way the message is presented.17
5. Conclusions
This paper studies the effect of salient public signals on voting behavior in a majoritarian voting game with common interest. When (in addition to private independent signals) a public signal is observed by everyone, there exist two main equilibria of interest: a symmetric responsive equilibrium, where subjects follow their private signals with positive probability, and a Bayesian equilibrium where subjects coordinate on the information provided by the public signal. Theoretically, subjects’ behavior should not be affected by signals’ salience, as long as the informational content of the signals is the same.
A laboratory experiment tests these theoretical predictions, suggesting several conclusions. First, subjects tend to follow the public signal more than what is predicted by the symmetric responsive equilibrium. If subjects treated public signals as information devices, we would expect this result only for the treatment with high public signal accuracy (), as in Reference [11]. Yet, subjects tend to over follow the public signal even when it is less accurate than the private one, as Figure 1 shows. One might hypothesize that public signals are focal points acting as coordination devices when decisions are taken in groups. As shown in Figure 2, this mechanism is contradicted by the data. Moreover, results from the individual sessions disregard the coordination mechanism, as subjects vote very similarly whether they are in groups or not.
The second conclusion is that salience of information affects voter behavior. Different treatments investigate whether subjects follow the public signal because it is displayed in a salient manner. In particular, experimental results show that the order of message delivery matters, as subjects tend to follow the public signal more when it is the most recent signal observed before voting. Interestingly, this finding is robust to sessions where subjects do not vote in committees over issues of common interest. This result of recency effect mirrors what observed in field experiments on political message effectiveness during electoral campaigns [13].
The effect of recency of public information can have important political implications. Consider for instance the timing of political scandals’ breaking: if the timing of message delivery matters, then it is more likely that voters take into account a scandal involving a politician when voting if the scandal happens close to the election date. A recent illustration of what is known as an “October surprise” in American Politics was Comey’s announcement about reopening the email investigation of Hillary Clinton’s emails. The announcement came on 28 October 2016, ten days before the Presidential election won by Donald Trump. Although it is hard to assess the effect of this announcement on the election’s outcome, it is reasonable to believe that this affected voters more than had it been announced six months before. The fact that voters overreact to salient, recent information, can explain the strategic choice of when to drop a bombshell.
Funding
This research was funded by the Columbia Experimental Laboratory for the Social Sciences (CELSS).
Conflicts of Interest
The author declares no conflict of interest.
Appendix A. Online Appendix
Appendix A.1. Proofs—Preliminaries
Let’s first consider for simplicity a committee of size . The next section generalizes to committees of arbitrary size. Define by the probability that a voter votes according to the public signal (in favor of state A), when her private signal is the opposite (in favor of state B), that is, .
Under pivotality, the posterior probabilities of state A and state B being true given signals are respectively:
Player i votes for alternative A when receiving signals and if
With a normalized utility function, under pivotality:
Appendix A.2. Main Results
Proof of lemma 1.
We are looking for an equilibrium in which agents always follow the private signal when the public signal goes in the opposite direction: this corresponds to . For this value of , the pure strategy is to vote according to the private signal whenever its accuracy is greater than that of the public one.
Committee of size 3. To find the values of q, Q such that it is a dominant strategy to follow the private signal, set Equation (A1) equal to Equation (A2) and :
which shows that, when , it is a dominant strategy to follow the private signal.
Committee of arbitrary size. In this case, Equation (A3) becomes
Rearranging yields:
Setting we can simplify Equation (A4) as
which shows that, when , it is a dominant strategy to follow the private signal.
Hence, there exists an equilibrium in which every agent always vote with the private signal if and only if . In this equilibrium, agents never follow the public signal, that is, . □
Proof of Proposition 1.
Committee of size 3. In order to characterize the equilibrium mixing probability, , we set equal the expected utilities for the two alternatives
which corresponds to the following value for the equilibrium probability of following the public signal
In order to find the threshold , consider the case of . For this value of , the pure strategy is to vote according to the public signal whenever its accuracy is greater than the following value. In a committee of three members, this is equal to
Committee of arbitrary size. Consider a committee of arbitrary size N (with N odd). In order to characterize the equilibrium mixing probability, , set
Rearranging we get the following:
We want to solve for . Let us call the following value
which allows to rewrite the previous equation as
Solving for , we get
Therefore, in a committee of arbitrary size, the agents whose private signal disagrees with the public vote according to the private with probability , where . A proof of uniqueness is provided by Reference [15] and KV. □
Proof of Corollary 1.
This follows from Proposition 1, substituting . □
Appendix A.3. Aggregate Data—Individual Sessions
Figure A1.
Asymmetric prior treatment in individual sessions. Average fraction of votes with public signal under mismatch and confidence intervals. Standard errors are clustered at the individual level. The blue columns correspond to the last 10 rounds in each sessions, where the public signal content was conflated in the prior. Note: Blue lines represent the unique optimal decision in the individual treatment (follow the more precise signal).

Figure A2.
Recency effects in individual sessions. Average fraction of votes with public signal under mismatch and confidence intervals. Standard errors are clustered at the individual level. Blue lines represent the unique optimal decision in the individual treatment (follow the more precise signal).

Figure A3.
Jingle effects in individual sessions. Average fraction of votes with public signal under mismatch and confidence intervals. Standard errors are clustered at the individual level. Blue lines represent the unique optimal decision in the individual treatment (follow the more precise signal).


Table A1.
Jingle and recency effects in individual sessions. The dependent variable is a dummy variable equal to 1 when public and private signals differ, and the subject votes according to the public signal, 0 otherwise. The variable Jingle is a dummy variable equal to 1 when the public information is displayed with a salient video, and the variable Public last is a dummy variable equal to 1 when the public signal is displayed before the private signal. Column (3) shows that when controlling for order effects, the effect of the jingle is not significant anymore. Standard errors are clustered at the individual level in parenthesis. * corresponds to , ** to , and *** to .
| Vote Public | |||
|---|---|---|---|
| (1) | (2) | (3) | |
| Jingle | 0.048 ** | 0.050 | |
| (0.023) | (0.033) | ||
| Public Last | 0.055 *** | 0.057 ** | |
| (0.020) | (0.023) | ||
| Jingle * Public Last | −0.005 | ||
| (0.047) | |||
| Observations | 2414 | 2414 | 2414 |
Appendix A.4. Individual Data
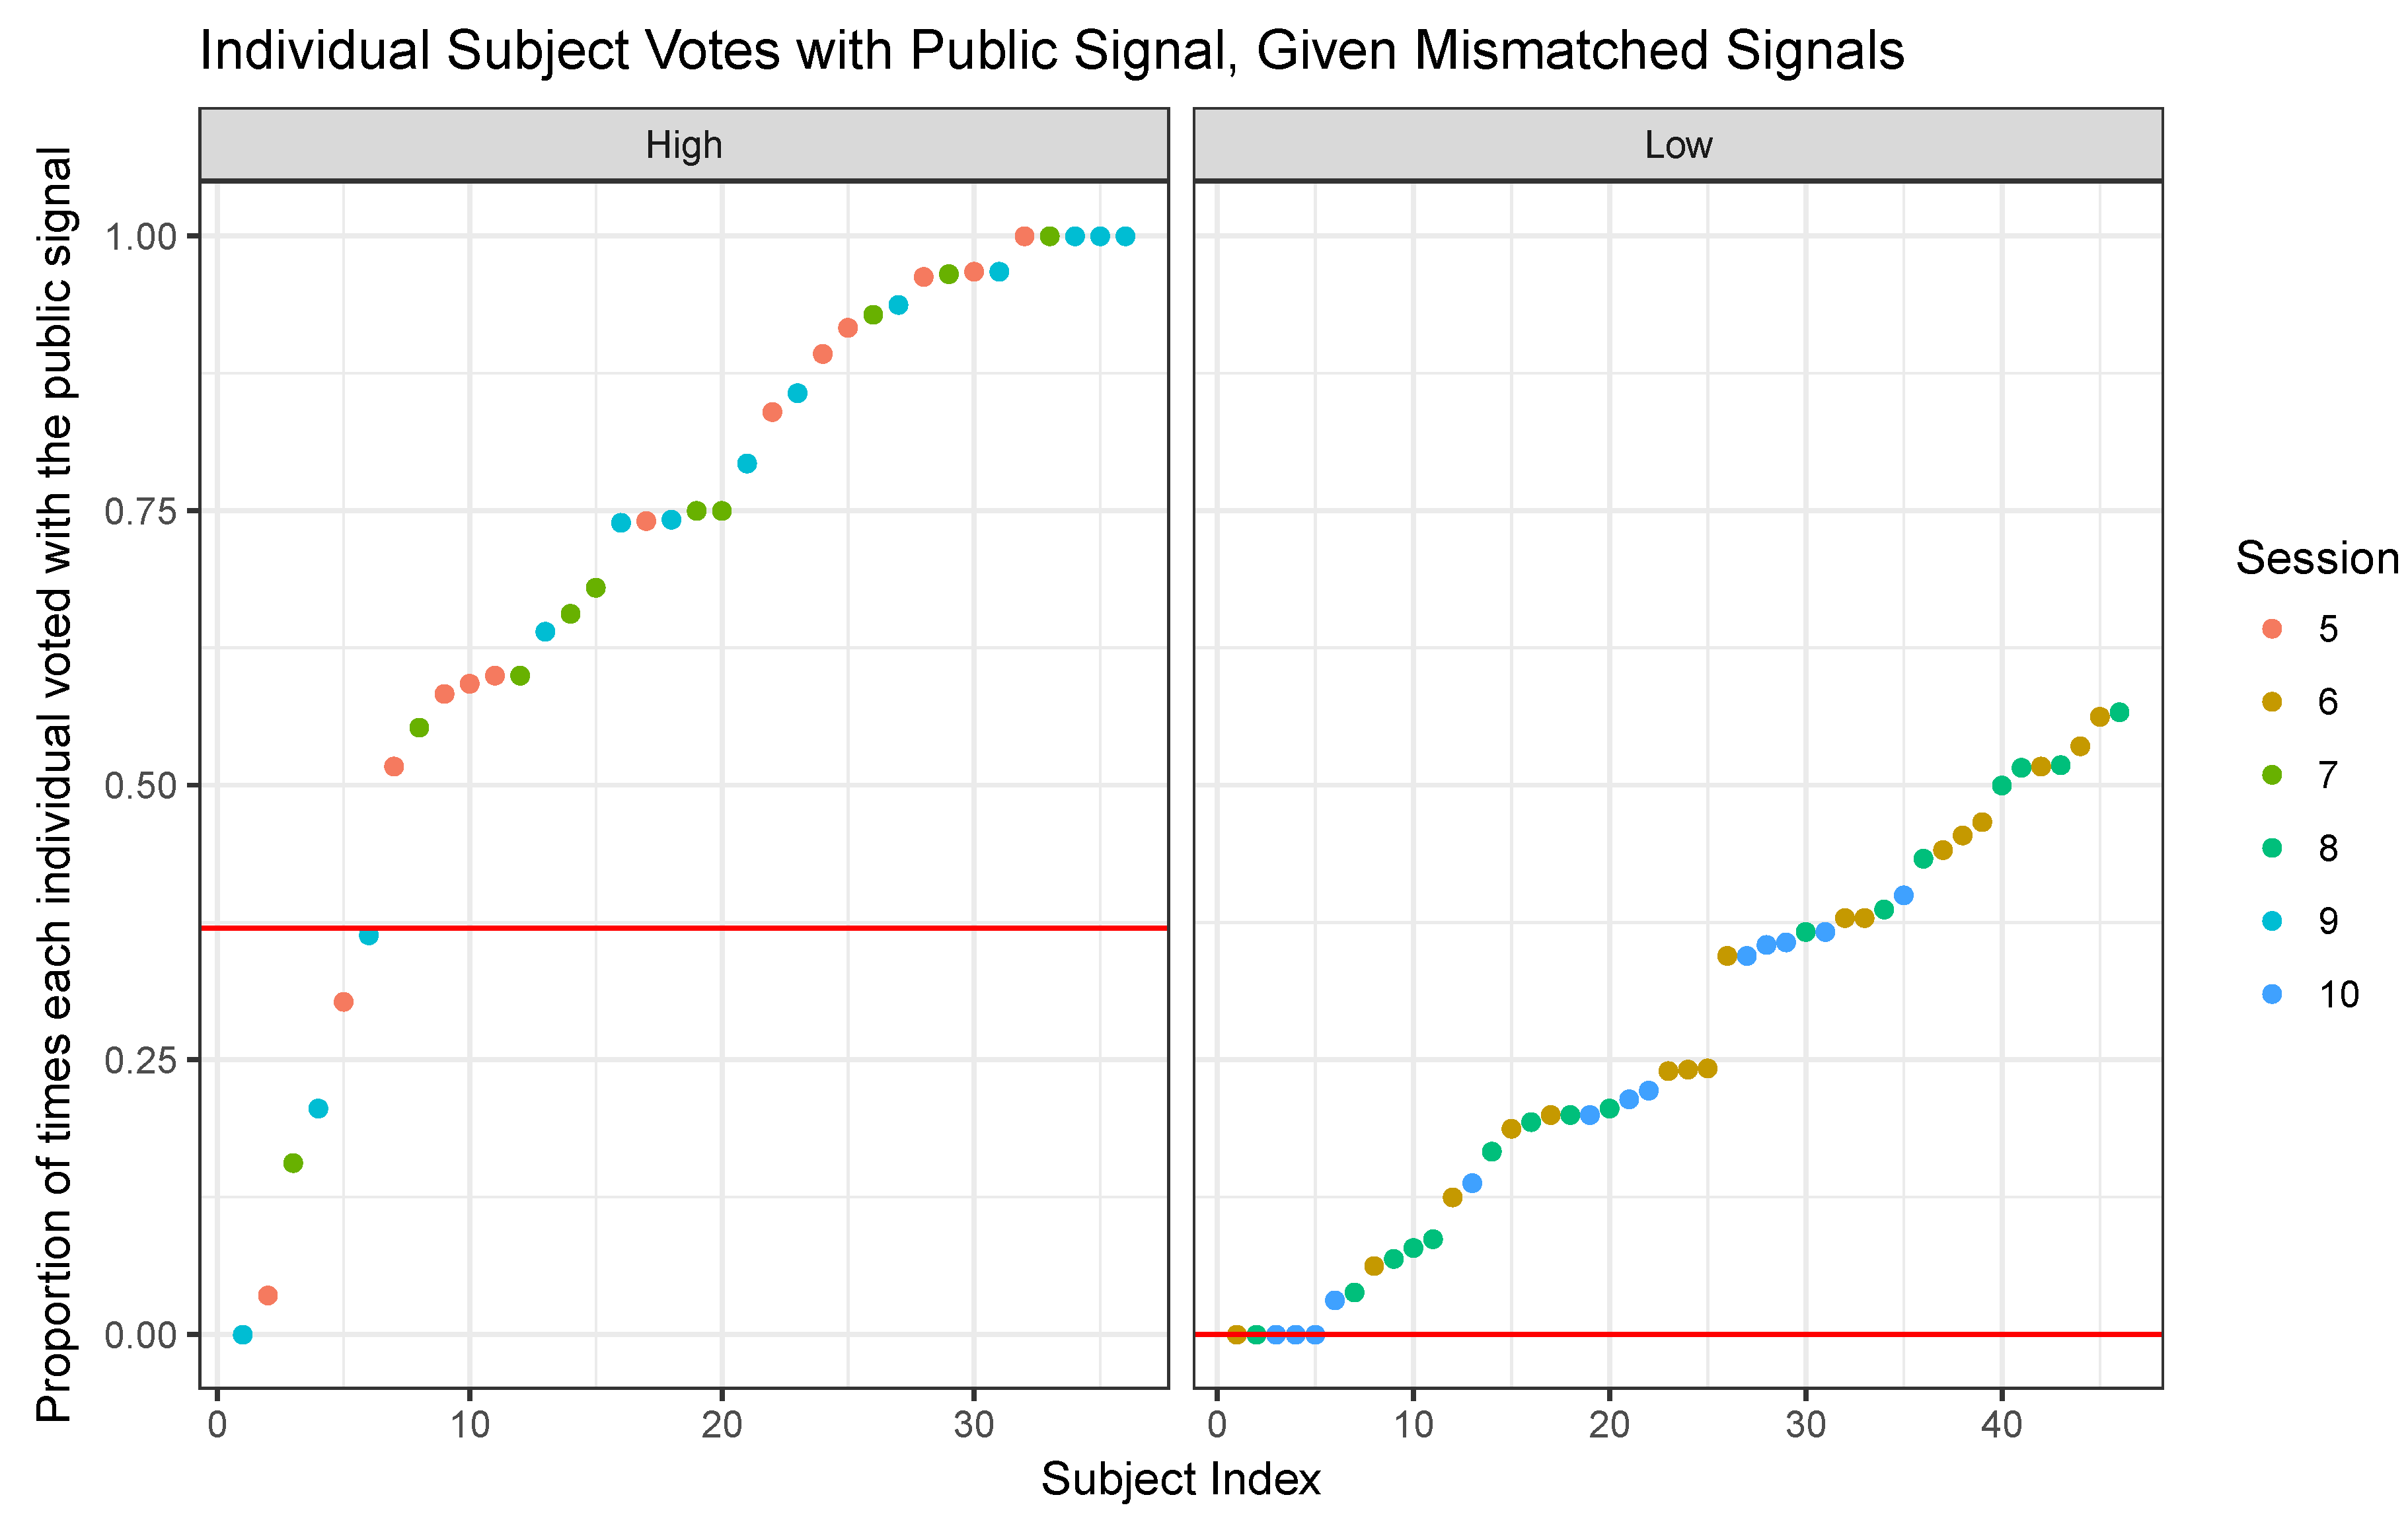
For the individual analysis, I first consider subjects in session 1 through 4, those with committees and a group decision making problem. Figure A4 clearly shows that subjects are homogeneous across different sessions. The plots indicate the proportion of times that each individual voted according to the private signal. The left image is for the sessions with higher public signal accuracy (), and the right one for the others (). Figure A5 performs the same check for the sessions with an individual task. There is no evidence that subjects respond heterogeneously to the public accuracy treatment.
Figure A4.
Proportion of times each individual voted according to the public signal in the first four sessions (with group task). The left image plots values for sessions where , the right one . Different colors correspond to different sessions.
Figure A4.
Proportion of times each individual voted according to the public signal in the first four sessions (with group task). The left image plots values for sessions where , the right one . Different colors correspond to different sessions.

Figure A5.
Proportion of times each individual voted according to the public signal in sessions 5–10 (with individual task). The left image plots values for sessions where , the right one . Different colors correspond to different sessions.
Figure A5.
Proportion of times each individual voted according to the public signal in sessions 5–10 (with individual task). The left image plots values for sessions where , the right one . Different colors correspond to different sessions.

Figure A6.
Asymmetric Prior (group task): Proportion of times each individual voted according to the public signal. The left image plots values for sessions where , the right one . Red dots correspond to the public signal delivered, blue dots to public signal conflated in the prior.
Figure A6.
Asymmetric Prior (group task): Proportion of times each individual voted according to the public signal. The left image plots values for sessions where , the right one . Red dots correspond to the public signal delivered, blue dots to public signal conflated in the prior.

Figure A7.
Jingle effect (group sessions). Proportion of times each individual voted according to the public signal. The left image plots values for sessions where , the right one . Blue dots correspond to the public signal displayed with the jingle.
Figure A7.
Jingle effect (group sessions). Proportion of times each individual voted according to the public signal. The left image plots values for sessions where , the right one . Blue dots correspond to the public signal displayed with the jingle.

Figure A8.
Jingle effect (individual sessions). Proportion of times each individual voted according to the publice signal. The left image plots values for sessions where , the right one . Blue dots correspond to the public signal displayed with the jingle.
Figure A8.
Jingle effect (individual sessions). Proportion of times each individual voted according to the publice signal. The left image plots values for sessions where , the right one . Blue dots correspond to the public signal displayed with the jingle.

Recall that each session is comprised of 70 rounds, and in the last ten rounds subjects received an asymmetric prior and no public signal. The information conveyed was the same. Figure A6 plots, for the group treatment, the difference in how individuals vote when they receive two separate signals, a private and a public (first 60 sessions), and when they only receive a private, and the public information is conveyed by the prior (last ten rounds). This treatment tests the null hypothesis that individuals behave as Bayesian in recognizing that the posterior is the same in the two cases. As we can see there is a lot of heterogeneity, which leads us to reject the null hypothesis of constant treatment effect among our subjects. The same robustness check is run for the recency and jingle treatments, and is displayed in the figures that follow.
Figure A9.
No Learning. This figure plot aggregate votes as a function of time (experimental rounds. Subjects’ behavior does not approach theoretical predictions.)
Figure A9.
No Learning. This figure plot aggregate votes as a function of time (experimental rounds. Subjects’ behavior does not approach theoretical predictions.)

Appendix A.5. Experimental Instructions
Welcome to the Lab!18 Please, listen to these instructions carefully. If you have any question at any point, please raise your hand. Communication between participants is not allowed during the experiment.
Your participation to the experiment will be rewarded by a payment in cash, immediately and privately after the experiment. The amount of money that you will earn depends on your decisions, the decisions of other participants, and on luck. During the experiment, your earnings will be calculated in experimental currency. After the experiment, your payoff will be converted into dollars (USD) according to the following conversion rate: 200 experimental dollars = 1 US dollar, rounded to the closest integer value. Additionally, you will receive 5 US dollars as a show-up fee, independently of the results during the experiment.
The experiment is comprised of two parts. The first part consists of a total of 60 rounds. The second part consists of a total of 10 rounds. During the first part, in every round you will be randomly divided in groups of five people. All participants are anonymous; nobody knows which other participants are in their group, and nobody will be told who was in which group after the experiment. Each group will make the same decisions, but what happens in the other groups has no relevance for yours. At the end of each round, the groups are newly shuffled.
At the beginning of each round, the computer places a prize in one of two virtual boxes: the blue box or the red box [SHOW PICTURE 1]. It is equally likely that the prize is placed in either box. You will not know which box the computer has chosen. Each group’s task will be to guess which box contains the prize.
Each participant will receive two separate messages about the location of the prize. One message is private and only you can see it. The other message is public and everyone sees it.
The private message you receive is more likely to be correct than not, but it’s not perfectly reliable. It is correct on average of the times. The message is generated by the computer independently for each group member and revealed to each member separately. Private messages can be different for different group members.
In addition to the private message everyone receives, a public message will appear on the central screens. Is it correct on average 60% of the time. The public message may appear in different ways but its accuracy does not depend on the format it takes [emphasize].
Neither the public message nor the private messages are 100% reliable in predicting which box contains the prize, but both messages are more likely to be correct than incorrect. Consider the table on the screen: If the box selected by the computer is the red one, it is more likely that both messages are correct than not, and the least likely event is that both are wrong. [Picture 2].
After you and every member of your group have received both messages, you will be asked to guess which box contains the prize. You have two options: you can either vote for BLUE or for RED [SHOW PICTURE 3].
Remember that what matters for your earnings is the group decision. The box that receives the majority of the votes in your group of 5 people is the group choice for the round. In every round, each member of the group earns:
- 70 experimental dollars if the group guessed the correct box;
- 10 experimental dollars if the group guessed the wrong box.
Your earnings are determined exclusively by the group choice. These earnings are independent of how a particular group member voted.
At the end of the round you will learn:
- The number of votes for the blue box cast by your group;
- The number of votes for the red box cast by your group;
- The box selected by majority in your group;
- The outcome of the period: that is, whether the group decision was correct or not;
- The earnings for the round.
[screenshot feedback screen]
This feedback screen marks the end of the round. After everyone votes, you will move to the next round, in which new groups are formed randomly. The prize is again randomly placed in one of the two boxes, and each box is equally likely to be selected.
In order to begin the experiment, you need to correctly answer to a brief questionnaire. If you have any question, ask now or during the questionnaire. When all the participants have completed the questionnaire, the first round of the experiment will automatically start.
Appendix A.6. Last Ten Rounds
Now that the first part of the experiment ended, you will start the second part, which is comprised of ten rounds.
As in part 1, at the beginning of each round, the computer places a prize in one of two virtual boxes: the blue box or the red box. Differently from the first part, in these rounds the computer places the prize in the BLUE box 7 out of 10 times, which means . [slide: THE PRIZE IS PLACED IN BLUE BOX 7 OUT OF 10 TIMES]. The box that does not contain the prize remains empty. You will not know which box the computer has chosen. As in the previous part, the group’s task will be to guess which box contains the prize.
In this part of the experiment, you will receive only a private message about the location of the prize. The private message you receive is more likely to be correct than not, but it’s not perfectly reliable. It is correct on average 6 out of 10 times, which means . The message is generated by the computer independently for each group member and revealed to each member separately. Private messages can be different for different group members. No other participant of the experiment will know which private message you received.
After you and every member of your group have received a message, you will be asked to guess which box contains the prize. As in part 1, you will see a feedback screen at the end of each round. If there are no question, you can now begin part 2.
We have now completed the experiment. Please, remain seated and wait for your number to be called and receive your payment.
References
- Garthwaite, C.; Moore, T.J. Can celebrity endorsements affect political outcomes? Evidence from the 2008 US democratic presidential primary. J. Law Econ. Organ. 2012, 29, 355–384. [Google Scholar] [CrossRef] [Green Version]
- Bordalo, P.; Gennaioli, N.; Shleifer, A. Salience theory of choice under risk. Q. J. Econ. 2012, 127, 1243–1285. [Google Scholar] [CrossRef] [Green Version]
- Kahneman, D.; Tversky, A. Choices, values, and frames. Am. Psychol. 1984, 39, 341. [Google Scholar] [CrossRef]
- Erev, I.; Haruvy, E. Learning and the economics of small decisions. In The Handbook of Experimental Economics; Princeton University Press: Princeton, NJ, USA, 2013; Volume 2, ISBN 9781400883172-011. [Google Scholar]
- Fudenberg, D.; Peysakhovich, A. Recency, records, and recaps: Learning and nonequilibrium behavior in a simple decision problem. ACM Trans. Econ. Comput. (TEAC) 2016, 4, 23. [Google Scholar] [CrossRef]
- Fudenberg, D.; Levine, D.K. Recency, consistent learning, and Nash equilibrium. Proc. Natl. Acad. Sci. USA 2014, 111, 10826–10829. [Google Scholar] [CrossRef] [PubMed] [Green Version]
- Neligh, N. Rational Memory with Decay, 2019; unpublished work.
- Strömberg, D. Media and politics. Economics 2015, 7, 173–205. [Google Scholar] [CrossRef] [Green Version]
- Condorcet. Essai sur L’application de L’analyse ala Probabilité des Décisions Rendues ala Pluralité des Voix (Essay on the Application of the Analysis to the Probability of Majority Decisions); L’Impremerie Royale: Paris, France, 1785; Facsimile edition New York: Chelsea, 1972. [Google Scholar]
- Austen-Smith, D.; Banks, J.S. Information aggregation, rationality, and the Condorcet jury theorem. Am. Political Sci. Rev. 1996, 90, 34–45. [Google Scholar] [CrossRef] [Green Version]
- Kawamura, K.; Vlaseros, V. Expert information and majority decisions. J. Public Econ. 2017, 147, 77–88. [Google Scholar] [CrossRef] [Green Version]
- Gratton, G.; Holden, R.; Kolotilin, A. When to drop a bombshell. Rev. Econ. Stud. 2017, 85, 2139–2172. [Google Scholar] [CrossRef]
- Nickerson, D.W. Quality is job one: Professional and volunteer voter mobilization calls. Am. J. Political Sci. 2007, 51, 269–282. [Google Scholar] [CrossRef]
- Panagopoulos, C. Timing is everything? primacy and recency effects in voter mobilization campaigns. Political Behav. 2011, 33, 79–93. [Google Scholar] [CrossRef]
- Wit, J. Rational choice and the Condorcet jury theorem. Games Econ. Behav. 1998, 22, 364–376. [Google Scholar] [CrossRef]
- Liu, S. Voting with public information. Games Econ. Behav. 2019, 113, 694–719. [Google Scholar] [CrossRef] [Green Version]
- Fischbacher, U. z-Tree: Zurich toolbox for ready-made economic experiments. Exp. Econ. 2007, 10, 171–178. [Google Scholar] [CrossRef] [Green Version]
- Ciccarelli, S.K.; White, J.N.; Fritzley, V.H.; Harrigan, T. Psychology: An Exploration; Pearson Prentice Hall: Upper Saddle River, NJ, USA, 2010. [Google Scholar]
- Crowder, R.G. Principles of Learning and Memory: Classic Edition; Psychology Press: New York, NY, USA; London, UK, 2014. [Google Scholar]
- Cook, T.D.; Flay, B.R. The persistence of experimentally induced attitude change. Adv. Exp. Soc. Psychol. 1978, 11, 1–57. [Google Scholar]
- Tversky, A.; Kahneman, D. Judgment under uncertainty: Heuristics and biases. Science 1974, 185, 1124–1131. [Google Scholar] [CrossRef] [PubMed]
| 1. | The article can be found here: https://www.mirror.co.uk/news/uk-news/who-legend-roger-daltrey-hes-8252353. There were several other instances of this kind. Google searches for celebrities and Brexit peaked in the week before the referendum, and many web pages displayed long lists of Brexit’s supporters. |
| 2. | |
| 3. | |
| 4. | This challenge is posed by Reference [8], who suggests that to isolate framing mechanisms, one would need to study the effect of completely uninformative events. |
| 5. | Assume that voters cannot abstain, and that there is no cost of casting votes. |
| 6. | For instance, consider a committee of five members where each member observes a private signal and everyone observes the same public signal. One equilibrium is that one member of the committee votes with her private signal, when this disagrees with the public, and the other four members vote with (against) the public signal. In another equilibrium, two committee members vote with their private signals, which disagree with the public, and the other three members of the committee vote with (against) the public signal. |
| 7. | This is true for the first four sessions. As displayed in Table 1 and explained later, in sessions 5–10 there were no committees and subjects performed an individual task. |
| 8. | The position of the vote buttons was randomly shuffled in each round. |
| 9. | Reference [2] formalize this assumption in a model where decision makers overweight states that draw their attention by comparing payoff magnitude in different lotteries. This experimental treatment manipulates salience by changing the way information is presented, rather than payoffs. |
| 10. | All the videos are available upon request. |
| 11. | Administering the salience treatments within subjects was a natural choice to get more data points under the time and budget constraints. |
| 12. | One possibility is that subjects realize that others do not play the symmetric responsive equilibrium, and best respond to that. For instance, if a subject realizes that some other committee members always play the conformist equilibrium in favor of the public signal, then she would best respond by voting for the public signal less than what prescribed by the symmetric responsive equilibrium. In each session, the average vote with the public signal (when signals do not match) is close to . A best-response to this would be to vote with the public signal less than of the time (the symmetric responsive equilibrium prediction). The data show that subjects follow the public signal more than what these best replies to experimental data predict. |
| 13. | It might be that some subjects are playing the conformist equilibria and others are mixing. With Figure 1 we would not be able to disentagle between the two behaviors. |
| 14. | KV only analyze the case where , with slightly different parameters and committee size. |
| 15. | I also performed a Kolmogorov–Smirnov test to compare the two samples of voting for the public signal when it is provided before or after the private. Although we cannot reject that the two distribution are the same (with a p-value of ), the number of observation is too small to rely on this result, and graphically showing the ECDFs provides much better evidence. |
| 16. | As Figure A4 and Figure A5 in Appendix A show, there are no session-specific effects: individual votes are homogeneous across different sessions. |
| 17. | All the salience treatment effects in the individual task sessions are shown in Appendix A. |
| 18. | These are the instructions for sessions with group task and high public signal accuracy. The other instructions and the pictures displayed during the instruction period are available upon request. |
Figure 1.
Responsiveness of vote to signals’ precision: Average fraction of votes with public signal in sessions with committee decisions, and associated confidence intervals. Standard errors are clustered at the individual level. In the left plot, the public signal and the private signal disagree, and red lines represent the symmetric responsive equilibrium prediction for , the probability of voting for the public signal under mismatch. In the right plot, the signals agree, and blue lines represent the unique optimal decision when the two signals agree.

Figure 2.
Individual deviations from equilibria under mismatch: Red lines represent the symmetric equilibrium predictions for , when the public and private signal disagree. Blue lines represent the conformist equilibrium prediction. When (upper picture), the number of subjects who vote more with the public signal is greater than when (lower picture).

Figure 3.
Asymmetric prior treatment: Average fraction of votes with public signal under mismatch, and confidence intervals. Standard errors are clustered at the individual level. Dark columns correspond to rounds where the public signal was provided. Light columns correspond to the last 10 rounds in each sessions, where the public signal content was conflated into the prior. Note: Horizontal lines represent the symmetric responsive equilibrium prediction for .

Figure 4.
Recency effect: Average fraction of votes with public signal under mismatch, and confidence intervals. Standard errors are clustered at the individual level. Dark columns correspond to rounds where the public signal is displayed first. Horizontal lines represent symmetric responsive equilibrium predictions for .

Figure 5.
Jingle effect: Average fraction of votes with public signal under mismatch, and confidence intervals. Standard errors are clustered at the individual level. Dark columns correspond to rounds where the public signal is displayed with the jingle. Horizontal lines represent symmetric responsive equilibrium predictions for .

Figure 6.
Individual average treatment effect of recency. Each dot represents the proportion of rounds an individual votes with the public signal under mismatch. Dark dots correspond to when the public signal is more recent, light dots when the private is more recent. Horizontal lines represent the symmetric responsive equilibrium predictions for . Recency has a positive, constant effect across different subjects.

Figure 7.
Individual task vs. group task. Average fraction of votes with public signal, with confidence intervals. Standard errors are clustered at the individual level. Horizontal dotted lines represent symmetric responsive equilibrium predictions for . Solid lines represent the unique optimal decision in the individual treatment (follow the more precise signal).

Figure 8.
Recency effect (individual sessions). Each dot represents the proportion of rounds an individual votes with the public signal. Dark dots correspond to when the public signal is more recent, light dots when the private is more recent. The left image plots values for sessions where , the right one . Horizontal lines represent the symmetric responsive equilibrium predictions for . Recency has a positive, constant effect across different subjects.

Table 1.
Summary of experimental sessions. The accuracy of the private signal was set to throughout the whole experiment. A total of 75 subjects were assigned to a “group” condition, and divided in committees of size five. The other 82 subjects were assigned to an “individual” condition.
Table 1.
Summary of experimental sessions. The accuracy of the private signal was set to throughout the whole experiment. A total of 75 subjects were assigned to a “group” condition, and divided in committees of size five. The other 82 subjects were assigned to an “individual” condition.
| Session | Q | Committee, Size | # Rounds | # Subjects |
|---|---|---|---|---|
| Yes, 5 | 70 | 20 | ||
| Yes, 5 | 70 | 20 | ||
| Yes, 5 | 70 | 20 | ||
| Yes, 5 | 70 | 15 | ||
| No | 70 | 13 | ||
| No | 70 | 17 | ||
| No | 70 | 10 | ||
| No | 70 | 16 | ||
| No | 70 | 13 | ||
| No | 70 | 13 |
Table 2.
Factorial design for every session (for both and ). The row values are associated to the recency treatment (i.e., whether the private signal was displayed before or after the public). The column values are associated with the jingle treatment. The values within the matrix display the number of rounds for each interaction.
| Asymmetric prior | - | 10 rounds |
| Public first | 8 rounds | 22 rounds |
| Private first | 8 rounds | 22 rounds |
Table 3.
OLS regression. The dependent variable is a dummy variable equal to 1 when public and private signals differ, and the subject votes according to the public signal, 0 otherwise. The variable Jingle is a dummy variable equal to 1 when the public information is displayed with a salient video, and the variable Public last is a dummy variable equal to 1 when the public signal is displayed after the private signal. Column (3) shows that, when controlling for order effects, the effect of the jingle remains significant, but the magnitude of recency is higher. Standard errors are clustered at the individual level in parenthesis. * corresponds to and *** to .
| Vote Public | |||
|---|---|---|---|
| (1) | (2) | (3) | |
| Jingle | 0.047 * | 0.059 * | |
| (0.024) | (0.034) | ||
| Public Last | 0.131 *** | 0.138 *** | |
| (0.022) | (0.026) | ||
| Jingle * Public Last | −0.025 | ||
| (0.049) | |||
| Observations | 2068 | 2068 | 2068 |
© 2020 by the author. Licensee MDPI, Basel, Switzerland. This article is an open access article distributed under the terms and conditions of the Creative Commons Attribution (CC BY) license (http://creativecommons.org/licenses/by/4.0/).
Share and Cite
MDPI and ACS Style
Invernizzi, G.M. Public Information: Relevance or Salience? Games 2020, 11, 4. https://0-doi-org.brum.beds.ac.uk/10.3390/g11010004
AMA Style
Invernizzi GM. Public Information: Relevance or Salience? Games. 2020; 11(1):4. https://0-doi-org.brum.beds.ac.uk/10.3390/g11010004
Chicago/Turabian StyleInvernizzi, Giovanna M. 2020. "Public Information: Relevance or Salience?" Games 11, no. 1: 4. https://0-doi-org.brum.beds.ac.uk/10.3390/g11010004
Note that from the first issue of 2016, this journal uses article numbers instead of page numbers. See further details here.