1. Introduction
The world growing energy demand has incited important discussions about the current energy system based on fossil fuels. Alternative energy sources from renewable resources are needed mainly due to ever-higher amounts of greenhouse gas emissions and oil price fluctuation [
1].
In this context, biofuels, especially ethanol and butanol, represent potential substitutes of fossil fuels, such as gasoline. Currently, those alcohols are produced through fermentation processes, mostly using sugarcane and corn as the raw material. The major disadvantage of these processes is the competition between food and fuel production [
2]. Lignocellulosic feedstocks from agricultural waste or directly from energy crops emerge as alternative raw materials for biofuel production as they are inexpensive, renewable, and do not affect food supply [
3,
4].
The biochemical conversion of lignocellulosic feedstocks into biofuels by anaerobic bacteria, such as
Clostridium species, produces mainly acetone, butanol, and ethanol (ABE), through ABE fermentation [
5]. However, a complex pre-treatment is required to obtain simple sugars from the polymeric structure of lignocellulose [
6]. An alternative destination for lignocellulosic feedstocks involves biomass gasification, which eliminates the pre-treatment step. In this case, full use of lignocellulosic biomass, including lignin, is possible through thermochemical conversion. Besides, urban solid residues can also be used as feedstock for gasification, with the advantage of reducing environmental impacts. The biomass gasification results in synthesis gas mainly composed of CO (carbon monoxide), CO
2 (carbon dioxide), and H
2 (hydrogen). Synthesis gas, also named syngas, obtained from gasification, can be converted into ethanol and higher alcohols as butanol and hexanol, through a hybrid thermo/biochemical process. This conversion can be performed by
Clostridum sp., being
Clostridium ljungdahlii,
C. carboxidivorans,
C. autoethanogenum, and
C. rasgdalei the most studied species. These species use the acetyl-CoA metabolic pathway, also known as Wood–Ljungdahl pathway, for acetyl-CoA synthesis, energy conservation, and alcohol and acid production [
7].
A current problem of anaerobic bioprocesses is low cell density, which reduces productivity [
8]. Usually, media composition used in CO/CO
2 fermentation is similar to sugar-based media for
Clostridium sp. growth and butanol production. Numerous and expensive components are mixed to provide essential metals, vitamins, minerals, and nitrogen needed for cell growth and metabolism [
9]. As consequence, the preparation of those media requires intensive labor and is expensive. Replacing these compounds by cheaper and complex sources is an important challenge. ATCC
® medium 2713 (Wilkins Chalgren Anaerobic Medium) is indicated by American Type Culture Collection (ATCC) for
Clostridium carboxidivorans activation and growth and ATCC
® medium 1754 (without fructose) is another common medium used for syngas fermentation by
Clostridium carboxidivorans, reported by several authors [
10,
11,
12,
13,
14]. Low specific growth rates, ranging from 0.005 to 0.08 h
−1 were reported for those media with gaseous or soluble substrates [
5,
15,
16,
17]. Studies using glucose-rich medium or only carbon monoxide as the carbon source have been carried out to evaluate the effect of the carbon source on cell growth and solvents production [
5,
15,
17,
18,
19,
20,
21] and the maximum values for cell density and specific growth rate were 0.55 g dry weight of cells/L and 0.231 h
−1, respectively. In addition, the effects of trace metals on product formation were assessed [
1,
22,
23,
24,
25,
26] and the maximum ethanol production reported was 3.5 g/L after 72 h of fermentation [
22].
Therefore, the goal of this work was to obtain a low-cost culture medium, reduced also in number of components, by a sequence of experimental designs in order to improve cell growth and solvents production by Clostridium carboxidivorans using glucose and syngas as carbon sources.
3. Discussion
In the exploratory study to evaluate medium components effect on cell growth, tryptone, peptone, yeast extract, and
l-arginine concentrations were considered significant for biomass production. Zhang et al. [
14] reported that trace metals are required for
C. carboxidivorans growth and these elements might be present in yeast extract. Peptone and tryptone are both sources of amino acids. However, as they are obtained from different protein sources (peptone is pancreatic digested gelatin and tryptone is the pancreatic digested casein), they might have complementary functions for cell growth. Another important observation is that glucose was not significant for cell growth, which might be related to the presence of CO and CO
2, indicating that syngas was used as the carbon source. Although the best result was obtained for the composition of the ATCC
® medium 2713 (
Table 1, run 16), the statistical evaluation shows that some components are not significant to cell growth, which means that its addition to medium composition just adds costs.
Considering the positive effect of these components on cell growth, the experimental design to optimize this medium was planned with higher concentrations. In that case, peptone was not significant to cell growth, which shows that it was only significant in PB design because tryptone concentration was not enough. The medium proposed for
C. carboxidivorans cell growth after optimization, is reduced to three components, besides syngas. ATCC
® medium 2713 is composed of nine components and many other media reported in literature have more than that, for example BDM—base defined medium (22 components) and P7Mt medium (20 components) [
17]. In those laborious media, cell growth for
C. carboxidivorans ranges from 0.4 to 0.6 g/L [
5,
17,
18]. Therefore, it is evident that the medium proposed in the present work not only has the advantage of being easy to prepare but also yields a higher biomass.
For ethanol, experimental design revealed that a culture medium composed of 12 g/L of tryptone, 12 g/L of peptone from gelatin, 7 g/L of yeast extract, 1.2 g/L of
l-arginine, and 1 g/L of glucose was the best for syngas fermentation, herein called TPYGarg. The development of a culture medium with no yeast extract, but with vitamins (biotin, pantothenic, and p-aminobenzoic acid), ammonia, trace metals, minerals, cysteine, sodium sulfide, and resazurin was reported by Phillips et al. [
17]. After 200 h, around 3.0 g/L of ethanol (approximately, 0.015 g/L·h) was obtained in a medium 27-times cheaper than the standard one [
14]. Despite cheaper, this medium still requires 20 components and demands time to prepare it. A ATCC
® 1754 modified medium was proposed by Ramachandryia [
28], using cotton seed extract (CSE) and morpholinoethanesulfonic acid (MES), with no yeast extract, resulting in 2.78 g/L of ethanol after 350 h of fermentation (approximately, 0.008 g/L·h). A modification in the ATCC
® 1754 medium with MES as buffer was also reported, leading to 6.1 g/L of ethanol in a two stirred-tank bioreactor (in series) [
21], without considering the high cost of MES. Enhancement of alcohol synthesis was reported using CO-rich off-gas fermentation by
C. carboxidivorans by adding molybdenum/iron/cupper, aiming at the enzymes of the microorganism metabolism [
22]. A final ethanol concentration of 3.5 g/L was obtained after 72 h of fermentation (approximately, 0.049 g/L·h) [
19], the higher productivity found for this process in literature so far, but without considering the culture medium cost.
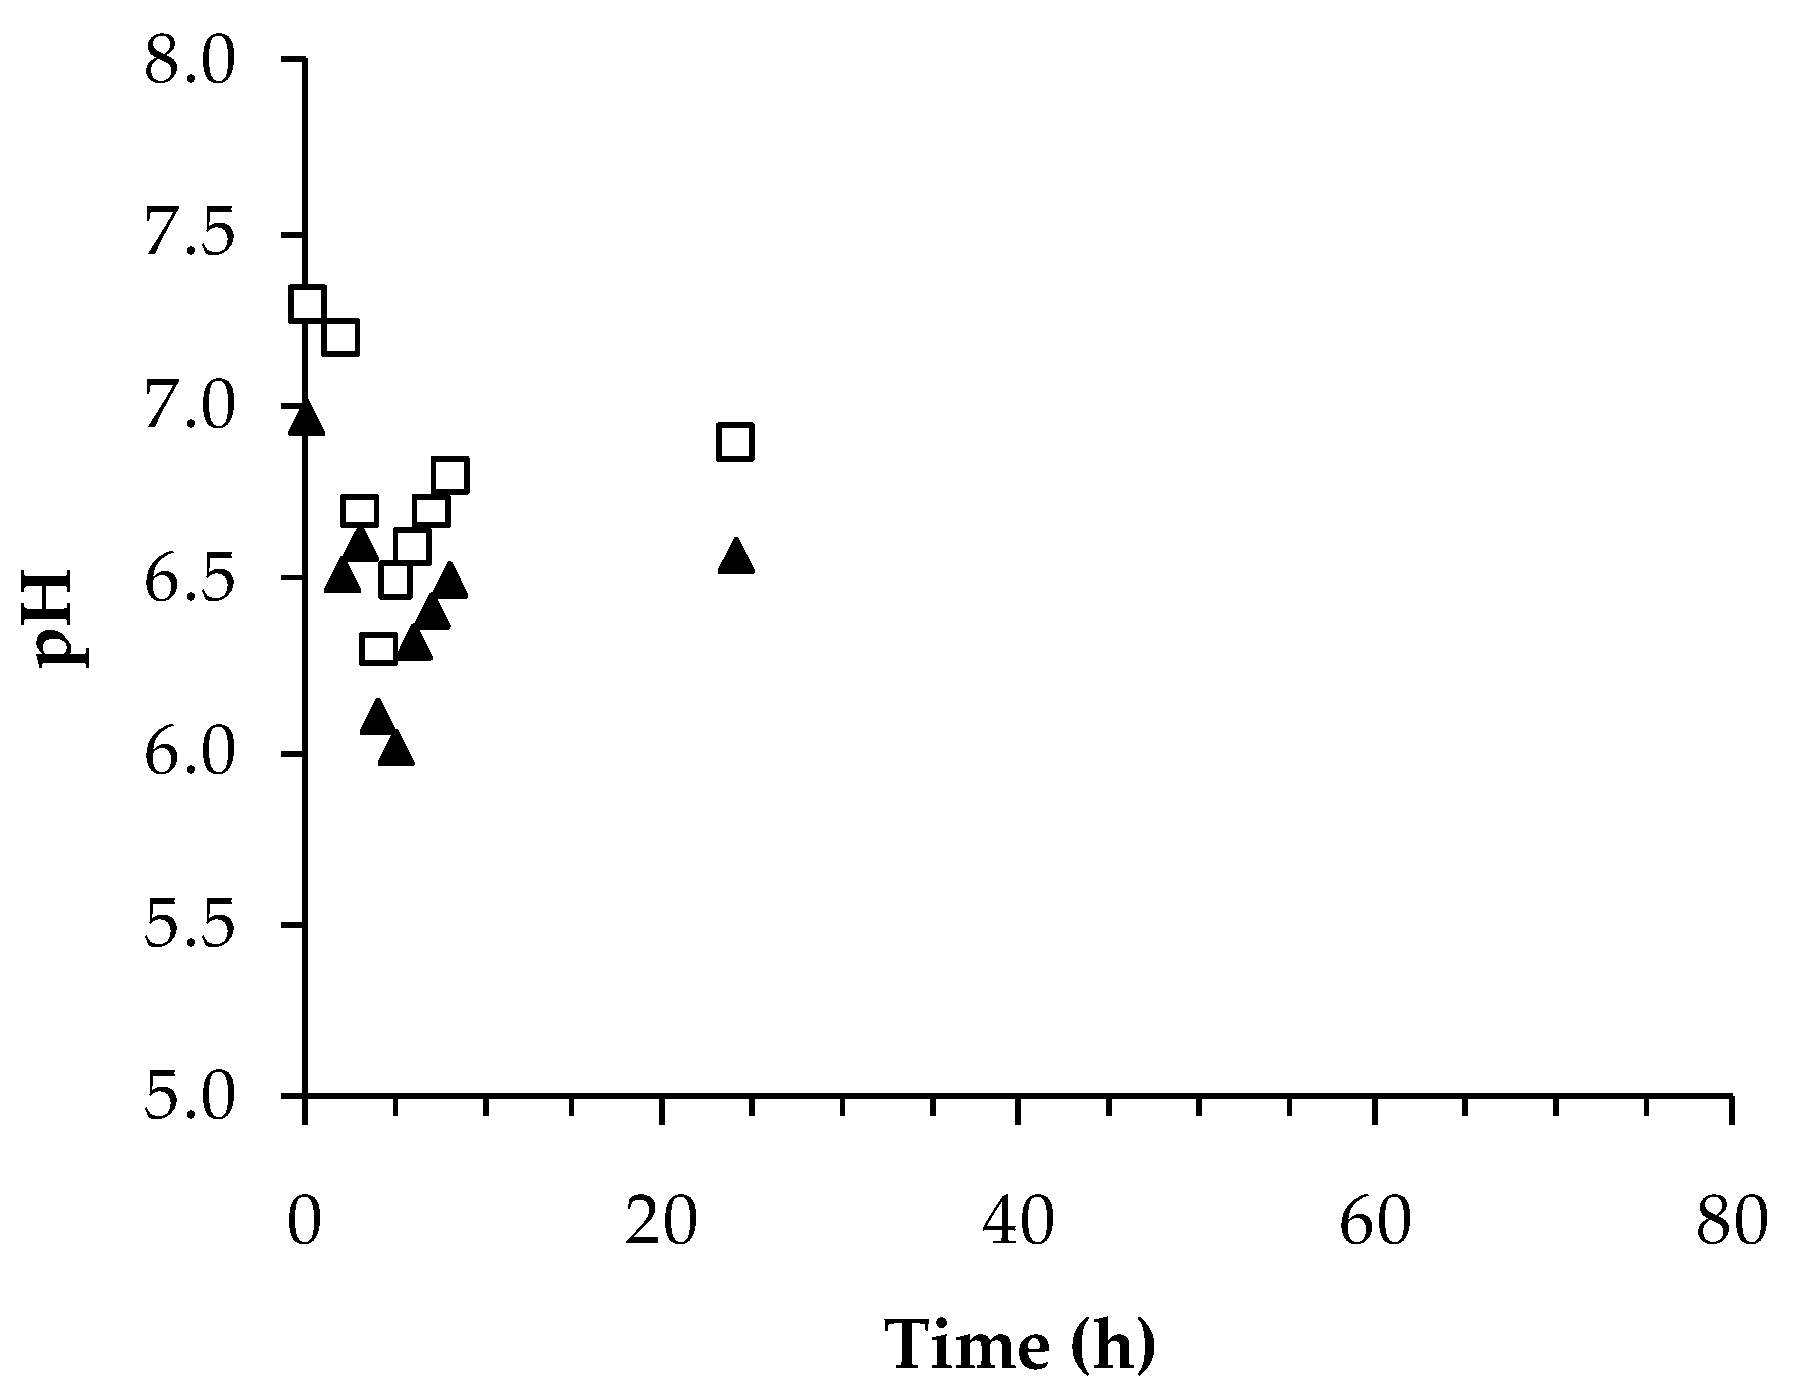
Cell growth, glucose consumption, and medium pH were monitored during syngas fermentation in TPYGarg and high biomass was obtained as well as the detection of two phases: pH reduction in the beginning followed by pH increase. In classical ABE fermentation using glucose as sole carbon source or in HBE fermentation using gaseous substrate, the bioconversion by Clostridia occurs in two steps. First, the exponential bacterial growth and organic acids production can be observed, known as the acidogenesis phase. Then, those acids are converted into solvents as ethanol, butanol, and acetone in the ABE process, and hexanol, butanol, and ethanol in the HBE process, known as the solventogenic phase. The acidogenic phase usually shows greater efficiency at neutral or slightly high pH values, leading to the medium acidification due to acid production. Concerning ABE fermentation, studies have reported that the solventogenic phase is stimulated during medium acidification [
5]. On the other hand, HBE fermentation studies have demonstrated that alcohol production usually occurs near pH 6.0 [
29]. Below this pH level, low alcohol production and a decreasing growth capacity are usually attributed to the “acid crash” phenomenon [
30].
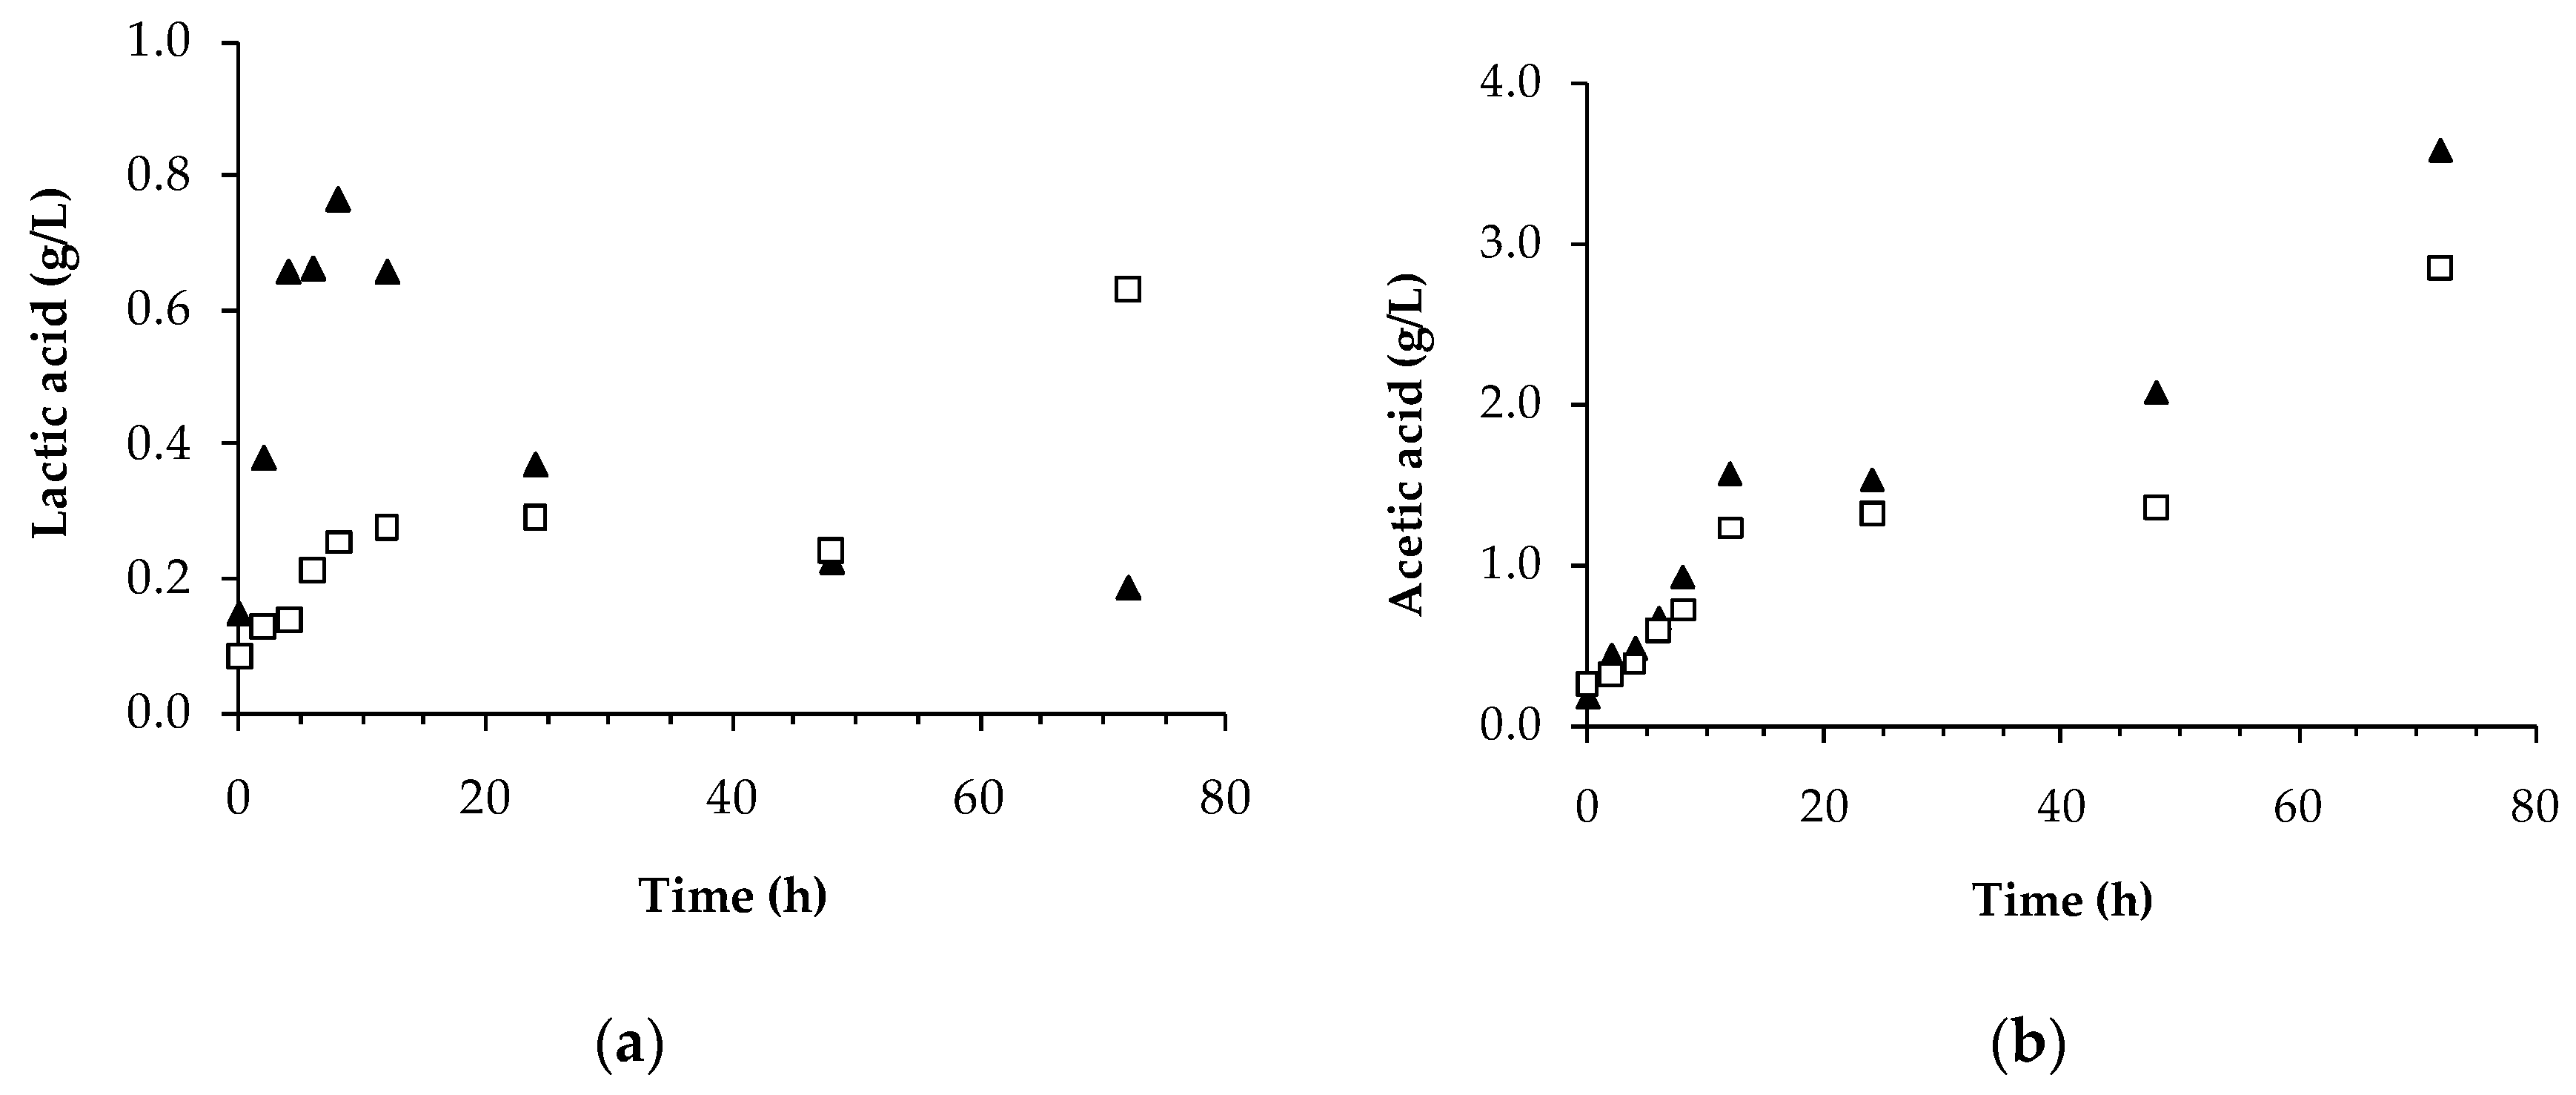
In the present study, solvent production started while glucose was being consumed and cells were growing. Although, it is expected that solventogenic phase only starts after medium acidification as result of acid production, the production of organic acids and solvents occurred simultaneously in the present study. Formation of organic acids occurs during exponential growth, decreasing the culture pH level, making it unfavorable for the cell population and resulting in a metabolic change at the end of the exponential phase. Therefore, those organic acids are partly re-assimilated and rebuilt into neutral products as the solvents. However, not all species and strains of solventogenic clostridia have the same behavior. Lipovsky et al. [
31] and Branska et al. [
32] verified butanol production associated with cell growth by clostridia via the acetone–butanol–ethanol (ABE) pathway.
When using syngas as the only carbon source for C. carboxidivorans fermentation, a mixture of organic acids as acetic, butyric, and hexanoic acids was expected, and further partial conversion of those acids into respective alcohols, following HBE fermentation process. Using glucose as the only carbon source, ABE fermentation was expected, producing lactic, acetic, formic, and propionic acids, which then could be converted into acetone, ethanol, and butanol. However, it was observed that C. carboxidivorans does not follow classical ABE or HBE fermentations when both carbon sources were used (glucose and CO/CO2), since acids and alcohols production were detected at the same time on TPYGarg and ATCC® 2713 media.
Higher growth rates and alcohol productivities obtained in the mixotrophic fermentation (glucose and CO/CO
2) when compared to heterotrophic (glucose) and autotrophic (CO/CO
2) processes reported in the literature [
33], is probably the result of the two metabolic pathways synergy, glycolysis and Wood–Ljungdahl. The glycolysis converts glucose into pyruvate, producing 2 mol of pyruvate, two ATP, and four electrons. The pyruvate is converted to acetyl-CoA, an important intermediate for biofuel production, which results in the release of 2 mol of CO
2 and 4 additional electrons [
33]. The autotrophic metabolism, known as Wood–Ljungdahl (WL) pathway, consists of two branches. In the methyl branch, CO
2 is reduced to a methyl group consuming six electrons and one ATP. While in the carbonyl branch, CO
2 is reduced to CO consuming two electrons. The CO and the methyl group formed in this first step of WL pathway are converted into 1 mol of acetyl-CoA [
33,
34,
35]. Thereby, the glycolysis and WL are complementary pathways as CO
2 and electrons produced in the glycolysis are fully utilized by WL to produce one additional mol of acetyl-CoA increasing its yield by 50% in relation to glucose metabolism. Besides, the syngas feed contributes to enhance the metabolic flow of the WL pathway, as CO, CO
2, and H
2 are introduced [
33].

 and
and 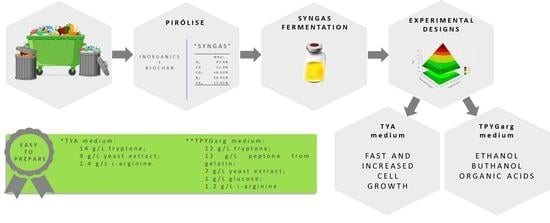


