Recyclabl Metal (Ni, Fe) Cluster Designed Catalyst for Cellulose Pyrolysis to Upgrade Bio-Oil


1
Energy Science and Engineering, Department of Transdisciplinary Science and Engineering, Tokyo Institute of Technology, 2-12-1, Ookayama, Meguro, Tokyo 152-8552, Japan
2
Laboratory of Theoretical and Computational Chemistry, Institute of Theoretical Chemistry, College of Chemistry, Jilin University, Changchun 130023, China
*
Author to whom correspondence should be addressed.
Catalysts 2020, 10(10), 1160; https://0-doi-org.brum.beds.ac.uk/10.3390/catal10101160
Submission received: 21 September 2020
/
Revised: 29 September 2020
/
Accepted: 3 October 2020
/
Published: 9 October 2020
(This article belongs to the Special Issue Catalytic Fast Pyrolysis II)
Abstract
:A new recyclable catalyst for pyrolysis has been developed by combining calculations and experimental methods. In order to understand the properties of the new cluster designed catalysts, cellulose (a major component of plants) as a biomass model compound was pyrolyzed and catalyzed with different cluster designed catalysts. The NiaFeb (2 ≤ a + b ≤ 6) catalyst clusters structures were calculated by using Gaussian and Materials Studio software to determine the relationships between catalyst structure and bio-oil components, which is essential to design cluster designed catalysts that can improve bio-oil quality. GC-MS analysis of the bio-oil was used to measure the effects on the different catalyst interactions with cellulose. It was found that the NiFe cluster designed catalysts can increase the yield of bio-oil from 35.8% ± 0.9% to 41.1% ± 0.6% and change the bio-oil composition without substantially increasing the water content, while substantially decreasing the sugar concentration from 40.1% ± 1.3% to 27.5% ± 0.9% and also producing a small amount of hydrocarbon compounds. The catalyst with a high Ni ratio also had high Gibbs free energy, ΔG, likely also influencing the decrease of sugar and acid while increasing the ketone concentrations. These results indicate the theoretical calculations can enhance the design next-generation cluster designed catalysts to improve bio-oil composition based upon experiments.

1. Introduction
The demand for energy—particularly liquid fuels—is increasing sharply due to the worldwide population growth and the development of society. Moreover, 85% of energy production is mainly from fossil fuels today, resulting in net emissions of CO2, a gas related to global warming [1,2,3,4]. Meanwhile, the global biofuels market was valued at USD 168.18 billion (EURO 149.05 billion) in 2016 and is projected to reach USD 246.52 billion by 2024 [5]. Using biofuel has several advantages: it is a renewable energy and is produced overall from a carbon neutral process, as the biomass feedstock is produced by photosynthesis. The International Energy Agency (IEA) has set a goal for biofuels production to meet more than a quarter of world demand for transportation fuels by 2050 to reduce greenhouse gases produced by the burning of fossil fuels. In the future, bio-fuels will gradually become an important energy source.
Biofuels, similar to fossil fuels, exist in several forms like biodiesel, biogas, solid biofuels or bio-oil, and meet different energy needs. Bio-oil has attracted more attention recently because of its many advantages: it is considered a “greener” feedstock which is unrelated to food crop production since it is a 3rd generation derived biofuel, it is easy to transport and has high energy density. However, bio-oil is a complex mixture of oxygenated compounds, which decreases the energy density and quality [6]. Therefore, scientists are trying various methods to upgrade bio-oil using thermochemical processes such as hydrodeoxygenation (HDO) [7], which is a catalytic upgrading process that is undertaken in a wide range of pressures (2–30 MPa) and temperatures (423–723 K), where hydrogen is used to exclude excess oxygen from biomass, with the purpose of getting a high quality bio-oil. Steam reforming [8] is a process that can convert biomass to permanent gases, with high energy recovery and minimal environmental pollution. Pyrolysis is a thermochemical process that decomposes organic matter upon heating at elevated temperatures under anoxic conditions. It could be used at atmospheric pressure and does not require the addition of hydrogen source, which means it is good for industrial use, although the producing efficiency is low. Many scientific reports have shown that the pyrolysis method is reliable to produce bio-oil or gas [9,10,11,12]. Compared to other thermochemical processing techniques, biomass pyrolysis is a well-established process that is favorable to energy recovery, resource recovery, and contaminant removal.
Catalysts are always used for biomass pyrolysis in order to improve the efficiency of the process. For this reason, scientists have extensively studied many different types of catalysts for upgrading bio-oil. For example, Zhou’s group investigated the effects of ZSM-5 impregnation with boron on its catalytic properties in fast catalytic pyrolysis (CFP) of cellulose. The result is that the ZSM-5 catalyst can help increase the reaction speed and facilitate producing more useful products [13]. For example, Custis’s group developed a model compound to understand reaction pathways and how primary intermediates lead to the observed product selectivity during the pyrolysis experiment [14].
Considering potential large-scale applications, instead of using rare earth based materials or expensive metals, catalysts made of cheap and earth-abundant elements such as Ni and Iron are crucial to achieving economically viable energy conversion processes. Many kinds of Nickel-based catalysts have been extensively employed in the industrial process of steam reforming because of their high activity and low cost. Most of the metal-supported catalysts are made by the wet impregnation method. For example, Muthukumarappan’s group used Fe-Ni/HZSM-5 catalysts at temperatures of 300 and 500 °C. Fe-Ni/HZSM-5 catalysts improved the bio-oil yield to 28.7 wt % and its quality [15]. Ji’s group used the Ni-Mg/ZSM-5 catalyst for catalytic pyrolysis, the bio-oil product contained hydrocarbon compounds with a high yield of 35.5% [16]. Mutz’s work [17] found that NiFe alloy could help improve the catalytic property of γ-Al2O3 because of the Fe dopants in Ni cluster and the possible changes in the electronic structure of NiFe alloy. It is clear that adding Ni, Fe can increase the bio-oil yield. However, this type of catalyst can not be recycled and leads to environmental pollution since it needs to be deposed or regenerated. In order to solve the single use catalyst or fouling problem, a new recycle NiFe catalysts have been designed.
A cluster is an aggregate composed of a few to several million identical or different structural units like atoms and molecules. The metal cluster can be composed of single or multiple elements. They sometimes also bound to some other metal atoms or clusters [18]. They can be used in many different fields, such as a high molecular materials and for medical applications. It has also been used as a catalyst (such as Fe3 [19], Ni@Ni11Fe [18], etc).
The ideal cluster catalyst also has an extraordinary property, the absence of large bulk phases leads to a high surface-to-volume ratio. In addition, the metal cluster catalyst has better physical properties, like large specific heat capacity and heat conductivity coefficient.
At the same time, calculations have been used as a method to connect theoretical chemistry design and experimental results in order to optimize the bio-oil experimental results. From these relationships, it is expected that they will help find the new catalysts. Other published works note that it is useful to use calculation methods to predict experimental results [20]. Furthermore, it can help save money, reduce workload, and improve efficiency. The same method was employed in a previous study [21] where the calculated results agreed well with experimental results.
The current study, cellulose was chosen as the reactant for pyrolysis, because it is the major component of biomass (50%–90%) and often used as a model compound to investigate the mechanisms. Other biomass, like straws is of interest, and is biomass to be considered in the future for practical use. It is noteworthy that this research only uses cellulose as the reactant. The results may different or changing when using other biomass. The aims of this research are: (1) to clarify the relationship between calculation results and experimentally prepared catalysts, (2) to understand the relationship between catalysts and bio-oil yield and composition, (3) to investigate the potential for using theoretically derived calculated results to predict experimental results, i.e., bio-oil composition, and (4) to find a new recycle catalyst for in-situ pyrolysis.
2. Results and Discussion
2.1. Catalyst Characteristics
2.1.1. Structural Characteristics
The optimized geometries of the NiaFeb (2 ≤ a + b ≤ 6) clusters with all real frequencies have been obtained at the B3LYP/LANL2DZ level, which is presented in Figure 1 (details of cluster structure have been shown in Tables S1 and S2). The symmetries, the ΔG, the binding energy, and the two order stabilization energy of the most stable NiaFeb (2 ≤ a + b ≤ 6) clusters are summarized in Table 1. In order to determine which materials to develop, the calculations were on the singlet ground states. To compare how Ni and Fe elements influence the cluster property, the Nin and Fen (1 < n < 6) clusters are also calculated (Figure S1, Table S3–S6). Similar results have been found and are in agreement with other groups [22,23,24,25,26].
The ground-state geometry of Ni2Fe or NiFe2 is an isosceles triangle with C2v symmetry, which can be obtained by doping Ni2 (Fe2) or by substituting a Fe (Ni) atom of Ni3 (Fe3) with a Fe (Ni) atom. Notably, other groups have calculated the structures and reported similar results [27,28]. Similar to the most stable structures of Ni4 (Fe4), the lowest-lying structure of NiaFeb (a + b = 4) is a pyramid, which is the first three-dimensional (3D) structure in the NiaFeb (2 ≤ a + b ≤ 6) series. When the number of metal atoms is 5, the structures can be regarded as adding a new atom to the above structure. For example, as shown in Figure 1, adding an additional Ni atom to the tetragonal Ni3Fe, the Ni4Fe structure is obtained, adding another Ni atom to the bottom of Ni4Fe, the Ni5Fe structure was obtained.
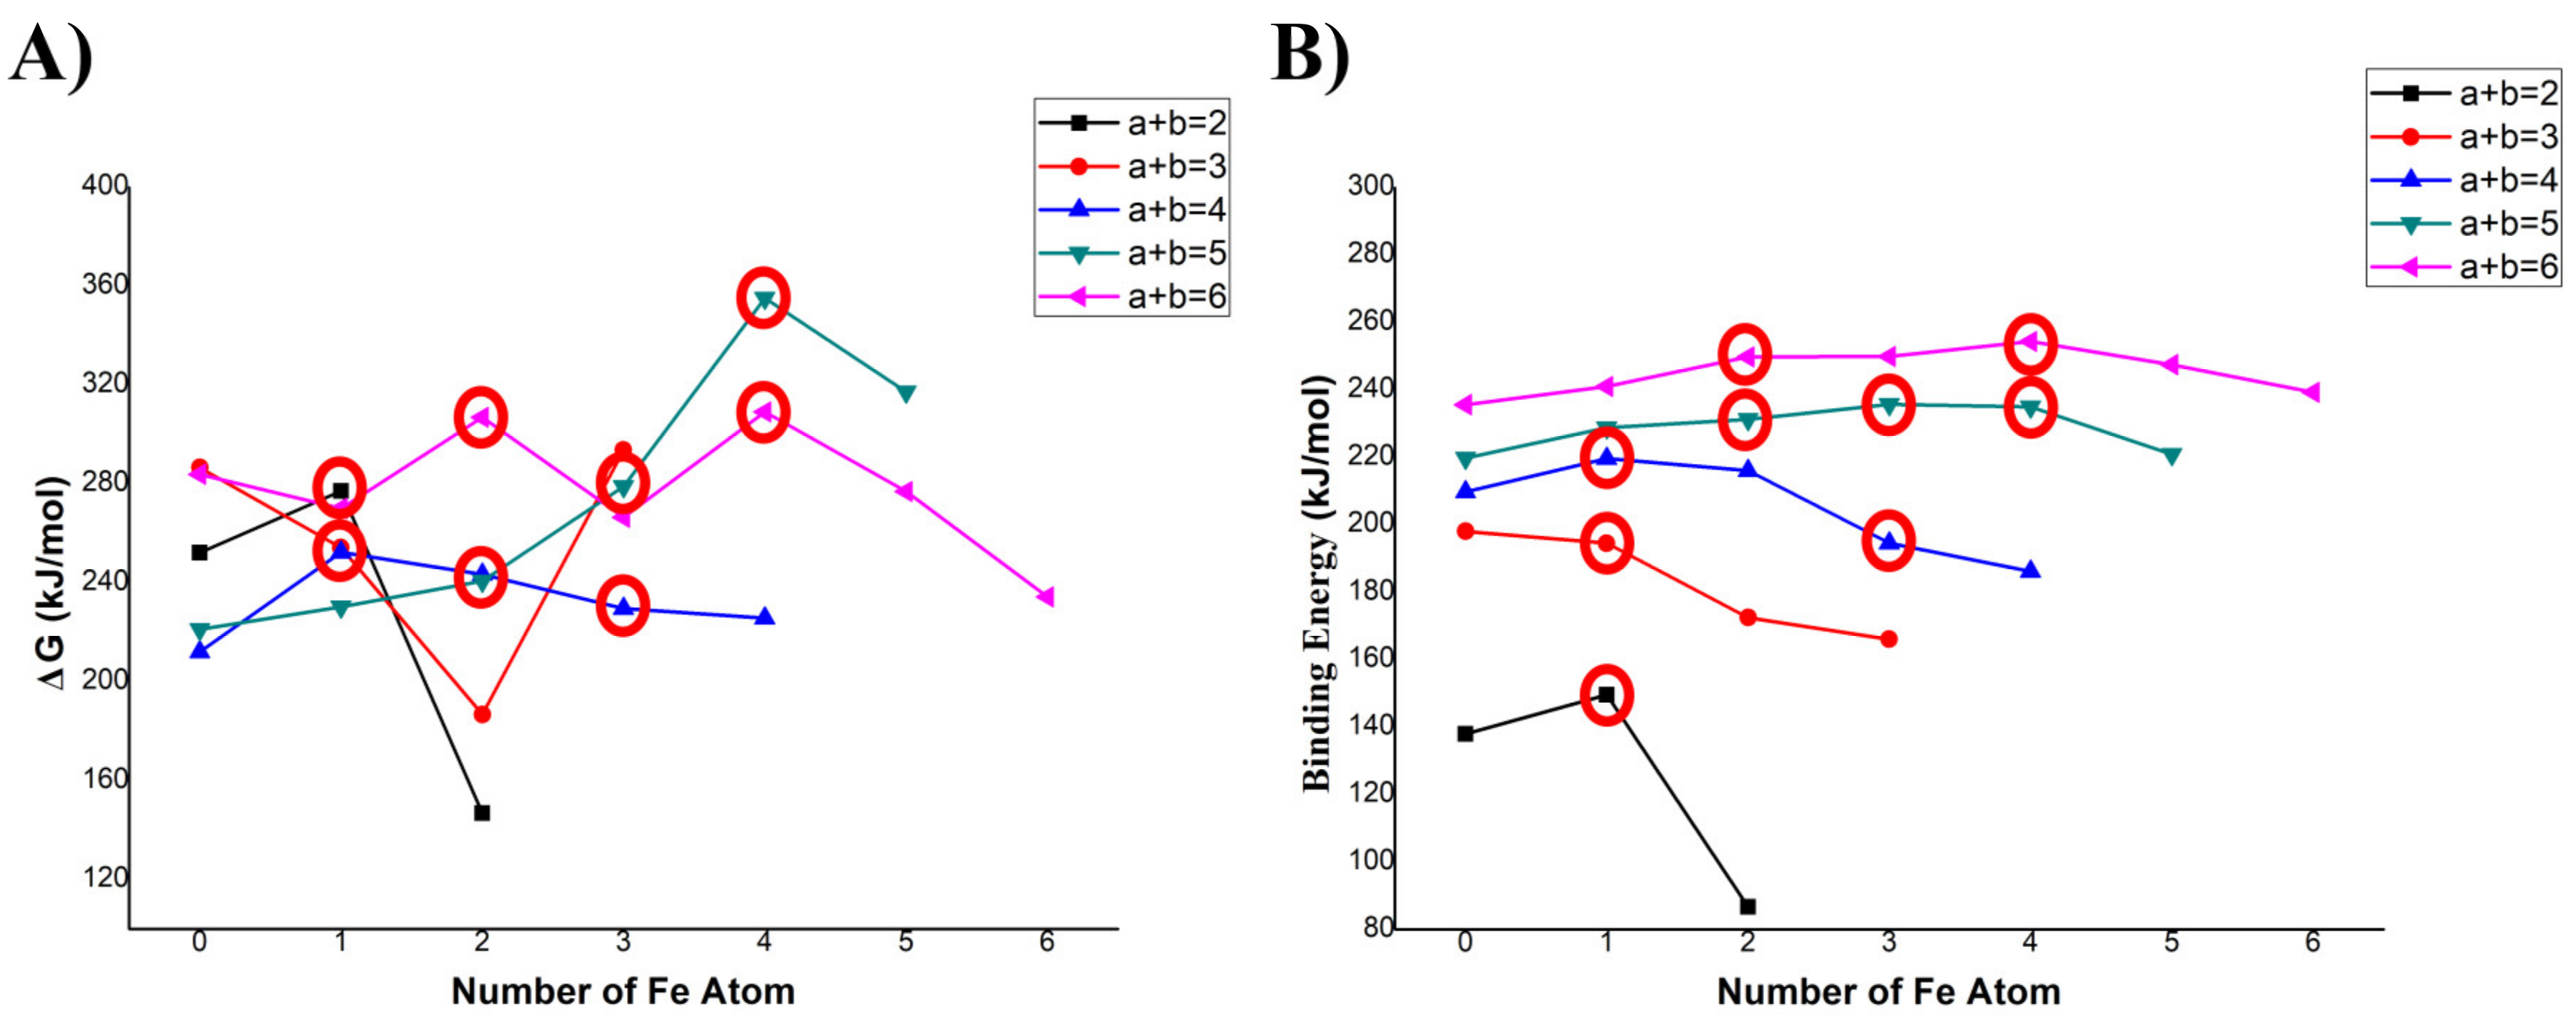
Firstly, Gibbs free energy ΔG values are determined. They are well known for measuring the thermodynamic stability of the clusters. From Figure 2A, the ΔG value of the NiaFeb (2 ≤ a + b ≤ 6) usually increases first and then decreases with as the number of Fe atoms increases, indicating that doping a Fe atom into a Ni cluster can improve the thermodynamic stability. Another fact is that the ΔG of a NiaFeb (2 ≤ a + b ≤ 6) cluster is larger than that of either the Nia+b or the Fea+b cluster with a+b fixed. The high energy value implies that mixed metal clusters are more thermodynamic stability than the pure metal clusters. The red circles are shown in Figure 2A shows the stable cluster structures, the ratio between Ni and Fe is 1:1, 2:1, 3:1, 1:2, 1:3, 1:4, 2:3, and 3:2, for example, 1:4 ratio structure has the largest ΔG among other structures, which means it could maintain its activity at high temperature. This is an important result for pyrolysis experiments.
Secondly, the Eb values are also considered since they provide information about the strengths of bonds within clusters (the minimum energy required to disassemble a system of particles into separate parts) and also increase first and then decrease with the number of Fe atoms added. As shown in Figure 2B, the Eb value of NiaFeb (2≤ a + b ≤ 6) generally increased with cluster size. Another fact is that the binding energy of a NiaFeb (2 ≤ a + b ≤ 6) cluster also has a larger value than pure metal clusters, indicating that mixed metal (alloy) clusters have higher stability. The red circles are shown in Figure 2B shows the stable cluster structures.
Finally, on the one hand, the results show that it is better to make the NiFe metal cluster than single element clusters (Ni/Fe). On the other hand, the results of ΔG, binding energy, and two order stabilization energy was used to select stable cluster structures. The ratio 1:1, 2:1, 3:1, 1:2, 1:3, 1:4, 2:3, and 3:2 are selected to design an experimental plan to make catalysts by sol-gel method.
2.1.2. XRD, SEM-EDS and AES Analysis
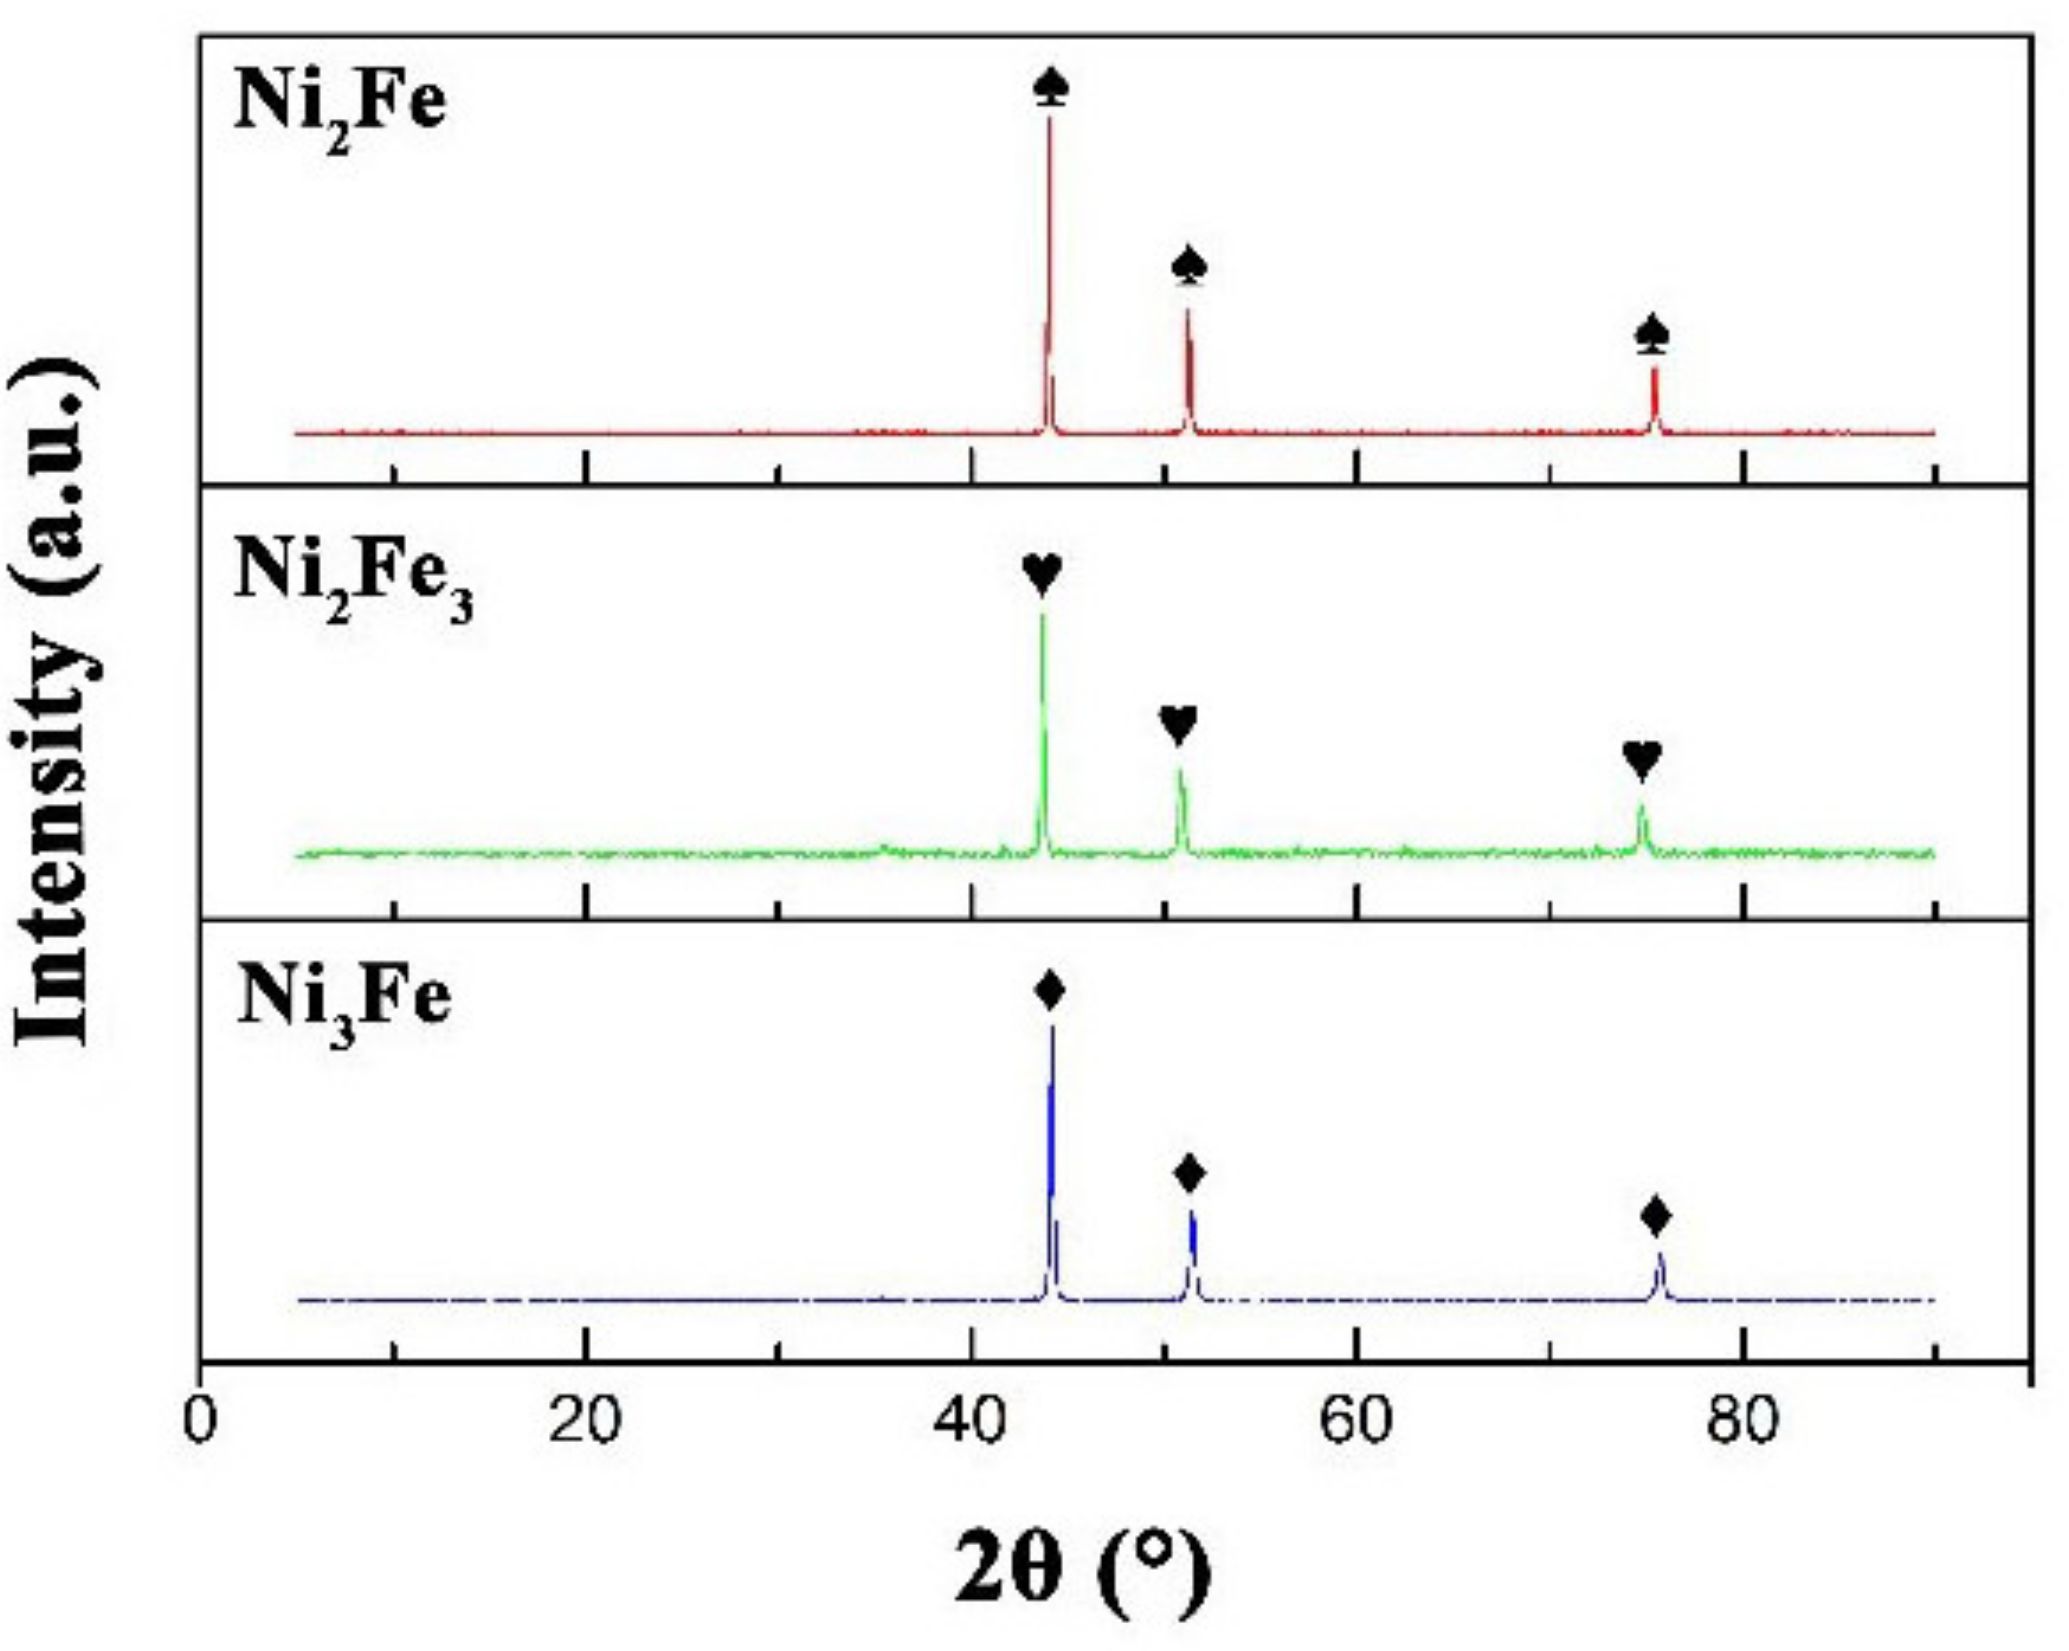
X-ray diffraction patterns of selected prepared catalysts powder samples are shown in Figure 3. Additional results and standard patterns are given in Figure S2. Figure 3 indicates that the experimentally prepared samples XRD pattern agrees well with the standard cards (the marked symbols correspond well one by one). In addition, only NiFe peaks are observed in the samples, indicating no other impurities are in the catalysts and the sol-gel method is reliable for producing cluster structures. Based upon the XRD results, which clearly shows several peaks, it indicates a cluster structure was obtained that matches bulk XRD pattern. This XRD pattern here is different than that previously reported for bimetallic catalysts (Ni, Fe) [29]. The possible reason why NiFe3, NiFe4 (Figure S3) showed different XRD patterns is that the particles may contain two different compositions of clustered materials, e.g., Fe and NiFe, or potentially other phases of NiFe clusters. The XRD results comparing the used catalyst in the experiment and unused catalyst showed the catalyst XRD pattern was unchanged by the pyrolysis experiments (Figure S3) and the catalyst can be recycled based on our previous work [30]. The NiFe catalyst was recycled five times; compared to the first run, the properties of the increasing bio-oil yield and reducing sugar content were unchanged.
Based on the XRD results, using the crystal data and Materials Studio software, the structure of each catalytic sample was calculated in Figure 4(a1,2). The outermost layer is catalytically active and where the chemical reactions take place. The (100) surface (shown in Figure 4(b1,2)) illustrates the outermost layer. This outer layer was simplified into a single cluster structure (Figure 4(c1,2)). Although the clusters will aggregate into larger particles experimentally, this simple cluster structure is still useful to calculate related properties and predict the property of bulk catalysts. The XRD results indicate it is the particle catalysts, but cluster results can be used to predict its property, so cluster catalyst has been used to represent this catalyst. In brief, the theoretical considerations are made for the small clusters, simulating the top layers of particles from the experiment. Here, NiFe (above) and Ni3Fe (below) are taken as examples and shown for comparison. That is a possible reason why the XRD spectrum did not show the obvious difference; the reaction only happened on the surface and would not change the crystal structure.
The SEM images are shown in Figure 5 (NiFe catalyst) of a typical particle and uneven surface. The published literature [31] indicate the porous powdered structure can exhibit better catalytic properties. Although the cluster forms an aggregated structure, the aggregation does not influence the property of catalysts because the outermost layer has the simulated cluster structure based on the above results. The aggregation leads to particle formation and as a result, the calculated simple crystalline structures cannot be observed. From the SEM photographs, all catalysts show cauliflower-like topography with similar particle sizes and several microns size particles.
In order to know the elemental composition on the NiFe catalyst surface, Ni2Fe3 has been taken as an example for SEM-EDS and AES analysis. The AES results have been obtained by analysis of five different locations, and the results indicated that 90% carbon covered the surface of the catalyst (Figure S4). The EDS analysis was also performed in five different locations, indicating that the carbon content was approximately 10% (Figure S5). These results indicated that the carbon covered the surface of the catalysts at the end of the experiment. However, it still showed good catalytic activity, even with carbon coverage. The possible reason for catalytic activity was that the physical separation method and fixed bed provide a favorable environment to let the catalyst and biochar combine, then the metal-biochar catalyst has been obtained. Similar to other research, in a separate study ZnCl2 was mixed with biochar for waste plastic pyrolysis [32] and mixed metal biochar catalyst for lignin and mud pyrolysis [33]. These biochar-mixed catalysts show good catalytic activity due to electrostatic interaction, and other mechanisms driven by biochar such as pore filling, hydrogen bonding, and hydrophobic interactions are possible.
2.2. Pyrolysis Results
2.2.1. Pyrolysis Yields
Figure 6 shows the yield of bio-oil, gas, and coke without and with different catalysts. The bio-oil yield of un-catalyzed cellulose pyrolysis experiment was 35.7% + 1.0% (all experimental data is shown in Table S7). The yield results are lower than other researches about cellulose pyrolysis, the major reason is that the less cellulose (6 g) has been used for the experiment and the pyrolysis equipment design, other researches used 12 g [34] (bio-oil yield: 40.8%). In order to make the results reliable, all catalysts have been tested three times and the standard deviation is shown in Figure 6. The yield increased slightly with all catalysts in the following order 37.2% ± 1.2% NiFe4 < 38.1% ± 0.4% Ni3Fe2 < 38.9% ± 0.2% NiFe < 39.1% ± 0.7% NiFe2 < 39.3% ± 1.0% NiFe3 < 39.3% ± 0.6% Ni2Fe3 < 40.1% ± 0.7% Ni2Fe < 41.1% ± 0.6% Ni3Fe. The water content for bio-oil produced from cellulose without catalyst was 30.8% and increased slightly within a range from 31.5% to 33.1% for NiFe catalyzed bio-oils. All catalysts used here improved the yield of bio-oil, which is an important property, because other catalysts typically decrease the bio-oil yield, like ZSM-5, ZrO2 and TiO2, and Silica [34,35,36]. The cellulose directly mixed with ZSM-5 catalyst showed the yield decreased from 39.2% to 31.2% [37], and the Ce-Al-MCM-41 catalyst [38] decreased the bio-oil yield from 58.6% to 40.8% for in-situ pyrolysis experiment. The reason for the bio-oil yield increase is attributed to differences in specific heat capacity and heat conductivity coefficient. The specific heat capacity is 1.59 kJ/kg.K for cellulose, 0.46 kJ/kg·K for Ni, and 0.46 kJ/kg·K for Fe [39], respectively. The heat conductivity coefficient is 0.23 W/m·K for cellulose, 61.6 W/m·K for Fe and 73.3 W/m·K for Ni, respectively [40] (see Table S8), which means nickel and iron both can transfer heat quickly increasing the cellulose temperature, the heated metal particles can help transfer heat uniformly to the cellulose powder. The Ni3Fe has the largest Ni ratio when compared to other ratios, which means the heat conductivity coefficient is higher than other catalysts (see Table S9). That is why it showed the best property for increasing bio-oil yield. The detailed explanation has been reported in the study of homogeneous and heterogeneous catalysis for cellulose [37]; the Ni2Fe3 catalyst catalyzes the cellulose conversion to bio-oil.
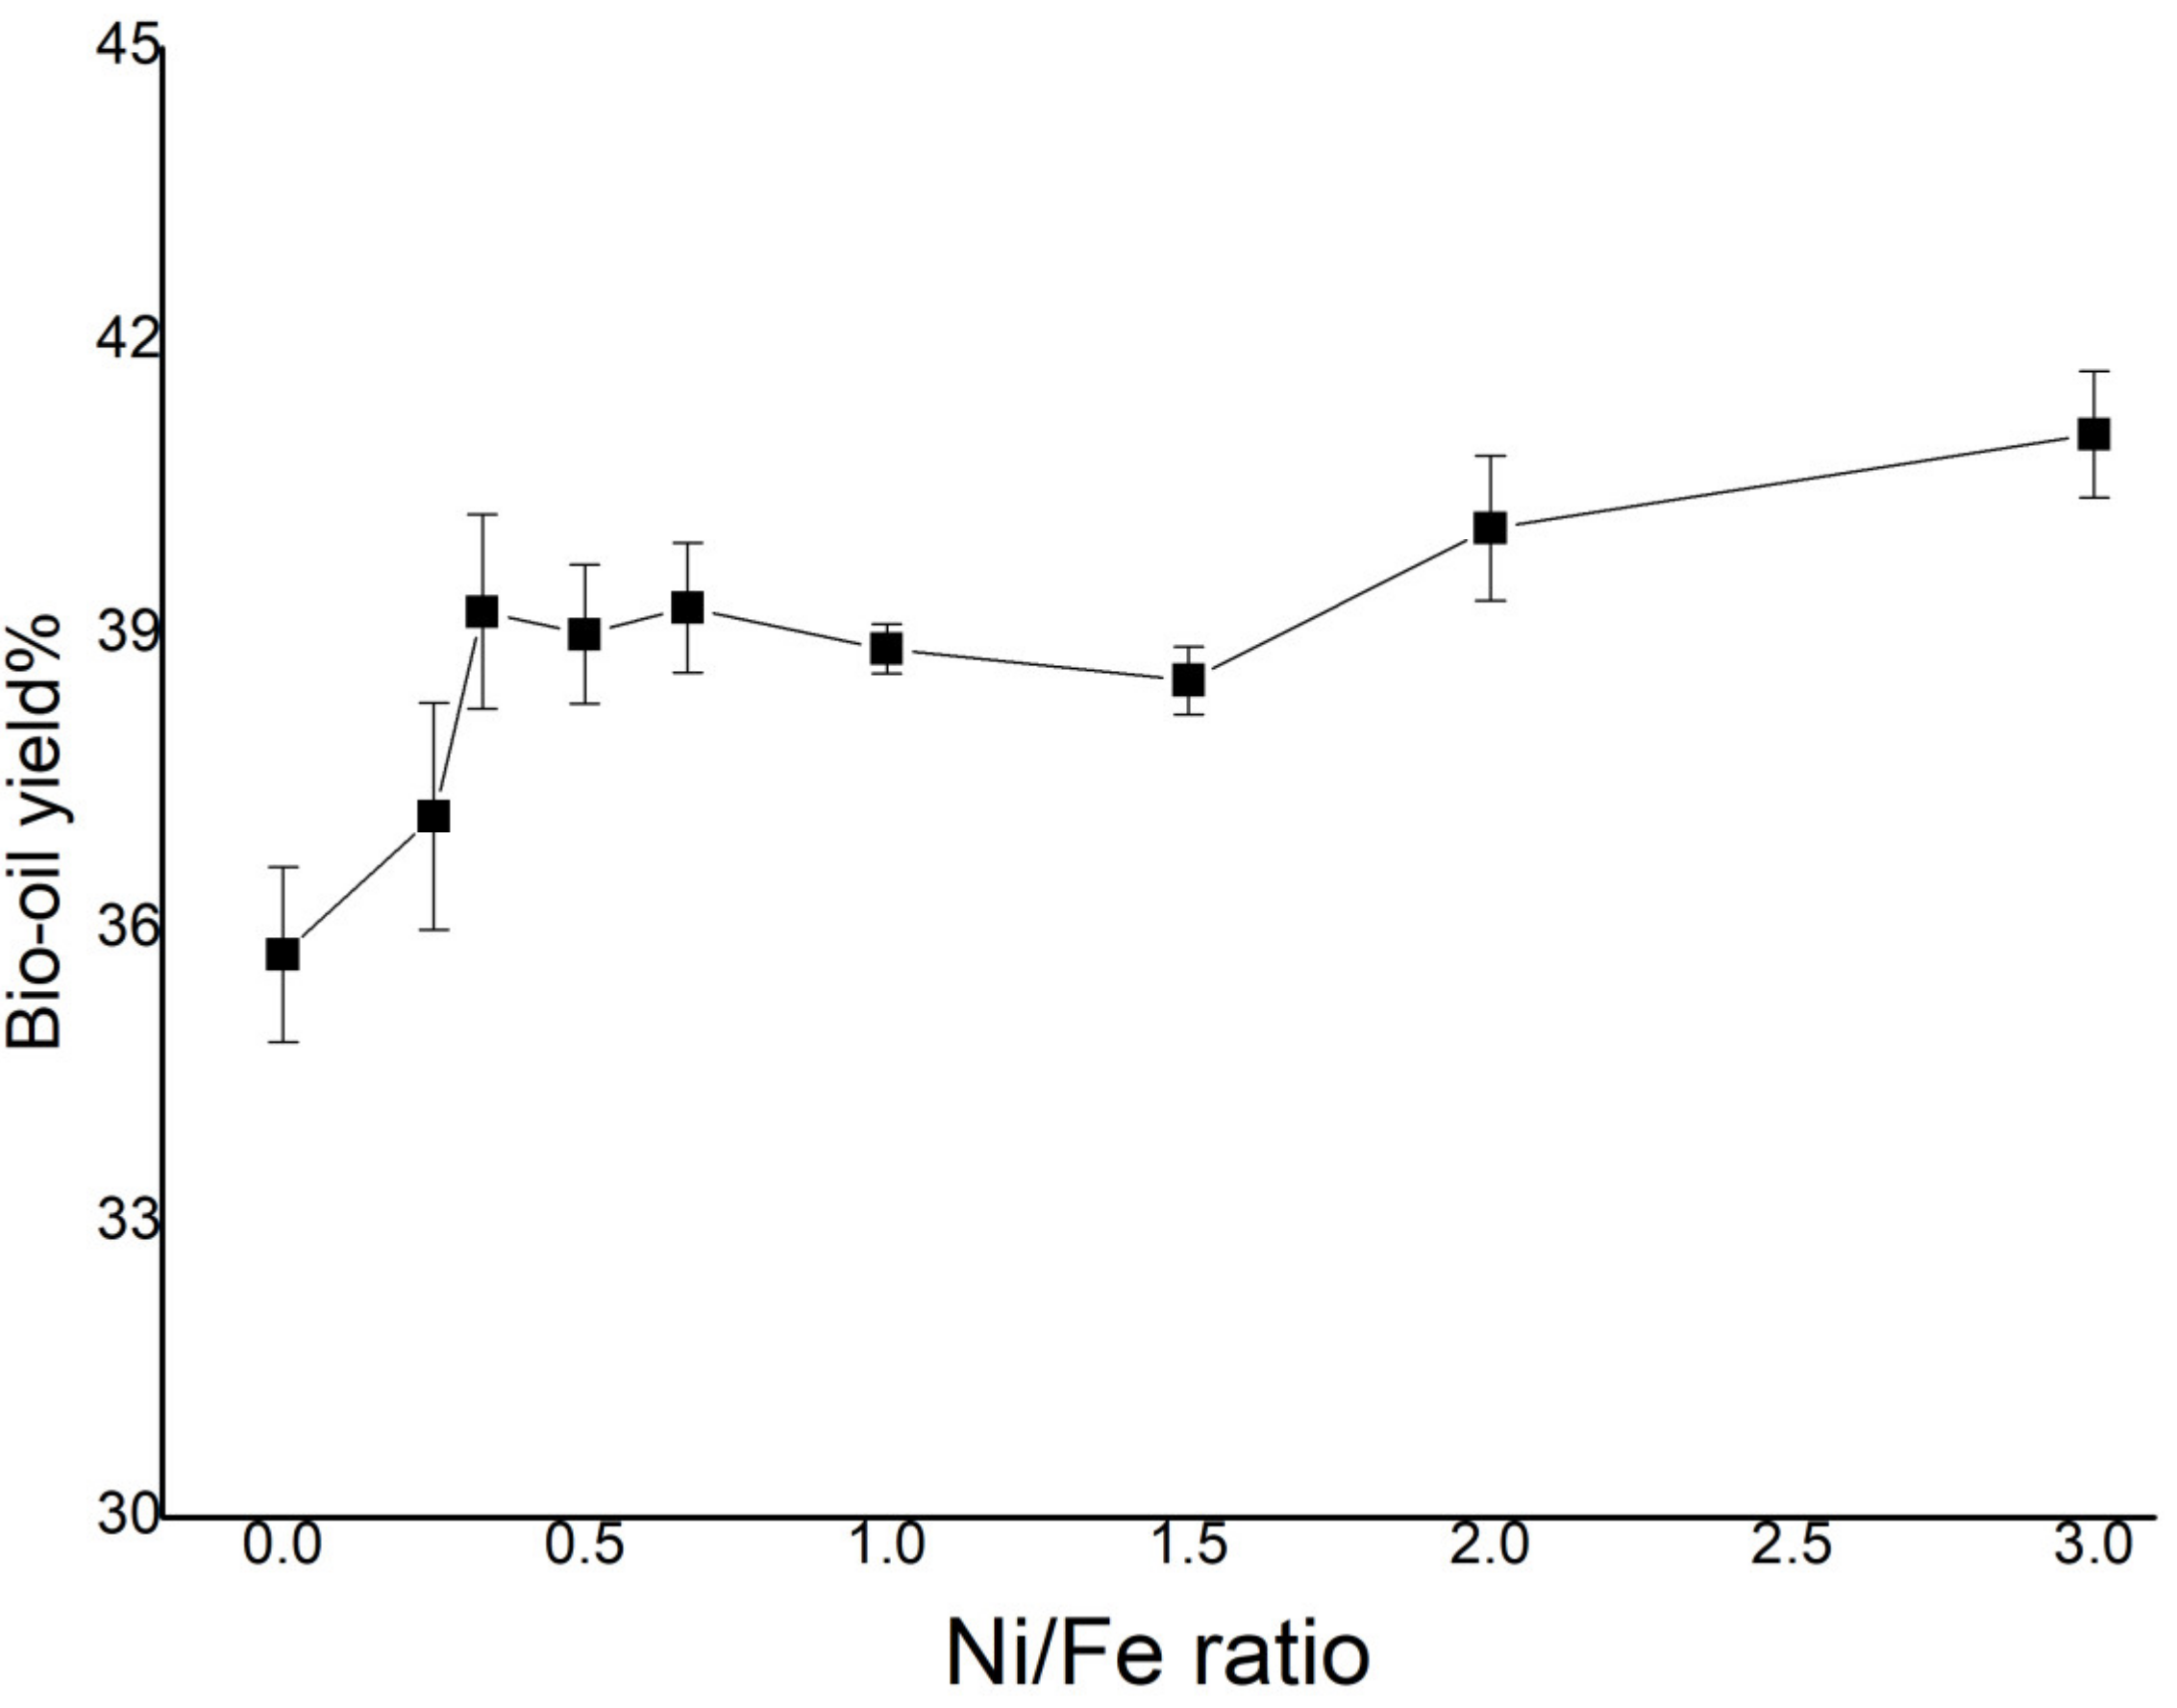
After comparing the property of NiFe, Ni2Fe, and NiFe2 catalysts, the data shows that regardless of Ni or Fe atomic ration, i.e., the yield increases for both, and the Ni containing clusters has a higher yield than the Fe compounds. Ni shows better catalytic activity than Fe, which has also been reported in the literature. Also, the data suggest that Ni3Fe is the best catalyst for increasing the yield of bio-oil, reflecting the high Ni ratio can help increase yield. On the other hand, Figure 7 shows the bio-oil yields are plotted versus Ni/Fe ratio changing, which indicates that the bio-oil yield will increase when the Ni/Fe ratio increases. Figure 7 also indicates that the ratio between 0.67 and 1.00 shows a similar yield. For the Ni3Fe2 (ratio = 1.5), the situation is a little different, it has a high Ni ratio but lower yield, the reason is that although the Ni3Fe2 has large ratio, the ΔG is smaller than other structures, the catalysts will deform easier in order to decreases the catalytic property. The calculation results can help find good catalyst for experiments.
It appears that the Ni ratio and structure volume is fundamental when designing a catalyst and impacts the products. The amount of char and coke of pyrolysis experiments did not change much for all catalysts.
2.2.2. GC-MS Analysis
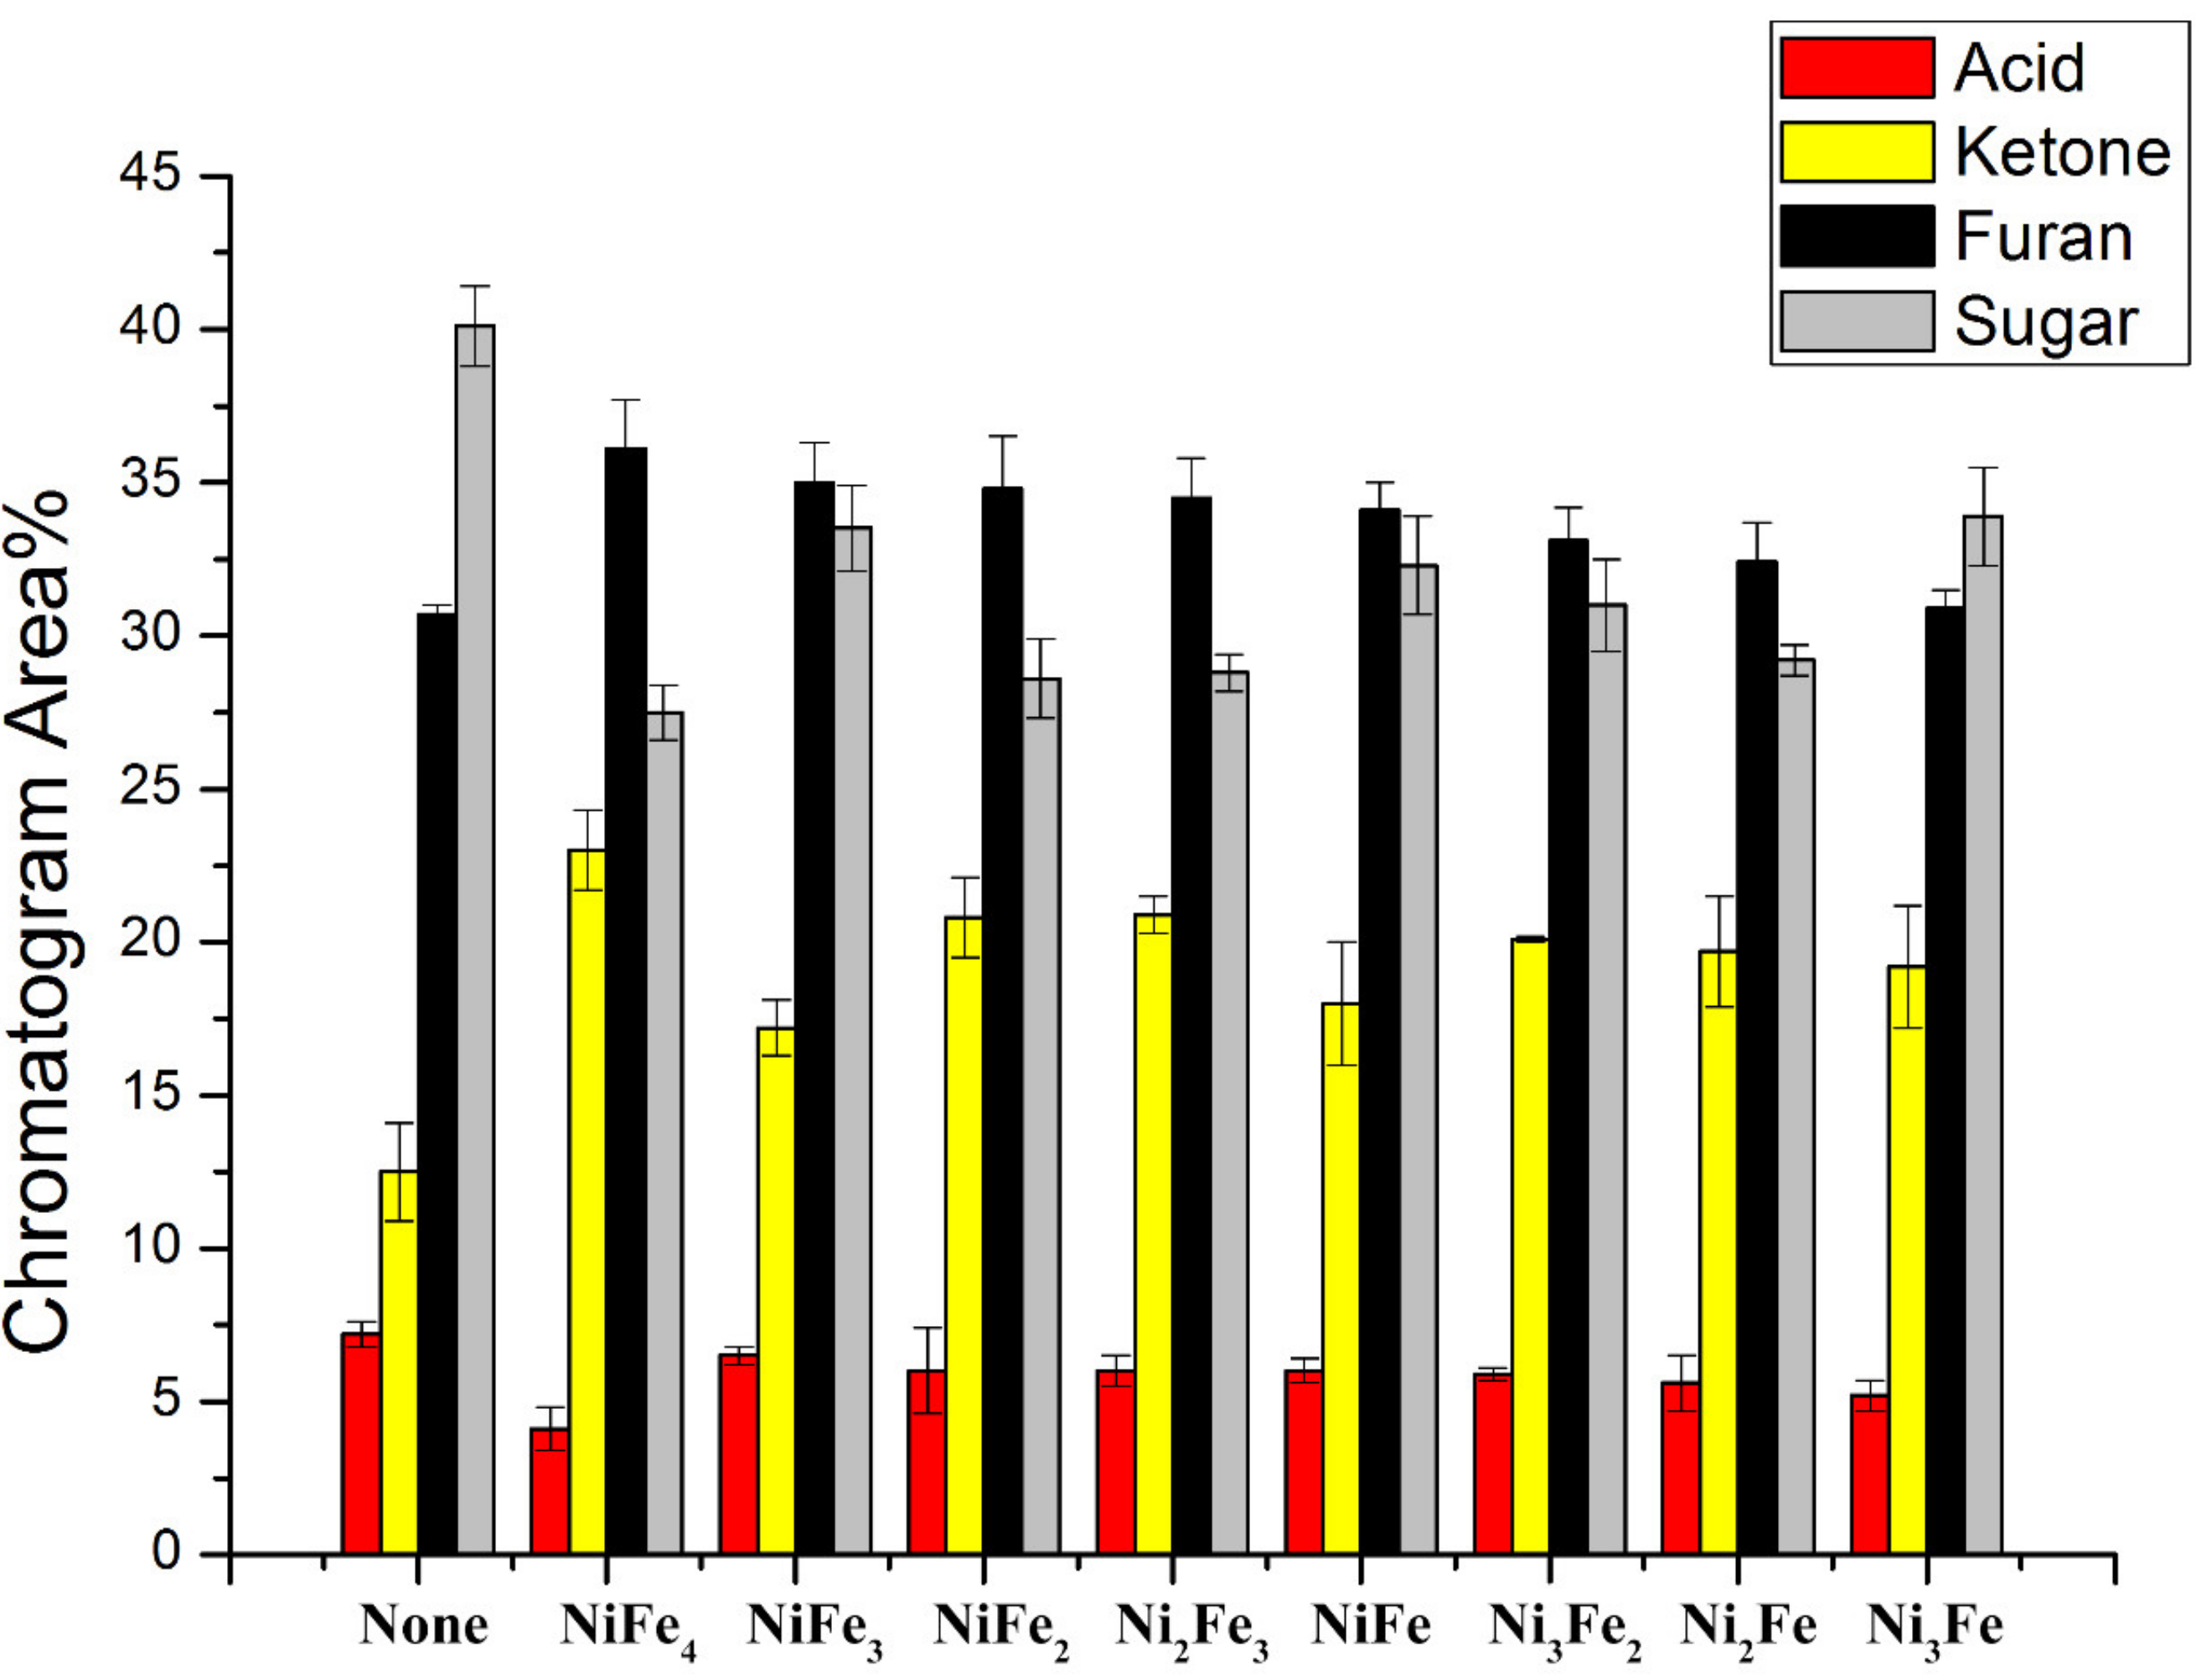
All the bio-oil compounds obtained using different catalysts and without catalysts were identified by GC-MS are represented in Table 2. The specific GC and MS spectrum of major compounds has been shown in Figures S6–S11, Tables S10–S12. In order to make the comparison easier among different catalysts, all organic compounds were classified into different groups, as shown in Figure 8. The major products of upgraded bio-oil without catalyst consisted of acid (7.2% ± 0.4%), furan (30.7% ± 0.3%), ketone (12.5% ± 1.6%) and sugar (40.1% ± 1.3%).
In this study, phenolic compounds were also found in uncatalyzed cellulose pyrolysis products, the same results that other researchers have reported [34]; Other main components of the bio-oils derived from non-catalytic and catalytic pyrolysis of cellulose are in good agreement with the literature results [34,41,42].
In order to investigate how the chemical distribution changed in the final product by different catalysts, each chemical group will be discussed in detail below and covering the top 30 compounds. The data shows the relationship between Ni/Fe ratio and the increasing/decreasing ratio in Figure 8 (based on averaged data). Firstly, the data indicated hydrocarbon compounds (HC) was formed in Table 2, which is an excellent component to improve the quality of bio-oil although the ratio is only near 1%. No other published literature has reported producing HC from cellulose reactants under a nitrogen ambient environment from NiFe catalysts to our knowledge.
Secondly, all the catalysts reduced sugars, acids, and aldehydes, which is a favorable trend. NiFe4 decreased sugar composition from 40.1% ± 1.0% to 27.5% ± 0.9% with furan and ketone concentrations increasing. Furthermore, acids decreased at the same time. Reducing sugar concentration can improve the quality of bio-oil because they contain a large amount of oxygen. The results here agree well with other studies that sugar composition can be converted by catalysts [35,43]. For example, the ZrO2-TiO2 catalyst decreased the sugar percentage to 27%, while the 1500 ZSM-5 catalyst only removed 2% sugar. When compared to these catalysts in the literature, the NiFe catalyst showed better activity to reduce sugar composition. The reason why sugar decreased is that it decomposed into furan and ketone by catalysis pyrolysis, especially for 5-hydroxymethylfurfural, furfural, 5-methyl-, 1,2-cyclopentanedione, 3-methyl- and l-2- cyclopenten-1-one, 3-methyl-, etc. The presence of acids brings adverse effects to the properties of bio-oils. They make bio-oils corrosive to common metals such as aluminum, mild steel, brass, and so on. Figure 8 shows how the different Ni/Fe ratio catalysts influence reducing acid composition. Typically, when the Ni/Fe ratio increased, more acid can be removed, but when the Fe has a high ratio, it also shows an excellent activity to remove the acid. The reason is that the NiFe4 cluster has the largest ΔG (355.1 kJ/mol) among all cluster designed catalysts, the cluster can maintain its activity well under high temperature and facilitate chemical reactions involving acids to produce other compounds, and if the ΔG is similar, high Ni/Fe ratio can help remove more acid. So, for reducing acid, the ΔG and Ni/Fe will influence the results at the same time, but the Ni/Fe ratio will occupy a larger role. Similar to reducing acid, Figure 8 also indicates that when the Fe ratio is high, it can also remove sugar composition, the Ni/Fe ratio = 1/3 and 3/1 shows the least activity to remove sugar, represent NiFe3 and Ni3Fe, respectively. This phenomenon is also related to ΔG. Compared to NiFe4 cluster ΔG (355.1 kJ/mol), the NiFe3 (229.6 kJ/mol), Ni3Fe (252.3 kJ/mol) and NiFe (277.1 kJ/mol) catalysts all have lower ΔG. The sugar concentration was reduced proportionally to ΔG, which means the larger ΔG catalysts can help reduce the sugar content, which means that ΔG can be used to find better catalysts for pyrolysis experiments. However, Ni/Fe influences it at the same time. The relationship between sugar reduction and ΔG has been shown in Figure S12. The reason why aldehydes disappear from the table is it is percentage became lower than the other top 30 compounds.
Thirdly, all catalysts lead to an increase in furan and ketone concentration, as shown in Figure 8 because of the decomposition of sugar. NiFe4 (Ni/Fe = 0.25) shows the best property for increasing furan and ketone compounds due to it can reduce more sugar. Figure 8 indicates an increasing furan concentration is plotted versus Ni/Fe ratio changing, which indicates that the lower Ni/Fe ratio enhances increasing furan composition. The ketone concentration increased directly in proportional to ΔG, which means the larger ΔG can help increase ketones, although Ni/Fe influence it at the same time. The reason why we focus on ketone content is that many methods can change the ketone to hydrocarbon by the chemical reaction advance [44,45,46]. So it is a benefit for the bio-oil composition to increase ketone composition in order to get more HC compounds during the next step. When compared to other published work, catalysts reported here favor ketone formation. Other catalysts will not influence the percentage of ketone in catalyzed bio-oil, like silica, ZSM-5, etc. However, the NiFe catalyst can increase ketones up to 50%.
Finally, all catalysts do not affect the phenol, alcohol, and ester concentrations. The phenol compounds are usually formed from the secondary reaction of the cellulose vapors [36,43], which is why it does not change much in this study. Based on the above analysis, the proposed possible reaction pathways are shown below based on the experimental results in Figure 9. With the cluster catalyst, three different reaction pathways have been proposed. First, we propose that levoglucosan is decomposed into many different compounds, like two types of sugar, 5-hydroxymethylfurfural, furfural, 2-furancarboxaldehyde, 5-methyl-, 1,2-cyclopentanedione, 3-methyl-and l-2-cyclopenten-1-one, 3-methyl-, just like other research [47,48,49,50,51]. Then, 5-hydroxymethylfurfural transfers to furfural and 2-furancarboxaldehyde, 5-methyl- at the same time. Finally, 1,2-cyclopentanedioneis probably are obtained from 1,2-cyclopentanedione, 3-methyl- reaction on the NiFe cluster catalyst.
The pyrolyzed gas composition obtained using different catalysts and without catalysts were identified by GC-MS analysis. The results indicated that the major pyrolyzed gas compounds were CO, CO2 and CH4. The CO content for pyrolyzed gas from cellulose without catalyst was 41% and within a range from 36% to 46% for NiFe catalyzed bio-oils. The CO2 content for pyrolyzed gas from cellulose without catalyst was 52% and within a range from 49% to 58% for NiFe catalyzed bio-oils. The CH4 content did not change it was approximately 6%. The results were the same as previously reported work [51], the major component and gas percentage are also CO, CO2, and CH4.
3. Materials and Methods
3.1. Computational Details
The initial geometrical structures of the NiaFeb (2 ≤ a + b ≤ 6) clusters were obtained by two approaches in order to find all potential minimum structures: (1) a great number of structures were initially constructed by substituting nickel atoms in the Nin+1 cluster with iron atoms, replace one, two; and (2) a stochastic search procedure. The artificial bee colony (ABC) algorithm was used, using the ABCluster 1.4 code [15] in order to select 30 isomers of NiaFeb ( 2 ≤ a + b ≤ 6 ) with the lowest energy. Then, 10 of the lowest energy clusters were selected for further structure optimization and analysis to confirm that they were the most stable structures (the process was shown as Figure 10). The structures obtained were checked by spin multiplicity states of one and were further optimized at the B3LYP/LANL2DZ level, which was a reliable method to calculate the most stable Ni or Fe compounds by the previous literature [52,53]. Vibrational frequency analysis was carried out in order to prove the structures were reliable and exhibited real minima. Relative energies of different isomers, ΔG, and binding energies were corrected by zero-point vibration energies (SPVE) obtained at the B3LYP/LANL2DZ level at 0K.
The optimized structures of pure Nin+1 and Fen+1 (n = 1–6) clusters were also obtained in two methods: (1) by re-optimizing the structures from previous studies at the B3LYP/LANL2DZ level, and (2) by using the abovementioned stochastic search procedure-ABCluster 1.4. The purpose of calculating the Ni/Fe cluster was to make a comparison to the NiFe cluster.
The stability of the NiaFeb (2 ≤ a + b ≤ 6) clusters was calculated using the B3LYP/LANL2DZ level’s binding energy per atom (Eb), the second difference in energy (Δ2E), and ΔG, which was defined as:
Unless otherwise specified, all the calculations were performed with the Gaussian 16 program package [54].
Materials Studio 6.0 software [55] was also used to model materials 3D crystal structures and analyze the outermost surface layer.
3.2. Experimental Details
3.2.1. Catalyst Preparation
The catalysts were prepared by the sol-gel method, which is one of the best methods to produce cluster designed catalysts [56,57], the previous literature has proved that this method can help obtain cluster structure when compared to other methods, like wet impregnation, homogeneous deposition−precipitation. The precursors were Ni(NO3)2·6H2O, Fe(NO3)3·9H2O, citric acid, and ethylene glycol, which were purchased from Wako Pure Chemical Industries (Chuo-Ku, Osaka, Japan). The specific process has been discussed in our group another work [37].
3.2.2. Pyrolysis Method
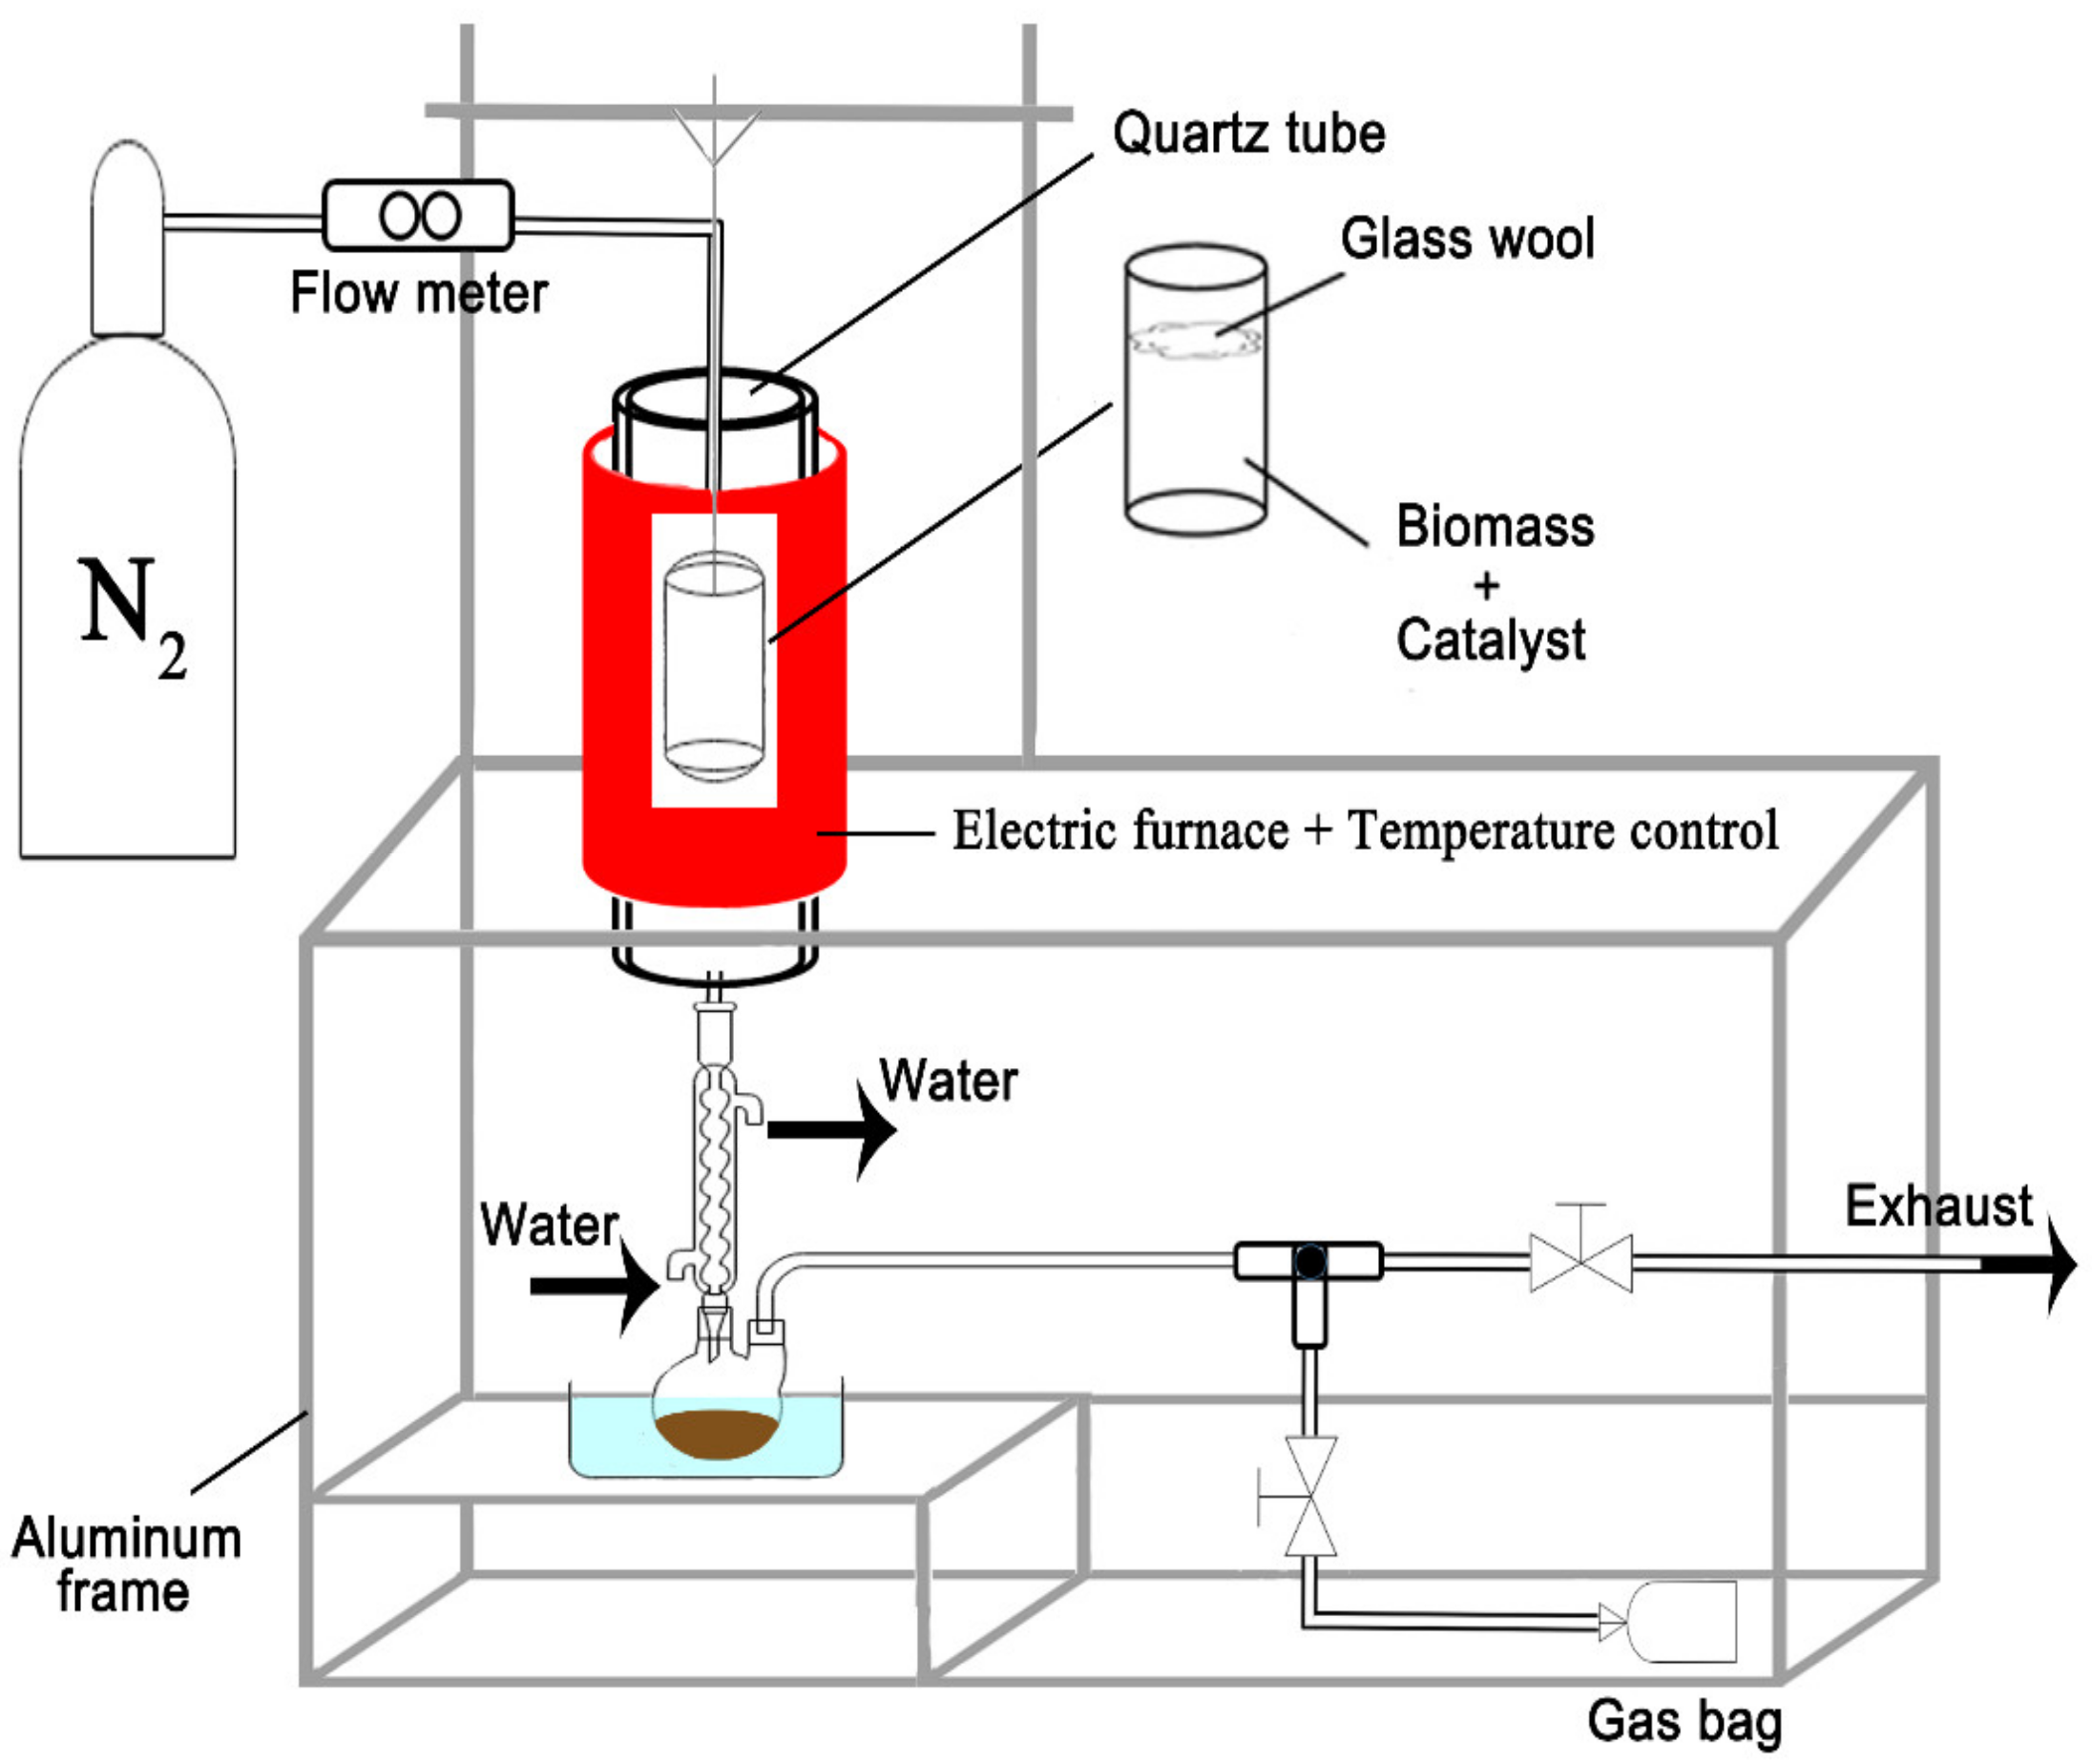
The 38 μm powdered cellulose pyrolysis feedstock was purchased from Wako Pure Chemical Industries (Chuo-Ku, Osaka, Japan), and it was used without modification. A cylindrical quartz pyrolysis reactor of 50 mm diameter by 350 mm length was used for all experiments. A small 30 mm diameter, 60 mm length quartz tube was loaded with cellulose (6.0 g), and catalyst (1.0 g), which was suspended in the reactor (Figure 11). The specific experiment process is the same as the previous study. First, Nitrogen gas was used to purge all air out of the reactor. Next, turn on the electric furnace to the target temperature. Next, collect the bio-oil from the flask. Finally, filtering the bio-oil for GC-MS analysis. The amount of bio-oil and char and coke was weighed, and then the amount of gas was calculated by subtracting the amount of bio-oil and char and coke from the initial feed. Each experiment was conducted three times to measure the repeatability and to determine the measurement error by the scale. The deviations are shown in Figure 6.
3.2.3. XRD, SEM-EDS Characterization, AES analysis, Water Content and GC-MS Analysis
The X-ray diffractometer (Mini Flex 600, Rigaku Ltd. Tokyo, Japan) operated at 46 kV and the X-ray tube at 14 mA was used to analyze the catalysts. The scan range (2 theta) of the XRD pattern was collected from 5° to 90° using filtered Cu radiation.
A scanning electron microscope (VE-9800, Keyence Corporation, Tokyo, Japan) was used to obtain the surface images at 10 kV. The bio-oil water content was measured by using a Karl-Fisher titrator (758 KFD Titrino Metrohm Ltd., Herisau, Switzerland). While the elemental composition of the different NiFe catalysts were analyzed by the energy-dispersive X-ray spectroscopy (EDS, Genesis XM2, EDAX Corporation, Tokyo, Japan).
The AES measurements were carried out with a Physical Electronics Model 700 Scanning Auger Nanoprobe system. The experiments were performed at a primary electron energy of 10 keV at surface normal incidence, and an electron beam current of 8 nA. The tilting angle is 30° and analyzer mode is M4 MULTI.
Brunauer–Emmett–Teller method based equipment (BEL SORP mini, Bel Japan Inc., Tokyo, Japan) was used to test the specific surface area. The surface area was small (~2 m2/g) due to the pure metal composition.
GC–MS equipment, model GC-2010 and a GC–MS-QP2010 SE mass-detector (Shimadzu Corporation, Tokyo, Japan), was used to analyze the composition of upgraded bio-oil and to identify organic compounds. The column for testing was Stabilwax-DA 30 m × 0.25 mm, 0.25 μm diameter (Restek, Bellefonte, PA, USA). The ionization condition is EI-MS. The specific testing condition has been shown in another work [29]. An HP-PLOT Q column was used to analyze pyrolyzed gas.
4. Conclusions
The NiFe cluster designed catalysts prepared by the sol-gel method improved the quality of bio-oil and the used catalystid not change after repeated experimental use by XRD, yield and GC-MS results [30] indicating a new potential type of recyclable stand-alone catalyst that can be used for pyrolysis.
Cellulose was pyrolyzed with different cluster designed catalysts to obtain a new understanding of the properties of cluster designed catalysts. The results reflect the high Ni ratio increase yield and larger volume of the cluster will decrease yield. Furthermore, this work was undertaken to establish a relationship between theoretical chemistry and experimental pyrolysis results. The cluster catalyst ΔG and Ni/Fe ratio were proved to influence the bio-oil composition.
Based on the above results, two catalyst design ideas have been established, 1) a cluster with large ΔG and high Ni/Fe ratios—not only does it increase the yield of bio-oil and ketone, but it can also reduce sugar and acid concentration—and 2) clusters with large ΔG and low Ni/Fe ratios—not only can they increase the furan and ketone composition, but they can also reduce sugar concentration.
Supplementary Materials
The following are available online at https://0-www-mdpi-com.brum.beds.ac.uk/2073-4344/10/10/1160/s1, Figure S1: Simulated clusters of Nia (1 < a < 6), Feb (1 < b < 6), Figure S2: XRD analysis of prepared catalysts and comparison with XRD standard reference compositions (#), Figure S3: XRD analysis of original (before) NiFe cluster catalyst and after pyrolysis (used), Figure S4: Gas chromatograms of pyrolyzed cellulose sample without the catalyst. The 30 numbered peaks are listed in Table S10, Figure S5: Mass spectra results of the top 4 compounds of pyrolyzed cellulose sample without the catalyst. (A) 1,6-anhydro-beta-d-glucopyranose (ret. time 99.0 min, peak 30); (B) furfural (ret. time 35.9 min, peak 3); (C) 5-hydroxymethylfurfural (ret. time 83.2 min, peak 27); (D) 1,2-cyclopentanedione (ret. time 54.4 min, peak 11). Mass spectra are in reference to Figure S4 and Table S10, Figure S6: Gas chromatograms results of pyrolyzed cellulose sample with Ni2Fe catalyst. The 30 numbered peaks are listed in Table S11, Figure S7: Mass spectra results of top 4 compounds of pyrolyzed cellulose with Ni2Fe catalyst. (A) 1,6-anhydro-beta-d-glucopyranose (Ret. time 98.9 min, peak 30); (B) furfural (ret. time 36.1 min, peak 3); (C) 5-hydroxymethylfurfural (ret. time 83.2 min, peak 27); (D) 1,2-cyclopentanedione (ret. time 54.5 min, peak 10); (E) decane, 5,6-dimethyl (ret. time 79.7 min, peak 25). Mass spectra correspond to Figure S6 and Table S11, Figure S8: Gas chromatograms results of pyrolyzed cellulose sample with NiFe4 catalyst. The 30 numbered peaks are listed in Table S12, Figure S8: Gas chromatograms results of pyrolyzed cellulose sample with NiFe4 catalyst. The 30 numbered peaks are listed in Table S12, Figure S9: Mass spectra results of top 4 compounds of pyrolyzed cellulose with NiFe4 catalyst. (A) 1,6-anhydro-beta-d-glucopyranose (Ret. time 99.0 min); (B) furfural (Ret. time 36.0 min); (C) 5-hydroxymethylfurfural (Ret. time 83.2 min); (D) 1,2-cyclopentanedione (ret. time 54.5 min); (E) decane, 5,6-dimethyl- (ret. time 79.8 min). Mass spectra corresponding to Figure S8 and Table S12. Table S1: Cartesian coordinates of NiFe cluster structure, Table S2: Frequency, structure energy, and ZPVE of NiFe cluster structure. (Structure energy is the sum of electronic and zero-point Energies), Table S3: Cartesian coordinates of Ni cluster structure, Table S4: Frequency, structure energy, and ZPVE of Ni cluster structure. (Structure energy is the sum of electronic and zero-point Energies), Table S5: Cartesian coordinates of Fe cluster structure, Table S6: Frequency, structure energy and ZPVE of Fe cluster structure (structure energy is the sum of electronic and zero-point energies), Table S7: Bio-oil, Gas and Char andcoke yields from pyrolysis of cellulose with different catalysts for all samples, Table S8: Specific heat capacity and heat conductivity coefficient for cellulose, Ni and Fe metal. (SHC represent specific heat capacity, (kJ/kg·K); HCC represent heat conductivity coefficient(W/m·°C)), Table S9: Heat conductivity coefficient for cellulose with different NiFe cluster designed catalysts. (HCC represents the heat conductivity coefficient (W/m·°C)) Heat conductivity coefficient for cellulose with different NiFe cluster designed catalysts. (HCC represents the heat conductivity coefficient (W/m·°C)) , Table S10: Specific bio-oil compounds measured by GC-MS without catalyst (Figure S4), Table S11: Specific bio-oil compounds measured by GC-MS with Ni2Fe cluster catalyst (Figure S6), Table S12: Specific bio-oil compounds measured by GC-MS with NiFe4 cluster catalyst (Figure S8).
Author Contributions
Conceptualization, S.L.; software, S.L. and D.Y.; writing—original draft preparation, S.L. and D.Y.; writing—review and editing, S.L., S.C., and J.S.C.; supervision, J.S.C. All authors have read and agreed to the published version of the manuscript.
Funding
This work was supported by Professor Jeffrey Cross’ laboratory budget supplied by the Tokyo Institute of Technology.
Conflicts of Interest
The authors declare no conflict of interest.
References
- Roser, M.; Ortiz-Ospina, E. World Population Growth. Available online: https://ourworldindata.org/world-population-growth (accessed on 7 October 2020).
- Karim, M.; Munir, A.; Karim, M.; Muhammad-Sukki, F.; Abu-Bakar, S.; Sellami, N.; Bani, N.; Hassan, M. Energy Revolution for Our Common Future: An Evaluation of the Emerging International Renewable Energy Law. Energies 2018, 11, 1769. [Google Scholar] [CrossRef] [Green Version]
- Liu, Z. China’s strategy for the development of renewable energies. Energy Source Part B 2017, 12, 971–975. [Google Scholar] [CrossRef] [Green Version]
- Lior, N. Energy resources and use: The present situation and possible paths to the future. Energy 2008, 33, 842–857. [Google Scholar] [CrossRef]
- Biofuels International Magazine. Market Study Global Biofuels Market to Grow to $246bn by 2024. Available online: http://biofuels-news.com/display_news/10395/market_study_global_biofuels_market_to_grow_to_246bn_by_2024/ (accessed on 6 October 2020).
- Lehto, J.; Oasmaa, A.; Solantausta, Y.; Kytö, M.; Chiaramonti, D. Review of fuel oil quality and combustion of fast pyrolysis bio-oils from lignocellulosic biomass. Appl. Energy 2014, 116, 178–190. [Google Scholar] [CrossRef]
- Wang, Y.X.; Fang, Y.M.; He, T.; Hu, H.Q.; Wu, J.H. Hydrodeoxygenation of dibenzofuran over noble metal supported on mesoporous zeolite. Catal. Commun. 2011, 12, 1201. [Google Scholar] [CrossRef]
- Lan, P.; Xu, Q.; Zhou, M.; Lan, L.; Zhang, S.; Yan, Y. Catalytic Steam Reforming of Fast Pyrolysis Bio-Oil in Fixed Bed and Fluidized Bed Reactors. Chem. Eng. Technol. 2010, 33, 2021. [Google Scholar] [CrossRef]
- Eschenbacher, A.; Saraeian, A.; Shanks, B.H.; Jensen, P.A.; Henriksen, U.B.; Ahrenfeldt, J.; Jensen, A.D. Insights into the scalability of catalytic upgrading of biomass pyrolysis vapors using micro and bench-scale reactors. Sustain. Energy Fuels 2020, 4, 3780–3796. [Google Scholar] [CrossRef]
- Huber, G.W.; Brown, R.C. Prospects and challenges of pyrolysis technologies for biomass conversion. Energy Technol. GER 2017, 5, 5–6. [Google Scholar] [CrossRef]
- Bridgwater, T. Challenges and opportunities in fast pyrolysis of biomass: Part I. Johns. Matthey Technol. Rev. 2018, 62, 118–130. [Google Scholar] [CrossRef]
- Funke, A.; Richter, D.; Niebel, A.; Dahmen, N.; Sauer, J. Fast pyrolysis of biomass residues in a twin-screw mixing reactor. JoVE 2016, e54395. [Google Scholar] [CrossRef]
- Zhou, G.; Li, J.; Yu, Y.; Li, X.; Wang, Y.; Wang, W.; Komarneni, S. Optimizing the distribution of aromatic products from catalytic fast pyrolysis of cellulose by ZSM-5 modification with boron and co-feeding of low-density polyethylene. Appl. Catal. A Gen. 2014, 487, 45–53. [Google Scholar] [CrossRef]
- Custodis, V.B.; Hemberger, P.; Ma, Z.; van Bokhoven, J.A. Mechanism of fast pyrolysis of lignin: Studying model compounds. J. Phys. Chem. B 2014, 118, 8524–8531. [Google Scholar] [CrossRef] [PubMed]
- Cheng, S.; Wei, L.; Julson, J.; Muthukumarappan, K.; Kharel, P.R. Upgrading pyrolysis bio-oil to hydrocarbon enriched biofuel over bifunctional Fe-Ni/HZSM-5 catalyst in supercritical methanol. Fuel Process. Technol. 2017, 167, 117–126. [Google Scholar] [CrossRef]
- Ji, X.; Liu, B.; Ma, W.; Chen, G.; Yan, B.; Cheng, Z. Effect of MgO promoter on Ni-Mg/ZSM-5 catalysts for catalytic pyrolysis of lipid-extracted residue of Tribonema minus. J. Anal. Appl. Pyrol. 2017, 123, 278–283. [Google Scholar] [CrossRef]
- Mutz, B.; Belimov, M.; Wang, W.; Sprenger, P.; Serrer, M.A.; Wang, D.; Grunwaldt, J.D. Potential of an alumina-supported Ni3Fe catalyst in the methanation of CO2: Impact of alloy formation on activity and stability. ACS Catal. 2017, 7, 6802–6814. [Google Scholar] [CrossRef]
- Gong, L.; Chen, J.J.; Mu, Y. Catalytic CO2 reduction to valuable chemicals using NiFe-based nanoclusters: A first-principles theoretical evaluation. Phys. Chem. Chem. Phys. 2017, 19, 28344–28353. [Google Scholar] [CrossRef]
- Liu, J.C.; Ma, X.L.; Li, Y.; Wang, Y.G.; Xiao, H.; Li, J. Heterogeneous Fe3 single-cluster catalyst for ammonia synthesis via an associative mechanism. Nat. Commun. 2018, 9, 1610. [Google Scholar] [CrossRef]
- Yu, J.; Hai, Y.; Cheng, B. Enhanced Photocatalytic H2-Production Activity of TiO2 by Ni(OH)2 Cluster Modification. J. Phys. Chem. C 2011, 115, 4953–4958. [Google Scholar] [CrossRef]
- Saito, N.; Cordier, S.; Lemoine, P.; Ohsawa, T.; Wada, Y.; Grasset, F.; Cross, J.S.; Ohashi, N. Lattice and Valence Electronic Structures of Crystalline Octahedral Molybdenum Halide Clusters-Based Compounds, Cs2[Mo6X14] (X = Cl, Br, I), Studied by Density Functional Theory Calculations. Inorg. Chem. 2017, 56, 6234–6243. [Google Scholar] [CrossRef]
- Bandyopadhyay, D. Chemisorptions effect of oxygen on the geometries, electronic and magnetic properties of small size Ni(n) (n = 1-6) clusters. J. Mol. Model. 2012, 18, 737–749. [Google Scholar] [CrossRef]
- Song, W.; Lu, W.C.; Wang, C.Z.; Ho, K.M. Magnetic and electronic properties of the nickel clusters Nin (n≤30). Comput. Theor. Chem. 2011, 978, 41–46. [Google Scholar] [CrossRef]
- Yao, Y.H.; Gu, X.; Ji, M.; Gong, X.G.; Wang, D.S. Structures and magnetic moments of Nin clusters. Phys. Lett. A 2007, 360, 629–631. [Google Scholar] [CrossRef]
- Liu, X.; Wang, C.Z.; Lin, H.Q.; Hupalo, M.; Thiel, P.A.; Ho, K.M.; Tringides, M.C. Structures and magnetic properties of Fe clusters on graphene. Phys. Rev. B 2014, 90, 155444. [Google Scholar] [CrossRef]
- Rao, B.K.; Ramos de Debiaggi, S.; Jena, P. Structure and magnetic properties of Fe-Ni clusters. Phys. Rev. B 2001, 64, 024418. [Google Scholar] [CrossRef]
- Nakazawa, T.; Igarashi, T.; Tsuru, T.; Kaji, Y. Ab initio calculations of Fe–Ni clusters. Comp. Mater. Sci. 2009, 46, 367–375. [Google Scholar] [CrossRef]
- Lavrentiev, M.Y.; Wrobel, J.S.; Nguyen-Manh, D.; Dudarev, S.L. Magnetic and thermodynamic properties of face-centered cubic Fe-Ni alloys. Phys. Chem. Chem. Phys. 2014, 16, 16049–16059. [Google Scholar] [CrossRef] [Green Version]
- Nie, L.; de Souza, P.M.; Noronha, F.B.; An, W.; Sooknoi, T.; Resasco, D.E. Selective conversion of m-cresol to toluene over bimetallic Ni–Fe catalysts. J. Mol. Catal. A Chem. 2014, 388–389, 47–55. [Google Scholar] [CrossRef]
- Li, S.Y.; Cross, J.S. Reusability of the Ni2Fe3 metal catalyst for upgrading pyrolyzed bio-oil. MATEC Web Conf. 2019, accepted. [Google Scholar]
- Yao, D.; Wu, C.; Yang, H.; Hu, Q.; Nahil, M.A.; Chen, H.; Williams, P.T. Hydrogen production from catalytic reforming of the aqueous fraction of pyrolysis bio-oil with modified Ni–Al catalysts. Int. J. Hyrogen Energy 2014, 39, 14642–14652. [Google Scholar] [CrossRef] [Green Version]
- Sun, K.; Huang, Q.X.; Chi, Y.; Yan, J.H. Effect of ZnCl2-activated biochar on catalytic pyrolysis of mixed waste plastics for producing aromatic-enriched oil. Waste Manag. 2018, 81, 128–137. [Google Scholar] [CrossRef]
- Cho, D.W.; Yoon, K.; Ahn, Y.; Sun, Y.; Tsang, D.C.; Hou, D.; Song, H. Fabrication and environmental applications of multifunctional mixed metal-biochar composites (MMBC) from red mud and lignin wastes. J. Hazard. Mater. 2019, 374, 412–419. [Google Scholar] [CrossRef] [PubMed]
- Behrens, M.; Cross, J.S.; Akasaka, H.; Ohtake, N. A study of guaiacol, cellulose, and Hinoki wood pyrolysis with silica, ZrO2andTiO2 and ZSM-5 catalysts. J. Anal. Appl. Pyrol. 2017, 125, 178–184. [Google Scholar] [CrossRef]
- Xia, H.; Yan, X.; Xu, S.; Yang, L.; Ge, Y.; Wang, J.; Zuo, S. Effect of Zn/ZSM-5 and FePO4 Catalysts on Cellulose Pyrolysis. J. Chem. 2015, 2015, 1–11. [Google Scholar]
- Stefanidis, S.D.; Kalogiannis, K.G.; Iliopoulou, E.F.; Michailof, C.M.; Pilavachi, P.A.; Lappas, A.A. A study of lignocellulosic biomass pyrolysis via the pyrolysis of cellulose, hemicellulose and lignin. J. Anal. Appl. Pyrol. 2014, 105, 143–150. [Google Scholar] [CrossRef]
- Li, S.Y.; Cheng, S.; Cross, J.S. Homogeneous and Heterogeneous Catalysis Impact on Pyrolyzed Cellulose to Produce Bio-Oil. Catalysts 2020, 10, 178. [Google Scholar] [CrossRef] [Green Version]
- Yu, F.W.; Ji, D.X.; Nie, Y.; Luo, Y.; Huang, C.J.; Ji, J.B. Study on the pyrolysis of cellulose for bio-oil with mesoporous molecular sieve catalysts. Appl. Biochem. Biotechnol. 2012, 168, 174–182. [Google Scholar] [CrossRef] [PubMed]
- ToolBox, T.E. The Specific Heat of Metals and Metalloids (Semimetals). Available online: https://www.engineeringtoolbox.com/heat-capacity-d_338.html (accessed on 6 October 2020).
- Madelung, O.; White, G. Thermal Conductivity of Pure Metals and Alloys; Springer: Berlin/Heidelberg, Germany, 1991. [Google Scholar]
- Fabbri, D.; Torri, C.; Baravelli, V. Effect of zeolites and nanopowder metal oxides on the distribution of chiral anhydrosugars evolved from pyrolysis of cellulose: An analytical study. J. Anal. Appl. Pyrol. 2007, 80, 24–29. [Google Scholar] [CrossRef]
- Lu, Q.; Wang, Z.; Dong, C.Q.; Zhang, Z.F.; Zhang, Y.; Yang, Y.P.; Zhu, X.F. Selective fast pyrolysis of biomass impregnated with ZnCl2: Furfural production together with acetic acid and activated carbon as by-products. J. Anal. Appl. Pyrol. 2011, 91, 273–279. [Google Scholar] [CrossRef]
- Wang, Z.; Ma, R.; Lin, W.; Song, W. Pyrolysis of cellulose under catalysis of SAPO-34, ZSM-5, and Y zeolite via the Py-GC/MS method. Int. J. Green Energy 2016, 13, 853–858. [Google Scholar] [CrossRef]
- Ly, H.V.; Galiwango, E.; Kim, S.S.; Kim, J.; Choi, J.H.; Woo, H.C.; Othman, M.R. Hydrodeoxygenation of 2-furyl methyl ketone as a model compound of algal Saccharina Japonica bio-oil using iron phosphide catalyst. Chem. Eng. J. 2017, 317, 302–308. [Google Scholar] [CrossRef]
- Mehta, M.; Holthausen, M.H.; Mallov, I.; Perez, M.; Qu, Z.W.; Grimme, S.; Stephan, D.W. Catalytic Ketone Hydrodeoxygenation Mediated by Highly Electrophilic Phosphonium Cations. Angew. Chem. 2015, 54, 8250–8254. [Google Scholar] [CrossRef]
- King, A.E.; Brooks, T.J.; Tian, Y.H.; Batista, E.R.; Sutton, A.D. Understanding Ketone Hydrodeoxygenation for the Production of Fuels and Feedstocks From Biomass. ACS Catal. 2015, 5, 1223–1226. [Google Scholar] [CrossRef]
- Shafizadeh, F.R.E.D. Industrial pyrolysis of cellulosic materials. Appl. Polym. Symp. 1975, 28, 153–174. [Google Scholar]
- Thangalazhy-Gopakumar, S.; Adhikari, S.; Gupta, R.B.; Fernando, S.D. Influence of Pyrolysis Operating Conditions on Bio-Oil Components: A Microscale Study in a Pyroprobe. Energy Fuels 2011, 25, 1191–1199. [Google Scholar] [CrossRef]
- Lin, Y.C.; Cho, J.; Tompsett, G.A.; Westmoreland, P.R.; Huber, G.W. Kinetics and Mechanism of Cellulose Pyrolysis. J. Phys. Chem. C 2009, 113, 20097–20107. [Google Scholar] [CrossRef] [Green Version]
- Sanders, E.B.; Goldsmith, A.I.; Seeman, J.I. A model that distinguishes the pyrolysis of D-glucose, D-fructose, and sucrose from that of cellulose. Application to the understanding of cigarette smoke formation. J. Anal. Appl. Pyrol. 2003, 66, 29–50. [Google Scholar] [CrossRef]
- Nowakowski, D.J.; Jones, J.M. Uncatalysed and potassium-catalysed pyrolysis of the cell-wall constituents of biomass and their model compounds. J. Anal. Appl. Pyrol. 2008, 83, 12–25. [Google Scholar] [CrossRef]
- Lill, S.O.N.; Siegbahn, P.E. An autocatalytic mechanism for NiFe-hydrogenase: Reduction to Ni (I) followed by oxidative addition. Biochemistry 2009, 48, 1056–1066. [Google Scholar] [CrossRef]
- Kaya, A.A.; Erturk, K. Structural and optical properties of Fe/Ni: ZnO nanoparticles: Experimental and DFT studies. Appl. Phys. A 2018, 124, 346. [Google Scholar] [CrossRef]
- Frisch, M.J.; Trucks, G.W.; Schlegel, H.B.; Scuseria, G.E.; Robb, M.A.; Cheeseman, J.R.; Scalmani, G.; Barone, V.; Petersson, G.A.; Nakatsuji, H.; et al. Gaussian 16. Revision A 3; Gaussian, Inc.: Wallingford, CT, USA, 2016. [Google Scholar]
- Accelrys Software Inc. Material Studio Modeling Environment, Release 6; Accelrys Software Inc.: San Diego, CA, USA, 2011. [Google Scholar]
- De, G.; Tapfer, L. Formation of copper and silver nanometer dimension clusters in silica by the sol-gel process. Appl. Phys. Lett. 1996, 68, 3820. [Google Scholar] [CrossRef]
- Jayaprakash, J.; Srinivasan, N.; Chandrasekaran, P.; Girija, E.K. Synthesis and characterization of cluster of grapes like pure and Zinc-doped CuO nanoparticles by sol-gel method. Spetrochim. Acta A 2015, 136, 1803–1806. [Google Scholar] [CrossRef]
Figure 1.
Optimized structures of the NiaFeb (2 ≤ a + b ≤ 6) clusters at the B3LYP/LANL2DZ level.

Figure 2.
∆G (A) and binding energy (B) of the NiaFeb (2 ≤ a + b ≤ 6) clusters versus number of Fe atoms in the cluster.
Figure 2.
∆G (A) and binding energy (B) of the NiaFeb (2 ≤ a + b ≤ 6) clusters versus number of Fe atoms in the cluster.

Figure 3.
XRD analysis of prepared catalysts.

Figure 4.
Comparison between outer most layer of catalyst and cluster structure: (a(1,2)) crystal structure of catalyst, (b(1,2)) outer most layer (100) of catalyst, (c(1,2)) cluster structure.
Figure 4.
Comparison between outer most layer of catalyst and cluster structure: (a(1,2)) crystal structure of catalyst, (b(1,2)) outer most layer (100) of catalyst, (c(1,2)) cluster structure.

Figure 5.
SEM images of NiFe catalyst particles at 1400× and 9000× magnifications.

Figure 6.
Yield of bio-oil, gas and char and coke without (none) and with different catalysts.

Figure 7.
The relationship between bio-oil yield and Ni/Fe ratio for all catalysts (value = 0 means without catalyst).
Figure 7.
The relationship between bio-oil yield and Ni/Fe ratio for all catalysts (value = 0 means without catalyst).

Figure 8.
Chemical relative compositions of the organic phase of bio-oils prepared with different cluster structural catalysts.
Figure 8.
Chemical relative compositions of the organic phase of bio-oils prepared with different cluster structural catalysts.

Figure 9.
Possible reaction pathways for levoglucosan (sugar) conversion with NiFe cluster catalyst. a: [47]; b: [48]; c: [49]; d: [50]; e: [51].

Figure 10.
Process for selecting most stable cluster designed catalyst.

Figure 11.
Experimental set-up for pyrolysis experiments.


Table 1.
Characteristics of calculated NiaFeb (2 ≤ a + b ≤ 6) clusters.
| Cluster | Symmetry | ΔG (kJ/mol) | Eb (kJ/mol) |
|---|---|---|---|
| NiFe | C∞ | 277.1 | 149.6 |
| Ni2Fe | C2V | 254.2 | 194.5 |
| NiFe2 | C2V | 186.8 | 172.5 |
| Ni3Fe | C3V | 252.3 | 219.7 |
| Ni2Fe2 | C2V | 243.4 | 216.0 |
| NiFe3 | CS | 229.6 | 194.5 |
| Ni4Fe | C1 | 230.3 | 228.8 |
| Ni3Fe2 | C1 | 240.8 | 231.2 |
| Ni2Fe3 | C2V | 279.0 | 235.8 |
| NiFe4 | C1 | 355.1 | 235.0 |
| Ni5Fe | C2V | 270.1 | 241.0 |
| Ni4Fe2 | C2V | 306.9 | 249.8 |
| Ni3Fe3 | C1 | 266.5 | 249.9 |
| Ni2Fe4 | D2H | 309.1 | 254.3 |
| NiFe5 | C1 | 276.9 | 247.4 |
Table 2.
Composition of cellulose pyrolyzed products with different catalysts (peak area% of identified peaks, where HC is hydrocarbon compounds, and unidentifiable compounds are lumped together in others category.).
Table 2.
Composition of cellulose pyrolyzed products with different catalysts (peak area% of identified peaks, where HC is hydrocarbon compounds, and unidentifiable compounds are lumped together in others category.).
| Cellulose | Acid | Alcohol | Aldehydes | Esters | Furans | Ketone | Phenol | Sugar | HC | Others |
|---|---|---|---|---|---|---|---|---|---|---|
| None | 7.2 ± 0.4 | 4.1 ± 0.2 | 0.36 ± 0.1 | 0.60 ± 0.44 | 30.7 ± 0.3 | 12.5 ± 1.6 | 2.7 ± 0.2 | 40.1 ± 1.3 | 0.0 | 1.8 ± 0.8 |
| NiFe | 6.0 ± 1.4 | 4.0 ± 0.6 | 0 | 0.55 ± 0.4 | 34.1 ± 0.9 | 18.0 ± 2.0 | 3.1 ± 0.8 | 32.3 ± 1.6 | 0.58 ± 0.2 | 1.4 ± 0.9 |
| Ni2Fe | 5.6 ± 0.9 | 4.5 ± 0.5 | 0 | 0.30 ± 0.2 | 32.4 ± 1.3 | 19.7 ± 1.8 | 4.1 ± 0.8 | 29.2 ± 0.5 | 0.37 ± 0.3 | 3.8 ± 0.9 |
| Ni3Fe | 5.2 ± 0.5 | 4.5 ± 0.3 | 0 | 0.31 ± 0.2 | 30.9 ± 0.6 | 19.2 ± 2.0 | 2.7 ± 0.4 | 33.9 ± 1.6 | 0.29 ± 0.2 | 3.0 ± 1.5 |
| NiFe2 | 6.0 ± 1.4 | 3.9 ± 0.8 | 0 | 0.49 ± 0.4 | 34.8 ± 1.7 | 20.8 ± 1.3 | 3.5 ± 1.2 | 28.6 ± 1.3 | 0.60 ± 0.2 | 1.3 ± 0.8 |
| NiFe3 | 6.5 ± 0.3 | 3.8 ± 0.6 | 0 | 0.36 ± 0.1 | 35.0 ± 1.3 | 17.2 ± 0.9 | 3.0 ± 0.5 | 33.5 ± 1.4 | 0.40 ± 0.3 | 0.24 ± 0.1 |
| NiFe4 | 4.1 ± 0.7 | 3.4 ± 0.3 | 0 | 0.30 ± 0.2 | 36.1 ± 1.6 | 23.0 ± 1.3 | 4.4 ± 1.0 | 27.5 ± 0.9 | 0.80 ± 0.1 | 0.43 ± 0.3 |
| Ni2Fe3 | 6.0 ± 0.5 | 4.0 ± 0.7 | 0 | 0.34 ± 0.1 | 34.5 ± 1.3 | 20.9 ± 0.6 | 4.3 ± 0.4 | 28.8 ± 0.6 | 0.51 ± 0.0 | 0.68 ± 0.5 |
| Ni3Fe2 | 5.9 ± 0.2 | 4.7 ± 0.1 | 0 | 0.38 ± 0.1 | 33.1 ± 1.1 | 20.1 ± 0.1 | 2.7 ± 0.1 | 31.0 ± 1.5 | 0.49 ± 0.2 | 1.6 ± 0.6 |
© 2020 by the authors. Licensee MDPI, Basel, Switzerland. This article is an open access article distributed under the terms and conditions of the Creative Commons Attribution (CC BY) license (http://creativecommons.org/licenses/by/4.0/).
Share and Cite
MDPI and ACS Style
Li, S.; Yu, D.; Cheng, S.; Cross, J.S. Recyclabl Metal (Ni, Fe) Cluster Designed Catalyst for Cellulose Pyrolysis to Upgrade Bio-Oil. Catalysts 2020, 10, 1160. https://0-doi-org.brum.beds.ac.uk/10.3390/catal10101160
AMA Style
Li S, Yu D, Cheng S, Cross JS. Recyclabl Metal (Ni, Fe) Cluster Designed Catalyst for Cellulose Pyrolysis to Upgrade Bio-Oil. Catalysts. 2020; 10(10):1160. https://0-doi-org.brum.beds.ac.uk/10.3390/catal10101160
Chicago/Turabian StyleLi, Siyi, Dan Yu, Shuo Cheng, and Jeffrey S. Cross. 2020. "Recyclabl Metal (Ni, Fe) Cluster Designed Catalyst for Cellulose Pyrolysis to Upgrade Bio-Oil" Catalysts 10, no. 10: 1160. https://0-doi-org.brum.beds.ac.uk/10.3390/catal10101160
Note that from the first issue of 2016, this journal uses article numbers instead of page numbers. See further details here.