Article

Experimental and Computational Analysis of NOx Photocatalytic Abatement Using Carbon-Modified TiO2 Materials

1
TEMA—Centre for Mechanical Engineering and Automation, Mechanical Engineering Department, University of Aveiro, 3810-193 Aveiro, Portugal
2
CICECO—Aveiro Institute of Material, Department of Materials and Ceramic Engineering, University of Aveiro, 3810-193 Aveiro, Portugal
3
Bosch Termotecnologia, S.A., Estrada Nacional 16, 3800-533 Cacia, Portugal
*
Author to whom correspondence should be addressed.
Catalysts 2020, 10(12), 1366; https://doi.org/10.3390/catal10121366
Submission received: 4 November 2020 / Revised: 22 November 2020 / Accepted: 22 November 2020 / Published: 24 November 2020
(This article belongs to the Special Issue Recent Advances in TiO2 Photocatalysts)

Abstract

:
In the present study, two photocatalytic graphene oxide (GO) and carbon nanotubes (CNT) modified TiO2 materials thermally treated at 300 °C (T300_GO and T300_CNT, respectively) were tested and revealed their conversion efficiency of nitrogen oxides (NOx) under simulated solar light, showing slightly better results when compared with the commercial Degussa P25 material at the initial concentration of NOx of 200 ppb. A chemical kinetic model based on the Langmuir–Hinshelwood (L-H) mechanism was employed to simulate micropollutant abatement. Modeling of the fluid dynamics and photocatalytic oxidation (PCO) kinetics was accomplished with computational fluid dynamics (CFD) approach for modeling single-phase liquid fluid flow (air/NOx mixture) with an isothermal heterogeneous surface reaction. A tuning methodology based on an extensive CFD simulation procedure was applied to adjust the kinetic model parameters toward a better correspondence between simulated and experimentally obtained data. The kinetic simulations of heterogeneous photo-oxidation of NOx carried out with the optimized parameters demonstrated a high degree of matching with the experimentally obtained NOx conversion. T300_CNT is the most active photolytic material with a degradation rate of 62.1%, followed by P25-61.4% and T300_GO-60.4%, when irradiated, for 30 min, with emission spectra similar to solar light.

Graphical Abstract

1. Introduction

The air quality is influenced by a significant number of harmful substances including gases (carbon monoxide and dioxide, ozone, nitrogen oxides, volatile organic compounds), other contaminants of organic and inorganic origin as well as bacteria, fungi, and pollen. These pollutants can penetrate deep into the respiratory and circulatory human systems, causing great damage [1]. A very significant fraction of indoor air pollution is a result of human activities. Nitrogen oxides are considered major contaminants, with carcinogenic activity, that also have a detrimental effect on the lung functions and reproductive system [2]. In light of this, the air quality guideline [3] of the World Health Organization (WHO) has established a threshold limit of 1 h indoor nitrogen dioxide (NO2) exposure at 200 μg/m3 and an annual average exposure at 40 μg/m3. Both nitrogen monoxide (NO) and dioxide are gases produced by high rate expressions combustion through reactions between nitrogen and oxygen. The main sources of NOx are exhaust gases from cars and trucks as well as emissions from electrical power generation plants. Therefore, NOx ground-level emissions and their indoor concentrations are normally lower than outdoors. However, the NOx levels in homes, where gas or coal-burning are used for heating and cooking or when they are located close to underground parking garages, may surpass the outdoor concentrations [3,4]. Cigarette smoke can also be considered a source of indoor NOx pollution [5]. Unfortunately, conventional air filtration systems do not efficiently deal with the destruction/removal of some of the above-mentioned contaminants including, but not limited to, NOx. A technology based on the principle of photocatalysis, earlier used for water purification, has been applied in recent years for indoor air purification. Photocatalytic oxidation (PCO) is based on the irradiation of a photocatalyst, generally an inorganic semiconductor such as TiO2. When the TiO2 material is exposed to a light source, electrons transit from the valence to the conduction band, resulting in the generation of positive holes. Their interaction with water molecules leads to the formation of strong oxidants: superoxide radical anions (O2•−) and the hydroxyl radicals (HO), which are powerful oxidizing agents. In the case of NO and NO2 heterogeneous photocatalysis, O2•− reacts with nitrogen oxides to form nitrates, while HO increases the efficacy of the process and participates by reacting with NO2 and discomposing it into nitrate and NO [6]. There are many studies reporting the high efficiency of PCO processes initiated by TiO2-based catalysts for the purification of air polluted with NOx [7,8,9,10]. To enhance the efficiency of the photocatalytic activity of commercially available TiO2, researchers focused on the modification of their physical and chemical characteristics such as doping with other chemical elements to manipulate its chemical structure and therefore the band gap [11,12,13,14] and testing their photocatalytic behavior under different types of light sources, such as visible (Vis) and UV lights [15,16]. Recently, Silva et al. [14] used a simple and green procedure to synthesize TiO2-based materials, which showed great photocatalytic ability. That work was focused on the activation of the photocatalysts using solar light, as it is freely available and almost limitless. Carbon structures (graphene oxide or carbon nanotubes) were added to TiO2 to improve the degradation rates by reducing the electron–hole recombination. Prepared materials were tested with a dye (rhodamine B) to find those having the best performance under both UV and Vis lights. In particular, Vis light (400–700 nm) is important because it represents 43% of solar radiation (where 5% is UV (300–400 nm)) and the 52% is infrared (700–250 nm) [17]. After selecting the best materials, their ability to degrade benzene was tested and compared against the very effective and commonly used commercial material P25. Two of the prepared materials surpassed the commercial one: T300_GO and T300_CNT. Accordingly, these materials were chosen for the present work to be tested for the first time in the photocatalytic degradation of the NOx by employing experimental and computational procedures.
The PCO process of nitrogen oxides obeys the reactions kinetics usually described by a Langmuir–Hinshelwood (L-N) model, reporting a satisfactory agreement between the experimental and analytical results in a number of studies [8,9,18,19,20,21,22]. In their review, Boyjoo et al. summarized the CFD methods extensively used to address different aspects of gas-phase photocatalytic oxidation modeling for the prediction of uniform and non-uniform air flow and contaminant distribution, generally reporting close agreement with the experimentally obtained contaminant’s conversion [23]. Over the recent years, CFD-based assessment of PCO reaction and fluid dynamics prediction has been applied for optimization of the reactors’ design [9,24,25,26,27,28,29] and optimization of the PCO model parameters [22,30,31,32,33]. These methods are especially useful when the configuration of the photocatalytic reactor does not yield a laminar plug flow and there are large gradients of velocities and pollutant concentration [31,32,34].
The present work had two main objectives. The first one was focused on the assessment of TiO2 carbon-based materials’ efficiency for photocatalytic degradation of NOx using a lab-scale photocatalytic reactor under solar light. The conversion yield was determined for different initial concentrations of NOx (from 100–800 ppb). Commercial Degussa P25, de facto a commercial standard, was used as comparison in the photocatalytic tests performed at the concentration of approximately 200 ppb of NOx. This NOx concentration was adopted in accordance to the WHO, which established a threshold limit of 1 h indoor nitrogen dioxide exposure at 200 μg/m3 [3]. The second objective was to develop and validate a computational fluid dynamics (CFD) model representing the hydrodynamics and NOx PCO kinetics for a lab-scale stirred photocatalytic reactor toward a better understanding of the flow dynamics on the abatement of the contaminants. The reaction rate of the photocatalytic oxidation was set as a boundary condition of the CFD model and integrated into the NOx mass transport equation to predict the conversion of NOx. A tuning methodology based on an extensive CFD simulation procedure was implemented to adjust the kinetic model parameters toward a better correspondence between simulated and experimentally obtained data. The validity of the proposed approach was studied by comparing the results of the kinetic simulations with the experimentally obtained data for a range of operating conditions.

2. Results and Discussion

2.1. Experimental Results

The photocatalytic degradation of the NOx at the concentration of approximately 200 ppb under solar light was studied on both synthesized samples: T300_GO and T300_CNT. Results show that both carbon-modified TiO2 materials present similar kinetics compared with Degussa P25, with slightly enhanced performance for T300_CNT sample as shown in Figure S1 in the Electronic Supplementary Information (ESI) file. The NOx degradation rates after 10 min of photocatalytic reaction are 54.2, 58.5 and 56.4% for T300_GO, T300_CNT, and P25 materials, respectively. After 30 min of reaction, a small increase in the NOx degradation rate is observed (60.4, 62.1, and 61.4% for T300_GO, T300_CNT, and P25, respectively).
Tests of both T300_GO and T300_CNT were also conducted by varying the concentrations of NOx at the nominal values of 100, 200, 400, 600, and 800 ppb. The actual measured values of NOx concentrations vary slightly from the nominal ones and are presented along with the measured concentration of NOx at the reactor’s outlet in Table 1. The experimental conversion of NOx was calculated using Equation (1), where Cp.in and Cp.out are NOx concentrations at the inlet and outlet of the reactor, respectively.
% = C p . i n C p . o u t C p . i n
The concentration values at the reactor’s outlet were obtained after 30 min of irradiation (duration of the test), after reaching the adsorption–desorption equilibrium.
As is evident from Table 1, it is hard to discern a clear dependence of the initial concentrations on the conversion rate for the investigated range of NOx concentrations. The conversion rate appears to vary slightly about the average value of 60%, ranging between 55 and 62%. The highest conversion rate was observed for concentrations of 192 and 195 ppb for T300_GO (60.4%) and T300_CNT (62.1%), respectively. Then, with an increase in concentration, the conversion tends to decrease slightly. However, at the lowest experimentally tested concentrations, the conversion values fall out of this trend.
These results seem to differ from the findings of Devahasdin et al. [10], who studied NOx conversion for the inlet concentrations of 5–60 ppm and came to a conclusion that the lower initial concentration yields higher conversion. Similar conclusions were reported by Ballari et al. [19] for concentrations between 100 and 1000 ppb, which is comparable to the range under investigation here. However, it should be noted that in both cases, the photocatalytic materials were under UV-A radiation in the range of 300–400 nm, and the experimental setup is different from that used in the present study.

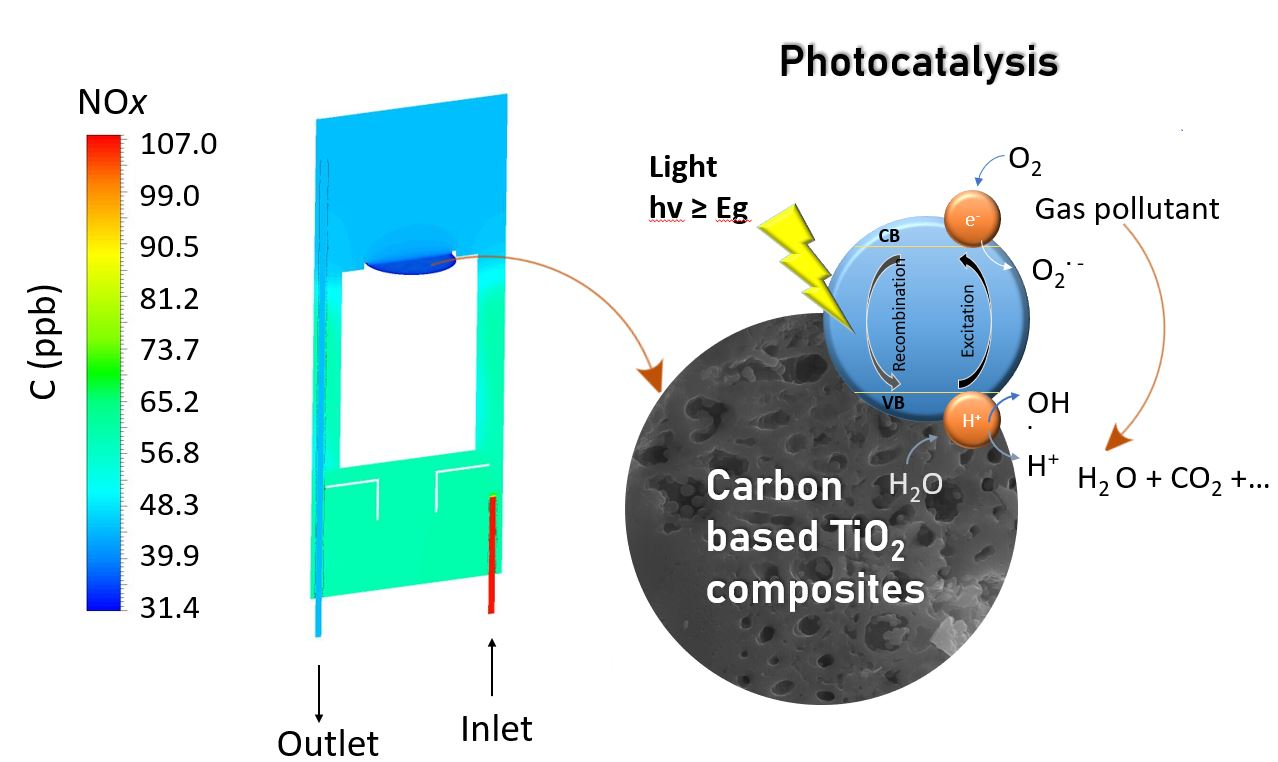
2.2. Flow Field Simulation

Flow distribution through the cross-section of the reactor is shown in Figure 1. It is evident that there is a tendency for flow stagnation in the upper part of the reactor, where the photocatalytic powder is deposited, due to the obstacle to free flow passage caused by the Petri dish support feature. The highest velocity, as expected, was at the fan boundary condition reaching 6.72 m/s. However, the velocity above the photocatalytic surface is several orders of magnitude lower, nor rising above 0.006 m/s, due to the barrier created by the support feature of the Petri dish. This steep velocity gradient along the length of the reactor suggests that the assumption of the perfect mixing inside the reactor may not be valid.
Moreover, from the flow pattern (Figure 1), it can be concluded that the flow regime above the photocatalytic surface is essentially laminar with each layer of fluid moving smoothly past the adjacent layers with little to no mixing. According to Equations (6) and (7), the first cell height should be 0.058 m. However, this value is higher than the height of the first cell in the chosen grid configuration (about 0.0025 m), which corresponds to the Y+ < 0.2. Therefore, in light of the above, there is no need for further mesh refinement at this location.

2.3. PCO Analysis with the Conventionally Estimated L-N Model Parameters

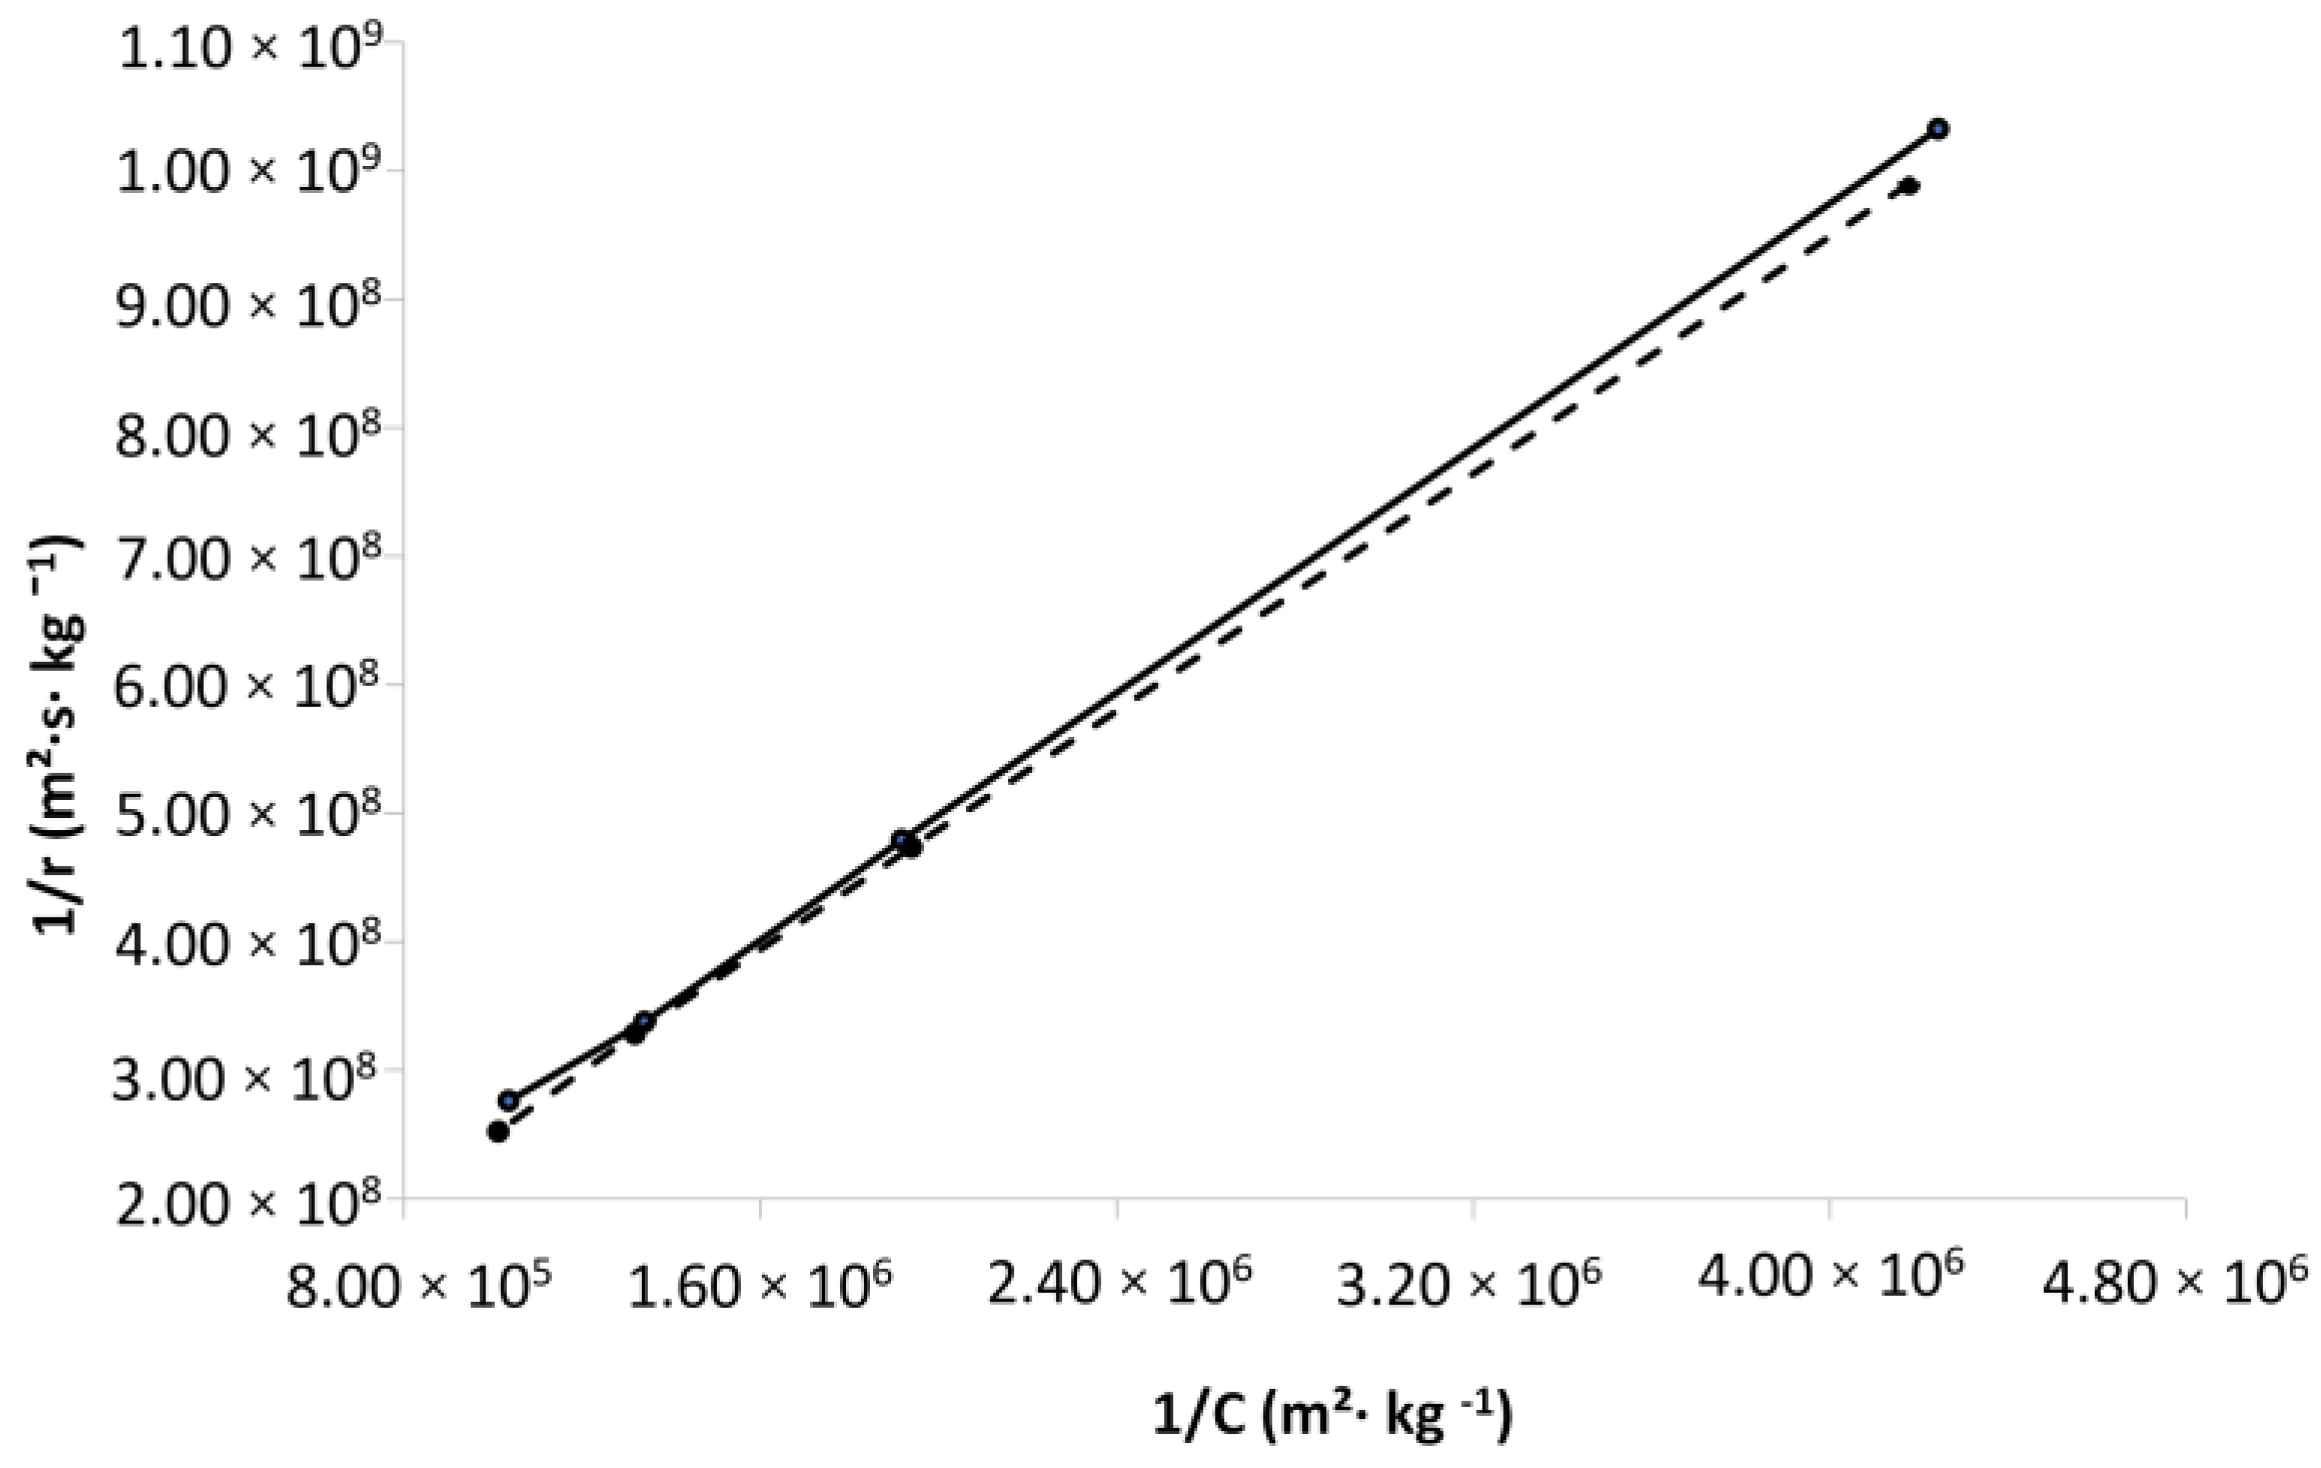
2.3.1. Determination of the L-H Model Parameters from the Experimental Data

The experimental data were used to calibrate the L-H model according to the procedure explained above. It should be noted that only four points/relationships between the reciprocal of the reaction rate (1/rLH) and that of the representative concentration (1/Cp) were used to determine the L-H model parameters, and the data for the lowest concentrations were excluded. During the model fitting with the complete set of data, it was verified that the value for the intercept is negative, which is physical nonsense. It may be eventually attributed to the fact that the linearization of the Langmuir isotherm overemphasizes the data points at a low concentration (points with a high associated error) where the Henry’s Law (hypothesis of infinite dilution) [35] generally, describes the solid–fluid phase equilibrium. Therefore, at very low concentrations, it is unlikely that the system obeys the same Langmuir isotherm (due to energetic heterogeneity of adsorption sites). Another reason for the negative intercept value is the inclusion of the lowest concentration, which can also be related to the difficulties inherent to the concentration’s precise measurement in such diluted solutions. Bearing in mind the provisions exposed above, two reciprocal plots between NOx concentration and its physical adsorption rate were constructed for materials T300_GO and T300_CNT (Figure 2), and the parameters k’ and Kp. were determined by fitting the plots to the Equation (3). According to Figure 2, the relation between initial NOx concentration and the reaction rate is linear for both carbon-modified TiO2 materials. Their estimated kinetic parameters k’ and Kp. are presented in Table 2.

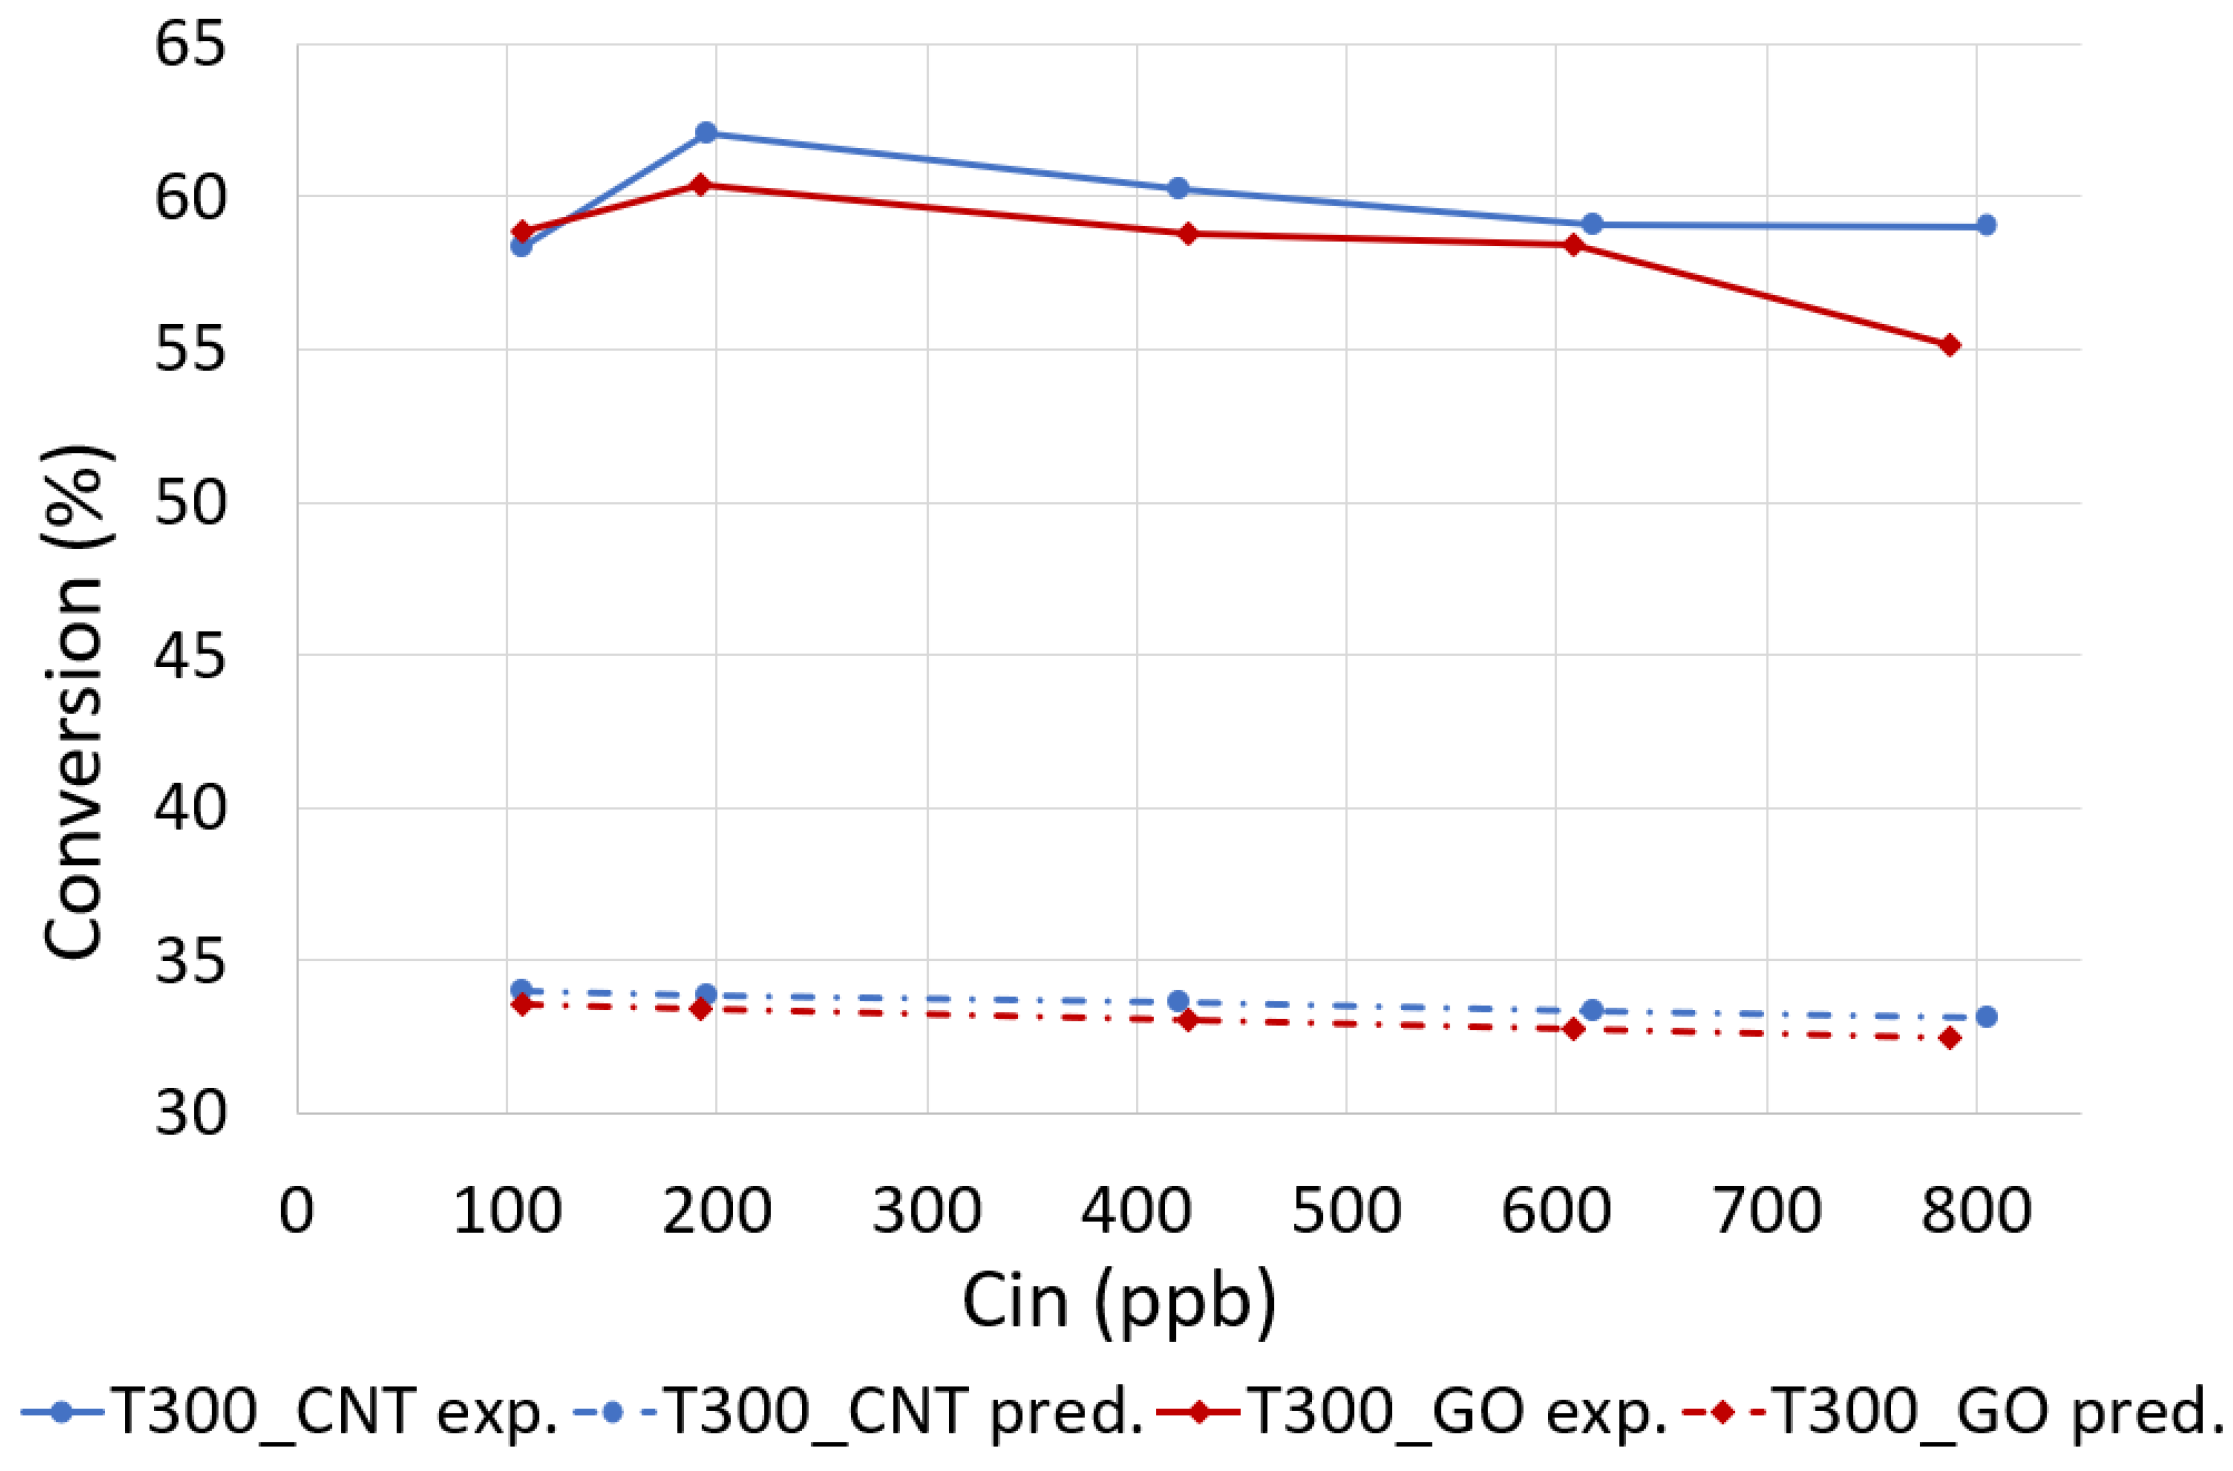
2.3.2. Results of the PCO Analysis with the Conventionally Estimated L-N Model Parameters

The results of the flow simulation (steady-state) were used as the initialization flow field for the species transport simulation in the transient regime, as the stationary nature of the flow field does not interfere with the species transient nature, as the latter is due to local generation corresponding to a negligible mass addition to the flow. It was implemented by applying the interpolation routine, explained in Figure 3.
By applying the profile/flow pattern inside the reactor, it is possible to significantly reduce the duration of the kinetic simulation by solving just the equation for NOx. The residual for the species equation was set at the order of 1.0 × 10⁻⁶. To set up the initial NOx concentration at the beginning of the simulations, the required boundary conditions were set up at the reactor inlet and through all the fluid zones of the reactor’s domain to assure that the NOx concentration is constant and uniform before starting the PCO process. A time step of 1 s was chosen, requiring a total of 1800 time steps to simulate 30 min of reaction time for PCO simulation of NOx. A total of 10 simulations were carried out for different NOx inlet concentrations for both T300_GO and T300_CNT materials.
As evidenced from the distribution of NOx (Figure 4), after 30 min of irradiation (T300_GO/107 ppb), the concentration varies significantly through the length of the reactor, being the lowest, as expected, near the catalyst surface. By mechanisms of convection and diffusion, the initial (highest concentration) is gradually decreased, reaching 71 ppb at the outlet of the reactor. However, this value is much larger than the 44 ppb observed experimentally. In addition, there are high concentration gradients (63–80 ppb) throughout the reactor’s volume, which do not comply with the assumption of perfect mixing used for determination of the L-H model parameters.
Similar trends were observed for both photocatalytic materials T300_GO and T300_CNT through the range of inlet NOx concentrations. The comparison for NOx predicted and experimental conversions are summarized in Figure 5.
The main conclusion reached after the analysis of the simulation results is that the simulation of the PCO process of NOx with the L-H model parameters obtained from the fitting the experimental data (Table 2) led to a large underprediction of the photodegradation efficiency (approximately 44%). It means that the existence of non-uniformity of NOx concentration distribution was not considered, leading subsequently to inaccurate values of the L-H model parameters. However, with an aid of CFD simulation, it is possible to obtain the model parameters accounting for the non-homogeneity of the NOx concentration distribution.

2.4. Kinetic Analysis with the CFD Modified L-N Model Parameters

The CFD optimization procedure applied in this study was similar to the methodology proposed by Einaga et al. [24]. For a given reaction condition (material, inlet NOx concentration) the L-H model parameters k’ and Kp. were iteratively changed to match the experimental NOx concentration at the reactor’s outlet. Eight iterations for every concentration/material combination were performed, resulting in a total of 80 simulations runs.
For a given combination of NOx concentration/material, the set of k’ and Kp. parameters were determined by minimization of the objective function expressed by Equation (2):
O b j e c t i v e = ( C p r . C e x p . ) 2
where Cpr. and Cexp. stand for the predicted and experimental NOx concentrations at the reactor’s outlet. The modified values of the photocatalytic parameters for each material are shown in Table 3. To account for a lack of compliance with the perfect mixing assumption, the reaction rate constant (k’) and the Langmuir adsorption constant (Kp.) should be increased by approximately 45 ± 1%.
After performing the simulations with the optimized L-H model parameters, the calculated and experimentally obtained NOx conversions at the reactor’s outlet were compared and presented in Figure 6. The comparison demonstrates that the numerically predicted concentrations of NOx match closely the experimentally obtained data for both photocatalytic materials analyzed, with the highest difference in the conversion being less than 3.4%. Additionally, after analyzing the NOx concentration distribution with the modified set of the model parameters in more detail, the observation, shown in Figure 7 (T300_GO/ 107 ppb), suggests that in the presence of deficient mixing (high concentration gradients throughout the reactor), both (a) the interaction between adsorbate and the surface, and (b) the sorption capacity of material are larger than estimated with the fitting the experimental data to the L-H model.

3. Materials and Methods

3.1. Materials Synthesis

Two TiO2-carbon based photocatalytic materials were prepared and tested as previously published by Silva et al. [14]. The samples were synthesized using a two-step procedure, starting by hydrolysis and condensation of the precursor tetrabutyl orthotitanate (TBOT) followed by a thermal treatment at 300 °C. The first, designated as T300_GO, is composed of TiO2 with the addition of graphene oxide (GO) and the second, T300_CNT, is composed of TiO2 and carbon nanotubes (CNT). Typically, only the first steps in the syntheses of T300_GO and T300_CNT are different. In the initial steps of the T300_GO synthesis, GO (5 wt. % of TBOT) was added to distilled water and stirred for 10 min, followed by the dropwise addition of TBOT (1:10 w/w) without stirring. In the case of T300_CNT, firstly the CNT (1 wt. % of TBOT) were added to TBOT. After 30 min of sonication at 42 kHz, the mixture was dropwise into distilled water (1:10 w/w) without stirring.
The final steps were the same for both samples: the precipitated material (either GO+TBOT or CNT+TBOT) were removed, rinsed with distilled water repeatedly (5 times), and then left to dry in a Petri dish at ambient conditions for 24 h. The resulting materials were heated using heating rate of 100 °C/h up to 300 °C and kept one hour at this temperature to achieve T300_GO and T300_CNT. Further details of the material synthesis are presented in reference [14].

3.2. Materials Characterization

The materials T300_GO and T300_CNT, which were characterized in Silva et al. [14], are composed of mostly anatase and a small amount of brookite. The presence of GO and CNT into T300_GO and T300_CNT, respectively, was corroborated via Raman spectroscopy (Bruker Optics, Ettlingen, Germany), FTIR and XPS spectroscopy techniques (SPECS, Berlin, Germany). Here, −196 °C N2 adsorption—desorption isotherms (measured at a Gemini V 2.00 instrument model 2380, Micromeritics Instrument Corporation, Georgia, GA, USA) showed that both materials have a type IV isotherm curve (International Union of Pure and Applied Chemistry (IUPAC) classification), which is assigned to the materials’ mesoporosity (also observed by SEM, HITACHI, Krefeld, Germany) and their adsorbent–adsorptive interactions. T300_GO has a pore volume (Vp) of 0.19 cm3/g and 4.2 nm pore width (dp) with a superficial specific area (SBET) of 172 m2/g. T300_CNT has a higher SBET (205 m2/g), Vp of 0.24 cm3/g, and smaller dp (3.3 nm). This porosity allows an increased contact between the pollutant and the photocatalyst. All these characteristics, along with the increased electron transport to TiO2 and the decreased electron–hole recombination, provided by GO and CNT additions, created an efficient photocatalyst. Further details of the chemical and physical characterization of the materials are shown in [14].

3.3. Experimental Setup

The experimental layout is presented in Figure 8. It is composed essentially by four sections: (1) the gas cylinders containing both clean air and pollutants sources; (2) two airflow controllers (one for the clean air, MFC1, and other for the NOx, MFC2) and a T-shaped piece for the air mixing; (3) the photocatalytic reactor where the testing material and the light source are placed, and finally (4) the gas analyzer.

Photocatalytic Reactor Layout

The photocatalytic reactor (Figure 9) used for gas–solid-phase tests belongs to the category of stirred reactors (CSTR), in which one or more impellers are used to generate gas turbulence and air mixing within the reactor [36]. In this case, there is only one small impeller located at the bottom of the reactor. The body of the reactor is made of a 3.5 L stainless steel cylinder. The top is covered with a glass window that allows for the light to reach the photocatalytic material (0.1 g) placed on the surface of the Petri dish (5 cm diameter), which is located on the top of the support. To recreate an outdoor environment, it employed a light source imitating the solar spectrum (Osram Ultra-Vitalux, 300 W, which emission spectrum is reported in Figure S3 of the ESI), which was placed 20 cm above the photocatalytic material. Light intensity and relative humidity were maintained constant throughout all the experimental runs (radiance intensity of 39.6 W/m2 in the UV-A region and 278.0 W/m2 in the visible region, relative humidity of 31%). The gases used were pure synthetic air and NOx (NO = 9.8 ppm and NO2 = 0.2 ppm) both from Praxair. The inlet gas mixture (prepared mixing gas cylinders containing synthetic air and NOx) was allowed to flow into the chamber until it stabilized at the desired concentrations. Once these were reached and it attained a stable level into the reactor, the window glass was uncovered, the lamp was turned on, and the photocatalytic reaction was started.
A mixture of pure synthetic air and NOx controlled by two flow controllers enters the reactor through a tube of 4 mm of internal diameter and 50 mm in length. Then, with the aid of the impeller, the mixture is dispersed throughout the reactor and finally exits through the 280 mm length outlet tube (with the same diameter as the inlet tube), which is connected to a chemiluminescent NOx analyzer (Environment AC31M). The general mechanism of NOx oxidation by photocatalysis implies their oxidation to nitric or nitrous acids by active oxygen species produced on the TiO2 surface.
The desired concentration of NOx was achieved by diluting the NOx of the gas cylinder (concentration of 10 ppm) with pure synthetic air using the two mass flow controllers. The flow of NOx was adjusted, keeping the total flow constant and equal to 1 L/min.

3.4. Kinetic Modeling of Photocatalytic Degradation

3.4.1. Langmuir–Hinshelwood Mechanism

Considering that it is impossible to measure the concentration of gaseous pollutants directly on the surface of the photocatalyst during the experimental runs, the pollutant level has to be acquired from the bulk of the system. This means that the rate expressions being derived from experimental data will be a combination of several parameters such as (i) reaction kinetics; (ii) mass transfer effects within the system; (iii) adsorption/desorption of pollutants from the catalyst surface; and (iv) diffusion effects of the pollutants through the boundary layer.
As mentioned earlier, for several indoor air pollutants, including nitrogen oxides, the PCO kinetics follows some variation of the Langmuir–Hinshelwood (L-H) kinetic model [37]. The Langmuir adsorption isotherm is used to describe the equilibrium between the adsorbate and the adsorbent system, where the adsorbate adsorption is limited to one molecular layer, and all adsorption sites on the surface of the adsorbent are assumed to be identical [38].
In the present case, maintaining the radiation source and relative humidity constant, the Langmuir–Hinshelwood equation of reaction rate can be simplified and formulated as follows [20,37]:
r L H = k K p . C p . 1 + K p . C p .
where rLH is the photocatalytic oxidation reaction rate (kg/m2s); Kp. is the Langmuir adsorption constant related to the affinity of the binding sites and energy of adsorption (m3/kg); k′ is the reaction rate constant, related to sorption capacity (kg/m2s), and Cp. is the pollutant concentration at the supply inlet.

3.4.2. Identification of L-H Model Coefficients by Using the Experimental Results

The reaction rate equation explains the dependence of this parameter on the concentrations of reactants, and for a given reaction, it is determined experimentally. Diverse mathematical formulations of the reaction rate are possible for the different reaction mechanisms. The PCO surface reaction rate is generally obtained, assuming the perfect gases mixing inside the reactor and expressed as follows through Equation (4) [24]:
r e x p = Q A ( C p . i n C p . o u t )
where Q (m3/s) is the volumetric flow rate; A (m2) is the surface area of the photocatalytic where the reaction takes place; and rexp is the reaction rate obtained experimentally, which is equal to the total reaction rate derived from the Langmuir–Hinshelwood equation (Equation (3)). The parameters of the L-H kinetic model may be identified by the linear approximation analysis, applying the least square method.
Based on the reciprocal plots between pollutant concentration, and its physical adsorption rate, the parameters k’ and Kp. could be determined by fitting the plots to Equation (5):
1 r L H = 1 k K p . 1 C p . + 1 k .
Then, the relationship between the reciprocal of the reaction rate (1/rLH) and that of the representative initial concentration (1/Cp.) is plotted as a linear regression curve, where the model parameters are captured by its slope and intercept.

3.5. CFD Analysis

3.5.1. Flow Modeling

CFD simulations of the airflow contaminated with NOx were performed using ANSYS/FLUENT 19.0 [39]. The finite volume formulation used in the present work is based on the Reynolds-averaged Navier–Stokes equations (RANS model). k-ε model, Realizable, was used as a turbulence model. The near wall treatment was based on the use of standard wall functions, as proposed by Launder and Spalding [40], which is a default option in FLUENT. The flow of contaminated air through the reactor, assuming the incompressibility of fluid, is modeled by solving the conservation of mass (the continuity equation) and the conservation of momentum equations simultaneously, and it can be written as follows [39]:
Conservation of mass:
ρ t + ( ρ ν ) = 0
Conservation of momentum:
t ( ρ ν ) + ( ρ ν ν ) = p + ( τ = ) + ρ g + F
where p is the static pressure, τ =   is the stress tensor, ν is the velocity vector, ( ρ g ) is the gravitational body force, and F stands for other model-dependent source terms such as porous-media and user-defined sources.

3.5.2. Solver Parameters

In this study, the pressure-based solver was chosen, which is applicable for a wide range of flow regimes. The Green–Gauss Cell-Based gradient method was selected for the domain discretization, which is referred in the ANSYS Fluent Theory Guide as a suitable choice for tri/tetragonal meshes schemes and a more accurate choice for minimizing false diffusion [39]. The Second-Order Upwind scheme was used for the convection term, and a Pressure-Implicit with Splitting of Operators (PISO) pressure–velocity coupling scheme was taken into consideration as a form of implicit under-relaxation for steady-state cases. It helps in reducing the convergence difficulties associated with highly distorted meshes and, at the same time, it promotes convergence [39]. To account for the presence of the impeller, a PRESTO! interpolation scheme was used for calculating cell-face pressures. This scheme is recommended for highly swirling flows, flows involving steep pressure gradients (fan model, etc.), or in strongly curved domains [41].

3.5.3. Meshing and Boundary Conditions

Tetrahedral cells with boundary prism layers were used to discretize the majority of the CSTR reactor’s domain, while the inlet and outlet tubes were modeled with the structured quadrilateral grid and assigned as the laminar zones, considering the low flow rates (Table 4) at the inlet and outlet. To guarantee convergence of the solution, the residuals for the momentum and velocities were set in the order 1.0 × 10⁻⁵ and for energy 1.0 × 10⁻⁶.
The summary of the simulation assumptions and boundary conditions for the grid independence check are presented in Table 4.
Based on these boundary conditions, four types of grid design were tested before the PCO simulations. Mesh quality was accessed in terms of the acceptable values of skewness, aspect ratio, and orthogonal quality. Aside from monitoring the residuals, the average and maximum velocity at the reactor’s outlet and maximum and average pressures at the fan surface were chosen as the quantities of interest for monitoring of the solution convergence. After the divergence between the monitored quantities was deemed to be acceptable, the final model with 2,694,646 cells and 665,748 nodes was chosen for the flow field and PCO simulations.
The near-wall modeling significantly impacts the fidelity of numerical solutions. It is in the near-wall regions that the solution variables have large gradients. Therefore, accurate representation of the flow in the near-wall regions determines successful predictions of wall-bounded turbulent flows. To assure the fidelity of flow field simulation in the boundary layer, the center of the computational cells closest to the wall surface should be at a non-dimensional distance (Wall Unit) of Y+ < 1. Aiming at the non-dimensional distance of Y+ < 1, the first cell height can be calculated in the following steps.
First, the Reynolds number should be calculated based on the characteristic scale of the model.
R e = ρ U L μ
where ρ and µ are fluid density and viscosity, U is the free stream velocity, and L is the characteristic length (for example, body length). Then, the first cell height is derived from the following expression for Y+:
Y + = U τ Y ν
where Y is the first cell height, ν is the kinematic viscosity, and Uτ is the friction velocity. As explained above, to answer the question about the proper height of the first row of the grid cells in direct contact with the photocatalytic surface, it is necessary to know the free stream velocity above the Petri dish. However, these data are difficult to estimate prior to the simulations, considering the flow pattern complexity inside the reactor. That is the reason why no boundary layer modeling using inflation layers was applied above the photocatalytic surface. Meanwhile, for the rest of the domain, the mesh here was tetrahedral with the boundaries of five boundary prism layers at the reactor’s walls. After the values of the free stream velocity will be available, the mesh refinement at the sub-viscous layer above the Petri dish will be performed, if deemed necessary, to ensure that the first node is not located outside the boundary layer region.
The impeller was modeled implicitly as a Fan Boundary Condition, without modeling its physical equivalent. The fan model is a lumped parameter model that can be used to determine the impact of a fan with known characteristics upon some larger flow fields. This boundary type allows inputting an empirical fan curve that governs the relationship between the head (pressure rise) and flow rate (velocity) across a fan element. Although the fan model does not provide an accurate description of the detailed flow through the fan blades, it predicts the amount of flow through the fan [36], being an alternative to more computationally expensive MRF (Moving Reference Frame) or sliding mesh.

3.5.4. Modeling and Simulation of NOx Transport

By solving conservation equations for chemical species, ANSYS Fluent predicts the local mass fraction of each species, Yi, through the solution of a convection–diffusion equation. This conservation equation takes the following general form [39]:
t ( ρ Y i ) + ( ρ ν Y I   ) = J i + R i + S i
where Ri is the net rate of production/depletion of species by chemical reaction, and Si is the rate of creation by addition from the dispersed phase plus any user-defined sources.
When a chemical reaction of the photocatalytic surface degradation is not modeled explicitly, i.e., with the reaction net rate Ri, it can be modeled with a user-defined rate of creation/destruction of species (contaminant sink term)-Si (kg/m3s), which represents the kinetic model of the air pollutant oxidation. Si is equal to the expression in the Equation (10), but with the negative sign representing the degradation of pollutant, as shown in the Equation (11):
S i = r L H = k K p . C p . 1 + K p . C p .
To model the surface reaction, the sink term should be applied to the first cell layer of the fluid zone adjacent to the photocatalyst, while for all other cells in the domain, the source term is set to zero. Then, the source/sink term, in the form of a User-Defined Function (UDF), is then linked to the appropriate flow zone, which detains the photocatalytic surface.

4. Conclusions

In the scope of this study, the modeling and simulation of the air purification process by the heterogeneous photooxidation of NOx using porous carbon-modified TiO2 has been accomplished. The best conversion values were achieved at nearly 200 ppb and were 60.4% and 62.0% using T300_GO and T300_CNT, respectively. T300_CNT showed higher photocatalytic activity than the commercial P25 (61.4%). Thus, CNT was found to be a more efficient TiO2 carbon modifier than GO for PCO reactions.
Based on the experimental data, the reaction rates for different concentrations of NOx and two photocatalytic carbon–TiO2 materials were calculated by applying the L-H model, demonstrating a linear relationship with the initial NOx concentrations. Assuming NOx convection and diffusion in the cylindrical stirred reactor, the kinetic parameters—Langmuir adsorption constant and reaction rate constants—were determined. However, the kinetic parameters calculated from the experimental data were inadequate for the correct prediction of the NOx concentration at the outlet, which may be ascribed to a non-uniform concentration distribution due to the particular geometry of the reactor.
After applying the CFD tuning procedure, two new sets of the kinetic parameters were determined for T300_GO and T300_CNT, respectively. To validate the prediction accuracy, the kinetic simulations of NOx were repeated with the optimized parameters, achieving a high degree of consistency (less than 3.4% of difference) with the experimentally obtained conversion.

Supplementary Materials

The following are available online at https://0-www-mdpi-com.brum.beds.ac.uk/2073-4344/10/12/1366/s1, Figure S1: Photocatalytic degradation of NOx during 30 min under solar light on P25 (blue), T300_GO (orange) and T300_CNT (gray). Figure S2: NOx degradation reaction scheme. (adapted from Dalton et al., Environmental Pollution, 2002, 120, 415–422.), Figure S3: Emission spectrum of Osram Ultra-Vitalux, 300 W (adapted from https://www.osram.com/), Table S1: Degradation of NO and NO2 in 10 min at a concentration around 200 ppb.

Author Contributions

Conceptualization, T.Z., N.M., M.A.O.L., M.P.S. and P.F.; Data curation, T.Z., M.R.F.S., C.F.D.S., M.A.O.L., D.M.T. and P.F.; Formal analysis, T.Z., N.M., M.R.F.S., C.F.D.S. and P.F.; Funding acquisition, N.M., M.P.S. and P.F.; Investigation, M.R.F.S., C.F.D.S., M.A.O.L., D.M.T. and P.F.; Methodology, T.Z., N.M., M.R.F.S., C.F.D.S., M.A.O.L., D.M.T. and P.F.; Project administration, T.Z., N.M., M.P.S. and P.F.; Resources, T.Z., N.M., M.P.S. and P.F.; Software, T.Z.; Supervision, N.M., M.P.S. and P.F.; Validation, T.Z.; Visualization, T.Z. and M.A.O.L.; Writing—original draft, T.Z., M.R.F.S., C.F.D.S., M.A.O.L. and P.F.; Writing—review and editing, T.Z., N.M., M.A.O.L., D.M.T., D.C., M.P.S. and P.F. All authors have read and agreed to the published version of the manuscript.

Funding

The present study was developed in the scope of the Smart Green Homes Project [POCI-01-0247-FEDER-007678], a co-promotion between Bosch Termotecnologia S.A. and the University of Aveiro. It is financed by Portugal 2020 under the COMPETE Program, and by the European Regional Development Fund. This work was developed within the scope of the project CICECO–Aveiro Institute of Materials, UIDB/50011/2020 & UIDP/50011/2020, financed by national funds through the FCT/MEC.

Acknowledgments

Authors are grateful for the funding in the scope of the Smart Green Homes Project [POCI-01-0247-FEDER-007678], a co-promotion between Bosch Termotecnologia S.A. and the University of Aveiro. D.M. Tobaldi is grateful to Portuguese national funds (OE), through FCT, I.P., in the scope of the framework contract foreseen in the numbers 4, 5 and 6 of the article 23, of the Decree-Law 57/2016, of August 29, changed by Law 57/2017, of July 19. P. Ferreira thanks to FCT for the IF/00300/2015.

Conflicts of Interest

The authors declare no conflict of interest.

References

  1. Wainman, T.; Weschler, C.J.; Lioy, P.J.; Zhang, J. Effects of Surface Type and Relative Humidity on the Production and Concentration of Nitrous Acid in a Model Indoor Environment. Environ. Sci. Technol. 2001, 35, 2200–2206. [Google Scholar] [CrossRef] [PubMed]
  2. European Environment Agency. Air Quality in Europe—2019 Report; European Environment Agency: Copenhagen, Denmark, 2019; ISBN 978-92-9480-088-6.
  3. WHO. WHO Guidelines for Indoor Air Quality: Selected Pollutants; WHO: Geneva, Switzerland, 2010; p. 454. [Google Scholar]
  4. Salonen, H.; Salthammer, T.; Morawska, L. Human exposure to NO2 in school and office indoor environments. Environ. Int. 2019, 130, 104887. [Google Scholar] [CrossRef] [PubMed]
  5. Sterling, T.D.; Dimich, H.; Kobayashi, D. Indoor Byproduct Levels of Tobacco Smoke: A Critical Review of the Literature. J. Air Pollut. Control Assoc. 1982, 32, 250–259. [Google Scholar] [CrossRef] [Green Version]
  6. Ângelo, J.; Andrade, L.; Madeira, L.M.; Mendes, A. An overview of photocatalysis phenomena applied to NOx abatement. J. Environ. Manag. 2013, 129, 522–539. [Google Scholar] [CrossRef] [PubMed]
  7. Lasek, J.; Yu, Y.-H.; Wu, J.C.S. Removal of NOx by photocatalytic processes. J. Photochem. Photobiol. C Photochem. Rev. 2013, 14, 29–52. [Google Scholar] [CrossRef]
  8. Bianchi, C.L.; Pirola, C.; Galli, F.; Cerrato, G.; Morandi, S.; Capucci, V. Pigmentary TiO2: A challenge for its use as photocatalyst in NOx air purification. Chem. Eng. J. 2015, 261, 76–82. [Google Scholar] [CrossRef]
  9. Bianchi, C.L.; Pirola, C.; Galli, F.; Vitali, S.; Minguzzi, A.; Stucchi, M.; Manenti, F.; Capucci, V. NOx degradation in a continuous large-scale reactor using full-size industrial photocatalytic tiles. Catal. Sci. Technol. 2016, 6, 2261–2267. [Google Scholar] [CrossRef] [Green Version]
  10. Devahasdin, S.; Fan, C.; Li, K.; Chen, D.H. TiO2 photocatalytic oxidation of nitric oxide: Transient behavior and reaction kinetics. J. Photochem. Photobiol. A Chem. 2003, 156, 161–170. [Google Scholar] [CrossRef]
  11. Tobaldi, D.M.; Tucci, A.; Škapin, A.S.; Esposito, L. Effects of SiO2 addition on TiO2 crystal structure and photocatalytic activity. J. Eur. Ceram. Soc. 2010, 30, 2481–2490. [Google Scholar] [CrossRef]
  12. Giampiccolo, A.; Tobaldi, D.M.; Leonardi, S.G.; Murdoch, B.J.; Seabra, M.P.; Ansell, M.P.; Neri, G.; Ball, R.J. Sol gel graphene/TiO2 nanoparticles for the photocatalytic-assisted sensing and abatement of NO2. Appl. Catal. B Environ. 2019, 243, 183–194. [Google Scholar] [CrossRef]
  13. Rozman, N.; Tobaldi, D.M.; Cvelbar, U.; Puliyalil, H.; Labrincha, J.A.; Legat, A.; Škapin, A.S. Hydrothermal synthesis of rare-earth modified titania: Influence on phase composition, optical properties, and photocatalytic activity. Materials 2019, 12, 713. [Google Scholar] [CrossRef] [Green Version]
  14. Silva, M.R.F.; Lourenço, M.A.O.; Tobaldi, D.M.; da Silva, C.F.; Seabra, M.P.; Ferreira, P. Carbon-modified titanium oxide materials for photocatalytic water and air decontamination. Chem. Eng. J. 2020, 387, 124099. [Google Scholar] [CrossRef]
  15. Lin, Y.-M.; Tseng, Y.-H.; Huang, J.-H.; Chao, C.C.; Chen, C.-C.; Wang, I. Photocatalytic Activity for Degradation of Nitrogen Oxides over Visible Light Responsive Titania-Based Photocatalysts. Environ. Sci. Technol. 2006, 40, 1616–1621. [Google Scholar] [CrossRef] [PubMed]
  16. Saeli, M.; Tobaldi, D.M.; Rozman, N.; Škapin, A.S.; Labrincha, J.A.; Pullar, R.C. Photocatalytic nano-composite architectural lime mortar for degradation of urban pollutants under solar and visible (interior) light. Constr. Build. Mater. 2017, 152, 206–213. [Google Scholar] [CrossRef]
  17. Chen, X.; Burda, C. The Electronic Origin of the Visible-Light Absorption Properties of C-, N- and S-Doped TiO2 Nanomaterials. J. Am. Chem. Soc. 2008, 130, 5018–5019. [Google Scholar] [CrossRef] [PubMed]
  18. Hashimoto, K.; Wasada, K.; Osaki, M.; Shono, E.; Adachi, K.; Toukai, N.; Kominami, H.; Kera, Y. Photocatalytic oxidation of nitrogen oxide over titania–zeolite composite catalyst to remove nitrogen oxides in the atmosphere. Appl. Catal. B Environ. 2001, 30, 429–436. [Google Scholar] [CrossRef]
  19. Ballari, M.M.; Hunger, M.; Hüsken, G.; Brouwers, H.J.H. NOx photocatalytic degradation employing concrete pavement containing titanium dioxide. Appl. Catal. B Environ. 2010, 95, 245–254. [Google Scholar] [CrossRef]
  20. Hunger, M.; Hüsken, G.; Brouwers, H.J.H. Photocatalytic degradation of air pollutants—From modeling to large scale application. Cem. Concr. Res. 2010, 40, 313–320. [Google Scholar] [CrossRef]
  21. Yu, Q.L.; Ballari, M.M.; Brouwers, H.J.H. Indoor air purification using heterogeneous photocatalytic oxidation. Part II: Kinetic study. Appl. Catal. B Environ. 2010, 99, 58–65. [Google Scholar] [CrossRef]
  22. Muñoz, V.; Casado, C.; Suárez, S.; Sánchez, B.; Marugán, J. Photocatalytic NOx removal: Rigorous kinetic modelling and ISO standard reactor simulation. Catal. Today 2019, 326, 82–93. [Google Scholar] [CrossRef]
  23. Boyjoo, Y.; Sun, H.; Liu, J.; Pareek, V.K.; Wang, S. A review on photocatalysis for air treatment: From catalyst development to reactor design. Chem. Eng. J. 2017, 310, 537–559. [Google Scholar] [CrossRef]
  24. Mohseni, M.; Taghipour, F. Experimental and CFD analysis of photocatalytic gas phase vinyl chloride (VC) oxidation. Chem. Eng. Sci. 2004, 59, 1601–1609. [Google Scholar] [CrossRef]
  25. Denny, F.; Scott, J.; Pareek, V.; Peng, G.D.; Amal, R. CFD modelling for a TiO2-coated glass-bead photoreactor irradiated by optical fibres: Photocatalytic degradation of oxalic acid. Chem. Eng. Sci. 2009, 64, 1695–1706. [Google Scholar] [CrossRef]
  26. Queffeulou, A.; Geron, L.; Schaer, E. Prediction of photocatalytic air purifier apparatus performances with a CFD approach using experimentally determined kinetic parameters. Chem. Eng. Sci. 2010, 65, 5067–5074. [Google Scholar] [CrossRef]
  27. Chong, S.; Wang, S.; Tadé, M.; Ang, H.M.; Pareek, V. Simulations of photodegradation of toluene and formaldehyde in a monolith reactor using computational fluid dynamics. AIChE J. 2011, 57, 724–734. [Google Scholar] [CrossRef]
  28. Passalía, C.; Alfano, O.M.; Brandi, R.J. Optimal Design of a Corrugated-Wall Photocatalytic Reactor Using Efficiencies in Series and Computational Fluid Dynamics (CFD) Modeling. Ind. Eng. Chem. Res. 2013, 52, 6916–6922. [Google Scholar] [CrossRef]
  29. de OB Lira, J.; Padoin, N.; Vilar, V.J.P.; Soares, C. Photocatalytic NOx abatement: Mathematical modeling, CFD validation and reactor analysis. J. Hazard. Mater. 2019, 372, 145–153. [Google Scholar] [CrossRef]
  30. Verbruggen, S.W.; Lenaerts, S.; Denys, S. Analytic versus CFD approach for kinetic modeling of gas phase photocatalysis. Chem. Eng. J. 2015, 262, 1–8. [Google Scholar] [CrossRef]
  31. Einaga, H.; Tokura, J.; Teraoka, Y.; Ito, K. Kinetic analysis of TiO2-catalyzed heterogeneous photocatalytic oxidation of ethylene using computational fluid dynamics. Chem. Eng. J. 2015, 263, 325–335. [Google Scholar] [CrossRef]
  32. Nakahara, K.; Muttakin, M.; Yamamoto, K.; Ito, K. Computational fluid dynamics modelling of the visible light photocatalytic oxidation process of toluene for indoor building materials with locally doped titanium dioxide. Indoor Built Environ. 2019, 1420326X19854499. [Google Scholar] [CrossRef]
  33. Roegiers, J.; van Walsem, J.; Denys, S. CFD- and radiation field modeling of a gas phase photocatalytic multi-tube reactor. Chem. Eng. J. 2017. [Google Scholar] [CrossRef]
  34. Nakahara, K.; Yamaguchi, T.; Lim, E.; Ito, K. Computational fluid dynamics modeling and parameterization of the visible light photocatalytic oxidation process of toluene for indoor building material. Sustain. Cities Soc. 2017, 35, 298–308. [Google Scholar] [CrossRef]
  35. Franses, E.I. Thermodynamics with Chemical Engineering Applications; Cambridge University Press: Cambridge, UK, 2014. [Google Scholar]
  36. Ranade, V.V. Computational Flow Modeling for Chemical Reactor Engineering; Elsevier Science Publishing Co Inc.: San Diego, CA, USA, 2002. [Google Scholar]
  37. Ollis, D.F. Kinetics of Photocatalyzed Reactions: Five Lessons Learned. Front. Chem. 2018, 6. [Google Scholar] [CrossRef] [PubMed] [Green Version]
  38. Kecili, R.; Hussain, C.M. Chapter 4—Mechanism of Adsorption on Nanomaterials. In Nanomaterials in Chromatography; Hussain, C.M., Ed.; Elsevier: Amsterdam, The Netherlands, 2018; pp. 89–115. [Google Scholar] [CrossRef]
  39. ANSYS. ANSYS Fluent Theory Guide 19.0; ANSYS, Inc.: Canonsburg, PA, USA, 2018; Volume Version19.0. [Google Scholar]
  40. Launder, B.E.; Spalding, D.B. The numerical computation of turbulent flows. Comput. Methods Appl. Mech. Eng. 1974, 3, 269–289. [Google Scholar] [CrossRef]
  41. ANSYS. ANSYS Fluent User’s Guide 19.0; ANSYS, Inc.: Canonsburg, PA, USA, 2018; Volume Version19.0. [Google Scholar]
Figure 1. Velocity distribution along the length of the reactor.
Catalysts 10 01366 g001
Figure 2. Reciprocal plot of reaction rate and respective concentration of T300_GO (dashed line) and T300_CNT (solid line).
Catalysts 10 01366 g002
Figure 3. Workflow of the interpolated solution.
Catalysts 10 01366 g003
Figure 4. NOx concentration distribution (T300_GO /107 ppb).
Catalysts 10 01366 g004
Figure 5. Experimental and predicted conversion yield of NOx for T300_GO and T300_CNT.
Catalysts 10 01366 g005
Figure 6. Experimental and predicted with the modified Langmuir–Hinshelwood (L-H) model parameters NOx conversion yield.
Catalysts 10 01366 g006
Figure 7. NOx concentration distribution T300_GO/107 ppb (optimized L-H model parameters).
Catalysts 10 01366 g007
Figure 8. Experimental layout.
Catalysts 10 01366 g008
Figure 9. Photocatalytic reactor layout.
Catalysts 10 01366 g009
Table 1. Set up conditions and the conversion yield of NOx.
MaterialCin
(ppb)
Cout
(ppb)
Conversion
(%)
T300_GO1074458.9
1927660.4
42517558.8
60825358.4
78735355.2
T300_CNT1084558.3
1957462.1
42016760.2
61825359.1
80533059.0
P251977661.4
Table 2. Experimentally estimated kinetic parameters k’ and Kp.
Materialsk(kg/m2s)Kp.(m3/kg)
T300_GO4.02 × 1081.05 × 105
T300_CNT4.92 × 1088.75 × 104
Table 3. Computational fluid dynamics (CFD) estimated kinetic parameters k’ and Kp.
Materialsk(kg/m2s)Kp.(m3/kg)
T300_GO7.25 × 10−81.89 × 10⁵
T300_CNT9.04 × 10−81.61 × 10⁵
Table 4. Summary of the simulation assumptions and boundary conditions.
Turbulence ModelK-ε Model, Realizable, Standard Wall Function
SchemeConvection term: Second-Order Upwind
Inlet BoundaryD = 0.004 m; Ti = 1 wt. %;
Mass Flow Rate (MFR) = 2.06208 × 10⁻⁵ (kg/s)
Outlet BoundaryOutlet boundary D = 0.004 m; MFR = 2.06208 × 10⁻⁵ (kg/s)
Fan Boundary Conditionlump parameter model/polynomial pressure jump across the fan
FluidA mixture of NOx and pure synthetic air
Publisher’s Note: MDPI stays neutral with regard to jurisdictional claims in published maps and institutional affiliations.

