Article

SO2 Poisoning and Recovery of Copper-Based Activated Carbon Catalysts for Selective Catalytic Reduction of NO with NH3 at Low Temperature

Faculty of Energy and Fuels, AGH University of Science and Technology, Al. Mickiewicza 30, 30-059 Kraków, Poland
*
Authors to whom correspondence should be addressed.
Submission received: 31 October 2020 / Revised: 28 November 2020 / Accepted: 3 December 2020 / Published: 5 December 2020
(This article belongs to the Special Issue Catalysts in Environmental and Climate Protection)

Abstract

:
A series of materials based on activated carbon (AC) with copper deposited in various amounts were prepared using an incipient wetness impregnation method and tested as catalysts for selective catalytic reduction of nitrogen oxides with ammonia. The samples were poisoned with SO2 and regenerated in order to analyze their susceptibility to deactivation by the harmful component of exhaust gas. NO conversion over the fresh catalyst doped with 10 wt.% of Cu reached 81% of NO conversion at 140 °C and about 90% in the temperature range of 260–300 °C. The rate of poisoning with SO2 was dependent on Cu loading, but in general, it lowered NO conversion due to the formation of (NH4)2SO4 deposits that blocked the active sites of the catalysts. After regeneration, the catalytic activity of the materials was restored and NO conversion exceeded 70% for all of the samples.

1. Introduction

Selective catalytic reduction (SCR) of nitrogen oxides with ammonia (NH3-SCR) is one of the most efficient methods of the abatement of NOx emitted by stationary sources. Since the 1970s, the most common commercial catalyst for the technology has been V2O5-TiO2 promoted by MoO3 or WO3 [1,2]. Despite high catalytic activity above 350 °C, the material has some considerable limitations, such as very narrow temperature window, toxicity of vanadium and high catalytic activity in oxidation of SO2 to SO3, causing the emission of a secondary contamination [3,4,5,6]. Additionally, the catalyst can oxidize NH3 to N2O which is one of the greenhouse gases [7]. Therefore, there is an urgent need for the novel catalyst to be made of environmentally friendly components and exhibit sufficient activity in the low temperature range (around 250 °C or lower) to place it downstream of the desulphurization unit and electrostatic precipitator [8,9].
Another harmful pollutant emitted to the atmosphere as the result of fuel burning is sulphur dioxide (SO2) [2,10,11]. This gas has a detrimental effect on human health and quality of the environment. What is important is that its presence in the exhausts can cause corrosion as well [12,13]. In the industrial applications of NH3-SCR, the catalyst can be easily deactivated by sulphur compounds formed in the combustion chamber due to their presence in fuel [14]. Thus, it lowers the activity of DeNOx catalysts [3,5,11,15]. In the scientific literature, several poisoning mechanisms by SO2 have been reported [16]. Du et al. [3] postulated that the main reason for the deactivation was the formation of ammonium sulphates that plug pores of the catalyst in the temperature range of 200–300 °C. On the other hand, Xu et al. [11] suggested that SO2 adsorbs on the active sites of SCR catalysts and forms metal sulphates that interrupt the redox cycle of NO reduction. The poisoning effect occurs mainly in the low temperature range (below 300 °C) of SCR. It is particularly important for the industrial installations, due to the fact that SO2 oxidation over V2O5-TiO2 increases linearly with the amount of NOx in the combustion zone. As a result, the sulphur trioxide produced can react with the steam and form corrosive sulphuric acid at an increased temperature [5]. Due to the presented interaction of SO2 with the surface of the commercial SCR catalyst and the formation of by-products during the process below 300 °C, there is a high demand for the novel catalyst that would be active and resistant to poisoning in the low temperature range of the reaction.
Many catalysts including modified layered clays [6,17,18], hydrotalcites [10,19] or zeolite-supported metal oxides [20,21] exhibited high catalytic activity in the abatement of NO emission using the SCR method. The special attention of many researchers has been recently directed to the application of modified activated carbon (AC) as NH3-SCR catalysts [22,23,24,25]. This is mainly due to its high specific surface area, well-developed system of pores, and hydrothermal durability [26,27]. The positive influence of activated carbon used as a catalyst support for the simultaneous removal of both NOx and SO2 was confirmed by many researchers [28,29]. Liu et al. [29] tested the catalytic activity of activated carbon modified with aluminum, copper, iron, zinc or manganese in NOx and SOx removal. Among the analyzed materials, Cu supported on microwave-activated coconut shell AC occurred to be the most efficient in simultaneous removal of the considered contaminations. The catalytic tests indicated that at 175 °C (low-temperature SCR) NO and SO2 conversion reached 52.5% and 68.3%, respectively. Additionally, many researchers reported that the amount of SO2 adsorbed on the surface of activated carbon is related to the initial modification of the surface of the support and its pore structure [30,31,32,33]. It was proved that after some specific treatment the materials are resistant to SO2 in the gas stream. Samojeden and Grzybek [13] deposited nitrogen groups on the surface of activated carbon and analyzed SO2 sorption capacity of the resulting materials. The modification of the activated carbon facilitated adsorption of sulphur oxide without the degradation of the structural features of the samples.
According to the above considerations and based on recent knowledge, we have decided to prepare a series of activated carbon-based catalysts loaded with various contents of copper and test the fresh materials in low-temperature NH3-SCR reaction. Additionally, keeping in mind that the industrial exhausts always contain some amounts of other contaminations, such as SO2, the samples obtained were poisoned with sulphur oxide and subjected to the catalytic tests under the same conditions. Furthermore, after exposure to SO2, the catalysts were regenerated using thermal treatment and the NH3-SCR reaction over these materials was repeated.

2. Results and Discussion

2.1. X-ray Diffraction Analysis

X-ray diffraction (XRD) patterns of the fresh, poisoned and regenerated samples are presented in Figure 1. It can be noticed that for the samples 5U and 5U1Cu, there are diffraction maxima described by Miller’s indices (002), and (100) and located at ~25° and 43°, respectively. The maxima reflect the graphite crystallite structure [01-075-1621] and confirm the disordered nature of activated carbon [30]. Additionally, there are no reflections related to copper or copper oxide on the surface of the sample. Thus, it can be concluded that 1 wt.% of Cu loading is not sufficient to form crystallites of metal oxides. Similar results was obtained by Tseng and Wey [34] who did not observe any XRD reflections for copper content lower than 3% as such very small crystals could not be detected by XRD. On the other hand, after introduction of 5 wt.% of copper, the characteristic maxima of CuO [00-045-0937] at ~35.2° and 38.5° appear in the pattern. These maxima arise from (111) and (022) planes, respectively. It suggests the formation of copper oxide particles due to a higher amount of Cu on the catalyst surface [35,36,37]. Therefore, increasing Cu concentration to 5 wt.% results in the formation of a bulk copper oxide phase. Additionally, for the samples poisoned with SO2, intensity of reflections ascribed to copper species significantly decreased. After thermal regeneration, some of them were recovered which suggests that SO2 could cause reversed reconstruction of the active phase. While the copper loading was increased to 10 wt.%, new reflections assigned to highly crystalline copper oxide phase appeared. The additional diffraction maxima at ca. 48.7° and 67.9 ° attributed to CuO and 29.5°, 36.5°, 43.5°, 62.0°, 65.7° and 74.5° assigned to Cu2O [01-077-0199] confirm the formation of higher amount of crystalline copper oxide [35,38]. The maxima are described by Miller’s indices (202), (113), (110), (111), (200), (220), (310) and (311), respectively. Also, new reflections assignable to face centre cubic crystal structure of copper [01-070-3039] which were observed at 2θ ca. 43.7° and 50.4° are described by Miller’s indices (111) and (200), respectively. After poisoning with SO2, the shape of XRD patterns of 5U10Cu did not change noticeably. Nonetheless, the intensity of diffraction lines of CuO and Cu2O significantly decreased. However, no reflections assigned to the surface metal sulphates were detected. This suggests that their amount could be below the detection limit of the apparatus. Additionally, the sizes of the copper oxide crystals decreased upon poisoning. Similar results were obtained by Liu et al. [38] who observed that the intensity of the copper crystals decreased after poisoning, and according to Ma et al. [39], after poisoning more copper sulphates and a side product such as copper sulphide (CuS) were formed in place of copper oxide which was a poorly ordered material and had a lower crystallinity than CuO [40]. The average crystal sizes for the crystallites of CuO and Cu2O deposited on the selected samples, estimated using Scherrer’s equation, are presented in Table 1.
The lateral size (La) and stacking height (Lc) parameters were calculated using the Scherrer equations and are listed in Table 2 [41]:
L c = K c λ B ( 002 ) cos θ
L a = K a λ B ( 100 ) cos θ
For calculation of La and Lc, we applied the Scherrer constant Kc equal to 0.9 for the (002) diffraction line and Ka equal to 1.77 for the (100) diffraction line, where λ (0.15 nm) is the wavelength of the X-ray used; β002 and β100 are full widths at half maximum of the diffraction lines (002) and (100). The changes in La and Lc are very small and not meaningful. The positions of the XRD reflections of the support shift with poisoning, which, according to Jenkins and Snyder [42], may be the result of microstrain. The effect will generally be a distribution of reflections around the unstressed peak location, and a crude broadening of the peak in the resultant pattern.

2.2. Fourier Transform Infrared Spectroscopy

Fourier transform infrared (FT-IR) spectra of the fresh, poisoned, and regenerated catalysts are presented in Figure 2. In the spectra of non-poisoned samples, the characteristic peaks at 1120, 1560, 1715 and 3430 cm−1 can be distinguished [43,44]. The peak at 1120 cm−1 corresponds to C–N or N–H bonds in aliphatic groups, while the peaks at 1560 cm−1 and 1715 cm−1 can be assigned to the stretching vibration of carboxylic anions [45]. The peak at at 3430 cm−1 confirms the complexation of –OH groups on the AC surface [46,47,48]. Therefore, the samples doped with copper exhibit hydrophilic properties. FT-IR did not detect any peaks related to copper. However, literature suggests that the absorption peaks in the infrared spectrum of Cu(OH)2 at low frequencies below 700 cm−1 are due to Cu–O vibrations, a i.e., peaks at 505 cm−1, 592 cm−1 associated with the Cu–O vibrations of monoclinic CuO [49], while bands centered at 3572 cm−1, 3315 cm−1 correspond to the hydroxyl ions [50], and 1121 cm−1, 1360 cm−1 related to Cu–OH vibration of the orthorhombic phase of Cu(OH)2 [49]. In this work, it is difficult to identify bands derived from copper oxides/hydroxides, due to much strongest signals arising from the support i.e., C–N or N–H bonds at 1120 cm−1 in all tested samples (even in unpromoted sample). Another possibility is the vibration of Cu–O was not registered due to its low intensity [51].
Poisoning with SO2 resulted in the appearance of new peaks at 1040, 1165, 1300 and 1400cm−1. The band at 1040 cm−1 can be assigned to the presence of SO42− ions, while the one at 1165 or 1300 cm−1 are attributed to the vibrations of S–O and S=O bonds, respectively [42,43,52,53]. The peak at 1400 cm−1 can be assigned to SO32− species present on the poisoned samples [44,54]. It indicates that recovery of the poisoned catalyst at elevated temperature can partly restore the groups initially present on the surface of activated carbon. Moreover, regeneration of the materials resulted in the disappearance of most of the peaks assigned to sulphur species, suggesting that the applied route of recovery was appropriately chosen.

2.3. Thermogravimetric Analysis

Thermogravimetric analysis over modified activated carbon was carried out in order to examine thermal behavior of the catalysts in the temperature range of 20–800 °C (cf. Table 3). The results obtained are presented in Figure 3. Weight loss of each material during every stage of the analysis is listed in Table 3. In case of all of the samples, three main stages of decomposition can be distinguished. For 5U, the temperature ranges of decomposition are as it follows: 20–80 °C, 80–460 °C, and 460–800 °C. During the first stage total moisture was evaporated from the surface of AC and during the second stage, the weight loss of the materials increased only slightly. However, above 460 °C the materials lost significant amount of their initial weight during combustion of activated carbon [43]. At the end of the experiment, the weight loss of the fresh, poisoned and regenerated sample was 33.35%, 57.60%, and 51.44%, respectively. Hence, it can be noticed that poisoning of activated carbon with SO2 decreased its thermal stability. Additionally, regeneration procedure did not restore it to the initial level.
Similar to 5U, thermal stability results obtained for the samples modified with copper can also be divided into three stages. In the temperature range of 20–80 °C total moisture was evaporated from the surface of the samples. It can be observed that the addition of copper shifted the temperature range of the second stage to lower values, from 460 °C (for 5U) to 380 °C. Nevertheless, during that stage only negligible weight loss was detected. Above 380 °C, a third stage of decomposition was initiated due to rapid combustion of activated carbon and desorption of carbonic complexes from its surface. Additionally, the mass loss of the samples was higher in comparison to 5U and it gradually increased with the increasing amount of the Cu introduced in the case of fresh, poisoned and regenerated samples.
It can be observed that the Cu-doped samples poisoned with SO2 exhibited considerably higher and more rapid decomposition during thermogravimetric analysis (TGA) in comparison to the fresh materials. Additionally, for the poisoned Cu-containing materials, the decomposition is finished at approximately 570 °C. The extensive weight loss is the result of carbon burning and vaporization of the adsorbed sulphur oxide from the support and thermal decomposition of copper sulphates. The mechanism observed during TGA is in agreement with the generally accepted sequence of CuSO4 decomposition, described by Equation (3) [55]:
CuO   · CuSO 4     2 CuO +   SO 3
There is another possible decomposition reaction according to Van and Habashi [56]. CuO·CuSO4 can decompose in an inert atmosphere to CuO, SO2 and O2. Due to the presence of O2, SO2 could be oxidised. C is a reducer and thus could reduce SO3 back to SO2, accelerating the carbon loss over 380 °C. From the point of view of the catalysts tested in the SCR reaction, in the temperature range where the reaction is carried out and where activated carbon could be possibly applied, the modified ACs shows no significant weight loss.
Regeneration of the samples modified with copper resulted in the partial recovery of thermal stability. However, the thermal stability is still lower than that of the fresh materials. Nevertheless, the applied regeneration method successively removed sulphate species from the catalyst’s surface and the susceptibility to thermal decomposition might be attributed to the presence of traces of sulphur confirmed by the energy-dispersive X-ray spectroscopy (EDX) analysis presented in Table 4.

2.4. Scanning Electron Microscopy (SEM) and EDX Analysis

2.4.1. SEM Analysis

Scanning electron microscopy (SEM) and EDX analysis were performed in order to observe the changes of the surface morphology and amounts of surface elements of the samples before and after poisoning with SO2. As illustrated in Figure 4a, the surface of the support (5U) before modification with Cu is smooth and uniform. Relating to Figure 4 and Figure 5, it can be noticed that introduction of copper resulted in visible changes in the surface morphology, such as the formation of more porous texture of the catalysts Larger aggregates appeared on the surface of carbon with higher loading of copper 5U10Cu at a magnification of 20,000 times, as shown in Figure 5.
The porosity of the materials might be the result of decomposition of metal nitrates and emission of NOx, N2 and O2 upon the calcination procedure performed during active phase deposition.

2.4.2. Energy-Dispersive X-ray Spectroscopy (EDX) Analysis

The approximate elemental analysis of the fresh, poisoned and regenerated catalysts is listed in Table 4. All of the obtained outcomes of the analysis are in agreement with findings reported in the literature, for example by Khan et al. [57] or Kooti and Matouri [58]. In EDX spectra (not included in the paper), the presence of carbon, nitrogen and oxygen were confirmed by the presence of peaks around 0.27 keV, 0.4 keV, 0.5 keV, respectively. Additionally, a peak characteristic of silicon can be observed in the spectra at 1.5 keV. Doping with copper resulted in the appearance of new peaks located at binding energies of 0.85, 0.94, 8.04 and 8.94 keV which correspond to CuL1, CuLa, CuKa and CuKb, respectively. The lower amount of Si impurities (ash) were detected.
After poisoning with SO2, new peaks of sulphur SKa and SKb appeared at the binding energies of 2.37 and 2.57 keV, respectively. Additionally, according to the EDX results presented in Table 4., deposition of sulphur on the catalyst surface was observed to be inversely proportional to the content of copper.
The increase of the copper loading resulted in lower S deposition on the catalyst surface. Thus, the results confirmed that modification with copper provided a noticeable enhancement in SO2 tolerance of the catalysts.
Regeneration resulted in the release of a small amount of sulphur. Nevertheless, some sulphate aggregates did not decompose, even at the applied regeneration temperature of 300 °C.

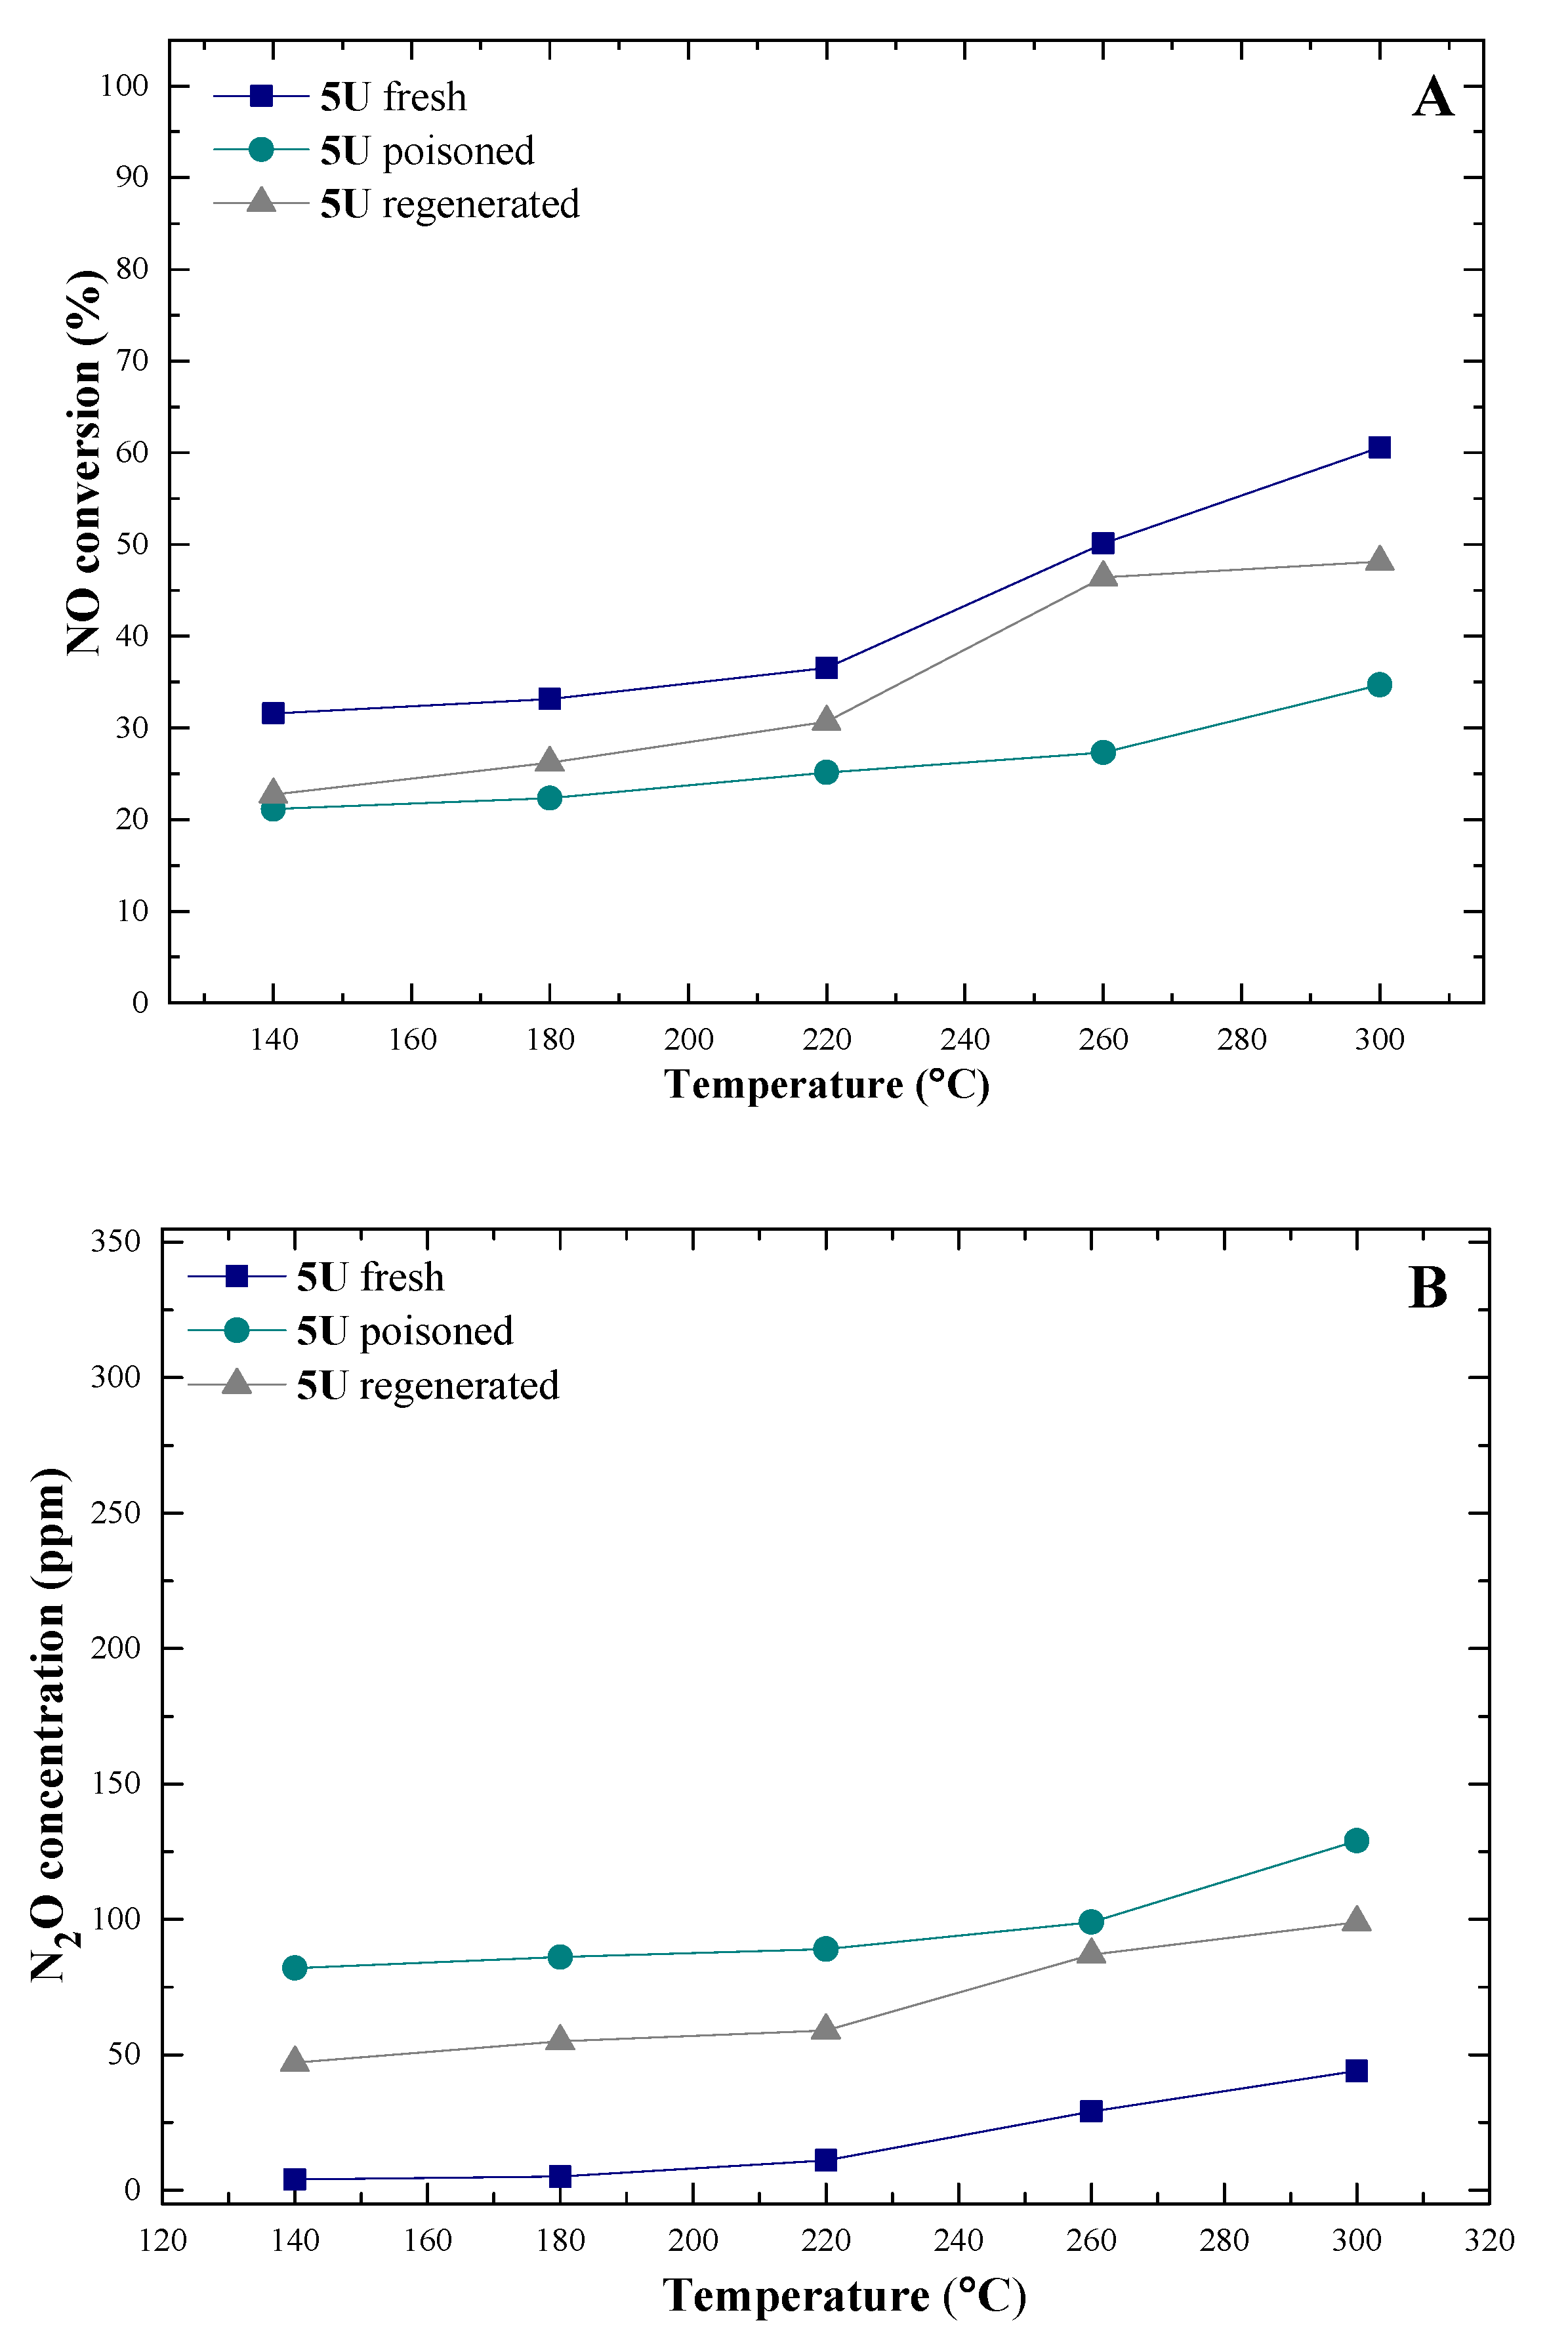
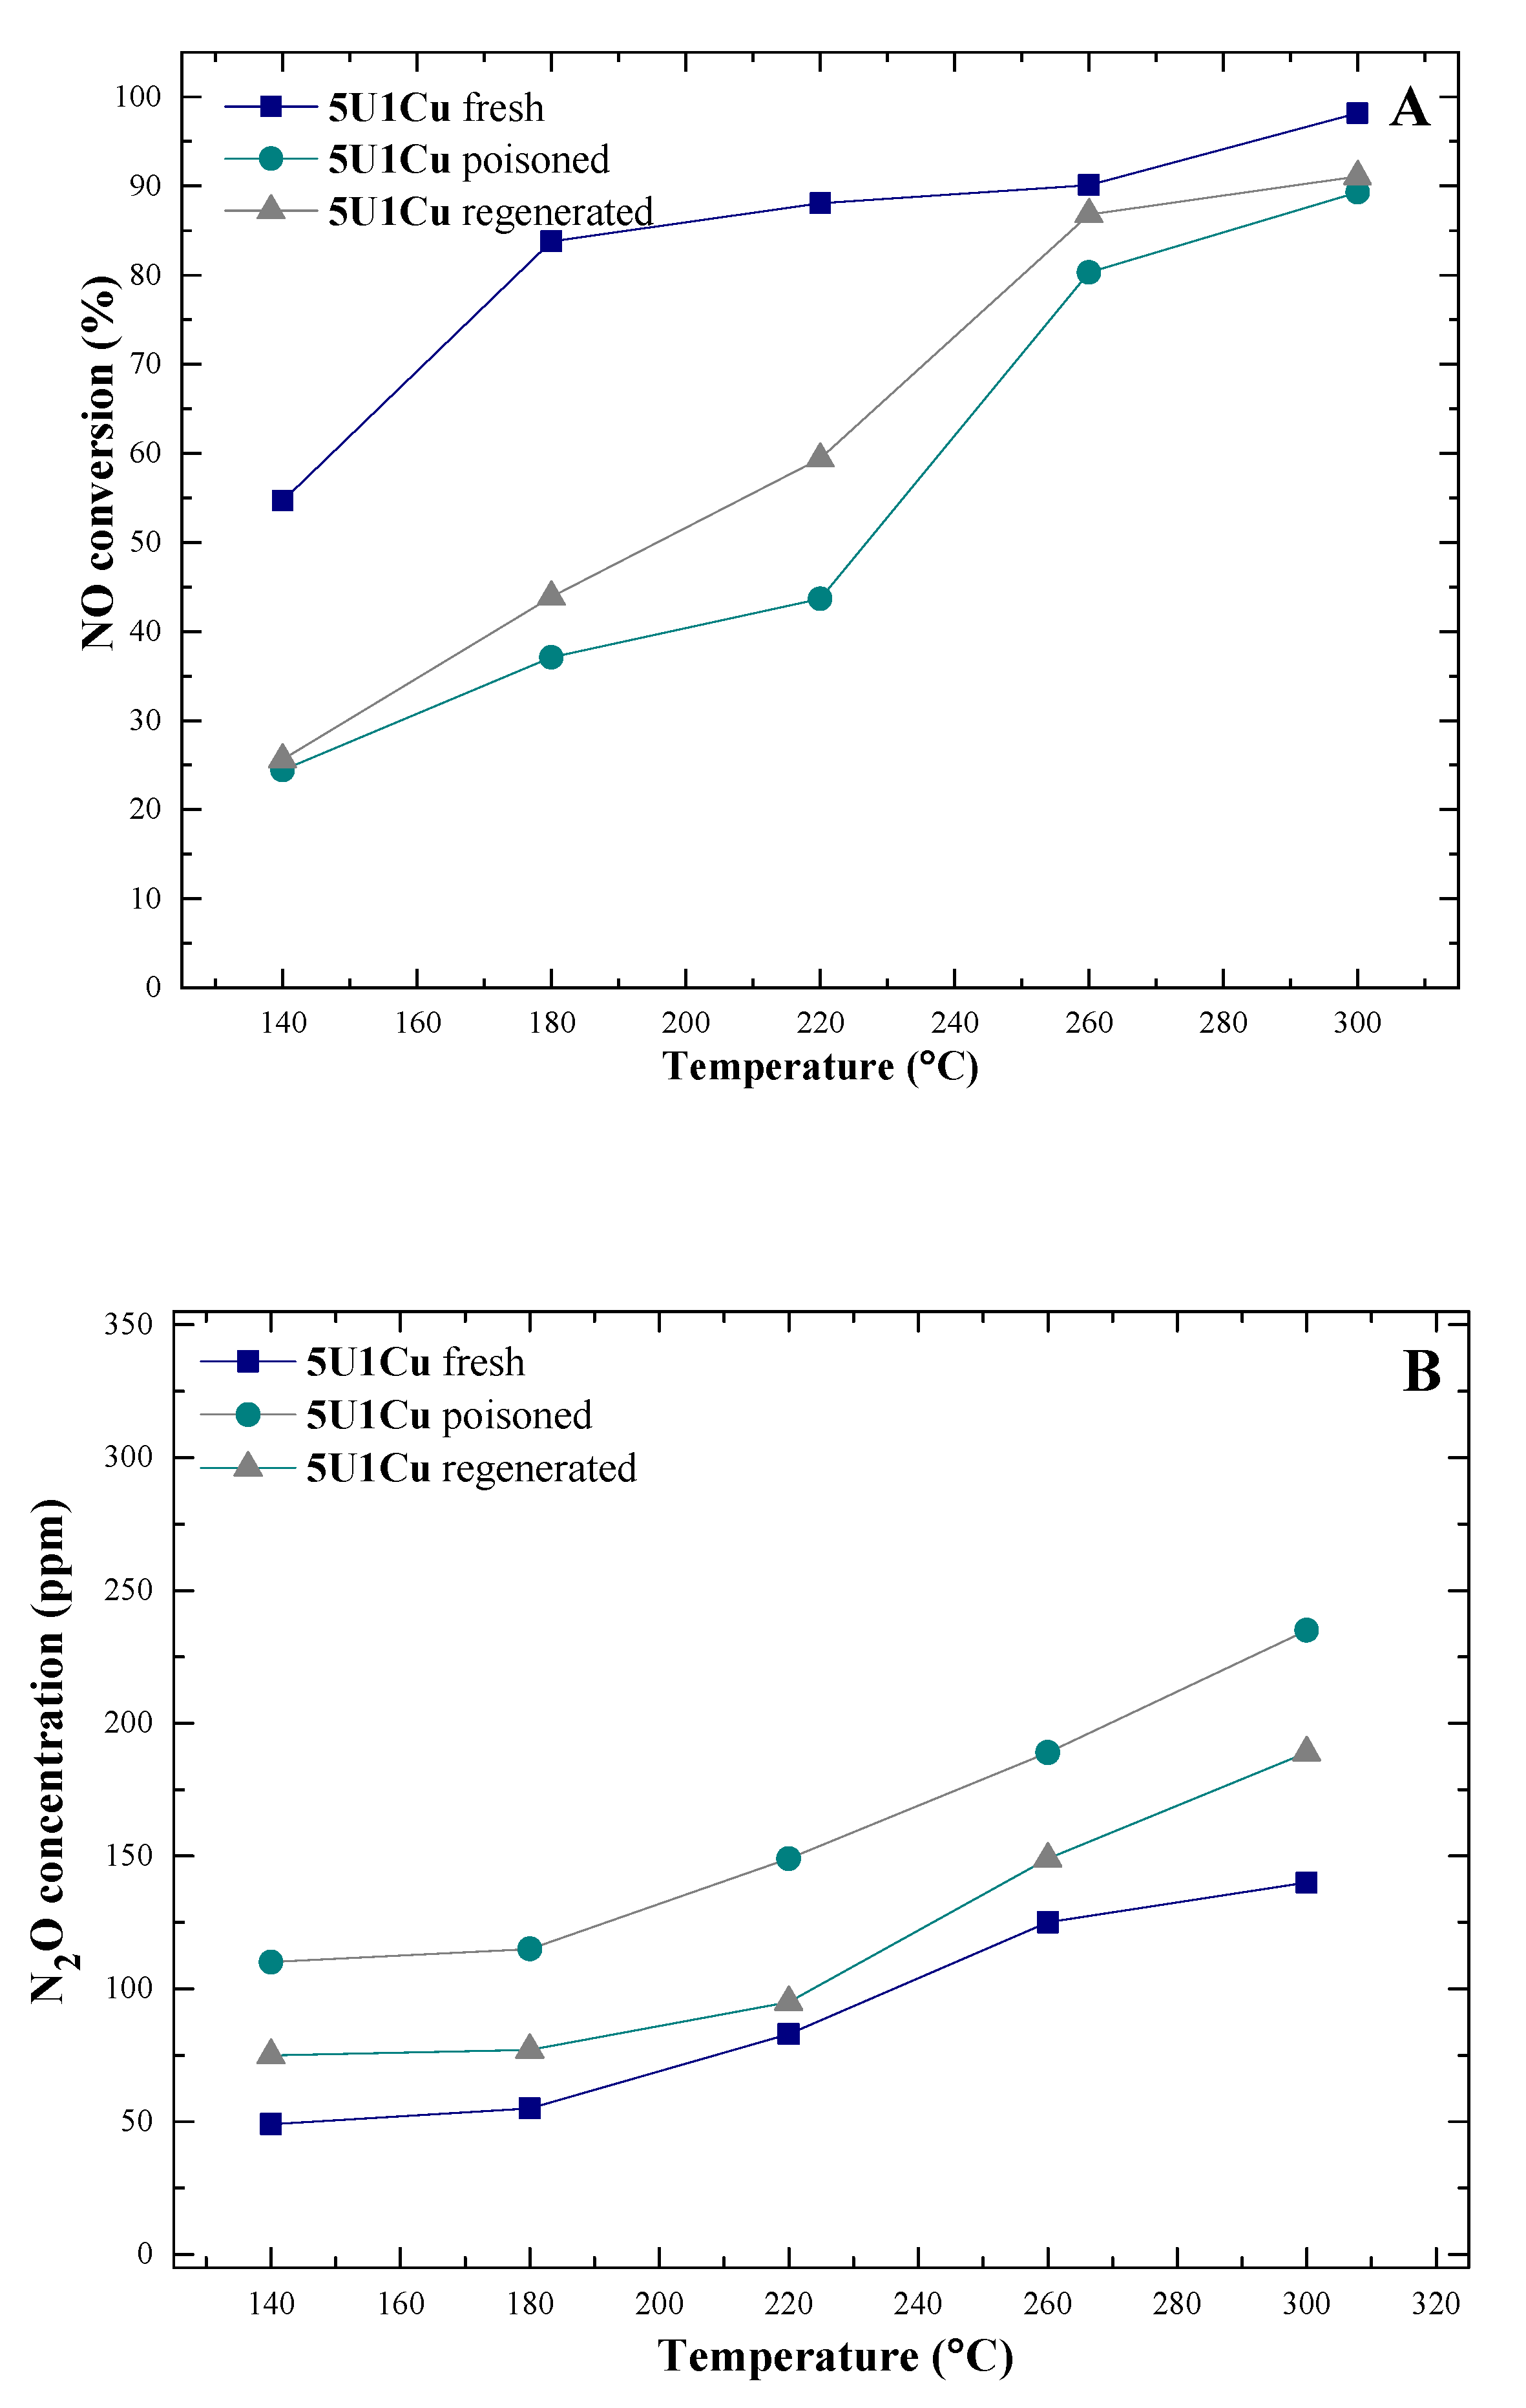
2.5. Catalytic Tests

The catalytic activity of the fresh, poisoned and regenerated catalysts was studied applying the temperature range of 140–300 °C, which stands for the low temperature range of NH3-SCR. The results of NH3-SCR catalytic tests are presented in Figure 6, Figure 7, Figure 8, Figure 9 and Figure 10.
It can be noted that in the case of all of the tested materials, increasing the reaction temperature accelerates NO conversion. Even for AC not modified with copper, the catalytic activity was very high, since the material exhibited 50% of NO conversion at about 140 °C. Thus, the sample can be a promising catalyst for a low-temperature SCR process. All of the copper-doped samples exhibited satisfactory NO conversion and the sequence of catalytic activity for the considered fresh materials at 220 °C was as follows: 5U10Cu > 5U5Cu > 5U1Cu > 5U. Hence, it increased with the content of Cu introduced. Therefore, the results indicate that copper loading plays an important role in the improvement of NO conversion during SCR. Since concentration of N2O was below 100 ppm for fresh 5U, it appears that non-doped support is the most selective among all of the considered materials. Therefore, the major product of the SCR process over 5U is predicted to be N2 produced according to the reaction described by Equation (4):
4 NO + 4 NH 3   +   O 2 4 N 2 +   6 H 2 O
On the other hand, the increased concentration of N2O in the exhausts for copper-doped samples might be the result of non-selective reactions of SCR, such as ammonia oxidation in the temperature range of 260–300 °C [6,59].
After poisoning with SO2, the catalytic activity decreased considerably in the case of all of the catalysts in comparison to the fresh samples. It can be noted, that for 5U about 50% of the initial activity was lost upon poisoning. As shown in Figure 9, NO conversion for that sample displayed a continuous decline to 21% at 140 °C and 31% at 300 °C. This is probably related to the formation of sulphate species on the external surface of the catalyst [11,13]. According to the studies carried out by Yu et al. [60], sulphate species improve ammonia adsorption due to their acidic nature. Furthermore, when sulphates react with ammonia on the catalyst surface, ammonium sulphate salts, such as NH4HSO4 or (NH4)2S2O7 are formed under the conditions of the SCR process. The salts are believed to have a significant influence on the lower catalytic activity in NO conversion, since they plug the pores of the catalyst [16]. All of the materials doped with copper exhibited higher resistance to poisoning with SO2. For 5U1Cu the conversion of NO declined from 89% to 45% at 220 °C, while for 5U10Cu at the same temperature it dropped from 100% to 97%. Thus, it should be emphasized that the addition of copper not only activates the catalyst in NO conversion, but it also enhances the resistance to SO2 poisoning.
As already mentioned, the main two reasons of deactivation of Cu-doped catalysts used for SCR is the formation of copper and ammonium sulphates [10,14]. The effect of the formation of those compounds can be explained by the difference of desorption temperature between ammonia (150–400 °C) and sulphur oxide (>400 °C). Due to the fact that (NH4)2SO4 decomposes at 150–400 °C, SO42− moieties can easily interact with metallic sites freed after NH3 desorption and form metal sulphates and sulphites [5]. Jangjou et al. [61] postulated that ammonium and copper sulphates are interchangeable, depending on the availability of ammonia in the gas phase. Similar indications were found in the experiments in the following work due to the change of copper sulphates formed during poisoning into ammonium sulphates upon NH3 exposure during SCR tests according to Equation (5):
CuSO 4 + 3 NH 3 ( g ) ( NH 4 ) 2 SO 4 + 1 2 N 2 + 1 2 H 2 + Cu
Furthermore, after poisoning N2O concentration in the exhausts increased. It indicates that some amounts of NH3 preferentially reacted with NO or O2 to form N2O in the presence of sulphur species (according to Equations (6) and (7)):
2 NH 3   +   2 O 2   N 2 O +   3 H 2 O
4 NO   +   4 NH 3   +   3 O 2   4 N 2 O +   6 H 2 O
Regeneration resulted in the recovery of the catalytic activity of all of the materials to some extent. The regenerating effect is especially visible in the temperature range of 280–300 °C for the samples doped with copper. This points to the fact that the presence of copper not only prevents excessive deactivation by SO2, but also has an impact on the restitution of the satisfactory catalytic performance.
In order to clearly display the dependency of catalytic activity and ability to regeneration, the comparison of the catalytic activity obtained at 220 °C for the fresh, poisoned and regenerated materials is presented in Figure 10.

3. Materials and Methods

3.1. Catalyst Preparation

The commercial AC was provided by Gryfskand (Hajnówka, Poland). The initial material was oxidized using 5.0 M solution of nitric acid (HNO3) (Avantor Performace Materials Poland S.A., Gliwice, Poland) at 90 °C for 2 h. Afterwards, the material was filtered, washed with distilled water to pH ~ 7.0 and dried at 110 °C overnight. Acid treatment was followed by the introduction of nitrogen groups (N-groups) by the incipient wetness impregnation with urea solution (5 wt.%). Then the material was dried at 110 °C for 24 h and thermally treated in the flow of 2.25 vol.% of O2 in He (gas flow 100 cm3 min−1) at 350 °C for 2 h. The synthesized samples of modified activated carbon were ground and sieved to obtain the fraction of 0.25–1.0 mm. The active metal was deposited on the surface of AC by incipient wetness impregnation using aqueous solutions of Cu(NO3)2 (Avantor Performace Materials Poland S.A., Gliwice, Poland). Appropriate concentrations of Cu2+ cations were used in order to introduce 1 wt.%, 5 wt.%, and 10 wt.% of the metallic phase on each sample. Finally, Cu-doped AC was dried and calcined in the stream of 2.25 vol.% of O2 in He at 250 °C for 1 h. The analyzed fresh materials are listed in Table 5.
In order to compare the catalytic performance of the fresh and contaminated modified AC doped with Cu, a set of the resulting materials was poisoned with SO2 by the exposition on the gas mixture of 1000 ppm of SO2 in helium at 180 °C for 30 min. Subsequently, the catalytic activity of the poisoned samples was tested in NH3-SCR. Afterwards, another set of the samples was poisoned by SO2, but in that case, the flow of sulphur oxide was stopped after 30 min and the materials were straightforwardly regenerated in He atmosphere by increasing the temperature in the reactor from 200 to 300 °C and keeping each catalyst in the final temperature for 1 h. The procedure of the activity tests is presented in Figure 11.

3.2. Catalysts Characterization

The structure of the catalysts was analyzed using X-ray diffraction technique. The X-ray diffraction patterns were obtained using Empyrean (Panalytical) diffractometer (Panalytical, Almelo, UK). The instrument was equipped with copper-based anode (Cu-Kα LFF HR, λ = 0.154059 nm). The diffractograms were collected in the 2θ range of 2.0–80.0° (2θ step scans of 0.02° and a counting time of 1 s per step). The average size of copper oxide crystals was calculated using Scherrer’s formula (Equation (8)) [41]:
D h k l =   K λ β h k l c o s θ
Recorded XRD data were analysed using X’pert Highscore plus (with database) (Malvern Panalytical, Malvern, UK). References codes are given in square brackets.
FT-IR was performed to examine the characteristic chemical groups present in the analyzed materials. The spectra were recorded on Perkin Elmer Frontier spectrometer in the region of 4000–400 cm−1 with a resolution of 4 cm−1. Before each measurement, the analyzed sample was mixed with KBr at the ratio of 1:100 and pressed into a disk.
The changes in weight of the catalysts in the temperature range of 20–800 °C and in the atmosphere of nitrogen (100 cm3 min−1) were analyzed using TGA. The experiment was performed using SDT Q600 V20.9 Build 20 instrument.
The morphology and chemical composition of the synthesized catalysts were examined by SEM that was carried using JEOL JSM 6360LA microscope at a magnification of 5000 and 20,000. EDS was carried out using Shimadzu 7000 diffractometer with an energy dispersive X-Ray analyzer. The elemental analysis was performed by selecting random points (micro-area) of the sample at a working distance of 10mm at 15–20 kV (beam voltage) in a vacuum chamber at spot size of 4.7 to 5.3nm (INCA conventional units). The acquisition time of the spectrums was 300 s, the beam current was 86 uA and the detector dead time was of about 30%. The elemental composition of the examined catalysts was analyzed using the ZAF method [62].

3.3. Catalytic Tests

NH3-SCR catalytic tests over all samples were performed in a fixed-bed flow microreactor under atmospheric pressure in the setup shown in Figure 12.
The reaction mixture (800 ppm of NO, 800 ppm of NH3, 3.5 vol.% of O2) was introduced to the microreactor through mass flow controllers and helium was added as a balance to maintain the total flow rate of 100 cm3 min−1. The catalytic unit downstream of the reactor was used to decompose possibly formed NO2 to NO. The concentrations of residual NO and N2O (the by-product of the reaction) were analysed downstream of the reactor by the FT-IR detector (ABB 2000 AO series). The experimental NH3-SCR process was conducted in the temperature range of 140–300 °C and NO conversion was calculated according to the formula presented on Equation (9):
N O c o n v e r s i o n   = N O i n   N O o u t N O i n
where N O i n –inlet concentration of NO, N O o u t –outlet concentration of NO.

4. Conclusions

In the study presented, the influence of SO2 on Cu-doped activated-carbon catalysts for NH3-SCR process was investigated. The experiments performed showed that even the samples poisoned with sulphur oxide exhibit satisfactory catalytic performance in low-temperature selective catalytic reduction of NO. The results of XRD indicated that poisoning with SO2 did not influence significantly the structural properties of the support. However, after contamination the crystallinity of the active phase deposited on AC considerably decreased. FT-IR spectra generated for the samples confirmed the presence of characteristic groups in activated carbon and the groups attributed to the modification of the support. Poisoning resulted in the appearance of the peaks of sulphur species. After regeneration, the peaks disappeared, suggesting that thermal treatment was an appropriate method to restore structural properties of the materials. Based on TGA results, it can be concluded that the presence of Cu decreased thermal stability of the catalysts. Additionally, the formation and decomposition of copper sulphates could be the reason for rapid weight loss of the samples doped with Cu in the temperature range of about 380–570 °C. Moreover, the decay of activity of the samples may have partially resulted from the burn of carbon during the treatment or tests. The lower catalytic activity of the samples could have also resulted from blocking the pores of AC and inhibiting free diffusion of the gas phase through the catalyst’s channels. The increased formation of N2O after poisoning of SO2 was probably caused by the formation of bulk copper oxide species and their aggregation that is confirmed to favour NH3 oxidation to nitrous oxide. Thus, interaction with SO2 not only decreases the catalytic activity, but also increases the tendency to form by-products. In fact, sulphate species are highly acidic and could promote the adsorption of ammonia resulting in increased NO conversion. Nevertheless, the experiments confirmed that, probably, in the low temperature NH3-SCR the formation of ammonium or metal sulphates has lower activation energy than the reaction between NH3 adsorbed on sulphate species and gas-phase NO. Regeneration by thermal treatment allowed the initial catalytic activity of the analyzed materials to be recovered to satisfactory level and its efficiency increased linearly with the increasing loading of copper.

Author Contributions

The experimental work was designed and supported by B.S., M.M., M.S. prepared the catalysts; performed the catalytic experiments, characterization of catalysts, and analysis of data, writing—original draft preparation; A.B. supported the catalytic experiments and characterization of catalysts; review, supervision; A.S., writing—review and editing; B.S., review, supervision; M.M., supervision. All authors have read and agreed to the published version of the manuscript.

Funding

This work was funded by Grant AGH 16.16.210.476.

Conflicts of Interest

The authors declare no conflict of interest.

References

  1. Samojeden, B.; Grzybek, T. The influence of the promotion of N-modified activated carbon with iron on NO removal by NH3-SCR (Selective catalytic reduction). Energy 2016, 116, 1484–1491. [Google Scholar] [CrossRef]
  2. Xu, Z.; Li, Y.; Guo, J.; Xiong, J.; Lin, Y.; Zhu, T. An efficient and sulfur resistant K-modified activated carbon for SCR denitrification compared with acid- and Cu-modified activated carbon. Chem. Eng. J. 2020, 395, 125047. [Google Scholar] [CrossRef]
  3. Du, X.; Xue, J.; Wang, X.; Chen, Y.; Ran, J.; Zhang, L. Oxidation of Sulfur Dioxide over V2O5/TiO2 Catalyst with Low Vanadium Loading: A Theoretical Study. J. Phys. Chem. C 2018, 122, 4517–4523. [Google Scholar] [CrossRef]
  4. Gonçalves, A.A.S.; Ciesielczyk, F.; Samojeden, B.; Jaroniec, M. Toward development of single-atom ceramic catalysts for selective catalytic reduction of NO with NH3. J. Hazard. Mater. 2021, 401, 123413. [Google Scholar] [CrossRef]
  5. Szymaszek, A.; Samojeden, B.; Motak, M. The Deactivation of Industrial SCR Catalysts—A Short Review. Energies 2020, 13, 3870. [Google Scholar] [CrossRef]
  6. Szymaszek, A.; Kubeł, M.; Samojeden, B.; Motak, M. Modified bentonite-derived materials as catalysts for selective catalytic reduction of nitrogen oxides. Chem. Eng. Process. 2020, 41, 13–24. [Google Scholar]
  7. Zhu, M.; Lai, J.K.; Wachs, I.E. Formation of N2O greenhouse gas during SCR of NO with NH3 by supported vanadium oxide catalysts. Appl. Catal. B Environ. 2018, 224, 836–840. [Google Scholar] [CrossRef]
  8. Samojeden, B.; Grzybek, T.; Kowal, J.; Szymaszek, A.; Jabłońska, M.; Gläser, R.; Motak, M. The influence of holmium on catalytic properties of Fe or Cu-modified vermiculites. Physicochem. Probl. Miner. Process. 2019, 55, 1484–1495. [Google Scholar]
  9. Motak, M.; Kuterasiński, Ł.; Da Costa, P.; Samojeden, B. Catalytic activity of layered aluminosilicates for VOC oxidation in the presence of NOx. Comptes Rendus Chim. 2015, 18, 1106–1113. [Google Scholar] [CrossRef]
  10. Szymaszek, A.; Motak, M.; Samojeden, B. The application of modified layered double hydroxides in selective catalytic reduction of nitrogen oxides by ammonia (NH3-SCR). Polish J. Chem. Technol. 2020, 22, 61–67. [Google Scholar] [CrossRef] [Green Version]
  11. Xu, L.; Wang, C.; Chang, H.; Wu, Q.; Zhang, T.; Li, J. New Insight into SO2 Poisoning and Regeneration of CeO2-WO3/TiO2 and V2O5-WO3/TiO2 Catalysts for Low-Temperature NH3-SCR. Environ. Sci. Technol. 2018, 52, 7064–7071. [Google Scholar] [CrossRef] [PubMed]
  12. Huang, J.-T. SO2 emission and government spending on environmental protection in china. J. Clean. Prod. 2018, 175, 431–441. [Google Scholar] [CrossRef]
  13. Samojeden, B.; Grzybek, T. The influence of nitrogen groups introduced onto activated carbons by high- or low-temperature NH3treatment on SO2 sorption capacity. Adsorpt. Sci. Technol. 2017, 35, 572–581. [Google Scholar] [CrossRef] [Green Version]
  14. Erust, C.; Akcil, A.; Bedelova, Z.; Anarbekov, K.; Baikonurova, A.; Tuncuk, A. Recovery of vanadium from spent catalysts of sulfuric acid plant by using inorganic and organic acids: Laboratory and semi-pilot tests. Waste Manag. 2016, 49, 455–461. [Google Scholar] [CrossRef] [PubMed]
  15. Zhu, L.; Zhong, Z.; Xue, J.; Xu, Y.; Wang, C.; Wang, L. NH3-SCR performance and the resistance to SO2 for Nb doped vanadium based catalyst at low temperatures. J. Environ. Sci. 2017, 65, 206–216. [Google Scholar] [CrossRef]
  16. Ma, Z.; Wu, X.; Feng, Y.; Si, Z.; Weng, D.; Shi, L. Low-temperature SCR activity and SO2 deactivation mechanism of Ce-modified V2O5-WO3/TiO2 catalyst. Prog. Nat. Sci. Mater. Int. 2015, 25, 342–352. [Google Scholar] [CrossRef] [Green Version]
  17. Komadel, P. Acid activated clays: Materials in continuous demand. Appl. Clay Sci. 2016, 131, 84–99. [Google Scholar] [CrossRef]
  18. Kowalczyk, A.; Święs, A.; Gil, B.; Rutkowska, M.; Piwowarska, Z.; Borcuch, A.; Michalik, M.; Chmielarz, L. Effective catalysts for the low-temperature NH3-SCR process based on MCM-41 modified with copper by template ion-exchange (TIE) method. Appl. Catal. B Environ. 2018, 237, 927–937. [Google Scholar] [CrossRef]
  19. Basąg, S.; Piwowarska, Z.; Kowalczyk, A.; Węgrzyn, A.; Baran, R.; Gil, B.; Michalik, M.; Chmielarz, L. Cu-Mg-Al hydrotalcite-like materials as precursors of effective catalysts for selective oxidation of ammonia to dinitrogen — The influence of Mg/Al ratio and calcination temperature. Appl. Clay Sci. 2016, 129, 122–130. [Google Scholar] [CrossRef]
  20. Xin, Y.; Li, Q.; Zhang, Z. Zeolitic Materials for DeNOx Selective Catalytic Reduction. ChemCatChem 2018, 10, 29–41. [Google Scholar] [CrossRef]
  21. Rutkowska, M.; Díaz, U.; Palomares, A.E.; Chmielarz, L. Cu and Fe modified derivatives of 2D MWW-type zeolites (MCM-22, ITQ-2 and MCM-36) as new catalysts for DeNOx process. Appl. Catal. B Environ. 2015, 168–169, 531–539. [Google Scholar] [CrossRef]
  22. Halepoto, A.; Kashif, M.; Su, Y.; Cheng, J.; Deng, W.; Zhao, B. Preparations and Characterization on Fe Based Catalyst Supported on Coconut Shell Activated Carbon CS(AC) and SCR of NOx-HC. Catal. Surv. from Asia 2020, 24, 123–133. [Google Scholar] [CrossRef]
  23. Barrabas, S.B.; Baini, R.; Sutan, N.M.; Yakub, I.; Anwar, K.; Zauzi, N.S.A.; Wahab, N.A.; Sulaiman, H. HC-SCR: NOx Reduction using Mn and Cu Catalysts Impregnated in Coconut and Palm Kernel Shell Activated Carbon. MATEC Web Conf. 2017, 87, 03004. [Google Scholar] [CrossRef] [Green Version]
  24. Li, S.; Wang, X.; Tan, S.; Shi, Y.; Li, W. CrO3 supported on sargassum-based activated carbon as low temperature catalysts for the selective catalytic reduction of NO with NH3. Fuel 2017, 191, 511–517. [Google Scholar] [CrossRef]
  25. Saad, M.; Białas, A.; Grzywacz, P.; Czosnek, C.; Samojeden, B.; Motak, M. Selective catalytic reduction of NO with ammonia at low temperature over Cu-promoted and N-modified activated carbon. Chem. Process Eng. 2020, 41, 59–67. [Google Scholar]
  26. Grzybek, T.; Klinik, J.; Samojeden, B.; Suprun, V.; Papp, H. Nitrogen-promoted active carbons as DeNOx catalysts. 1. The influence of modification parameters on the structure and catalytic properties. Catal. Today 2008, 137, 228–234. [Google Scholar] [CrossRef]
  27. Ziemiański, P.; Kałahurska, K.; Samojeden, B. Selective catalytic reduction of NO with NH3 on mixed alumina–iron (III) oxide pillared montmorillonite “Cheto” Arizona, modified with hexamminecobalt (III) chloride. Adsorpt. Sci. Technol. 2017, 35, 825–833. [Google Scholar] [CrossRef]
  28. Silas, K.; Ghani, W.A.W.A.K.; Choong, T.S.Y.; Rashid, U. Carbonaceous materials modified catalysts for simultaneous SO2/NOx removal from flue gas: A review. Catal. Rev.-Sci. Eng. 2019, 61, 134–161. [Google Scholar] [CrossRef]
  29. Liu, Y.; Ning, P.; Li, K.; Tang, L.; Hao, J.; Song, X.; Zhang, G.; Wang, C. Simultaneous removal of NOx and SO2 by low-temperature selective catalytic reduction over modified activated carbon catalysts. Russ. J. Phys. Chem. A 2017, 91, 490–499. [Google Scholar] [CrossRef]
  30. Klinik, J.; Samojeden, B.; Grzybek, T.; Suprun, W.; Papp, H.; Gläser, R. Nitrogen promoted activated carbons as DeNOx catalysts. 2. the influence of water on the catalytic performance. Catal. Today 2011, 176, 303–308. [Google Scholar] [CrossRef]
  31. Guo, Y.; Li, Y.; Zhu, T.; Ye, M. Investigation of SO2 and NO adsorption species on activated carbon and the mechanism of NO promotion effect on SO2. Fuel 2015, 143, 536–542. [Google Scholar] [CrossRef]
  32. Shao, J.; Zhang, J.; Zhang, X.; Feng, Y.; Zhang, H.; Zhang, S.; Chen, H. Enhance SO2 adsorption performance of biochar modified by CO2 activation and amine impregnation. Fuel 2018, 224, 138–146. [Google Scholar] [CrossRef]
  33. Che, Y.; Zhou, J.; Wang, Z. Plasma modification of activated carbon fibers for adsorption of so 2. Plasma Sci. Technol. 2013, 15, 1047–1052. [Google Scholar] [CrossRef]
  34. Tseng, H.H.; Wey, M.Y. Study of SO2 adsorption and thermal regeneration over activated carbon-supported copper oxide catalysts. Carbon N. Y. 2004, 42, 2269–2278. [Google Scholar] [CrossRef]
  35. Suresh, S.; Karthikeyan, S.; Jayamoorthy, K. FTIR and multivariate analysis to study the effect of bulk and nano copper oxide on peanut plant leaves. J. Sci. Adv. Mater. Devices 2016, 1, 343–350. [Google Scholar] [CrossRef] [Green Version]
  36. Meghana, S.; Kabra, P.; Chakraborty, S.; Padmavathy, N. Understanding the pathway of antibacterial activity of copper oxide nanoparticles. RSC Adv. 2015, 5, 12293–12299. [Google Scholar] [CrossRef]
  37. Saad, M.; Białas, A.; Samojeden, B.; Motak, M. Selective catalytic reduction of NO with ammonia over functionalized activated carbon promoted with Cu. In Contemporary Problems of Power Engineering and Environmental Protection; Silesian University of Technology: Gliwice, Poland, 2017; pp. 173–182. [Google Scholar]
  38. Liu, X.; Wu, X.; Weng, D.; Si, Z.; Ran, R. Migration, reactivity, and sulfur tolerance of copper species in SAPO-34 zeolite toward NOx reduction with ammonia. RSC Adv. 2017, 7, 37787–37796. [Google Scholar] [CrossRef] [Green Version]
  39. Ma, R.; Stegemeier, J.; Levard, C.; Dale, J.G.; Noack, C.W.; Yang, T.; Brown, G.E.; Lowry, G.V. Sulfidation of copper oxide nanoparticles and properties of resulting copper sulfide. Environ. Sci. Nano 2014, 1, 347–357. [Google Scholar] [CrossRef]
  40. Wang, Y.; Li, X.; Zhan, L.; Li, C.; Qiao, W.; Ling, L. Effect of SO2 on activated carbon honeycomb supported CeO2-MnOx catalyst for NO removal at low temperature. Ind. Eng. Chem. Res. 2015, 54, 2274–2278. [Google Scholar] [CrossRef]
  41. Warren, B. X-ray diffraction; Addison-Wesley Pub. Co.: Reading, MA, USA, 1969; ISBN 9780201085242. [Google Scholar]
  42. Jenkins, R.; Snyder, R.L. Introduction to X-ray Powder Diffractometry; John Wiley & Sons, Inc.: Hoboken, NJ, USA, 1996. [Google Scholar]
  43. Ud Din, I.; Shaharun, M.S.; Subbarao, D.; Naeem, A. Surface modification of carbon nanofibers by HNO3 treatment. Ceram. Int. 2016, 42, 966–970. [Google Scholar] [CrossRef]
  44. O’Reilly, J.M.; Mosher, R.A. Functional groups in carbon black by FTIR spectroscopy. Carbon N. Y. 1983, 21, 47–51. [Google Scholar] [CrossRef]
  45. Bandosz, T.J.; Ania, C.O. Chapter 4 Surface chemistry of activated carbons and its characterization. Interface Sci. Technol. 2006, 7, 159–229. [Google Scholar]
  46. Gorzin, F.; Ghoreyshi, A.A. Synthesis of a new low-cost activated carbon from activated sludge for the removal of Cr (VI) from aqueous solution: Equilibrium, kinetics, thermodynamics and desorption studies. Korean J. Chem. Eng. 2013, 30, 1594–1602. [Google Scholar] [CrossRef]
  47. Bashkova, S.; Bandosz, T.J. The effects of urea modification and heat treatment on the process of NO2 removal by wood-based activated carbon. J. Colloid Interface Sci. 2009, 333, 97–103. [Google Scholar] [CrossRef] [PubMed]
  48. Al-Qodah, Z.; Shawabkah, R. Production and characterization of granular activated carbon from activated sludge. Brazilian J. Chem. Eng. 2009, 26, 127–136. [Google Scholar] [CrossRef]
  49. Shinde, S.K.; Dubal, D.P.; Ghodake, G.S.; Gomez-Romero, P.; Kim, S.; Fulari, V.J. Influence of Mn incorporation on the supercapacitive properties of hybrid CuO/Cu(OH)2 electrodes. RSC Adv. 2015, 5, 30478–30484. [Google Scholar] [CrossRef] [Green Version]
  50. Zhang, Y.X.; Huang, M.; Li, F.; Wen, Z.Q. Controlled synthesis of hierarchical CuO nanostructures for electrochemical capacitor electrodes. Int. J. Electrochem. Sci. 2013, 8, 8645–8661. [Google Scholar]
  51. Stuart, B.H. Infrared Spectroscopy: Fundamentals and Applications; Ando, D.J., Ed.; Analytical Techniques in the Sciences; John Wiley & Sons, Ltd: Chichester, UK, 2004; ISBN 9780470011140. [Google Scholar]
  52. Sedlmair, C.; Seshan, K.; Jentys, A.; Lercher, J.A. Studies on the deactivation of NOx storage-reduction catalysts by sulfur dioxide. Catal. Today 2002, 75, 413–419. [Google Scholar] [CrossRef]
  53. Wang, J.; Meng, X.; Chen, J.; Yu, Y.; Miao, J.; Yu, W.; Xie, Z. Desulphurization Performance and Mechanism Study by in Situ DRIFTS of Activated Coke Modified by Oxidization. Ind. Eng. Chem. Res. 2016, 55, 3790–3796. [Google Scholar] [CrossRef]
  54. Zhu, Z.; Liu, Z.; Niu, H.; Liu, S.; Hu, T.; Liu, T.; Xie, Y. Mechanism of SO2 Promotion for NO Reduction with NH3 over Activated Carbon-Supported Vanadium Oxide Catalyst. J. Catal. 2001, 197, 6–16. [Google Scholar] [CrossRef]
  55. Uzunov, I.; Klissurski, D.; Teocharov, L. Thermal decomposition of basic copper sulphate monohydrate. J. Therm. Anal. Calorim. 1995, 44, 685–696. [Google Scholar] [CrossRef]
  56. Van, K.V.; Habashi, F. Identification and Thermal Stability of Copper(I) Sulfate. Can. J. Chem. 1972, 50, 3872–3875. [Google Scholar] [CrossRef]
  57. Khan, A.; Rashid, A.; Younas, R.; Chong, R. A chemical reduction approach to the synthesis of copper nanoparticles. Int. Nano Lett. 2016, 6, 21–26. [Google Scholar] [CrossRef] [Green Version]
  58. Kooti, M.; Matouri, L. Fabrication of nanosized cuprous oxide using fehling’s solution. Sci. Iran. 2010, 17, 73–78. [Google Scholar]
  59. Szymaszek, A.; Samojeden, B.; Motak, M. Selective catalytic reduction of NOx with ammonia (NH3-SCR) over transition metal-based catalysts—Influence of the catalysts support. Physicochem. Probl. Miner. Process. 2019, 55, 1429–1441. [Google Scholar]
  60. Yu, Y.; Wang, J.; Chen, J.; Meng, X.; Chen, Y.; He, C. Promotive effect of SO2 on the activity of a deactivated commercial selective catalytic reduction catalyst: An in situ DRIFT study. Ind. Eng. Chem. Res. 2014, 53, 16229–16234. [Google Scholar] [CrossRef]
  61. Jangjou, Y.; Wang, D.; Kumar, A.; Li, J.; Epling, W.S. SO2 Poisoning of the NH3-SCR Reaction over Cu-SAPO-34: Effect of Ammonium Sulfate versus Other S-Containing Species. ACS Catal. 2016, 6, 6612–6622. [Google Scholar] [CrossRef]
  62. Boekestein, A.; Stadhouders, A.M.; Stols, A.L.H.; Roomans, G.M. A comparison of ZAF-correction methods in quantitative X-ray microanalysis of light-element specimens. Ultramicroscopy 1983, 12, 65–68. [Google Scholar] [CrossRef]
Figure 1. X-ray diffraction patterns of fresh, poisoned and regenerated: (A) 5U; (B) 5U1Cu; (C) 5U5Cu; (D) 5U10Cu.
Catalysts 10 01426 g001aCatalysts 10 01426 g001b
Figure 2. Fourier transform infrared spectra of fresh, poisoned and regenerated: (A) 5U; (B) 5U1Cu; (C) 5U5Cu; (D) 5U10Cu.
Catalysts 10 01426 g002aCatalysts 10 01426 g002b
Figure 3. Results of thermogravimetric analysis obtained for fresh, poisoned, and regenerated: (A) 5U; (B) 5U1Cu; (C) 5U5Cu; (D) 5U10Cu.
Catalysts 10 01426 g003aCatalysts 10 01426 g003b
Figure 4. Pictures of scanning electron microscopy (SEM) for samples: (a) fresh 5U; (b) poisoned 5U; (c) regenerated 5U; (d) fresh 5U1Cu; (e) poisoned 5U1Cu; (f) regenerated 5U1Cu; (g) fresh 5U5Cu; (h) poisoned 5U5Cu; (i) regenerated 5U5Cu; (k) fresh 5U10Cu; (l) poisoned 5U10Cu; (m) regenerated 5U10Cu.
Catalysts 10 01426 g004
Figure 5. SEM pictures of fresh 5U10Cu at 20,000 times magnification.
Catalysts 10 01426 g005
Figure 6. Results of catalytic tests carried out over fresh, poisoned, and regenerated 5U: (A) NO conversion; (B) N2O concentration.
Catalysts 10 01426 g006
Figure 7. Results of catalytic tests carried out over fresh, poisoned, and regenerated 5U1Cu: (A) NO conversion; (B) N2O concentration.
Catalysts 10 01426 g007
Figure 8. Results of catalytic tests carried out over fresh, poisoned, and regenerated 5U5Cu: (A) NO conversion; (B) N2O concentration.
Catalysts 10 01426 g008
Figure 9. Results of catalytic tests carried out over fresh, poisoned, and regenerated 5U10Cu: (A) NO conversion; (B) N2O concentration.
Catalysts 10 01426 g009
Figure 10. Comparison of the catalytic activity of 5U, 5U1Cu, 5U5Cu, 5U10Cu at 220 °C.
Catalysts 10 01426 g010
Figure 11. Experimental procedure of the catalytic tests over fresh, poisoned, and regenerated catalysts.
Catalysts 10 01426 g011
Figure 12. Catalytic setup.
Catalysts 10 01426 g012
Table 1. Sizes of CuO and Cu2O crystals present on activated carbon (AC) surface, calculated by Scherrer’s equation.
SampleType of the SampleForm of Copper Oxide
CuOCu2O
Miller’s IndicesCrystalite Size (nm)Miller’s IndicesCrystalite Size (nm)
5U5Cufresh(111)21(200)23
poisoned1719
regenerated1920
5U10Cufresh(111)30(200)30
poisoned2427
regenerated2628
Table 2. The lateral size (La) and stacking height (Lc) parameters for selected samples.
Sample L c ( nm ) L a ( nm )
5U fresh4.5111.81
5U poisoned4.5111.80
5U regenerated4.5011.80
Table 3. Weight loss of the samples during thermogravimetric analysis (TGA) in the particular temperature range.
SampleWeight Loss in the Particular Temperature Range (%)
Samples without Cu20–80 °C80–460 °C460–800 °CTotal weight loss (%)
5U fresh12.774.5118.0735.35
5U poisoned22.476.3228.8157.60
5U regenerated18.086.8226.5451.44
Samples with Cu20–80 °C80–380 °C380–800 °CTotal weight loss (%)
5U1Cu fresh16.736.0836.3559.16
5U1Cu poisoned26.168.9058.3093.36
5U1Cu regenerated20.159.2136.5965.95
5U5Cu fresh21.505.9932.1959.68
5U5Cu poisoned29.649.2557.5896.47
5U5Cu regenerated23.396.4634.1163.96
5U10Cu fresh23.096.1934.2863.56
5U10Cu poisoned27.699.4356.7793.89
5U10Cu regenerated25.277.0733.3165.65
Table 4. Results of energy-dispersive X-ray spectroscopy (EDX) elemental analysis of the fresh, poisoned, and regenerated catalysts.
SampleApproximate Weight (%)
CuSSi
5Ufresh002.55
poisoned02.041.80
regenerated02.041.80
5U1Cufresh2.0200
poisoned2.441.530
regenerated2.130.500
5U5Cufresh5.5400
poisoned6.700.990
regenerated6.150.230
5U10Cufresh7.4900
poisoned8.560.560
regenerated7.560.130
Table 5. List of the analyzed fresh samples and their codes.
No.Sample CodeCu-Loading
15U0 wt.%
25U1Cu1 wt.%
35U5Cu5 wt.%
45U10Cu10 wt.%
Publisher’s Note: MDPI stays neutral with regard to jurisdictional claims in published maps and institutional affiliations.

