Article

SnO2-Containing Clinoptilolite as a Composite Photocatalyst for Dyes Removal from Wastewater under Solar Light

1
National Institute of Chemistry, Hajdrihova 19, SI-1001 Ljubljana, Slovenia
2
Faculty of Chemistry and Chemical Technology, University of Ljubljana, Večna pot 113, SI-1001 Ljubljana, Slovenia
3
Innovation Center of Faculty of Technology and Metallurgy, University of Belgrade, Karnegijeva 4, 11120 Belgrade, Serbia
4
University of Nova Gorica, Vipavska 13, SI-5000 Nova Gorica, Slovenia
5
Jožef Stefan Institute, Jamova 39, SI-1000 Ljubljana, Slovenia
6
Faculty of Technology and Metallurgy, University of Belgrade, Karnegijeva 4, 11120 Belgrade, Serbia
*
Author to whom correspondence should be addressed.
Submission received: 29 January 2020 / Revised: 15 February 2020 / Accepted: 16 February 2020 / Published: 19 February 2020
(This article belongs to the Special Issue Environmental Catalysis in Advanced Oxidation Processes)

Abstract

:
Due to their adsorbent, ion exchange and catalytic properties zeolites are suitable for a variety of applications. We report on the photocatalytic activity of a readily available and inexpensive natural zeolite clinoptilolite (Z) containing SnO2 (Sn-Z). The Sn-Z samples with 3–15 wt. % of Sn were prepared by using a precipitation–deposition method. Powder X-ray diffraction analysis showed that the zeolite structure was unaffected by the introduction of the Sn-phase. Diffuse reflectance UV/VIS spectra of the Sn-Z samples confirmed the presence of SnO2 and X-Ray absorption spectroscopy analyses suggested that the SnO2 particles mainly resided on the surface of the clinoptilolite, while ATR-FTIR analysis gave some clues that part of the SnO2 phase was incorporated in the pores of the zeolite. The presence of SnO2 in Sn-Z increased both adsorption capacity and photocatalytic performance which could be partially explained by higher surface area and partially with an increased negative potential of the surface. Adsorption and total degradation of methylene blue (MB) for the Sn-Z with the highest amount of Sn (15 wt.%) was about 30% and 45%, respectively, suggesting a synergetic effect between SnO2 and the clinoptilolite lattice. Reusability tests showed that these catalysts present a promising material for water purification.

1. Introduction

Dyes are widely used in the textile and food industry as well as paper and photo–electrochemical cells’ production. This brings a burden of organic dye contamination to the environment, exerting a harmful effect on humans and animals [1,2]. Therefore, various methods for their remediation have been studied, including physical, chemical, and biological methods [3]. In recent years, heterogeneous photocatalysis has attracted considerable attention as an alternative and environmentally friendly process for the degradation and discoloration of organic dyes. Generally, it can be defined as the acceleration of the production of free radicals in the presence of a photocatalyst by its excitation with visible, ultraviolet, or infrared irradiation. Metal oxide semiconductors, such as titania (TiO2), zinc oxide (ZnO), as well as tin oxide (SnO2), have been used as effective photocatalysts [4,5,6].
SnO2 has received considerable attention for fundamental research and industrial application due to its properties, such as low electrical resistance, high electrical conductivity, and high optical transparency in the visible region [7,8]. As an n-type semiconductor having a bandgap of about 3.6 eV at bulk state, SnO2 can be a good alternative photocatalyst, but its photocatalytic ability for the degradation of pollutants is directly related to the synthesis procedure (morphology, particle size, and dopant concentrations). SnO2 nanoparticles, synthesized by the microwave heating method were evaluated for the degradation of methyl violet 6B (MV6B) and methylene blue (MB) dye under direct sunlight. The synthesized SnO2 nanoparticles showed excellent dye-sensitized visible light photocatalytic activity for the degradation of both MV6B and MB [9]. In addition, it is reported that SnO2 prepared by the hydrothermal method shows the photocatalytic ability for the degradation of MB dye under UV light irradiation [10]. Recently, the photocatalytic activity of SnO2 nanotubes fabricated by template-based liquid phase deposition and calcined at different temperatures was studied. The activity was tested in the degradation of MB under UV light irradiation, produced by four 100 W Xe lamps [11]. The reported results clearly indicated that photocatalytic activity increased with increasing calcination temperature due to an increase in specific surface area as well as their increased crystallinity.
Since the high specific surface area is one of the most important treats of a good catalyst, many materials have been used as catalyst supports. Zeolites have attracted great attention due to their adsorbent, ion exchange, and catalytic properties. Increasing interest has been applied toward natural zeolites, especially to clinoptilolite since it is the most abundant natural zeolite, inexpensive, and environmentally friendly. The porous structure of clinoptilolite is characterized by two systems of channels: the first one composed of eight- and ten-membered rings formed by linkage of AlO4 and SiO4 tetrahedral units, and the second one formed by eight-membered rings. These two pore systems are interconnected within the lattice hosting the extraframework/exchangeable cations and water molecules [12]. The possibility of chemical modification of the clinoptilolite structure allows it to be a prospective candidate to be grafted and further used as a catalyst. For example, CuO incorporated into nanoparticles of clinoptilolite was tested in the photo-discoloration process of an aqueous mixture of MB and bromophenol blue by irradiation under an atmospheric condition with a medium pressure Hg lamp–75 W [13]. The results demonstrated the importance of the clinoptilolite support to enhance the reactivity of CuO particles by preventing aggregation of CuO particles and also electron-hole recombination. Similarly, it has been reported for ZnO-supported clinoptilolite in photo-discoloration of bromothymol blue (BTB) aqueous under Hg lamp irradiation [14]. The results of SnO2-containing clinoptilolite for photocatalytic usage are still scarce. However, coupling ZnO–SnO2 particles onto clinoptilolite nanoparticles was investigated in the photocatalytic degradation of an aqueous mixture of 4-methylbenzoic acid and 2-chloro-5-nitrobenzoic acid under UV irradiation [15], as well as metronidazole photodegradation irradiated by moderate pressure Hg-lamp [16]. The latter was also studied by the coupling of SnO2 and NiO and supporting them onto clinoptilolite nanoparticles [17].
Taking all this into account, the aim of this study was to investigate the photocatalytic activity of SnO2-containing clinoptilolite in the photodegradation process of MB dye as a model cationic dye. It is a representative of reactive dyes, which generally consist of a chromophoric group (azo [–N=N–], anthraquinone, phtahalocyanine, etc.), an anchor group (vinylsulfone, chlorotriazine. etc.) and a group which increases their water solubility. To date, coupling SnO2 with natural clinoptilolite has only been scarcely reported as a catalytic system [16]. Moreover, most of the studies with SnO2 as a photocatalyst were done under UV light [10,11,18,19,20]. Yet, for a commercial purpose, largely available visible light is a better choice. Consequently, in this study, photocatalytic experiments were performed by using illumination with visible-light lamps as a natural resource which reduces the cost of the process and environmental impact. We discuss the mechanism of action, SnO2 content optimization, and long term use of such composites. Finally, since natural zeolite (clinoptilolite) is an economically and environmentally friendly material, it is a promising component for the coupling with other photocatalysts as well.

2. Results

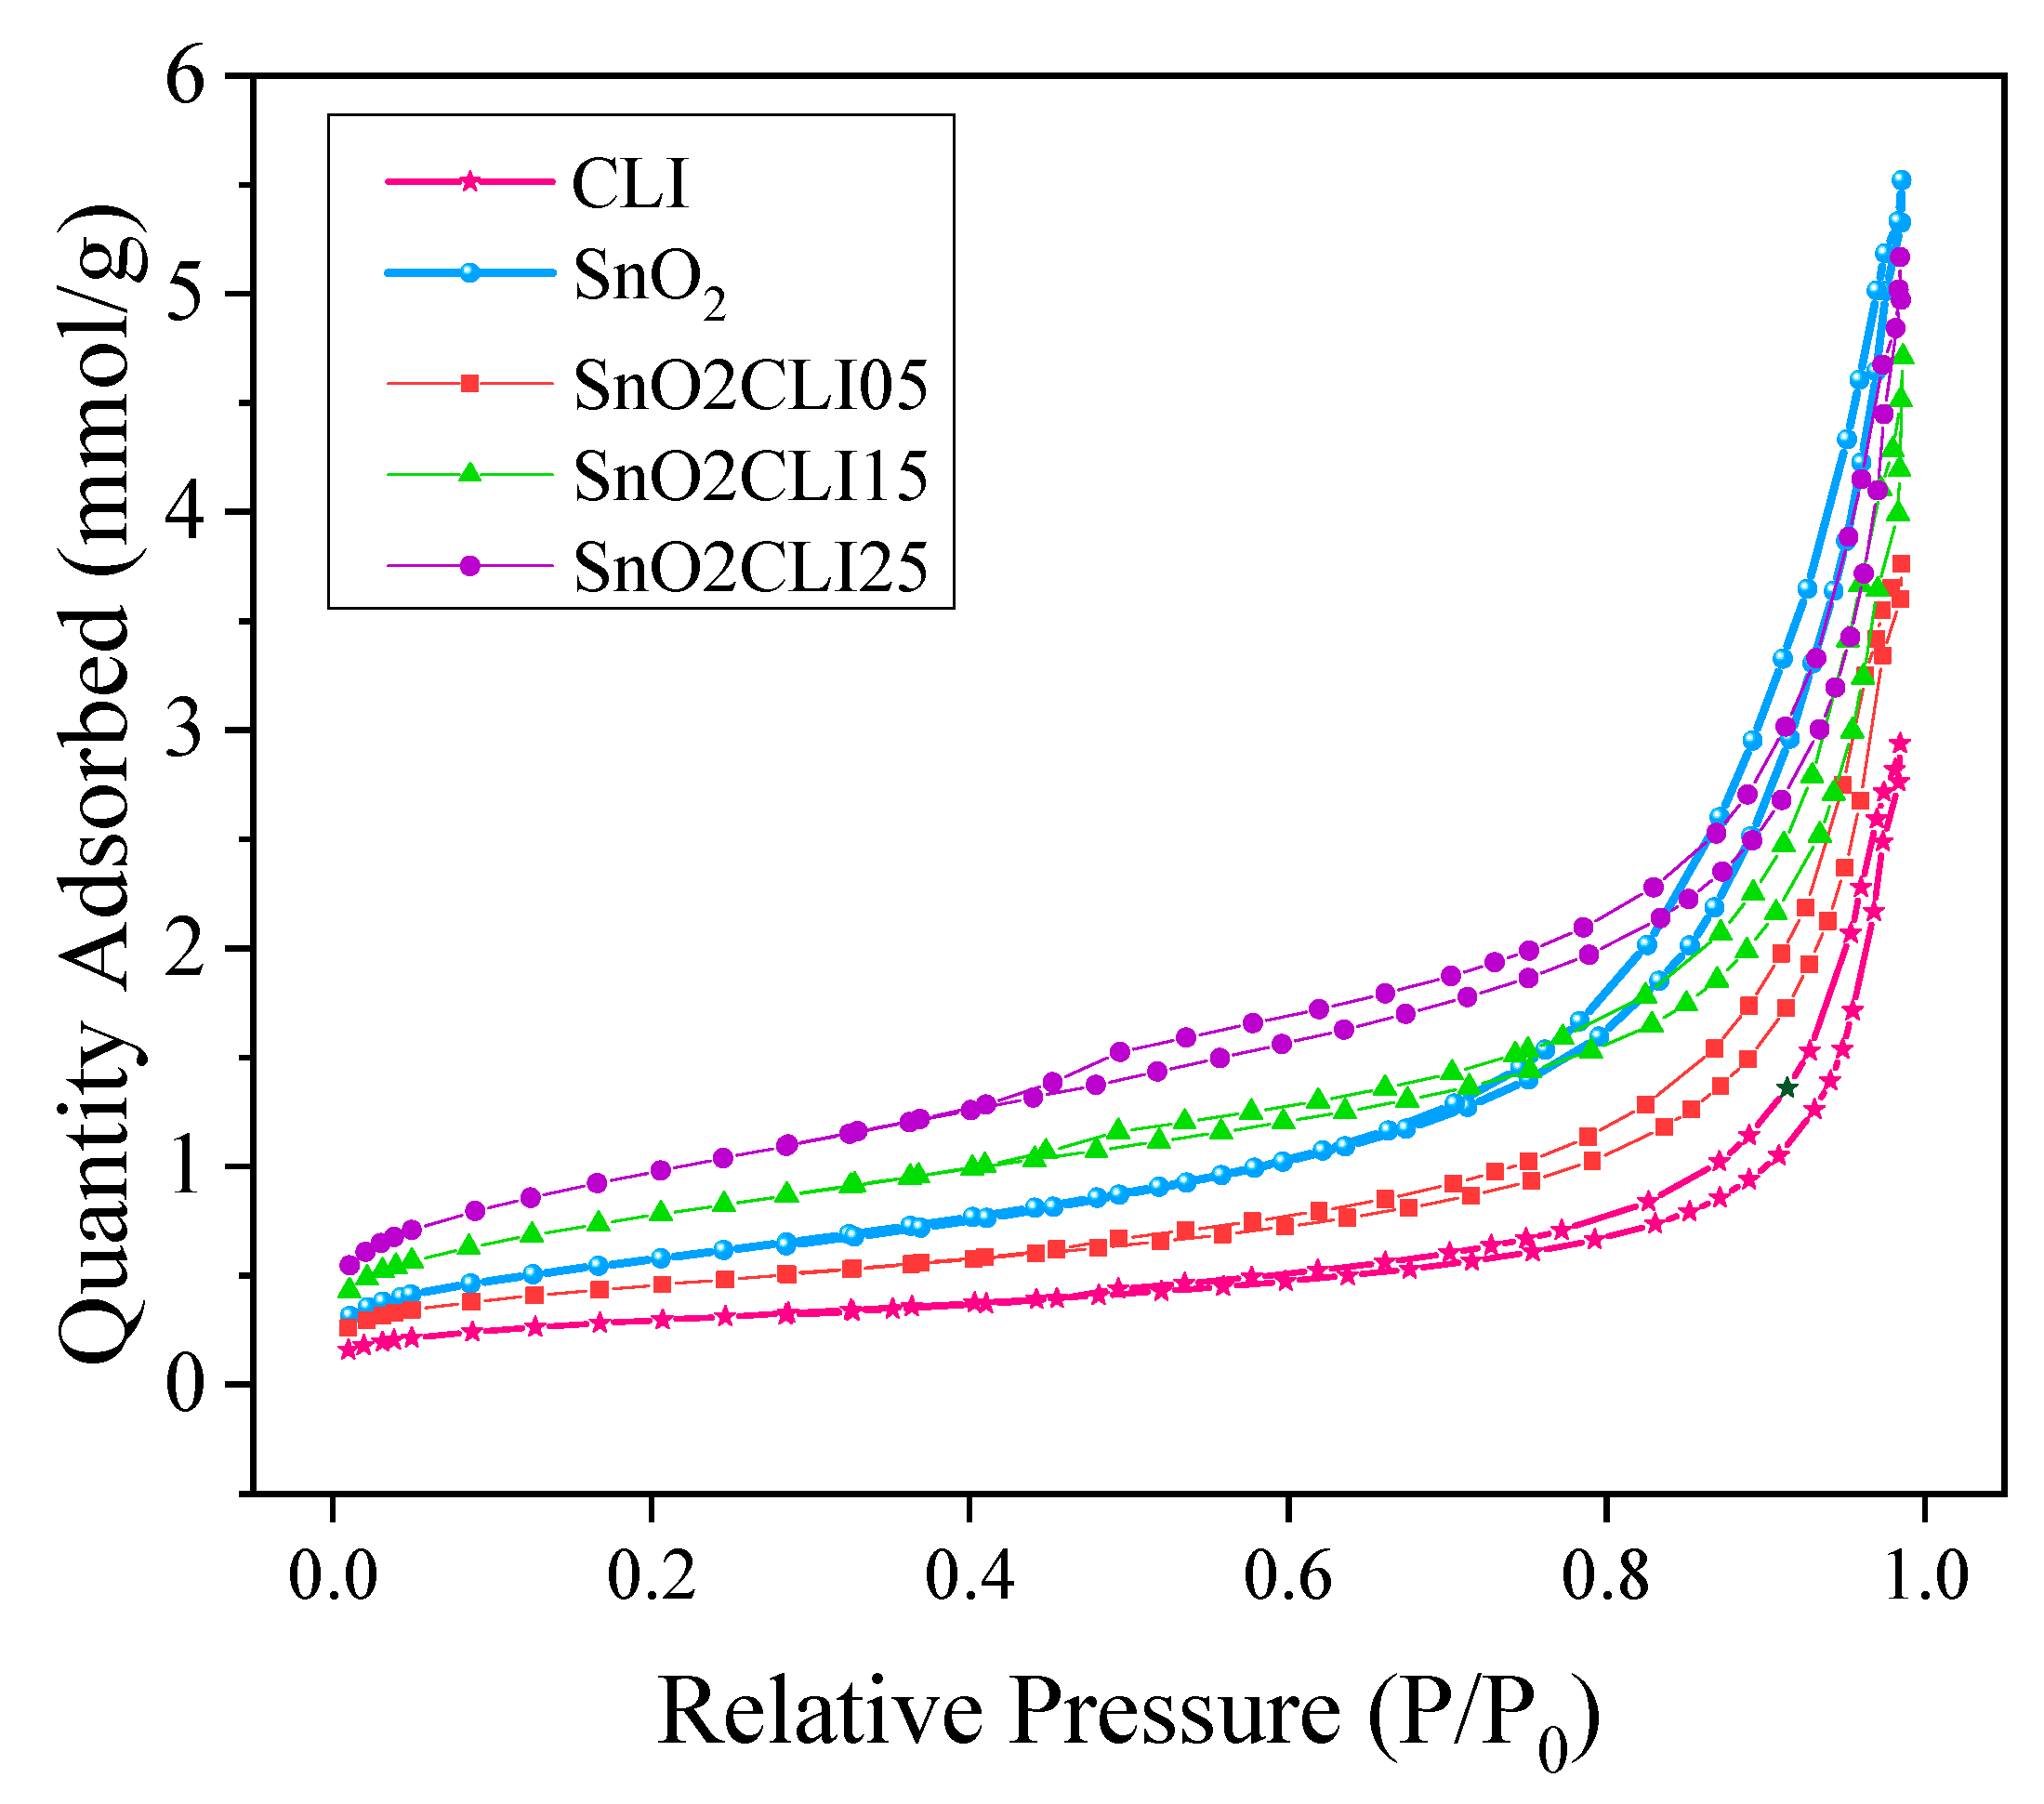
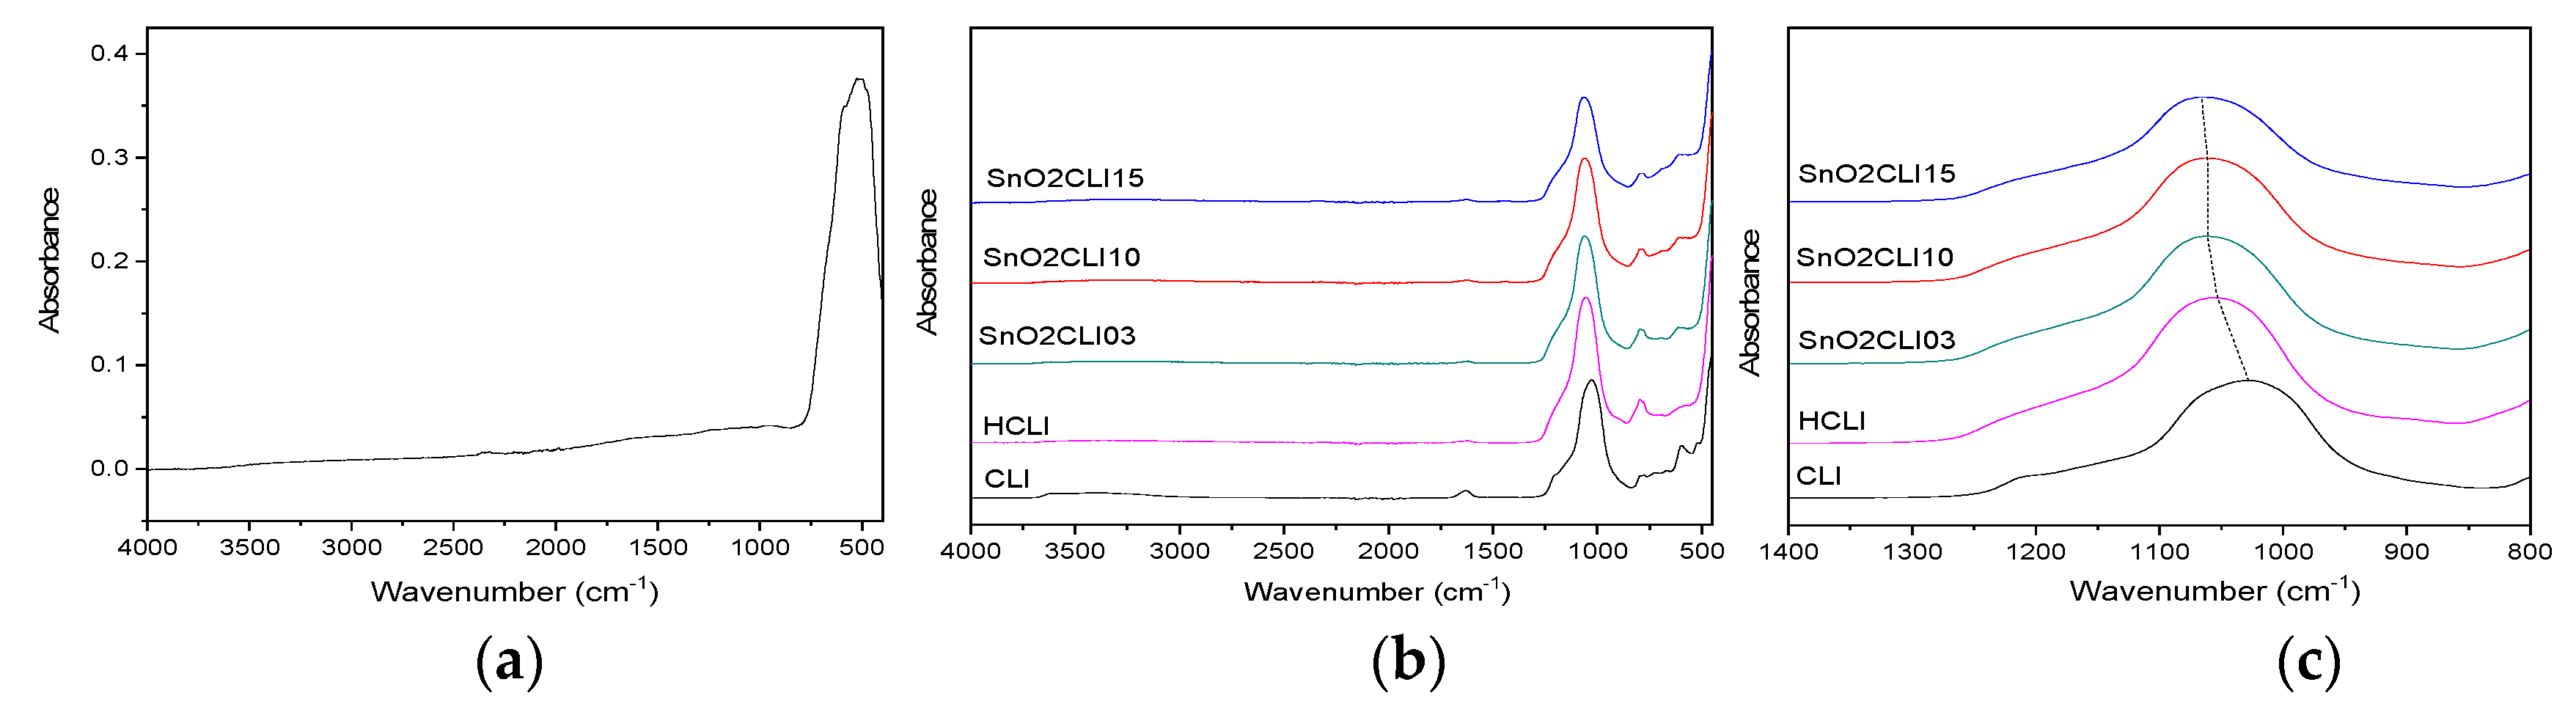
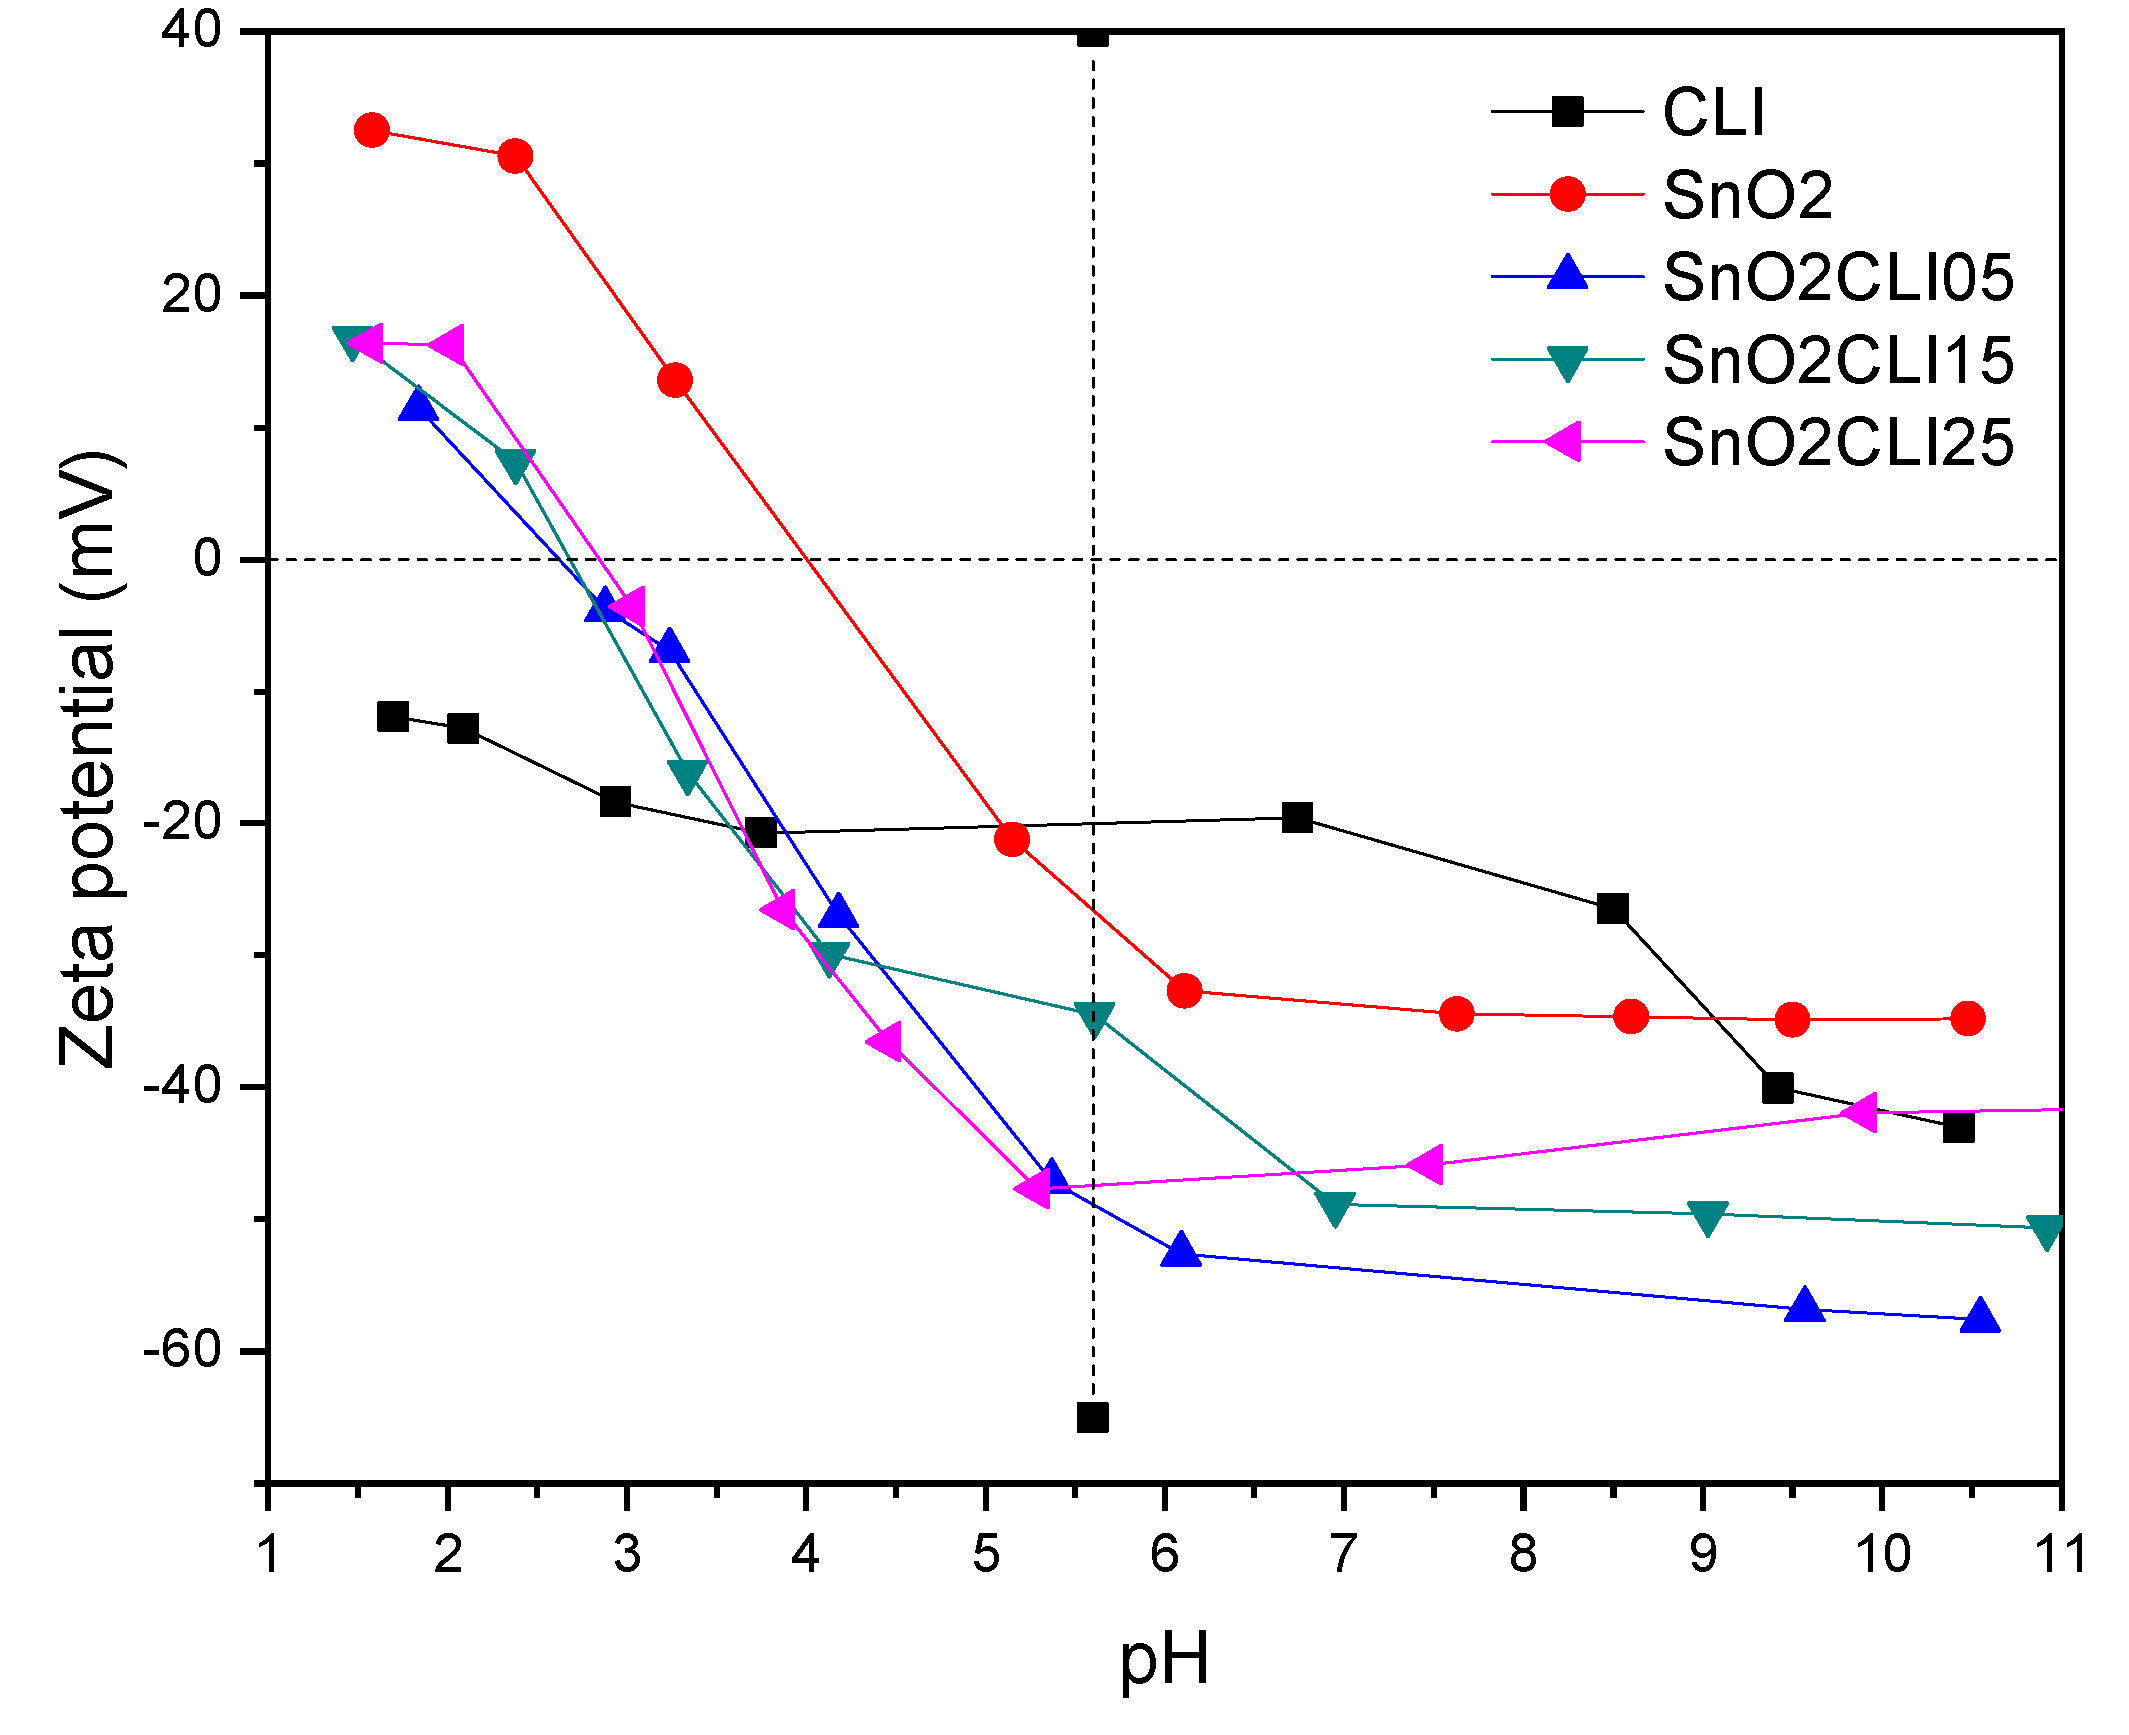
2.1. Characterization of the Materials

The X-ray diffraction (XRD) pattern of the synthesized pure SnO2 (Figure 1.) displayed characteristic diffractions at 2θ values 26.6°, 33.9°, 38.1°, 51.9°, 61.9°, and 65.1° (database, Rutile-like structure, JPCDS 41-1445). The pattern of parent clinoptilolite (CLI) showed the presence of clinoptilolite, feldspar, and quartz. The prepared SnO2-CLI composites showed the clinoptilolite crystallinity of the composite decreased with the amount of SnO2 and that additional diffraction peaks that could be ascribed to SnO2 did not appear. This can be explained by the fact that SnO2 particles at the CLI surface are amorphous. Similar results have been reported for clinoptilolite covered by Fe(III) and MnO2 particles [21,22].
Once the phase composition was known, the samples were tested with thermogravimetric analysis (Figure 2) to see the possible evolution of SnO2 during heating. The weight loss up to 200 °C in the thermogram of the SnO2 precursor (Figure 2a) can be ascribed to the dehydration process, while the maximum in the DTG (differential of weight loss) curve, centered at 321 °C, can be attributed to the dehydration and dehydroxylation of amorphous tin hydroxide [23]. This is in accordance with the data reported for the formation of SnO2 by thermal decomposition of Sn(II) oxyhydrate under air [24]. XRD analysis confirmed the thermal stability of the composites up to 800 °C (data not shown). Thermal analysis (Figure 2b,c) shows that the total weight loss increased with the increase in Sn content from 12.3% (SnO2CLI05) to 16.0% (SnO2CLI25). DTG curves displayed a maximum at about 60 °C which can be ascribed to the loss of physically adsorbed water at temperatures below 100 °C. Furthermore, a broad maximum in the temperature range 200–400 °C and peaking at 350 °C was noticeable due to the dehydroxylation and formation of Sn oxide species in the clinoptilolite structure. The delay in the peak weight loss from 321 to 350 °C was noticeable and suggests the interaction of Sn species with the zeolitic support causing delayed dehydroxylation.
To confirm the presence of Sn species in the composites, energy-dispersive X-ray analysis (EDX) was performed. The results given in Table 1 reveal that the major components of the modified clinoptilolite were O, Si, and Al, and, in minor amounts, Na, K, Ca, and Fe (Figure S1). The concentration of Sn onto SnO2-containing clinoptilolite increased with the increase in the initial concentration of the SnCl2 solution used in the modification process demonstrating that Sn was loaded into the clinoptilolite structure. It is worth mentioning that the grafting efficiency was approximately 60% regardless of the nominal Sn amount (5, 15, or 25 wt. %) according to the ratio between measured Sn in composites and Sn put into the synthesis. In addition, it can be seen that the Si/Al ratio for pure clinoptilolite was 5.0, which is typical for this type of zeolite found in nature and in good agreement with other reports [25,26]. However, Si/Al ratios of SnO2-containing samples increased with respect to raw CLI. This can be ascribed to the partial dealumination process during the conversion of CLI to H–CLI [27,28]. This was also confirmed by the constant Si/Al ratios (~7.3) at higher Sn loadings.
IOP-OES elemental analysis of CLI was also performed to complement the EDX elemental analysis; the results are shown in Table S1 (Supplementary Information), and they confirmed the findings of SEM-EDX method and found the values of elements in the zeolitic support to be concurring the fact that the support could be called clinoptilolite.
The presence of SnO2 in all SnO2-containing clinoptilolite samples was additionally confirmed by the diffuse reflectance spectroscopy (DRS UV/Vis) analysis (Figure 3). A broad absorption peak centered at about 263 nm characteristic for pure SnO2 (Figure 3a) is evident in all SnO2-containing clinoptilolite samples [29]. The translation, according to the Kubelka–Munk theory, revealed the bandgap of SnO2 to be 3.38 eV, while the absorption intensities increased with the increase in Sn content. This can enhance the photocatalytic activity of the samples due to the enhanced formation of the electron-hole pairs by higher absorption of incoming irradiation. Similar observations have been reported for the incorporation of ZnO and CuO into clinoptilolite [13,30].
Once the presence of Sn-species was confirmed in the samples, the surface morphology of the SnO2, CLI, and SnO2-containing clinoptilolite was studied with scanning electron microscopy (SEM) to determine the location and size of tin oxide in the composites (Figure 4). Pure clinoptilolite shows typical crystal flake-like structures. Compared to pure CLI (Figure 4a), the SnO2-clinoptilolite samples also showed the same crystal structures, which indicate the zeolite crystallites were not affected by grafting SnO2. However, smaller particles that cover the clinoptilolite surface were seen and could be attributed to SnO2 based on their size and spherical shape, which was distinguishingly different from that of clinoptilolite. The average size of SnO2 agglomerates obtained from SEM images (histogram from 50 particles) was around 17 nm for pure SnO2 and, similarly, 19 nm for SnO2CLI25. Their distribution on the surface of clinoptilolite was seen as highly uniform. In addition, the further aggregation of the pure SnO2 particles led to prolonged tube-like features (Figure 4b); these structures were absent in composites of higher SnO2 loadings (SnO2CLI25, Figure 4e), which showed a lesser aggregation of the SnO2 particles in these samples.
Since tin oxide species were seen on the surface, we checked for the possible influence of these species on the textural properties with nitrogen physisorption, and the obtained results are given in Table 2. The Brunauer, Emmett, Teller (BET) surface area of CLI (24 m2 g−1) coincides well with the data reported elsewhere [31,32]. The porosity arises from interparticle voids among the different crystal structures present in the natural clinoptilolite (see XRD patterns above). It can be seen that the loading of CLI with SnO2 increases specific surface area and total pore volume. The higher specific surface area provides better dispersion of Sn species, more active sites and should, hence, result in higher catalytic activity. The increase in BET surface area of the composites can be attributed to a partial dealumination of the clinoptilolite lattice during modification. Replacement of the metal cations present in the clinoptilolite channels by H+ resulted in more available space within the CLI lattice [28,33]. Moreover, an increase in the specific surface area with the increase in the Sn content was also evident. This could be attributed to the formation of an additional porous layer formed by amorphous SnO2 at the clinoptilolite surface.
However, the average pore sizes in all samples were smaller than the particle aggregates that were seen in SEM imaging which suggests that SnO2 particles did not enter the pore system of clinoptilolite. The study of N2 adsorption/desorption isotherms (Figure 5) showed that, according to International Union of Pure and Applied Chemistry (IUPAC) classification, all presented isotherms could be classified as isotherms of type IV, ascribed to microporous adsorbents in which there exists a certain amount of impurities, especially clays, quartz, and amorphous glassy material. In addition, they showed a hysteresis loop of type H3, in the range p/p0= 0.5–1. This feature, together with an upward deviation at high relative pressures, is typical for clinoptilolite structure and can be attributed to multilayer adsorption and capillary condensation either in mesopores of impurities (feldspars, quartz, etc.) or in the space between the zeolite crystallites [31].
Hence, to additionally confirm the state of Sn species and their location in the composites (either inside or outside the clinoptilolite’s pores) Sn K-edge Extended X-ray Absorption Fine Structure (EXAFS) analysis was used to determine the local structure around Sn cations in the SnO2-containing clinoptilolite at different Sn loadings (SnO2CLI05, SnO2CLI15, and SnO2CLI25). Fourier transforms (FT) of the k3 weighted EXAFS spectra of the samples are shown in Figure 6. The spectrum of crystalline SnO2 with rutile structure is added for comparison. The Fourier transforms spectra reveal the contributions of consecutive shells of Sn neighbors up to about 4 Å. Qualitative comparison of the FT spectra indicates that the local structure around Sn cations in the samples was similar to that in the crystalline SnO2. The lower signal in the interatomic distance (R) ranged from 2.5 Å to 4 Å which indicates that the number of neighbors in those coordination shells was smaller than in the bulk SnO2, which indicates that Sn in the samples was present in the form of nanocrystalline SnO2 particles with rutile structure and with different average nanoparticle sizes.
The quantitative analyses of Sn K-edge EXAFS spectra were performed to resolve structural parameters by comparing the measured signal with the model EXAFS spectrum, constructed with the FEFF6 program code [34], in which the photoelectron scattering paths were calculated ab initio from a tentative spatial distribution of neighbor atoms, based on the rutile type SnO2 (cassiterite) crystal structure (space group P 42/m n m with unit cell parameters a = b = 4.73727 Å and c = 3.18638 Å., [35]). In this structure, Sn atoms are surrounded by six oxygen atoms in the nearest coordination shell and Sn and oxygen atoms in more distant coordination shells (two Sn at 3.19 Å and 8 Sn at 3.71 Å; 4 O at 3.59 Å and 4 O at 3.79 Å). The contributions of the first five coordination shells in the R range up to 4.0 Å were analyzed. The FEFF model comprised six single-scattering and all significant multiple-scattering paths from these neighbor shells. A distortion of the nearest oxygen octahedron (4+2) was allowed by introducing two Sn–O distances for the nearest coordination shell.
The crystalline SnO2 spectrum was used to calibrate the model. A very good fit was obtained in the k range of 4.5–14.5 Å-1 and R range of 1.2–4.0 Å (Figure 6), with just seven variable parameters: the amplitude reduction factor S02 and shift of photoelectron energy origin ΔEo, lattice expansion (Δr/r), and the Debye–Waller factors of different scattering paths. The shell coordination numbers were fixed at their crystallographic values. The quality of the fit is presented in Figure 7 and the best-fit parameters are listed in Table S3.
The same EXAFS model was used to describe the Sn EXAFS spectra of the samples, except that the amplitude reduction factor S02 was kept fixed at the value of crystalline SnO2, while the number of Sn neighbors in the coordination shells beyond the nearest oxygen shell were allowed to vary. Octahedral coordination of the nearest oxygen neighbors was kept fixed.
In all three samples, Sn neighbors in the first five coordination shells of the SnO2 cassiterite structure were found at the same distances (within error bars) and with the same or slightly larger Debye–Waller factors as in the crystalline SnO2. However, in more distant coordination shells, the average Sn coordination numbers were significantly lower than in the bulk SnO2 (about 50% of the value in bulk in the case of the SnO2CLI25 sample or even less for the second Sn neighbors at 3.71 Å in SnO2CLI15 and SnO2CLI05 samples). The results clearly indicate that SnO2 nanoparticles with a cassiterite crystal structure were formed. The average size of nanoparticles was the smallest in the sample SnO2CLI05 with the smallest Sn loading.
We also tested eventual partial Sn incorporation into the zeolite structure. In the fitting of the second Sn coordination shell, the contributions of Si or Al neighbors backscattering were ruled out, judging from the unfavorable fit results (absence of Sn–O–Si and Sn–O–Al connections). We can conclude that Sn atoms were not incorporated into the zeolite crystal structure or directly bonded to the zeolite surface, or more precisely, that relative amount of such Sn cations was below the detection limit (~5%) of the EXAFS spectroscopy.
Since the nature and position of SnO2 particles in the composites were determined, chemical and physical properties of the catalysts’ surface were studied; these can significantly affect the catalytic performance. First, attenuated total reflection (ATR-FTIR) spectroscopy was used to study the chemical nature of the surface. The results are shown in Figure 7. The presence of characteristics absorption bands of zeolite structure, such as the external tetrahedral linkage asymmetric stretching (at 1026 cm−1) and linkages between SiO4-tetrahedrons (at 792 and 608 cm−1), confirmed the stability of zeolite structure during modification to SnO2-loaded CLI. A lower intensity of band located at 1630 cm−1, which belongs to vibrations of water molecules, can be attributed to lower hydration of the calcined samples with respect to the parent CLI. However, corresponding absorption bands of SnO2 (~520 cm−1, Figure 7a) were not noticeable probably due to the overlapping of bands and the strong intensity of the zeolite structure vibrations [15,36]. In addition, ATR-FTIR spectra indicate that the bands characteristic for asymmetric Si–O–Si stretching present at 1026 cm−1 in CLI shifted to higher frequencies for HCLI (1052 cm−1) and for additional 10 cm−1, i.e., to about 1063 cm−1 in SnO2-containing samples. The first shift (for HCLI) can be ascribed to the dealumination process which strengthened the Si–O–Si bonds. According to Breck [37], the shift to even higher frequencies (i.e., 1063 cm−1 in SnO2-containing samples) can be ascribed to entering of transition metal cations into the zeolitic structure during the ion exchange process, yet leaving the zeolite structure unchanged. These observations confirm the partial loading of SnO2 into the zeolite pore system. Such shifts have been observed in combination with other nanoparticles supported on clinoptilolites, such as TiO2, ZnO, SnO2-ZnO, SnO2-NiO, and CuO [14,17,30,38].
Lastly, the surface charge of the composites was studied since this property can largely influence the adsorption process in the composites. Zeta potential measurements (Figure 8) showed that CLI had a negative zeta potential in the whole pH range (pH = 1.5–11). For pure SnO2, the point of zero charge (PZC) was nearly pH = 4.0, which is close to the literature data [39]. As expected, the surface charge of CLI was affected by loading with different amounts of SnO2. PZC of SnO2-clinoptilolite clinoptilolite was 2.66, 2.67, and 2.88 for SnO2CLI05, SnO2CLI15, and SnO2CLI25, respectively. At pH value at which photocatalytic experiments were performed (pH = 5.6), surface SnO2-containing clinoptilolite had negatively charged sites. Considering the positive charge of cationic MB dye, the adsorption was expected to be favored at this pH. Contrary, at pH below the PZC, the electrostatic repulsion between the positively charged surface of prepared photocatalysts and MB resulted in a decrease in their adsorption rate.

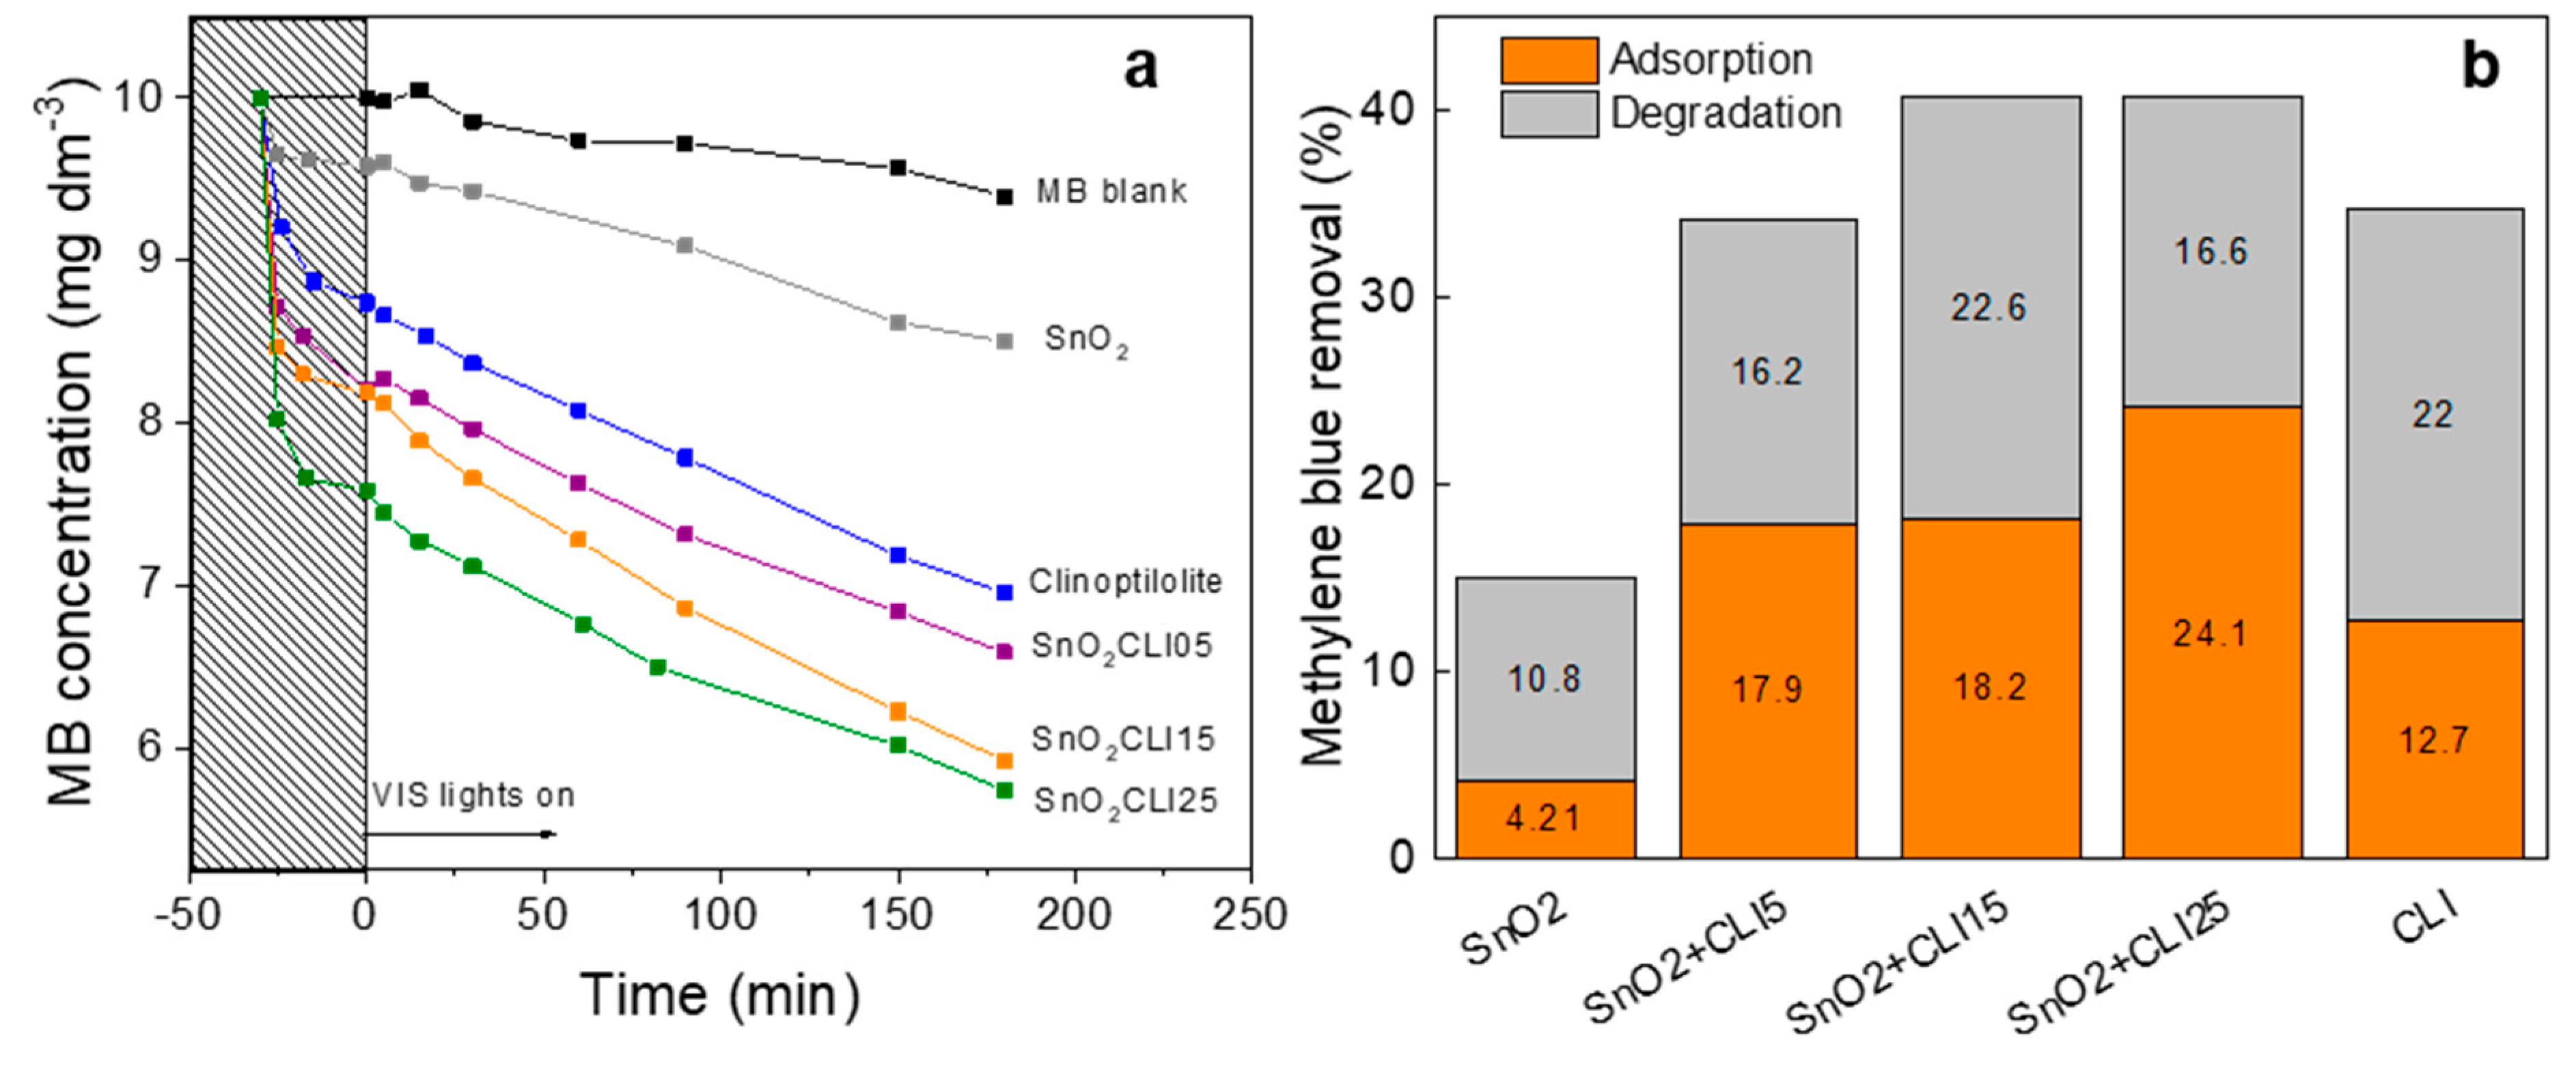
2.2. Photocatalytic Activity

The results of the photocatalytic tests are shown in Figure 9. It can be seen that the initial dark period (30 min) was enough to establish the adsorption equilibrium of SnO2-containing clinoptilolite samples in contrast to raw CLI. It was, however, long enough to expose the discrepancy between the adsorption–desorption process and catalytic degradation process.
As already mentioned, the adsorption process in pure CLI did not seem to be finished after 30 min of the dark period, as was clearly seen in SnO2-containing samples. This is probably due to the much higher capacity of the zeolites for MB adsorption. Conversely, when the clinoptilolite was loaded with SnO2, the pores got partially clogged and the rest of the pores got filled quicker. The kinetics of adsorption on the additional adsorption sites created by SnO2 particles on the zeolite surface seemed to be faster. This can be supported by the zeta potential of the dye-polluted water (5.7), where the composite samples (and pure SnO2) present more negative charge which more strongly attracts the positive MB dye.
Interestingly, the results show that the SnO2 exhibited negligible adsorption capacity (4%) toward MB in the dark, while the degradation of MB under illumination with visible-light lamps was slightly higher (11%). The better adsorption capacity was obtained for raw CLI (10%), and the total degradation of MB in the presence of CLI was about 30%. By loading clinoptilolite with SnO2, the photodegradation of the MB was increased, which demonstrated the importance of clinoptilolite support in adsorption of MB. It has also been found that the photodegradation of MB was affected by the content of SnO2 onto clinoptilolite exhibiting the highest value for SnO2CLI25 (Figure 10). This can be explained by additional photocatalytic active sites on samples with a higher amount of SnO2, as well as better dispersion of SnO2 particles onto clinoptilolite with the higher specific surface area.
The reduction of methylene blue is a reversible and environment-dependent process, especially in oxygen-rich aqueous environments [40,41], which this system was. However, in semiconductor sensitized systems, the reduction of MB to its leuco form (LMB) is irreversible [42]. The test of removing the particles and continuing purging the solution with O2 did not show a reverse of LMB to MB. Furthermore, we observed a slight blue shift of the 664 nm peak (monomer MB+) at longer irradiation times together with the rapid decrease in the dimer (MB+)2 peak at 610 nm. These observations imply the destruction of the MB dye and its partial incorporation into the pores of the zeolite [43].
The importance of clinoptilolite support in the photodecolorization of MB was also reported by Nezamzadeh-Ejhieh et al. [13]. They reported that CuO incorporated onto micro-sized CLI showed better activity than raw CuO and CLI. This was explained by (1) the ability of zeolite to prevent aggregation of CuO particles by fixing them onto ion-exchange sites and (2) for the photocatalytic part, the ability of zeolite to distribute excited electrons in the conduction band of CuO into the network structure and thus prevent the recombination of electron-hole pairs. Similar observations were reported for photodecolorization of bromthymol blue by using supported ZnO onto CLI [14].
Because the composite SnO2CLI25 showed the highest final removal of MB dye, it was chosen as the catalyst for which additional characterization and optimization were conducted.

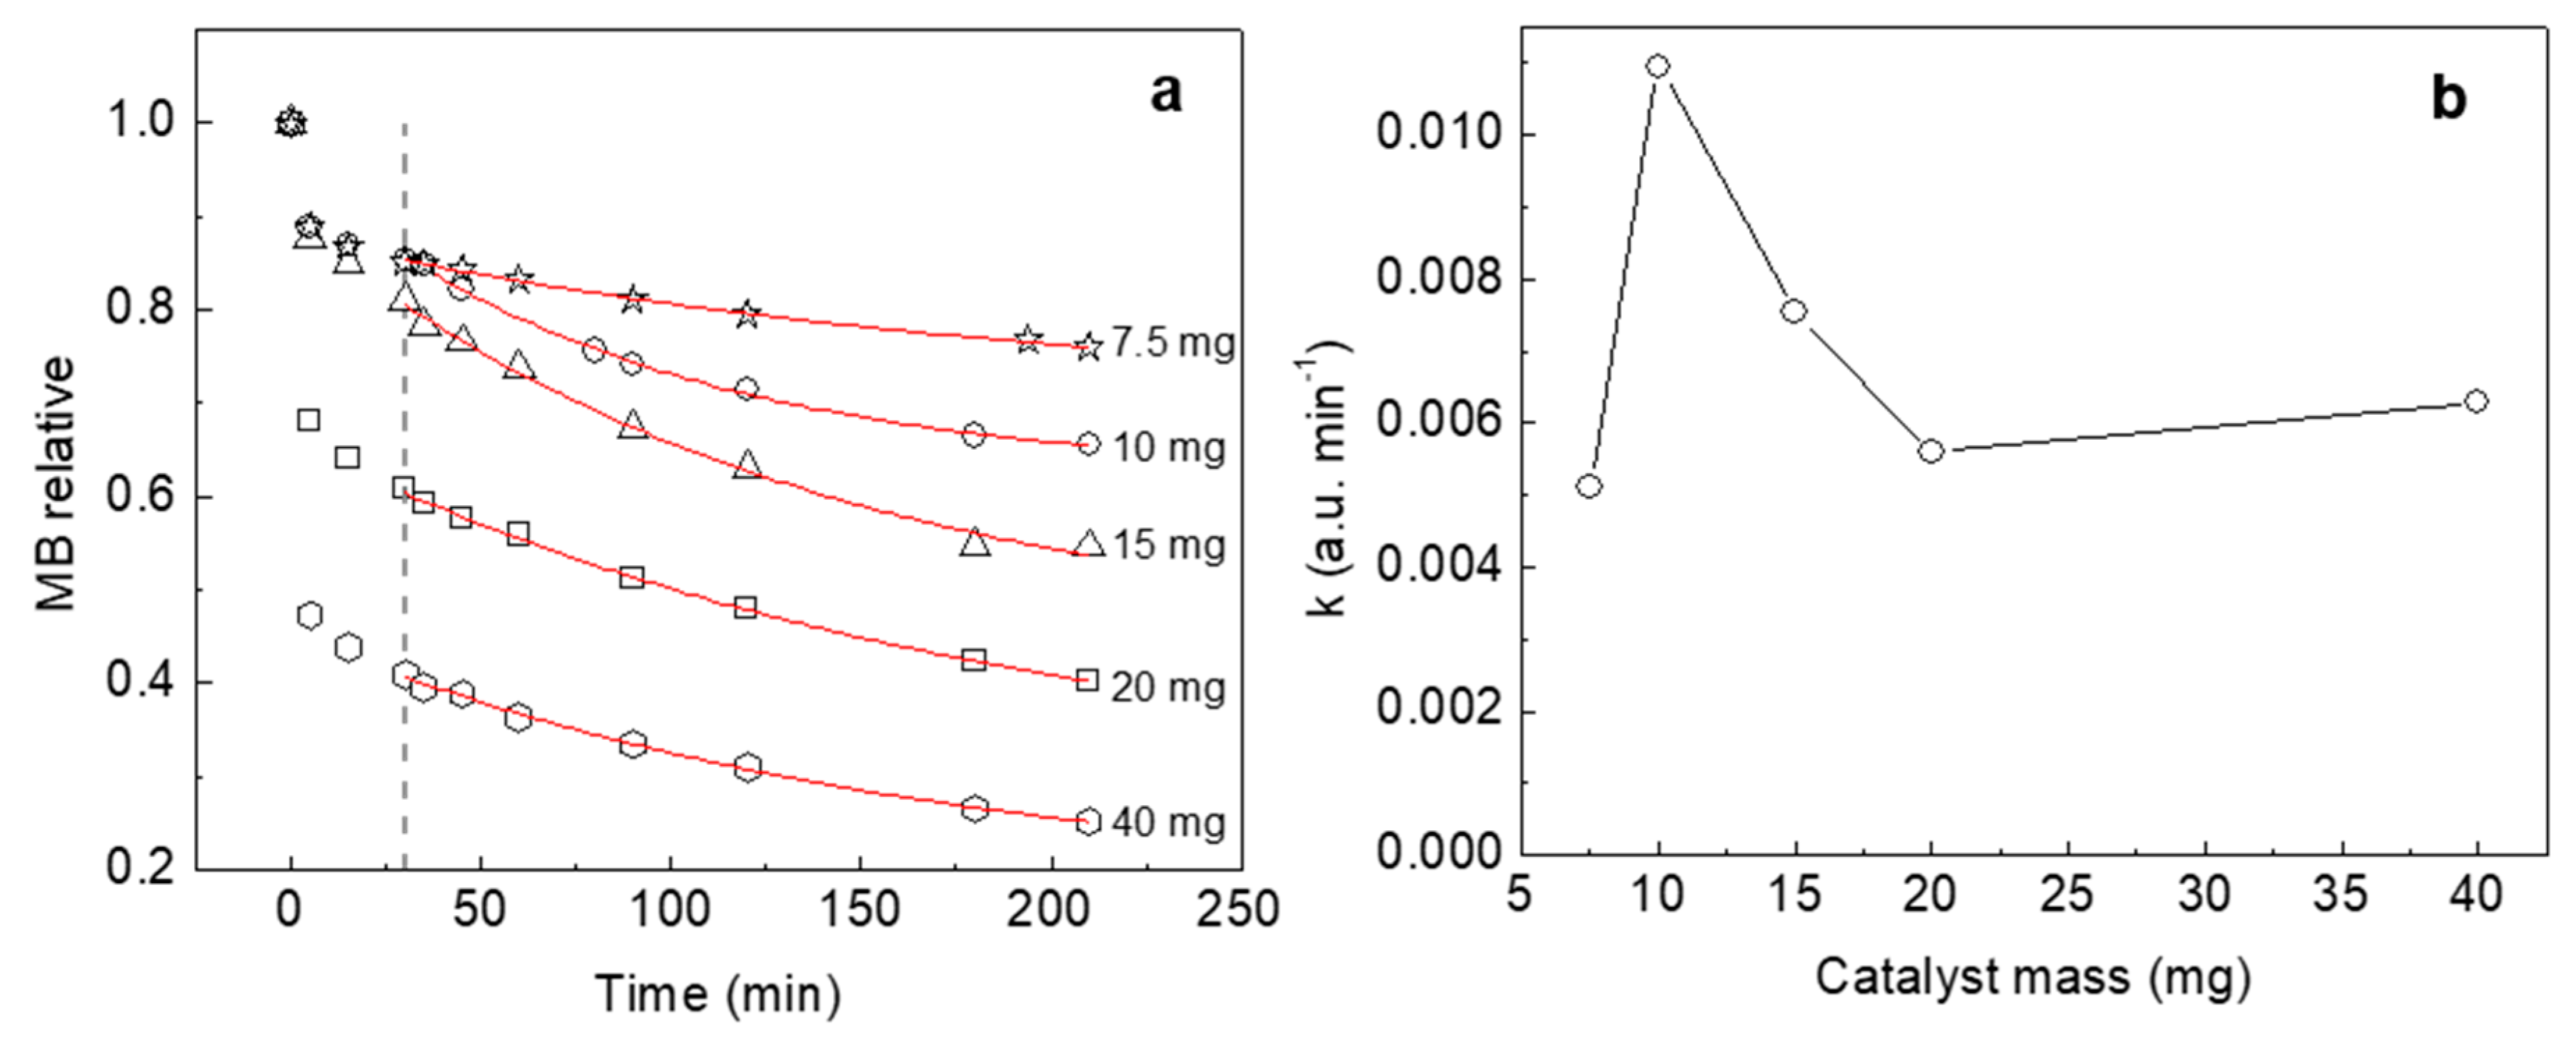
2.2.1. The Effect of the Amount of the Photocatalysts

The practical environmental application of photocatalyst requires the optimal amount of photocatalyst. Hence, the effect of the photocatalyst amount on the photodegradation of MB was studied. The results obtained by using different amounts (in the range of 7.5 to 40 mg) of the SnO2CLI25 sample are given in Figure 10. From the obtained results, it is clear that the final photodegradation of MB increased with the increase in the amount of the photocatalyst, reaching the highest value (75%) for the amount of 40 mg. However, the adsorption of MB was more affected by the amount of photocatalyst than the degradation of MB under illumination with visible-light lamps.
A = (A0A) ∗ exp(−k*t) + A
where A0 and A are initial and final (equilibrium) absorption values at 664 nm of the MB dye, respectively. The coefficients of correlation (R2) for such fits to data were all greater than 0.997. The reasoning for using such kinetics instead of the more commonly used A = A0*exp(−k*t) is in the fact that the MB evolution clearly shows a plateau is reached after prolonged illumination. This can be ascribed to the formation of additional intermediate products which are hard to degrade and additionally compete with pristine MB for adsorption/catalytic sites. Additionally, as mentioned before, monomeric MB dye was partially incorporated in the zeolite’s pores, which can later be hard to remove. These phenomena could be overcome with improved reactor design and the possible inclusion of UV-light irradiation as the catalyst excitation source.
The reaction rate constants derived from non-linear least-square fitting to the kinetic equation were compared and are shown in Figure 11b. It can be seen that 10 mg was the optimal mass for the fastest kinetics, and an additional increase in the catalyst mass led to a decrease in the photocatalytic speed. Naturally, this is a consequence of the aggregation of the photocatalyst particles which resulted in the reduction in the effective surface area of the photocatalyst. Moreover, this can be explained by the scattering of light and reduction in light penetration.

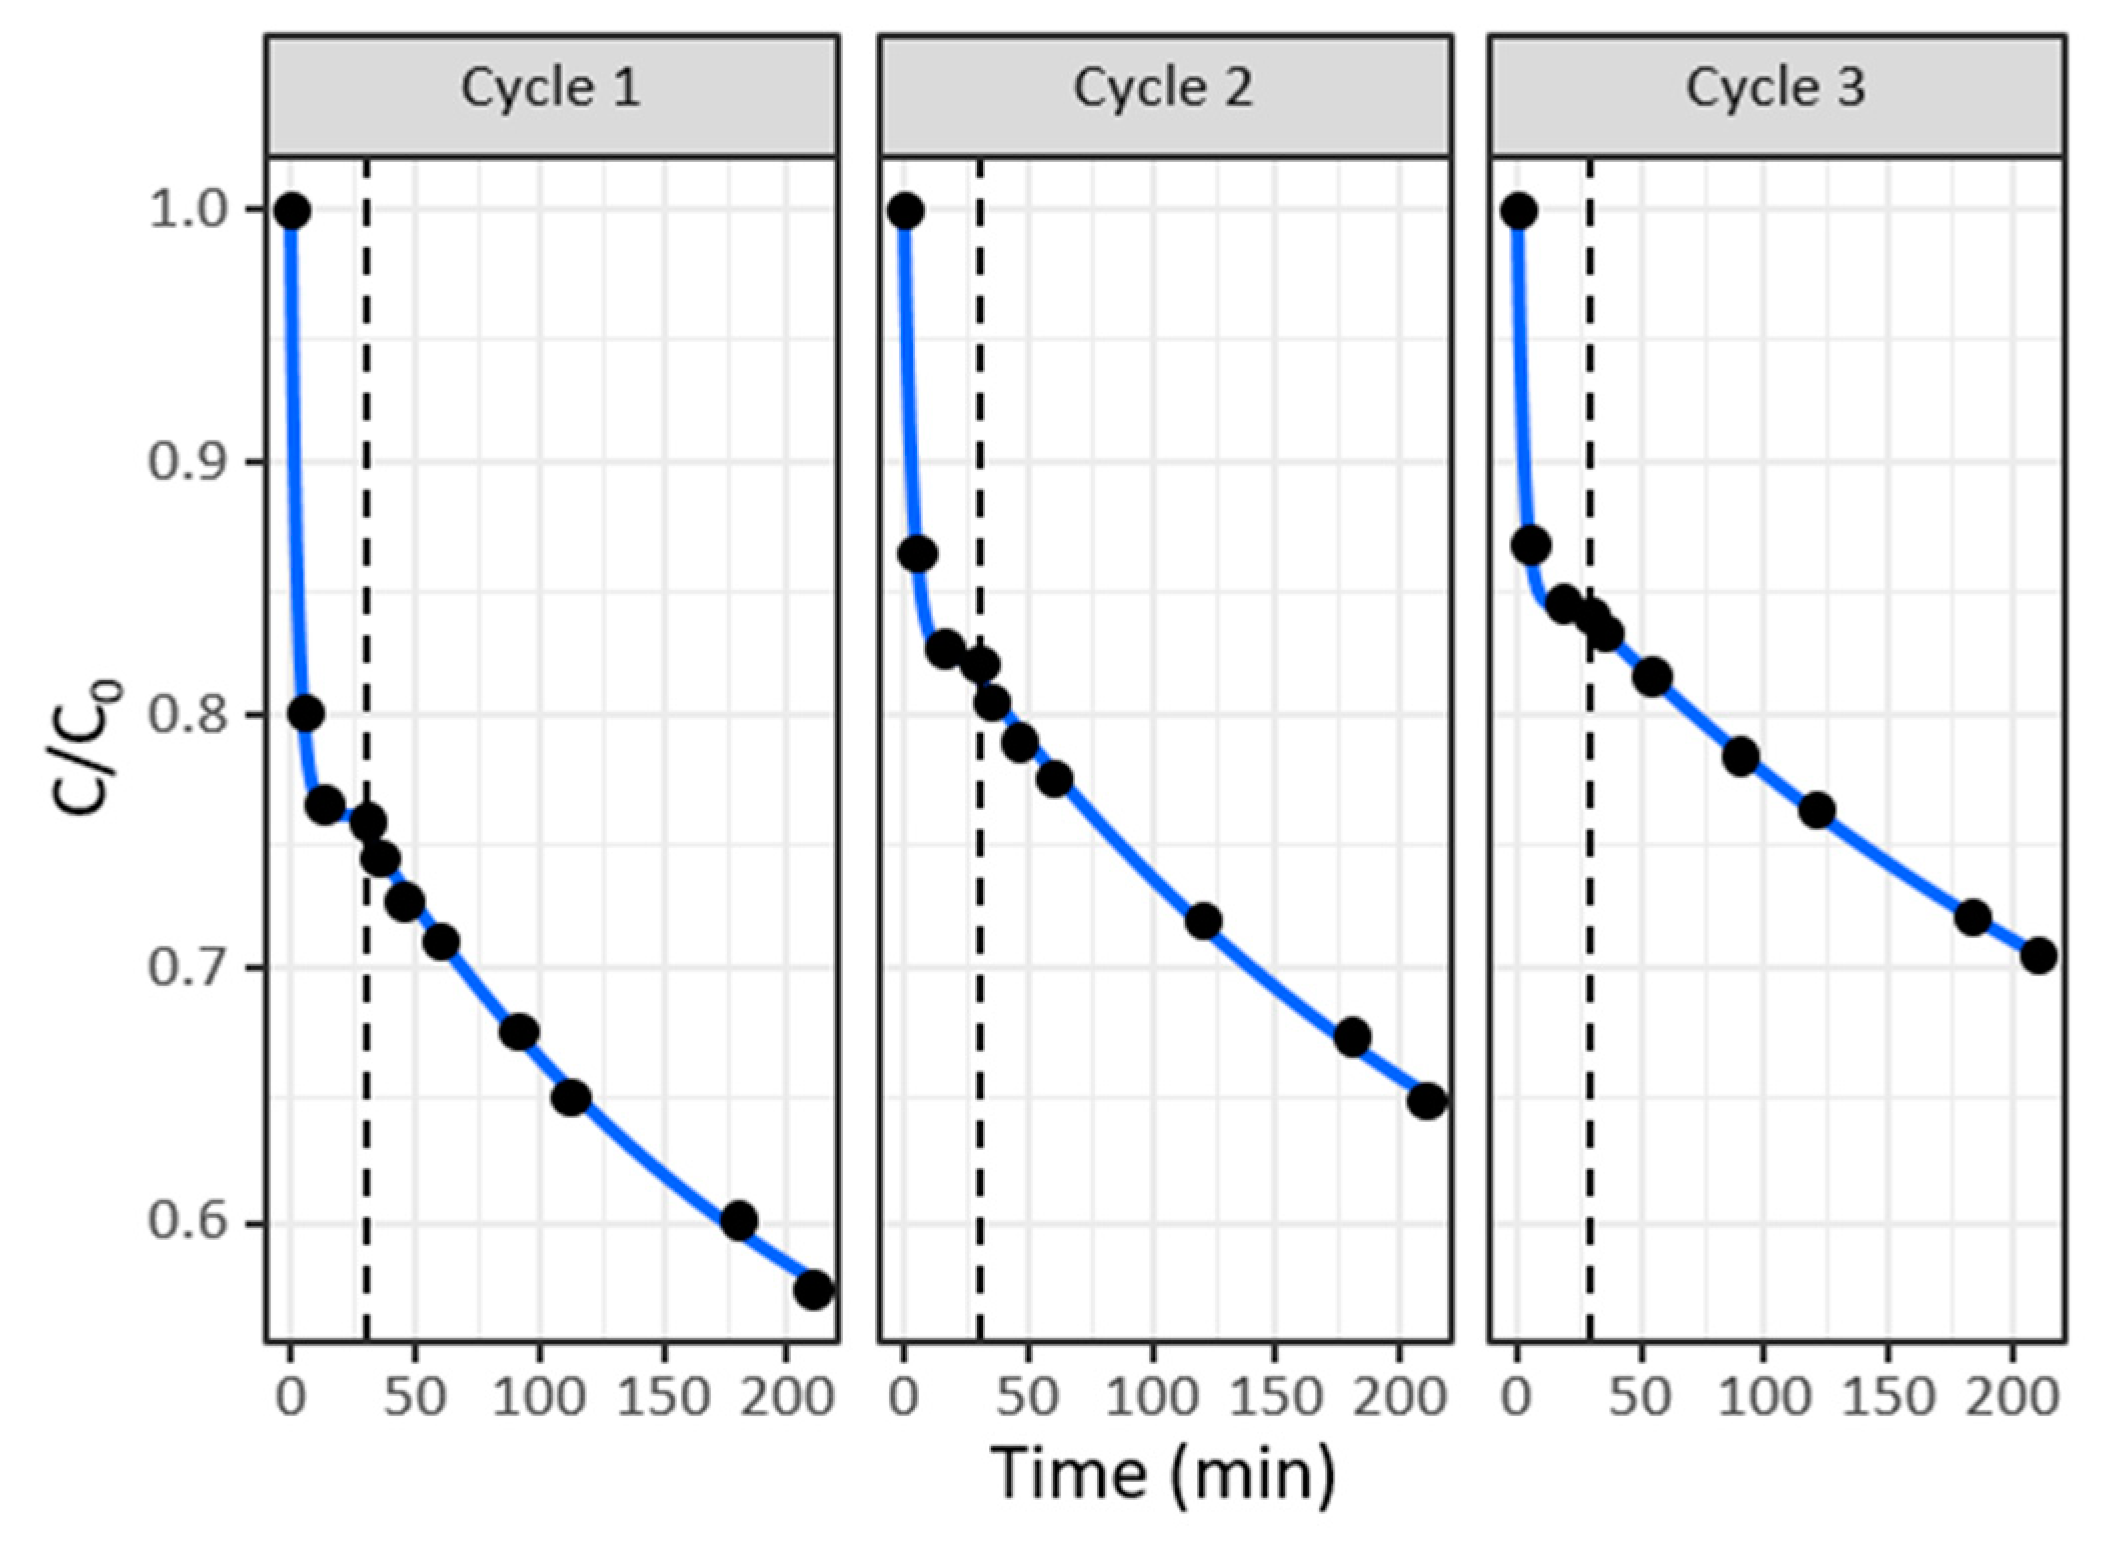
2.2.2. Reusability of the Photocatalysts

The reusability of the photocatalyst for the MB degradation was also studied. The reused photocatalyst (SnO2CLI25) was washed with 0.01 M HNO3 three times (Figure 11a). Such catalysts were used again in the photodegradation test at optimized experimental conditions.
SEM images of reused photocatalyst (Figure 11c) show that morphology properties were preserved after the photodegradation test. In addition, EDX analysis of the reused photocatalyst showed that Sn content was almost unchanged (2.74 and 2.70 at.%, for fresh and reused SnO2CLI25, respectively). Besides, S (0.14 at.%) and Cl (0.12 at.%) were detected due to MB adsorption onto photocatalyst and, since the washing process did not remove the adsorbed dye completely (see discussion below), the detection of these elements was expected. Furthermore, ATR-FTIR analysis (Figure 11b) confirmed that the clinoptilolite structure was retained after the photocatalytic test, and also indicated the presence of derbies of MB onto photocatalyst. The adsorbed MB dye was evident from the IR spectra by (i) 1640 cm−1 absorption (C=N central ring vibration) and (ii) the stretching vibration adsorption band of hydroxyl groups at 3441cm−1 was broadening and offset. Since adsorption of MB dye is pH-dependent, increasing the pH would increase the negative potential of the zeolite surface as proven by zeta potential measurements and the decrease in the pH would result in the increased positive potential of zeolite. The pH-dependence of MB adsorption onto clinoptilolite can be described as:
M–OH + MB+ → M–O–MB + H+
M–O + MB+ → M–O–MB
where M represents an active metal site to which the MB-dye preferentially adsorbs. However, the zeolite-SnO2 composites show positive potential below Ph = 3, hence for desorption, 0.01 M solution of HNO3 was chosen and proven effective (Figure 11a) for desorption of the dye from the clinoptilolite surface; MB can also be washed with ethanol, although in the materials in this study, this efficiency was very low, few percent per wash. This way, approximately 50% of the dye could be desorbed from the surface. The lack of incomplete desorption of the MB dye can be explained by the negative potential of clinoptilolite across the whole pH-range. Hence, even at pH = 2, the zeolite surface still attracts the positively charged MB molecules.
As can be seen from Figure 12, a decrease in the activity of catalyst during repeated cycles was observed. Adsorption of MB (initial dark period) was reduced, probably due to the blockage of the active sites on the clinoptilolite surfaces by the degradation products. N2-isotherm pointed to a high number of available sites in the pristine zeolite (evident in the high nitrogen pressure range, where repulsive forces were predominant [44]), and these could be partially filled by the reaction intermediates, hindering multilayer adsorption which affected consecutive catalytic tests. However, the catalyst was still active in the degradation of MB under illumination with visible-light lamps. A decrease in catalytic activity in the photodecolorization of MB was also observed for CuO-supported nano-clinoptilolite [30]. Bahrami and Nezamzadeh-Ejhieh also reported a reduction in the photodecolorization of the BTB due to the adsorption of organic intermediates and by-products of the photodecolorization process in the cavities and on the catalyst (CuO- and ZnO-containing clinoptilolite) surface [14,30].

3. Materials and Methods

3.1. Preparation of Photocatalysts

In this study, natural zeolitic tuff (CLI) obtained from the Slanci deposit (Veliko selo, near Belgrade, Serbia) was used as a starting material. It consisted mainly of clinoptilolite (about 80 wt.%), and impurities including quartz (ca. 4 wt.%) and feldspar (ca. 16 wt.%). The particle size of the sample used was in the range of 63–125 µm. All chemicals used were used as purchased without further purification: SnCl2·2H2O (≥98%), NH4OH (25%), NH4CH3COO (≥98%), C2H5OH (≥99.8%) was purchased from Sigma–Aldrich (St. Louis, MO, United States) and methylene blue (C16H18N3SCl·xH2O) from Merck (Kenilworth, NJ, United States). All aqueous solutions were prepared using Milli-Q deionized water.

3.1.1. Preparation of Pure SnO2

The pure SnO2 was prepared following the precipitation method described elsewhere [23,43]. In a typical synthesis procedure, 2.2820 g of SnCl2·2H2O was dissolved in 60 cm3 of absolute ethanol, then NH4OH solution (25%) was added dropwise with continuous vigorous stirring until the solution rich a pH = 8. The precipitated product was collected by filtration and suspended in a 4% CH3COONH4 solution for 30 min. Then, the precipitate was filtered, dried at 100 °C for 24 h and finally calcined at 400 °C for 2 h. The calcined powder (SnO2) was then ground and used for the photocatalytic experiment.

3.1.2. Preparation of the SnO2-Containing Clinoptilolite

Prior to its use CLI was washed several times with deionized water to remove water-soluble impurities and dried overnight at 105 °C. Then CLI was converted to hydrogen clinoptilolite (HCLI) by using a triple treatment of the CLI with 1 mol dm−3 HCl at 100 °C for 4 h (solid/liquid ratio = 1:70) and treatment with 0.2 mol dm−3 NH4OH at 65 °C for 0.5 h (solid/liquid ratio = 1:30). Finally, the obtained product was separated and dried until constant weight. Further, HCLI was converted to SnO2-containing clinoptilolite by using a slightly modified procedure (precipitation–deposition method followed by calcination step) given by Matatsushashi and Sowmiya [23,45]. HCLI was suspended in deionized water using solid:liquid ratio 1:100 and stirred for about 10 min. Then, the pH of the suspension was adjusted to 10 by dropwise addition of a 25% NH4OH. The ethanol solution of SnCl2 containing different amounts of SnCl2·2H2O was dropwise under constant stirring to obtain 5, 15, and 25 wt.% Sn onto CLI. After repeated adjusting of pH to 10, and stirring for 24 h, the suspension was separated by centrifugation, washed with 4 wt.% CH3COONH4 solution and then with deionized water until chloride free. The obtained solids were dried overnight at 120 °C and then calcined at 400 °C for 2 h. Note, that although the measured contents of Sn differ from the nominal one (elemental analysis, Table 1) the prepared products were denoted as SnO2CLI05 (3 wt. % of Sn in CLI by el. analysis), SnO2CLI15 (10 wt. % of Sn in CLI by el. analysis) and SnO2CLI25 (15 wt. % of Sn in CLI by el. analysis).

3.2. Characterization of the Materials

The crystallinity of the prepared samples was studied by using an APD2000 Ital Structure diffractometer with CuKα radiation (λ = 0.15418 nm) in the 2θ range 5–60° with a step size of 2θ = 0.02°.
The thermal behavior of the samples obtained before the calcination step was examined by thermal analysis using an SDT Q600 simultaneous TGA–DTA instrument (TA Instruments). The samples were heated from room temperature to 800 °C at a heating rate of 10 °C min−1 under synthetic air (100 mL min−1).
To detect surface functional groups present in all prepared photocatalysts as well as spent photocatalysts, FTIR spectroscopy using attenuated total reflectance (ATR) apparatus were carried out by using an Alpha–Bruker FTIR spectrophotometer using a diamond crystal in a horizontal position. ATR-FTIR spectra were collected in the spectral region from 4000 to 400 cm−1 with a resolution of 4 cm−1.
The surface morphology of the samples was studied by SEM analysis using a Zeiss Supra 3 VP field emission gun (FEG) microscope, operating at 1 kV. The elemental composition of the samples was determined by the EDX analysis with INCA Energy System, attached to the above-described microscope, operating at 20 kV. Prior to the EDX analysis, samples were coated with carbon with a thickness of about 8–10 nm.
The textural properties of the samples were determined by the adsorption/desorption of nitrogen at –196 °C using an automatic sorption analyzer (ASAP 2020, Micrometrics, Norcross, GA, United States). Before the analysis, all samples were degassed overnight at 200 °C. The specific surface area of the sample (SBET) was calculated according to the Brunauer, Emmett, Teller (BET) method from the linear part of the nitrogen adsorption isotherm [46]. The total pore volume (Vtot) was determined at P/P0 = 0.998.
The local atomic structure around Sn cations in the SnO2-containing clinoptilolite samples was analyzed by X-ray absorption spectroscopy. Sn K-edge EXAFS spectra of the samples were recorded at room temperature in the transmission detection mode at the P65 beamline of PETRA III, DESY, Hamburg, Germany.
The SnO2CLI5, SnO2CLI15, and SnO2CLI25 sample powders and crystalline SnO2 reference compounds were prepared as self-supporting homogenous pellets with total absorption thickness (µd) about 2 above the Sn K-edge. A Si (311) crystal monochromator was used with an energy resolution of about 3 eV at the Sn K-edge (29200 eV). Higher-order harmonics were removed by a flat Pt coated mirror placed in front of the monochromator. The intensity of the monochromatic X-ray beam was measured by three consecutive ionization detectors (5 cm long ionization chambers; the first filled with 400 mbar Kr and 600 mbar N2, the second and the third with 1000 mbar Kr). The samples were mounted on the sample holder placed between the first and second ionization detectors. The absorption spectra were measured in the energy region from −150 eV to +1000 eV relative to the Sn K-edge. In the edge region, equidistant energy steps of 0.25 eV were used, while in the EXAFS region, equidistant k steps of 0.03 Å−1 were collected. The exact energy calibration was established with simultaneous absorption measurement on a 20-micron thick Sn metal foil placed between the second and the third ionization chamber. The absolute energy reproducibility of the measured spectra was ±0.03 eV. The quantitative analysis of EXAFS spectra was performed with the IFEFFIT program package [47] in combination with the FEFF6 program code [34] for ab initio calculation of photoelectron scattering paths.
The pH of the point of zero charge of the samples was determined as follows: 0.4 g of the sample (CLI, SnO2, or SnO2-containing clinoptilolite) was suspended in 100 cm3 of deionized water and sonicated for 2 h. Then, the pH of the suspension was adjusted accordingly by adding either 0.1 mol dm−3 HCl or 0.1 mol dm−3 NaOH solutions. Zeta potential measurements were performed by using the Zetasizer nano ZS instrument (Malvern, Malvern, United Kingdom). The pH value of each suspension was measured using a digital pH meter (Mettler Toledo, Columbus, OH, United States).

3.3. Photocatalytic Tests

Photocatalytic activity of the CLI, SnO2, and SnO2-containing clinoptilolite was evaluated in a batch reactor of volume 50 cm3. The amount of catalyst in the reaction was set to 10 mg and the concentration of methylene blue (MB) as a model dye was 10 mg dm−3, i.e., 0.5 mg of the dye was present in the reaction system. The reaction mixture was illuminated with visible-light lamps with an intensity of 8 mW cm−2. The mixing of the system was provided by purging with O2 at 25 cm3 min−1 from the bottom of the cell (Figure S2).
First, 30 min of the dark period was monitored. Here the adsorption–desorption equilibrium was established. After that, the lights were turned on and the reaction was set to last for 3 h. In this part, the kinetics due to photocatalytic degradation of the dye could be evaluated and final removal assessed. The concentration of MB was measured spectrophotometrically, in the spectral range of 400–800 nm by UV Vis spectrophotometer (Agilent Technologies, Santa Clara, CA, United States) and measuring the absorbance at λmax of 664 nm for MB.
The effect of the photocatalyst amount was investigated by varying the amount of SnO2CLI15 (in the range of 7.5 to 40 mg). The photocatalytic test was performed using the procedure described in the previous section. For recycling tests, the used catalysts were first decanted and left to dry at room temperature. Then they were washed 3 times with 0.01 M HNO3 to desorb the residual MB from the surface. They were finally dried at 90 °C for 1 h prior to the subsequent catalytic cycle.

4. Conclusions

Natural zeolite clinoptilolite was successfully modified with Sn using a precipitation–deposition method. The resulting SnO2 nanoparticles were very small but formed aggregates of ~17 nm that were located on the surface of clinoptilolite without destroying the crystal structure of the zeolite. The composites were proven successful in degrading methylene blue dye even upon multiple recycling with acid treatment.
The increase in degradation efficiencies could be ascribed to the increased surface area with no destruction of the support due to the preferable location of SnO2-aggregates on the surface of the zeolite. Increased adsorption and also increased degradation with higher Sn loadings were due to more negative surface potential, which was induced by the interaction between the zeolite and SnO2.
These materials thus offer inexpensive and naturally abundant sources of catalysts able to operate under visible light illumination.

Supplementary Materials

The following are available online at https://0-www-mdpi-com.brum.beds.ac.uk/2073-4344/10/2/253/s1, Table S1. Chemical composition of the two clinoptilolites (wt.%) obtained by ICP-OES analysis, Table S2. Average elemental composition (wt.%) of CLI and SnO2-containing clinoptilolite obtained by the EDX analysis, Figure S1. EDX spectra of the as-synthesized SnO2 and SnO2-containing composites, Table S3. Parameters of the nearest coordination shells around Sn atoms in Sn-modified CLI zeolites and reference SnO2 compound with rutile crystal structure: N—the number of neighbor atoms, R—distance, σ2—Debye–Waller factors, and R-factor—the goodness of fit parameter. The amplitude reduction factor and a shift of energy origin of photoelectron were fit in all the samples, the average obtained values were S02 = 0.96 ± 0.09 eV and ΔEo= 2 ± 3 eV. Uncertainty of the last digit is given in parentheses, Figure S2. A sketch of the photocatalytic set-up (a), a closer look at the internal part of the reactor (b) and a photograph of the whole set-up (c). On the right, a 3D model of the reactor with one side open.

Author Contributions

Conceptualization A.Š.; methodology A.Š. and J.P.; formal analysis I.A.; investigation J.P.; writing—original draft preparation A.Š., J.P. and I.A.; writing—review and editing N.R. and N.N.T.; visualization A.Š.; supervision N.R. and N.N.T.; project administration N.R. and N.N.T.; funding acquisition N.R. and N.N.T. All authors have read and agree to the published version of the manuscript.

Funding

This research received no external funding.

Acknowledgments

This research was supported by the Slovenian Research Agency (P1-0112), and by the project CALIPSOplus under the Grant Agreement 730872 from the EU Framework Programme for Research and Innovation HORIZON 2020. We acknowledge access to SR facility at DESY, beamline P65 of PETRA III, Hamburg (project I-20170160 EC). We would like to thank Edmund Welter of PETRA III for expert advice on beamline operation.

Conflicts of Interest

The authors declare no conflict of interest.

References

  1. Asghar, A.; Abdul Raman, A.A.; Wan Daud, W.M.A. Advanced oxidation processes for in-situ production of hydrogen peroxide/hydroxyl radical for textile wastewater treatment: A review. J. Clean. Prod. 2015, 87, 826–838. [Google Scholar] [CrossRef] [Green Version]
  2. Holkar, C.R.; Jadhav, A.J.; Pinjari, D.V.; Mahamuni, N.M.; Pandit, A.B. A critical review on textile wastewater treatments: Possible approaches. J. Environ. Manag. 2016, 182, 351–366. [Google Scholar] [CrossRef]
  3. Al jibouri, A.K.H.; Wu, J.; Upreti, S.R. Continuous ozonation of methylene blue in water. J. Water Process Eng. 2015, 8, 142–150. [Google Scholar] [CrossRef]
  4. Nakata, K.; Fujishima, A. TiO2 photocatalysis: Design and applications. J. Photochem. Photobiol. C Photochem. Rev. 2012, 13, 169–189. [Google Scholar] [CrossRef]
  5. Dariani, R.S.; Esmaeili, A.; Mortezaali, A.; Dehghanpour, S. Photocatalytic reaction and degradation of methylene blue on TiO2 nano-sized particles. Optik 2016, 127, 7143–7154. [Google Scholar] [CrossRef]
  6. Štrbac, D.; Aggelopoulos, C.A.; Štrbac, G.; Dimitropoulos, M.; Novaković, M.; Ivetić, T.; Yannopoulos, S.N. Photocatalytic degradation of Naproxen and methylene blue: Comparison between ZnO, TiO2 and their mixture. Process Saf. Environ. Prot. 2018, 113, 174–183. [Google Scholar] [CrossRef]
  7. Palacios-Padrós, A.; Altomare, M.; Tighineanu, A.; Kirchgeorg, R.; Shrestha, N.K.; Díez-Pérez, I.; Caballero-Briones, F.; Sanz, F.; Schmuki, P. Growth of ordered anodic SnO2 nanochannel layers and their use for H2 gas sensing. J. Mater. Chem. A 2014, 2, 915–920. [Google Scholar] [CrossRef]
  8. Mohri, N.; Oschmann, B.; Laszczynski, N.; Mueller, F.; von Zamory, J.; Tahir, M.N.; Passerini, S.; Zentel, R.; Tremel, W. Synthesis and characterization of carbon coated sponge-like tin oxide (SnOx) films and their application as electrode materials in lithium-ion batteries. J. Mater. Chem. A 2016, 4, 612–619. [Google Scholar] [CrossRef]
  9. Bhattacharjee, A.; Ahmaruzzaman, M.; Devi, T.B.; Nath, J. Photodegradation of methyl violet 6B and methylene blue using tin-oxide nanoparticles (synthesized via a green route). J. Photochem. Photobiol. A Chem. 2016, 325, 116–124. [Google Scholar] [CrossRef]
  10. Vatanparast, M.; Taghizadeh, M.T. One-step hydrothermal synthesis of tin dioxide nanoparticles and its photocatalytic degradation of methylene blue. J. Mater. Sci. Mater. Electron. 2016, 27, 54–63. [Google Scholar] [CrossRef]
  11. Sadeghzadeh-Attar, A. Efficient photocatalytic degradation of methylene blue dye by SnO2 nanotubes synthesized at different calcination temperatures. Sol. Energy Mater. Sol. Cells 2018, 183, 16–24. [Google Scholar] [CrossRef]
  12. Godelitsas, A.; Armbruster, T. HEU-type zeolites modified by transition elements and lead. Microporous Mesoporous Mater. 2003, 61, 3–24. [Google Scholar] [CrossRef]
  13. Nezamzadeh-Ejhieh, A.; Khodabakhshi-Chermahini, F. Incorporated ZnO onto nano clinoptilolite particles as the active centers in the photodegradation of phenylhydrazine. J. Ind. Eng. Chem. 2014, 20, 695–704. [Google Scholar] [CrossRef]
  14. Bahrami, M.; Nezamzadeh-Ejhieh, A. Effect of the supported ZnO on clinoptilolite nano-particles in the photodecolorization of semi-real sample bromothymol blue aqueous solution. Mater. Sci. Semicond. Process. 2015, 30, 275–284. [Google Scholar] [CrossRef]
  15. Khodami, Z.; Nezamzadeh-Ejhieh, A. Investigation of photocatalytic effect of ZnO–SnO2/nano clinoptilolite system in the photodegradation of aqueous mixture of 4-methylbenzoic acid/2-chloro-5-nitrobenzoic acid. J. Mol. Catal. A Chem. 2015, 409, 59–68. [Google Scholar] [CrossRef]
  16. Derikvandi, H.; Nezamzadeh-Ejhieh, A. A comprehensive study on electrochemical and photocatalytic activity of SnO2-ZnO/clinoptilolite nanoparticles. J. Mol. Catal. A Chem. 2017, 426, 158–169. [Google Scholar] [CrossRef]
  17. Derikvandi, H.; Nezamzadeh-Ejhieh, A. Increased photocatalytic activity of NiO and ZnO in photodegradation of a model drug aqueous solution: Effect of coupling, supporting, particles size and calcination temperature. J. Hazard. Mater. 2017, 321, 629–638. [Google Scholar] [CrossRef]
  18. Lin, J.; Luo, Z.; Liu, J.; Li, P. Photocatalytic degradation of methylene blue in aqueous solution by using ZnO-SnO2 nanocomposites. Mater. Sci. Semicond. Process. 2018, 87, 24–31. [Google Scholar] [CrossRef]
  19. Gupta, V.K.; Saravanan, R.; Agarwal, S.; Gracia, F.; Khan, M.M.; Qin, J.; Mangalaraja, R.V. Degradation of azo dyes under different wavelengths of UV light with chitosan-SnO2 nanocomposites. J. Mol. Liq. 2017, 232, 423–430. [Google Scholar] [CrossRef]
  20. Mani, R.; Vivekanandan, K.; Subiramaniyam, N.P. Photocatalytic activity of different organic dyes by using pure and Fe doped SnO2 nanopowders catalyst under UV light irradiation. J. Mater. Sci. Mater. Electron. 2017, 28, 13846–13852. [Google Scholar] [CrossRef]
  21. Doula, M.K. Synthesis of a clinoptilolite-Fe system with high Cu sorption capacity. Chemosphere 2007, 67, 731–740. [Google Scholar] [CrossRef]
  22. Jiménez-Cedillo, M.J.; Olguín, M.T.; Fall, C. Adsorption kinetic of arsenates as water pollutant on iron, manganese and iron–manganese-modified clinoptilolite-rich tuffs. J. Hazard. Mater. 2009, 163, 939–945. [Google Scholar] [CrossRef]
  23. Matsuhashi, H.; Miyazaki, H.; Kawamura, Y.; Nakamura, H.; Arata, K. Preparation of a Solid Superacid of Sulfated Tin Oxide with Acidity Higher Than That of Sulfated Zirconia and Its Applications to Aldol Condensation and Benzoylation 1. Chem. Mater. 2001, 13, 3038–3042. [Google Scholar] [CrossRef]
  24. Kitabayashi, S.; Koga, N. Thermal Decomposition of Tin(II) Oxyhydroxide and Subsequent Oxidation in Air: Kinetic Deconvolution of Overlapping Heterogeneous Processes. J. Phys. Chem. C 2015, 119, 16188–16199. [Google Scholar] [CrossRef] [Green Version]
  25. Leung, S.; Barrington, S.; Zhao, X.; El-Husseini, B. Effect of particle size on physio-chemical properties of clinoptilolite as feed additive. Microporous Mesoporous Mater. 2006, 95, 48–56. [Google Scholar] [CrossRef]
  26. Elaiopoulos, K.; Perraki, T.; Grigoropoulou, E. Mineralogical study and porosimetry measurements of zeolites from Scaloma area, Thrace, Greece. Microporous Mesoporous Mater. 2008, 112, 441–449. [Google Scholar] [CrossRef]
  27. Farías, T.; Ruiz-Salvador, A.R.; Velazco, L.; de Ménorval, L.C.; Rivera, A. Preparation of natural zeolitic supports for potential biomedical applications. Mater. Chem. Phys. 2009, 118, 322–328. [Google Scholar] [CrossRef]
  28. Garcia-Basabe, Y.; Rodriguez-Iznaga, I.; de Menorval, L.-C.; Llewellyn, P.; Maurin, G.; Lewis, D.W.; Binions, R.; Autie, M.; Ruiz-Salvador, A.R. Step-wise dealumination of natural clinoptilolite: Structural and physicochemical characterization. Microporous Mesoporous Mater. 2010, 135, 187–196. [Google Scholar] [CrossRef]
  29. Selvi, N.; Sankar, S.; Dinakaran, K. Interfacial effect on the structural and optical properties of pure SnO2 and dual shells (ZnO; SiO2) coated SnO2 core-shell nanospheres for optoelectronic applications. Superlattices Microstruct. 2014, 76, 277–287. [Google Scholar] [CrossRef]
  30. Nezamzadeh-Ejhieh, A.; Zabihi-Mobarakeh, H. Heterogeneous photodecolorization of mixture of methylene blue and bromophenol blue using CuO-nano-clinoptilolite. J. Ind. Eng. Chem. 2014, 20, 1421–1431. [Google Scholar] [CrossRef]
  31. Kouvelos, E.; Kesore, K.; Steriotis, T.; Grigoropoulou, H.; Bouloubasi, D.; Theophilou, N.; Tzintzos, S.; Kanelopoulos, N. High pressure N2/CH4 adsorption measurements in clinoptilolites. Microporous Mesoporous Mater. 2007, 99, 106–111. [Google Scholar] [CrossRef]
  32. Moradi, M.; Karimzadeh, R.; Moosavi, E.S. Modified and ion exchanged clinoptilolite for the adsorptive removal of sulfur compounds in a model fuel: New adsorbents for desulfurization. Fuel 2018, 217, 467–477. [Google Scholar] [CrossRef]
  33. Nakamoto, K. Applications in Coordination Chemistry. In Infrared and Raman Spectra of Inorganic and Coordination Compounds; John Wiley & Sons, Inc.: Hoboken, NJ, USA, 2008; pp. 1–273. ISBN 9780470405888. [Google Scholar]
  34. Rehr, J.J.; Albers, R.C.; Zabinsky, S.I. High-order multiple-scattering calculations of x-ray-absorption fine structure. Phys. Rev. Lett. 1992, 69, 3397–3400. [Google Scholar] [CrossRef]
  35. Haines, J.; Léger, J.M. X-ray diffraction study of the phase transitions and structural evolution of tin dioxide at high pressure:ffRelationships between structure types and implications for other rutile-type dioxides. Phys. Rev. B 1997, 55, 11144–11154. [Google Scholar] [CrossRef]
  36. Nakamoto, K. Infrared and Raman Spectra of Inorganic and Coordination Compounds, 6th ed.; John Wiley & Sons, Inc.: Hoboken, NJ, USA, 2008; ISBN 9780470405840. [Google Scholar]
  37. Breck, D.W. Zeolite Molecular Sieves: Structure, Chemistry, and Use; Wiley: Hoboken, NJ, USA, 1974; ISBN 0471099856. [Google Scholar]
  38. Yener, H.B.; Yılmaz, M.; Deliismail, Ö.; Özkan, S.F.; Helvacı, Ş.Ş. Clinoptilolite supported rutile TiO2 composites: Synthesis, characterization, and photocatalytic activity on the degradation of terephthalic acid. Sep. Purif. Technol. 2017, 173, 17–26. [Google Scholar] [CrossRef]
  39. Rodriguez-Santiago, V.; Fedkin, M.V.; Wesolowski, D.J.; Rosenqvist, J.; Lvov, S.N. Electrophoretic Study of the SnO2 /Aqueous Solution Interface up to 260 °C. Langmuir 2009, 25, 8101–8110. [Google Scholar] [CrossRef]
  40. Jeevarathinam, A.S.; Lemaster, J.E.; Chen, F.; Zhao, E.; Jokerst, J.V. Photoacoustic Imaging Quantifies Drug Release from Nanocarriers via Redox Chemistry of Dye-Labeled Cargo. Angew. Chemie Int. Ed. 2020, 59, 2–8. [Google Scholar]
  41. Kayser, R.H.; Young, R.H. The photoreduction of methylene blue by amines—I. A flash photolysis study of the reaction between triplet methylene blue and amines. Photochem. Photobiol. 1976, 24, 395–401. [Google Scholar] [CrossRef]
  42. Mills, A.; Wang, J. Photobleaching of methylene blue sensitised by TiO2: An ambiguous system? J. Photochem. Photobiol. A Chem. 1999, 127, 123–134. [Google Scholar] [CrossRef]
  43. Awala, H.; Leite, E.; Saint-Marcel, L.; Clet, G.; Retoux, R.; Naydenova, I.; Mintova, S. Properties of methylene blue in the presence of zeolite nanoparticles. New J. Chem. 2016, 40, 4277–4284. [Google Scholar] [CrossRef]
  44. Vermesse, J.; Vidal, D.; Malbrunot, P. Gas Adsorption on Zeolites at High Pressure. Langmuir 1996, 12, 4190–4196. [Google Scholar] [CrossRef]
  45. Sowmiya, M.; Sharma, A.; Parsodkar, S.; Mishra, B.G.; Dubey, A. Nanosized sulfated SnO2 dispersed in the micropores of Al-pillared clay as an efficient catalyst for the synthesis of some biologically important molecules. Appl. Catal. A Gen. 2007, 333, 272–280. [Google Scholar] [CrossRef]
  46. Thommes, M.; Kaneko, K.; Neimark, A.V.; Olivier, J.P.; Rodriguez-Reinoso, F.; Rouquerol, J.; Sing, K.S.W. Physisorption of gases, with special reference to the evaluation of surface area and pore size distribution (IUPAC Technical Report). Pure Appl. Chem. 2015, 87, 1051–1069. [Google Scholar] [CrossRef] [Green Version]
  47. Ravel, B.; Newville, M. ATHENA, ARTEMIS, HEPHAESTUS: Data analysis for X-ray absorption spectroscopy using IFEFFIT. J. Synchrotron Radiat. 2005, 12, 537–541. [Google Scholar] [CrossRef] [Green Version]
Figure 1. XRD patterns of SnO2 from database (SnO2-Rutile), pure SnO2 (SnO2 synthesized), pure clinoptilolite (Clinoptilolite), and SnO2-containing clinoptilolite with different SnO2 concentrations (SnO2CLI05, SnO2CLI15, SnO2CLI25).
Catalysts 10 00253 g001
Figure 2. TG/DTG (weight loss/differential of weight loss) curve of non-calcined (a) SnO2, (b) TG curves of SnO2-containing clinoptilolite, and (c) DTG curves of SnO2-containing clinoptilolite.
Catalysts 10 00253 g002
Figure 3. Diffuse reflectance spectroscopy (DRS) UV/Vis spectra of (a) SnO2 and (b) clinoptilolite (CLI) and SnO2-clinoptilolite CLI.
Catalysts 10 00253 g003
Figure 4. FE-SEM images of (a) CLI, (b) SnO2, (c) SnO2CLI05, (d) SnO2CLI15, and (e) SnO2CLI25.
Catalysts 10 00253 g004
Figure 5. Adsorption/desorption isotherms of the CLI, SnO2, and SnO2-containing clinoptilolite samples.
Catalysts 10 00253 g005
Figure 6. Fourier transform magnitudes of the k3-weighted Sn EXAFS spectra of Sn-modified CLI zeolites and reference SnO2 compound with a rutile crystal structure, calculated in the R range of 1.2–4.0 Å and in the k range of 4.5–14.5 Å-1 (black solid line—experiment, red dashed line—EXAFS model).
Catalysts 10 00253 g006
Figure 7. Attenuated total reflection (ATR)-FTIR spectra of (a) SnO2 and (b) SnO2-containing clinoptilolite. In (c) a closer range (1400–800 cm−1) is shown.
Catalysts 10 00253 g007
Figure 8. Surface charges of CLI, SnO2, and SnO2-containing clinoptilolite samples.
Catalysts 10 00253 g008
Figure 9. Methylene blue (MB) photodegradation by using CLI, SnO2, and SnO2-containing clinoptilolite (a) and representation of the results with bars showing adsorption and degradation phase (b). Reaction conditions: mcat = 10 mg, V = 50 cm3, O2 flow = 25 cm3 min−1, T = 22 °C, C0 = 10 mg dm3.
Catalysts 10 00253 g009
Figure 10. Photodegradation of MB by using a different amount of SnO2CLI25. (a) Temporal profile of MB concentration with different amounts of the catalyst and (b) values of rate constants versus the catalyst mass. The beginning of the illumination phase is marked by a dashed line. Reaction conditions: V = 50 cm3, O2 flow = 25 cm3 min−1, T = 22 °C, C0 = 10 mg dm−3.To separate the adsorption process from the catalytic degradation, a kinetic analysis of the illumination part was conducted. The kinetics was fitted to the equation:
Catalysts 10 00253 g010
Figure 11. Regeneration process of the catalysts. (a) desorption of MB dye from the spent catalyst (SnO2CLI25), (b) ATR-FTIR spectra of fresh SnO2CLI25 (black), and used SnO2CLI25 (red), and (c) SEM image of SnO2CLI25 after the photocatalytic reaction.
Catalysts 10 00253 g011
Figure 12. Reusability of the photocatalyst SnO2CLI25 in photodegradation of MB. The illumination part of the reaction, right of the dashed line, is fitted to Equation. 1 with a blue solid line. Reaction conditions: V = 50 cm3, O2 flow = 25 cm3 min−1, T = 22 °C, C0 = 10 mg dm−3, mcat = 10 mg.
Catalysts 10 00253 g012
Table 1. Average elemental composition (at.%) of clinoptilolite (CLI) and SnO2-containing clinoptilolite obtained by the energy-dispersive X-ray (EDX) analysis. For clarity, Sn contents are shown also as wt.%.
CLISnO2CLI05SnO2CLI15SnO2CLI25
O68.6970.271.5772.89
Mg0.72---
Al4.73.523.142.91
Si23.6825.4623.3421.31
Na/0.110.080.04
K0.450.040.020.02
Ca1.340.040.060.06
Fe0.420.110.040.03
Sn-0.521.752.74
Sn(wt.%)-3.049.8914.93
Si/Al57.27.47.3
Table 2. Textural properties of the samples.
SampleSBET1, m2 g−1Sext2, m2 g−1Vt3, m3 g−1d4, Å
CLI2422.1290.0988162.58
SnO2CLI053632.4210.1266146.87
SnO2CLI156261.1790.1562134.48
SnO2CLI257878.5450.1712105.83
SnO24748.6490.1889136.73
1 specific surface area based on Brunauer, Emmett, Teller (BET) theory determined in the P/Po range corresponding to the increasing trend of Rouquerol plot; 2 external surface area SBET–Smic; 3total pore volume based on Barrett, Joyner and Halenda (BJH) adsorption analysis; 4average pore size based on BJH desorption analysis.

