Article

Dispersion of Defects in TiO2 Semiconductor: Oxygen Vacancies in the Bulk and Surface of Rutile and Anatase

by
Mohammadreza Elahifard
1,*,
Mohammad Reza Sadrian
2,*,
Amir Mirzanejad
3,
Reza Behjatmanesh-Ardakani
4 and
Seyedsaeid Ahmadvand
3
1
Department of Chemical Engineering, Faculty of Engineering, Ardakan University, Ardakan 89, Iran
2
Department of Physics, University of Nevada, Reno, NV 89557, USA
3
Department of Chemistry, University of Nevada, Reno, NV 89557, USA
4
Department of Chemistry, Payame Noor University, Tehran 19395-3697, Iran
*
Authors to whom correspondence should be addressed.
Submission received: 24 February 2020 / Revised: 29 March 2020 / Accepted: 31 March 2020 / Published: 3 April 2020

Abstract

:
Oxygen deficiency (O-vacancy) contributes to the photoefficiency of TiO2 semiconductors by generating electron rich active sites. In this paper, the dispersion of O-vacancies in both bulk and surface of anatase and rutile phases was computationally investigated. The results showed that the O-vacancies dispersed in single- and double-cluster forms in the anatase and rutile phases, respectively, in both bulk and surface. The distribution of the O-vacancies was (roughly) homogeneous in anatase, and heterogenous in rutile bulk. The O-vacancy formation energy, width of defect band, and charge distribution indicated the overlap of the defect states in the rutile phase and thus eased the formation of clusters. Removal of the first and the second oxygen atoms from the rutile surface took less energy than the anatase one, which resulted in a higher deficiency concentration on the rutile surface. However, these deficiencies formed one active site per unit cell of rutile. On the other hand, the first O-vacancy formed on the surface and the second one formed in the subsurface of anatase (per unit cell). Supported by previous studies, we argue that this distribution of O-vacancies in anatase (surface and subsurface) could potentially create more active sites on its surface.

1. Introduction

Nonstoichiometric titanium dioxide (TiO2) has drawn broad interest due to its important role in photocatalysis, solar cells, and environmental procedures [1,2,3,4,5,6,7,8,9]. Under various experimental conditions, a broad range of O-vacancies can be formed in TiO2 (bulk and surface), i.e., 5–10% [10]. Inducing large effects on the electronic, photonic, and photocatalytic properties of TiO2, oxygen deficiencies are critical features [11,12,13]. Rutile and anatase are two widely used phases of TiO2, anatase being the more photocatalytically efficient for reasons that are not fully understood [14,15]. In addition to the intrinsic natures of the aforementioned phases, energetics, concentration, and location of O-vacancies could be significant factors in their photocatalytic activity. While surficial oxygen vacancies directly introduce active sites for the photocatalytic process, such as water dissociation and oxygen adsorption, the bulk ones could also affect surface activities [10].
Having a looser and more flexible structure, anatase has been reported to have higher O-vacancy concentration and thus higher photocatalytic activity based on ultraviolet photoemission spectroscopy (UPS) results [16]. However, many other experimental results have indicated a lower concentration of O-vacancy on the surface of anatase compared to rutile [17,18]. Elsewhere, similar concentrations of O-vacancy defects in the two polymorphs has been reported, based on elemental analysis [19]. A majority of experimental studies, however, suggest a higher surface/bulk ratio of O-vacancy in rutile [10,20]. Inferred from calorimetric measurements, it has been claimed that the lower density of surficial O-vacancies in anatase is consistent with its higher surface stability [21].
Mostly using density functional theory (DFT), theoretical studies have suggested that sub-surface positions are more favorable [22,23]. Theory has also shown that O-vacancies cannot diffuse to the surface of anatase [24]. Although O-vacancies have been vastly modeled in anatase and rutile [25,26,27,28,29,30,31,32,33,34,35,36,37,38,39,40,41], to the best of the authors’ knowledge, theoretical studies have not considered/compared double O-vacancy structures of rutile and anatase.
To shed more light on the existing controversy, this study investigated the dispersion of O-vacancies in the bulk and surface of anatase and rutile. To this end, single O-vacancies and their effects were computationally studied and compared with those of double O-vacancies. Being methodologically consistent, all geometrically unique arrangements were simulated for single/double O-vacancy structures using full potential DFT calculations.

2. Computational Details

Anatase and rutile TiO2 have tetragonal structures with the space groups of D 4 h 14 p 4 2 / m n m and C 4 h 19 I 4 1 / a m d , respectively. The optimized lattice constants of the bulk structures are a = b = 4.594 Å and c = 2.96 Å for rutile and a = b = 3.785 Å and c = 9.51 Å for anatase phase, with a margin of less than 1% compared to the experimental values. For both perfect and defective states, 2 × 2 × 1 and 2 × 2 × 2 supercells for anatase and rutile were used. First-principle calculations using full potential periodic DFT and generalized gradient approximations (GGA) were employed to find the most stable structures. The revised form of Pardew, Burke, and Ernzerh (rPBE) level of theory, implemented in FHI aims program [42], was used to optimize pure and defective supercells. As an alternative, hybrid functionals such as Heyd–Scuseria–Ernzerhof (HSE) were used, along with plain DFT, to reproduce accurate defect states and band gaps, and to compensate for the lack of electron self-interaction and derivative discontinuity. The criteria for the convergence of energy and force were set to 5 × 10⁻⁶ eV and 0.01 eV/Å, respectively. K-grids of 4 × 4 × 6 and 6 × 6 × 2 were used to model the first Brillouin zone for rutile and anatase unit cells, respectively. Modeling was performed for different defective structures to study the size effects (Ti8O16, Ti16O32, Ti32O64, and Ti64O128), and eventually the primitive cells Ti16O32, Ti16O31 and Ti16O30 were used to simulate the perfect and single/double O-vacancy structures, respectively. For the defective structures, one and two O atoms were eliminated from the super cell, resulting in 6.25% at. and 12.5% at. concentrations of the O-vacancy. To study the effects of O-vacancy on the electronic structure of the aforementioned structures, partial density of states pDOS was calculated using the hybrid method HSE06 (with 25% admixture of HF exchange) and rPBE. Grids of 12 × 12 × 18 and 18 × 18 × 6 k-points were used for integrating the first Brillouin zone during density of states (DOS) calculations of rutile and anatase, respectively. A periodic slab model of 2 × 2 and 2 × 3 surface unit cells of rutile (110) and anatase (101), as their most stable surfaces, with a vacuum of 15 Å was considered in all simulations. The rutile slab, including 64 oxygen and 32 titanium atoms, was made of four layers of O-Ti-O, and therefore 12 atomic layers. The anatase slab was made of 48 oxygen and 24 titanium atoms.

3. Results and Discussion

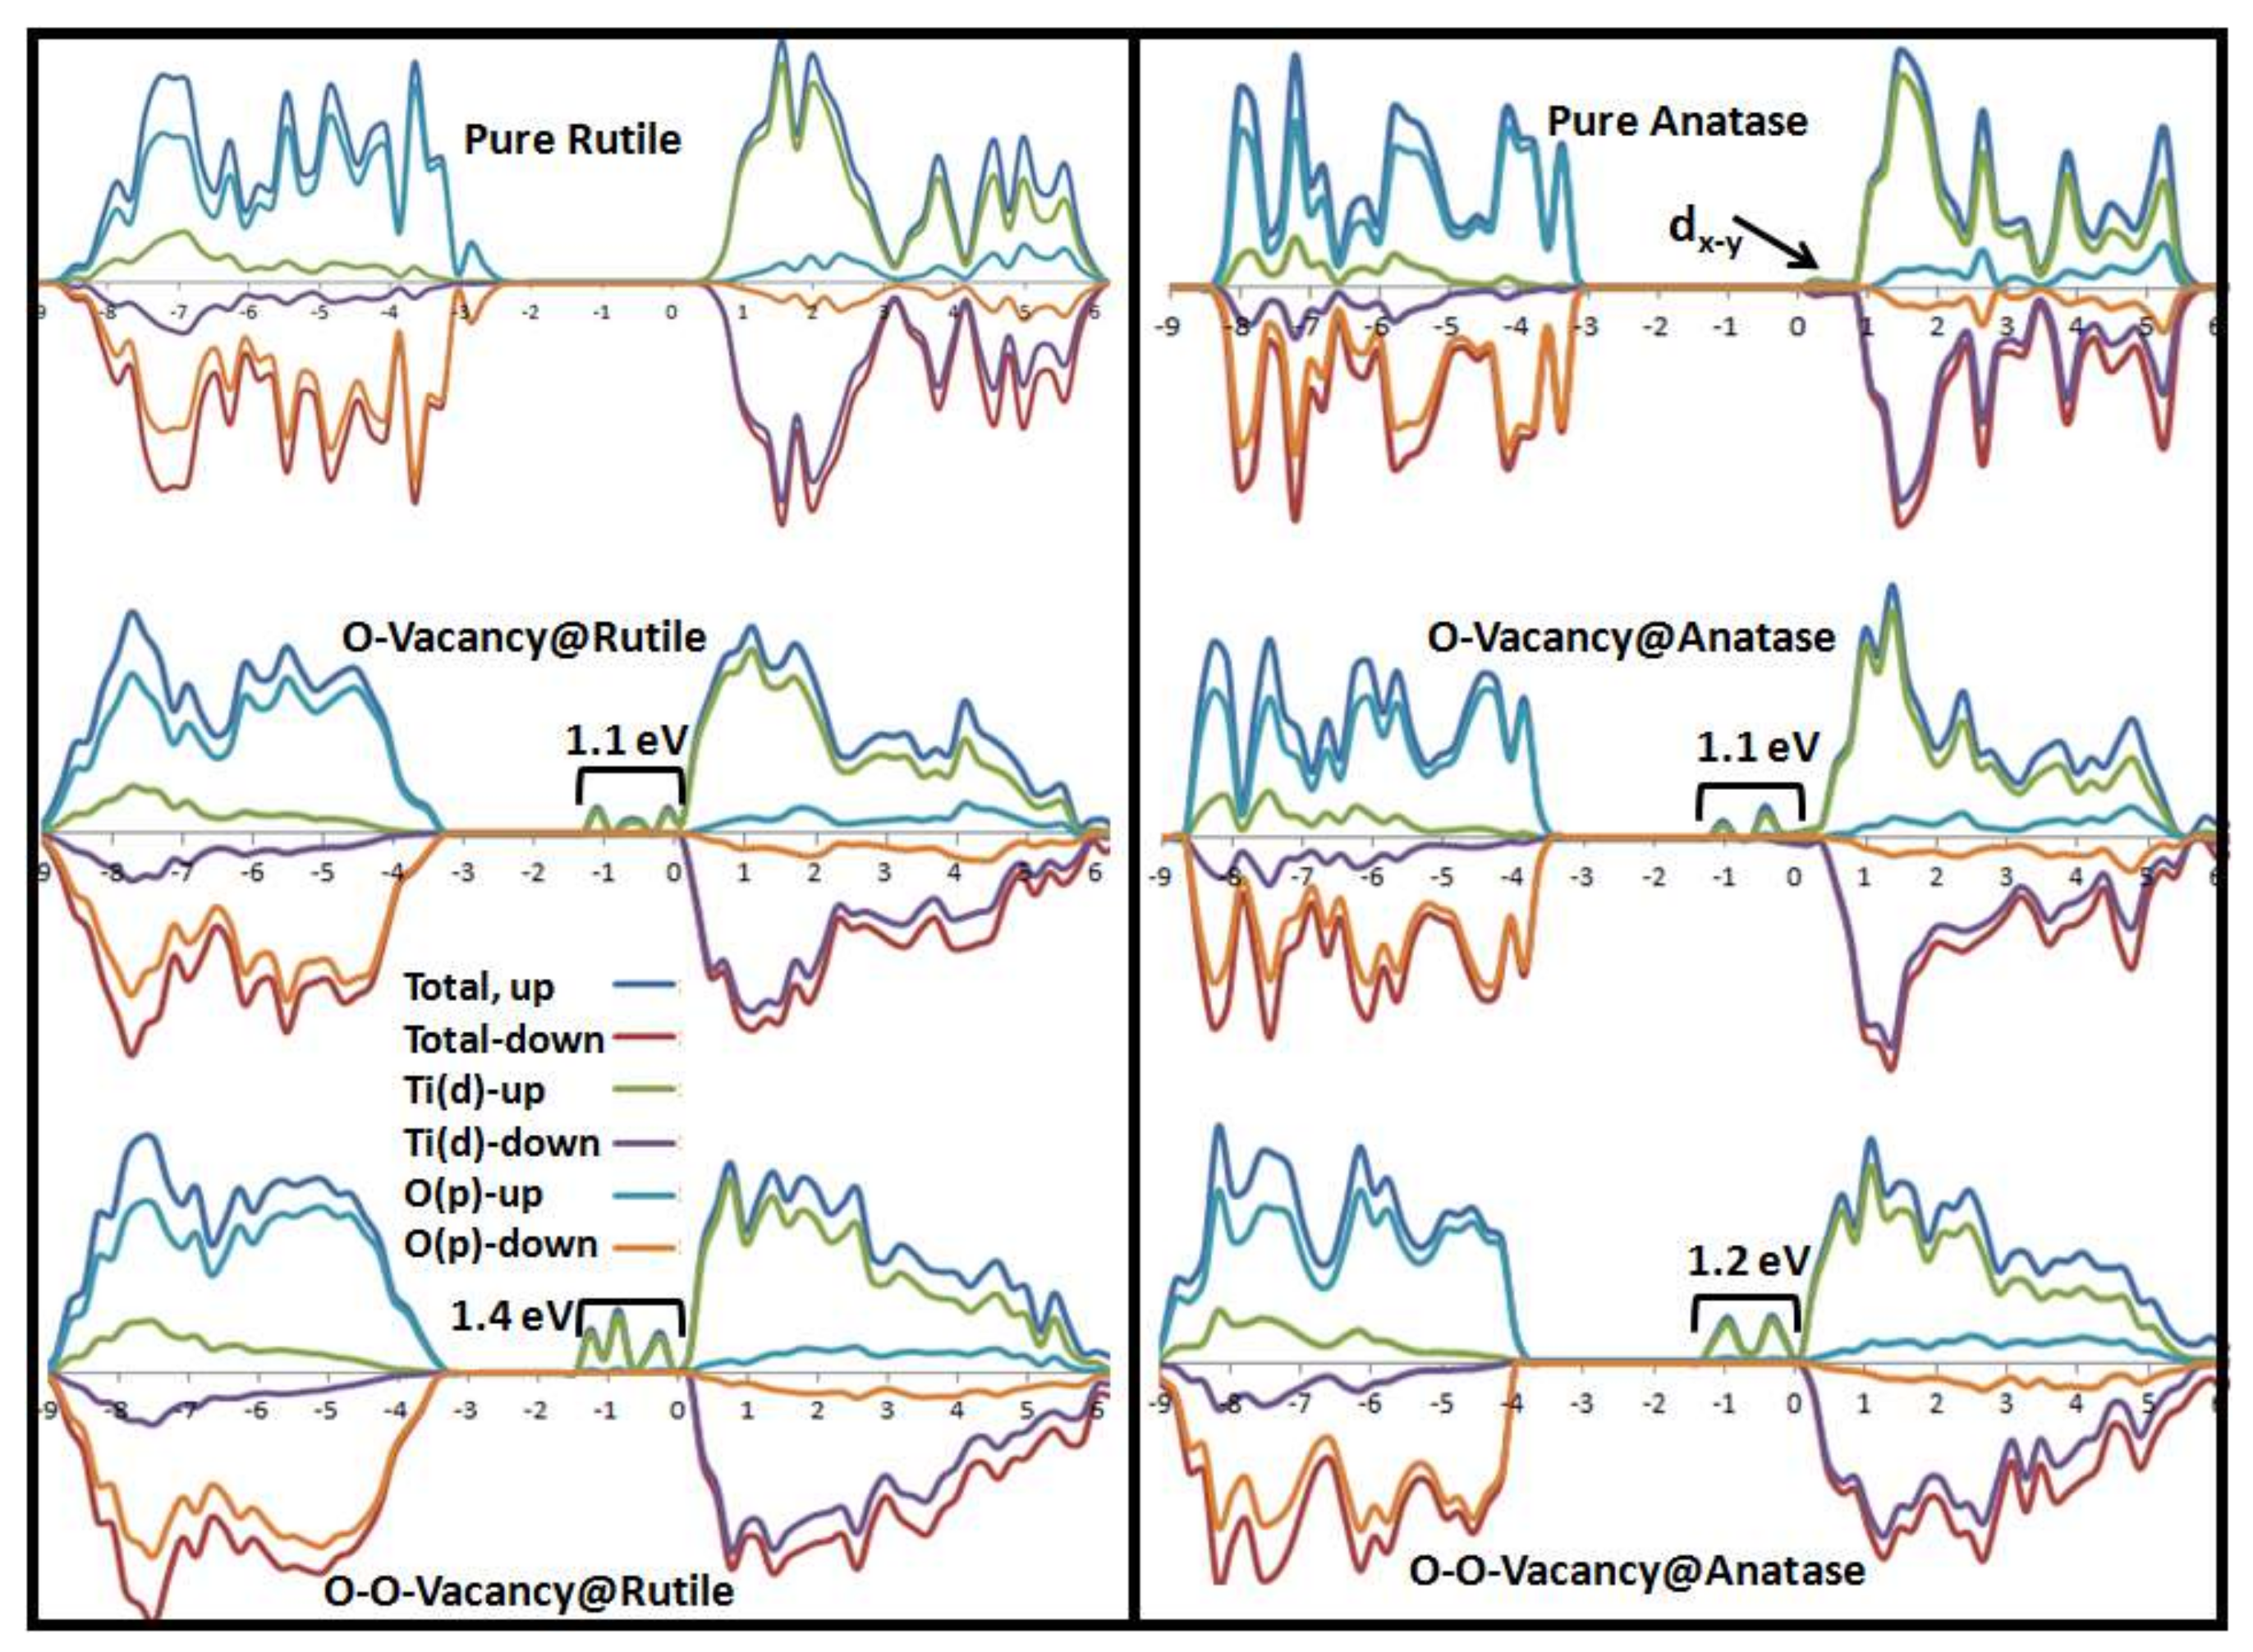
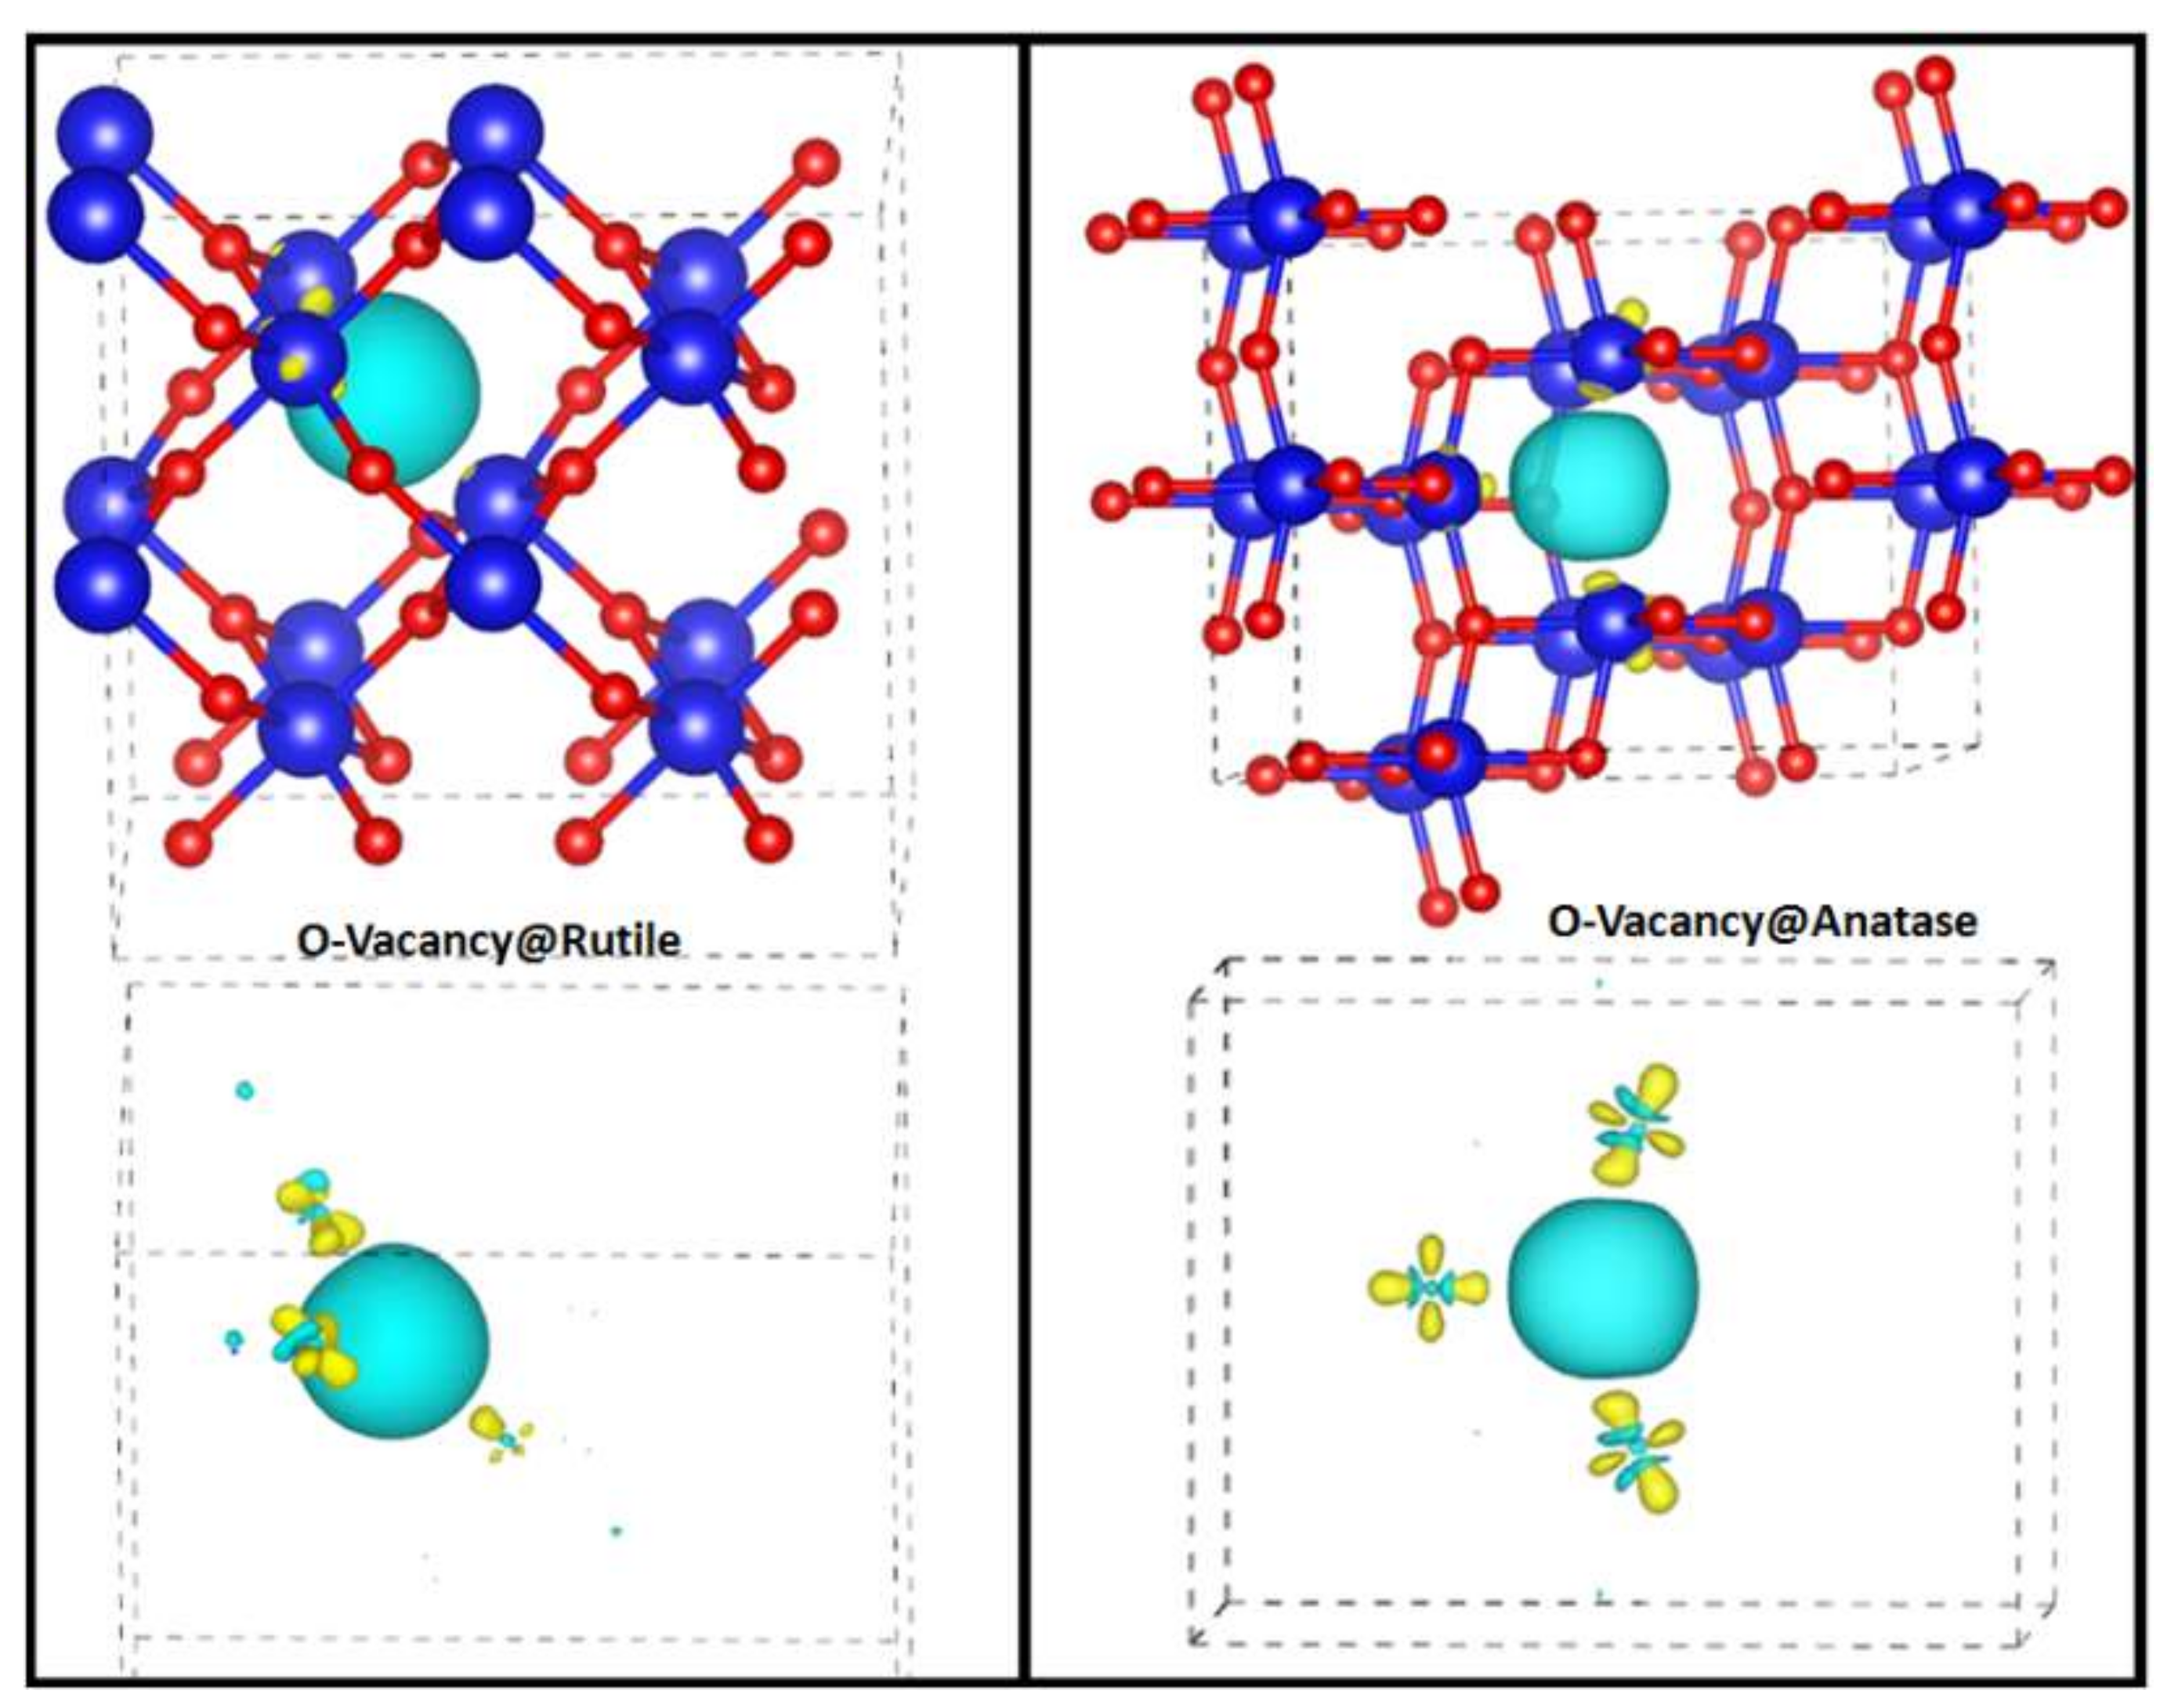
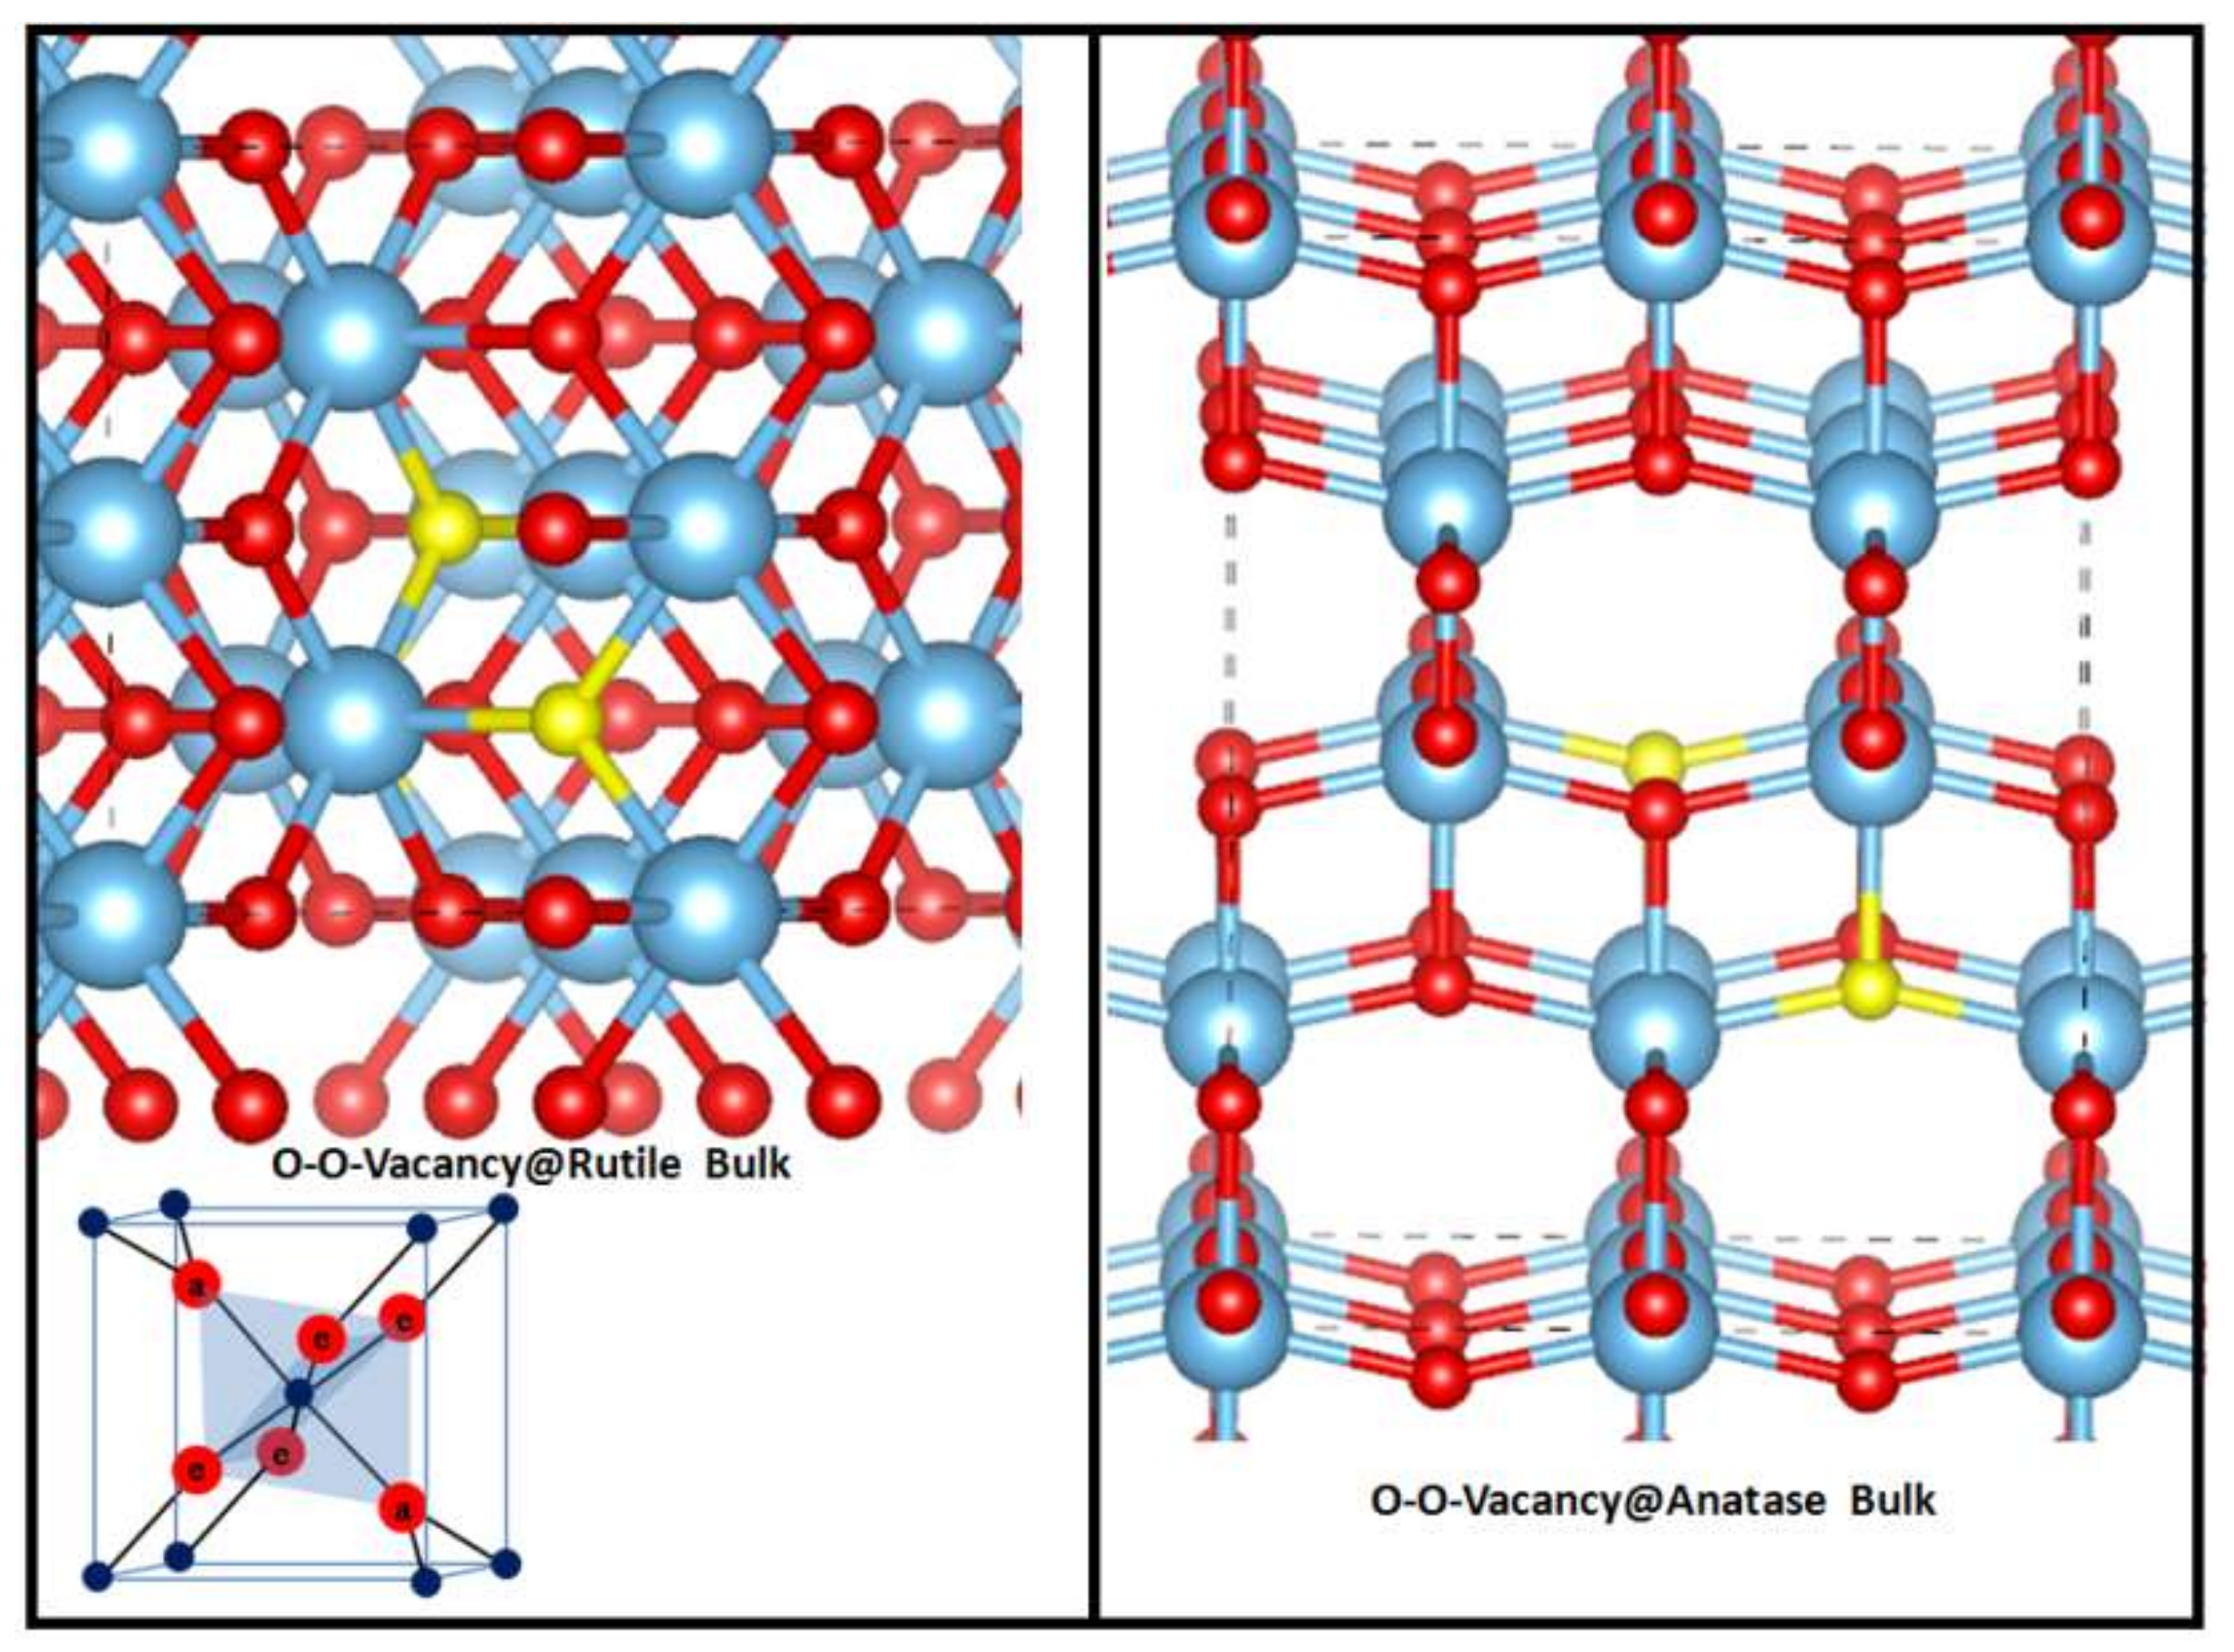
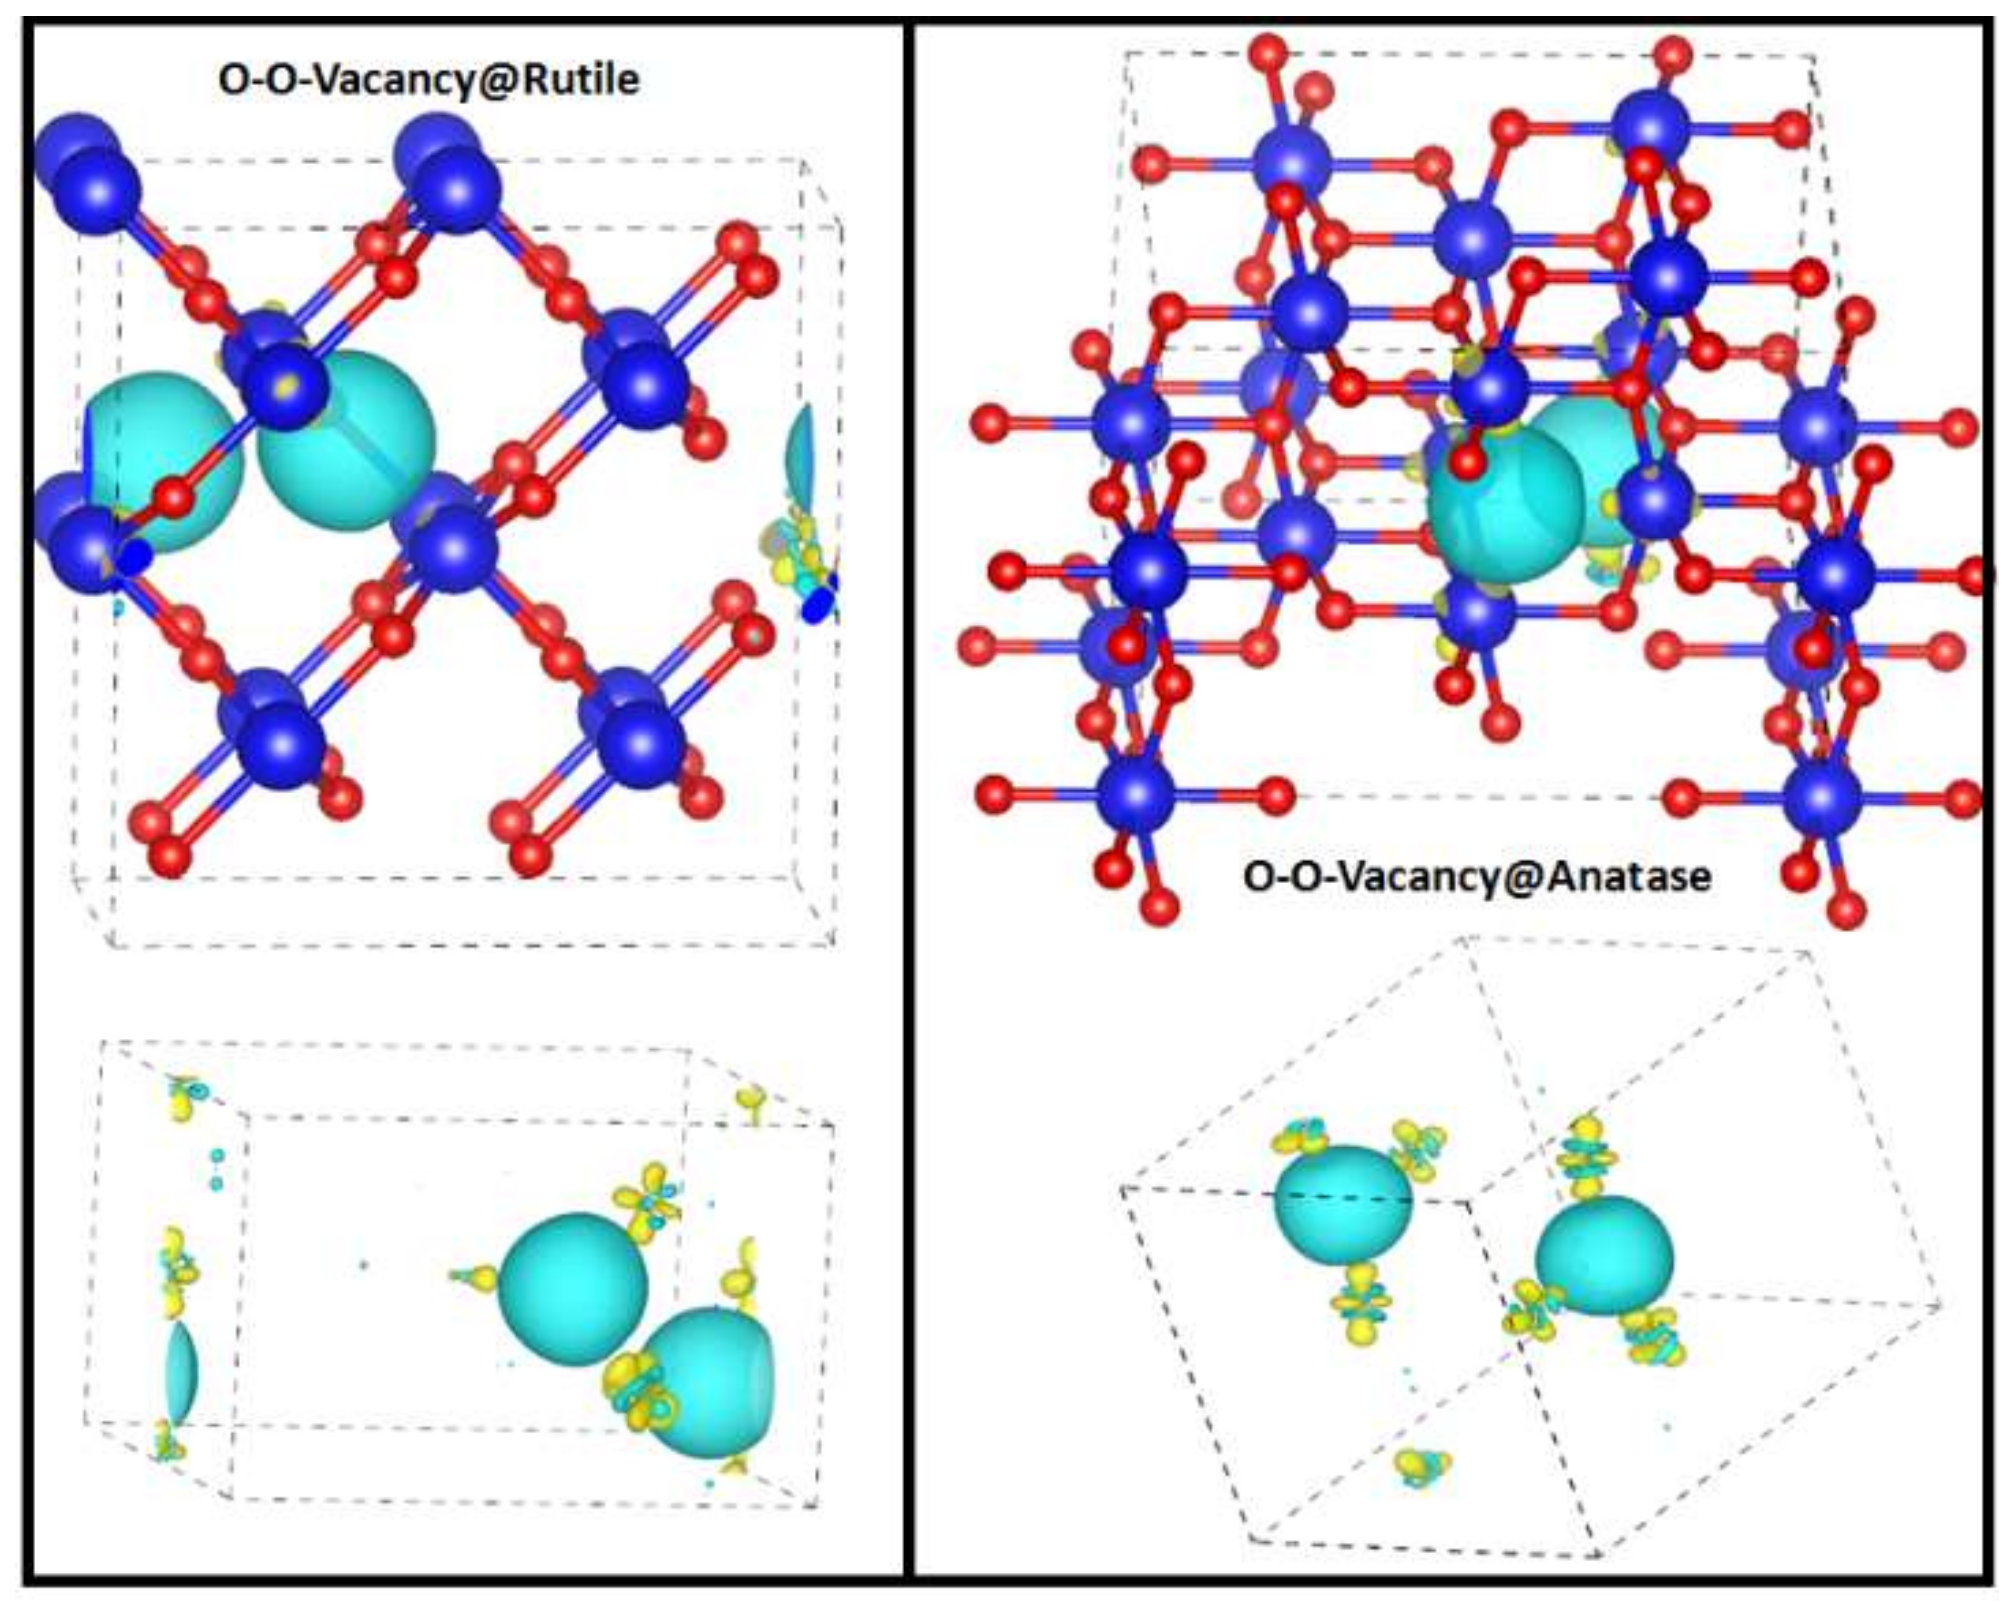
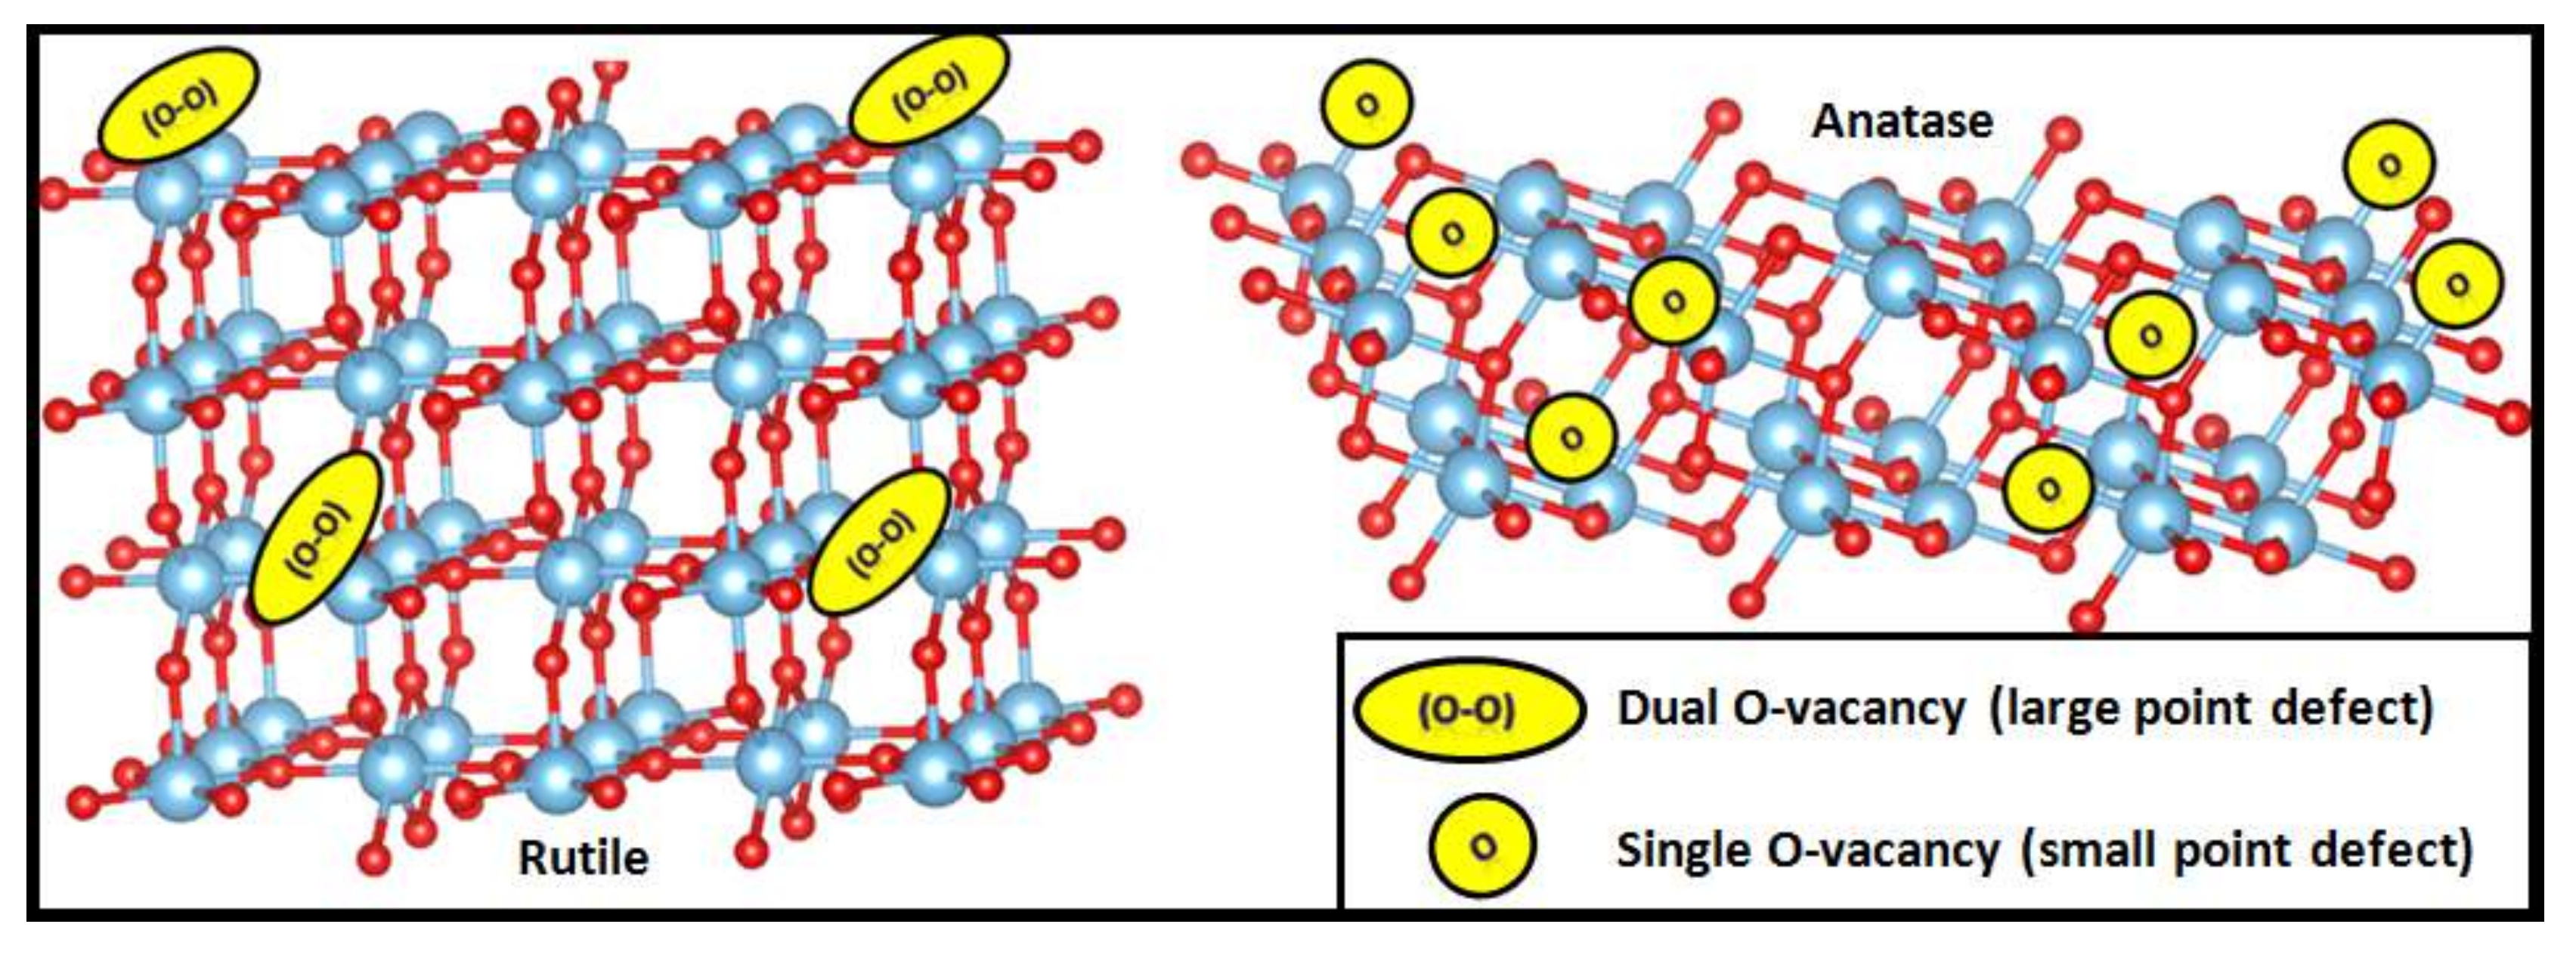
3.1. O-Vacancy in the Bulk Structure of Rutile and Anatase

Single O-vacancy TiO2 anatase and rutile bulk structures have been frequently studied both theoretically and experimentally [25,26,27,28,29,30,31,32]. It has been demonstrated that oxygen deficiency induces some charge on the two Ti atoms next to the vacancy position, and that the resulting occupied states appeared near the conduction band [33,34]. This has been evaluated here in detail via pDOS and charge dispersion calculations. Figure 1 shows the pDOS patterns of pure and single O-vacancy of anatase and rutile structures, which clearly represented the main contribution of O 2p and Ti 3d orbitals in the valance and conduction bands, respectively. This was in a close agreement with previous results [38,39,40,41], for the defect states of anatase and rutile. The band gap, regardless of defect states, increased by generation of oxygen defect from 3 to 3.4 eV in rutile, and from 3.2 to 3.6 eV in anatase structures, similar to our previous study [43]. However, the calculated band gap energies were 0.12, 0.63, and 1.13 eV for rutile and 0.44 and 1.1 eV for anatase, with respect to defect states (Figure 1).
The charge transfer from oxygen deficiency was visualized by taking the corresponding difference in electron densities. Figure 2 exhibits the main released charge from a single O-vacancy that was localized on the two and three nearest Ti atoms to the defect position in rutile and in anatase, respectively.
Finally, the single O-vacancy formation energy was calculated using Equation (1).
Eformation = E(O-vacancy) − E(prefect) + nμO
where E formation, E (O-vacancy), and E (prefect) are the formation energy, super cell energy with a single O-vacancy, and the perfect super cell energy, respectively. The parameter n is the number of vacancies and μO is the chemical potential of O that is half of the total energy of an isolated oxygen molecule. The results give formation energies of 6.42 and 6.49 eV for 48-atom supercells of anatase and rutile phases with a single O-vacancy, respectively. Lower defect formation energy of anatase could be justified by its more flexible structure [22]. Removal of one oxygen molecule from 24, 48, 96, and 192 atom supercells of anatase and rutile bulk created concentrations of 12.5%, 6.25%, 3.12%, and 1.56% at. O-vacancy, respectively. The formation energy of the single O-vacancy structure diminished by increasing the size of the unit cell in the bulk of anatase and rutile, e.g., 6.6 eV (12.5%), 6.4 eV (6.25%), 6.2 eV (3.12%), and 5.2 eV (1.56%) for anatase phase, similar to previous studies [23].
Based on our previous study, a metal-metal impurity prefers a heterogeneous dispersion in the bulk of anatase and rutile [44]. In addition, large defect points in sub-stoichiometric TiO2 have been observed experimentally, representing the presence of cluster defects structures [10,20]. A preferred double arrangement of O-O clusters in the bulk of anatase and rutile created 11 unique forms of clusters out of 496 possible structures in one unit of the super cell. Entropic principle requires O-O-vacancies to be homogeneously dispersed, taking the maximum possible distance from one another. However, the calculated results showed that a heterogeneous dispersion of defects is preferred in rutile bulk and surface. The O-O distances and relative energies for different arrangements are listed in Table 1. Accordingly, there was no significant correlation between the O-O distance and the crystal structure stability. The most stable configurations of O-O in anatase and rutile bulks, with a respective distance of 3.8 and 2.8 Å, are shown in Figure 3.
These defects were located around the same Ti atom; one at the equatorial position and the other at the axial position in the octahedral arrangement of O atoms around the Ti atom in the rutile phase (Figure 3). These results were also doubly confirmed by the ABINIT code [45] in this study.
Formation energy of the double was expected to be more than twice that of the single O-vacancy of rutile; however, the elimination energy of the second O (6.1 eV) was easier than the first one (6.5 eV). This indicated an overlap between the defect states generated by the O-vacancies in TiO2 rutile structure. In contrast, O-vacancies behaved independently in the anatase bulk and had larger distances, whereas the formation energy of the double O-vacancy (12.65 eV) was around twice that of the single one (6.4 eV). This could have been due to the fact that the local structure of rutile (D4h) was more stable than that of anatase (D2d), which provided shorter Ti-Ti distances and a denser phase, leading to an easier overlap between orbitals. Accordingly, based on the pDOS calculations, the lowest energy states lay at the bottom of the conduction band, consisting of plain Ti-dxy orbitals in anatase with non-bonding character (Figure 1) [46]. However, the main contributors to the lowest region of the conduction band in rutile consisted of Ti-dxy and O-2p orbitals with anti-bonding character [47]. Therefore, a shorter Ti-Ti distance in the case of double O-vacancy in the rutile phase may have provided a better overlap between neighboring Ti-3d orbitals, which lessened the ground state energy.
The hybrid methods were also used to explore the effect of increasing the concentration of the O-vacancies and the interactions between them in the TiO2 super cells. Based on the HS06 results, the presence of two O-vacancies increased the occupied 3d defect states in the band gap for both anatase and rutile phases (Figure 1). As is shown, the defect states of the two O-vacancies occupied a width of 1.2 eV and 1.4 eV for anatase and rutile, respectively, inside the gap bellow the conduction band. A comparison of the defect bands of the single defect structures, with a width of 1.1 eV (Figure 1), showed an overlap between the O-vacancy defect states in the rutile phase, where molecules arranged tightly. In the anatase phase, the transferred charges from each defect were independently localized on the three nearest Ti atoms, while two O-vacancies in rutile acted as a large defect point, their charges were localized on the three nearest Ti atoms as well (Figure 4).

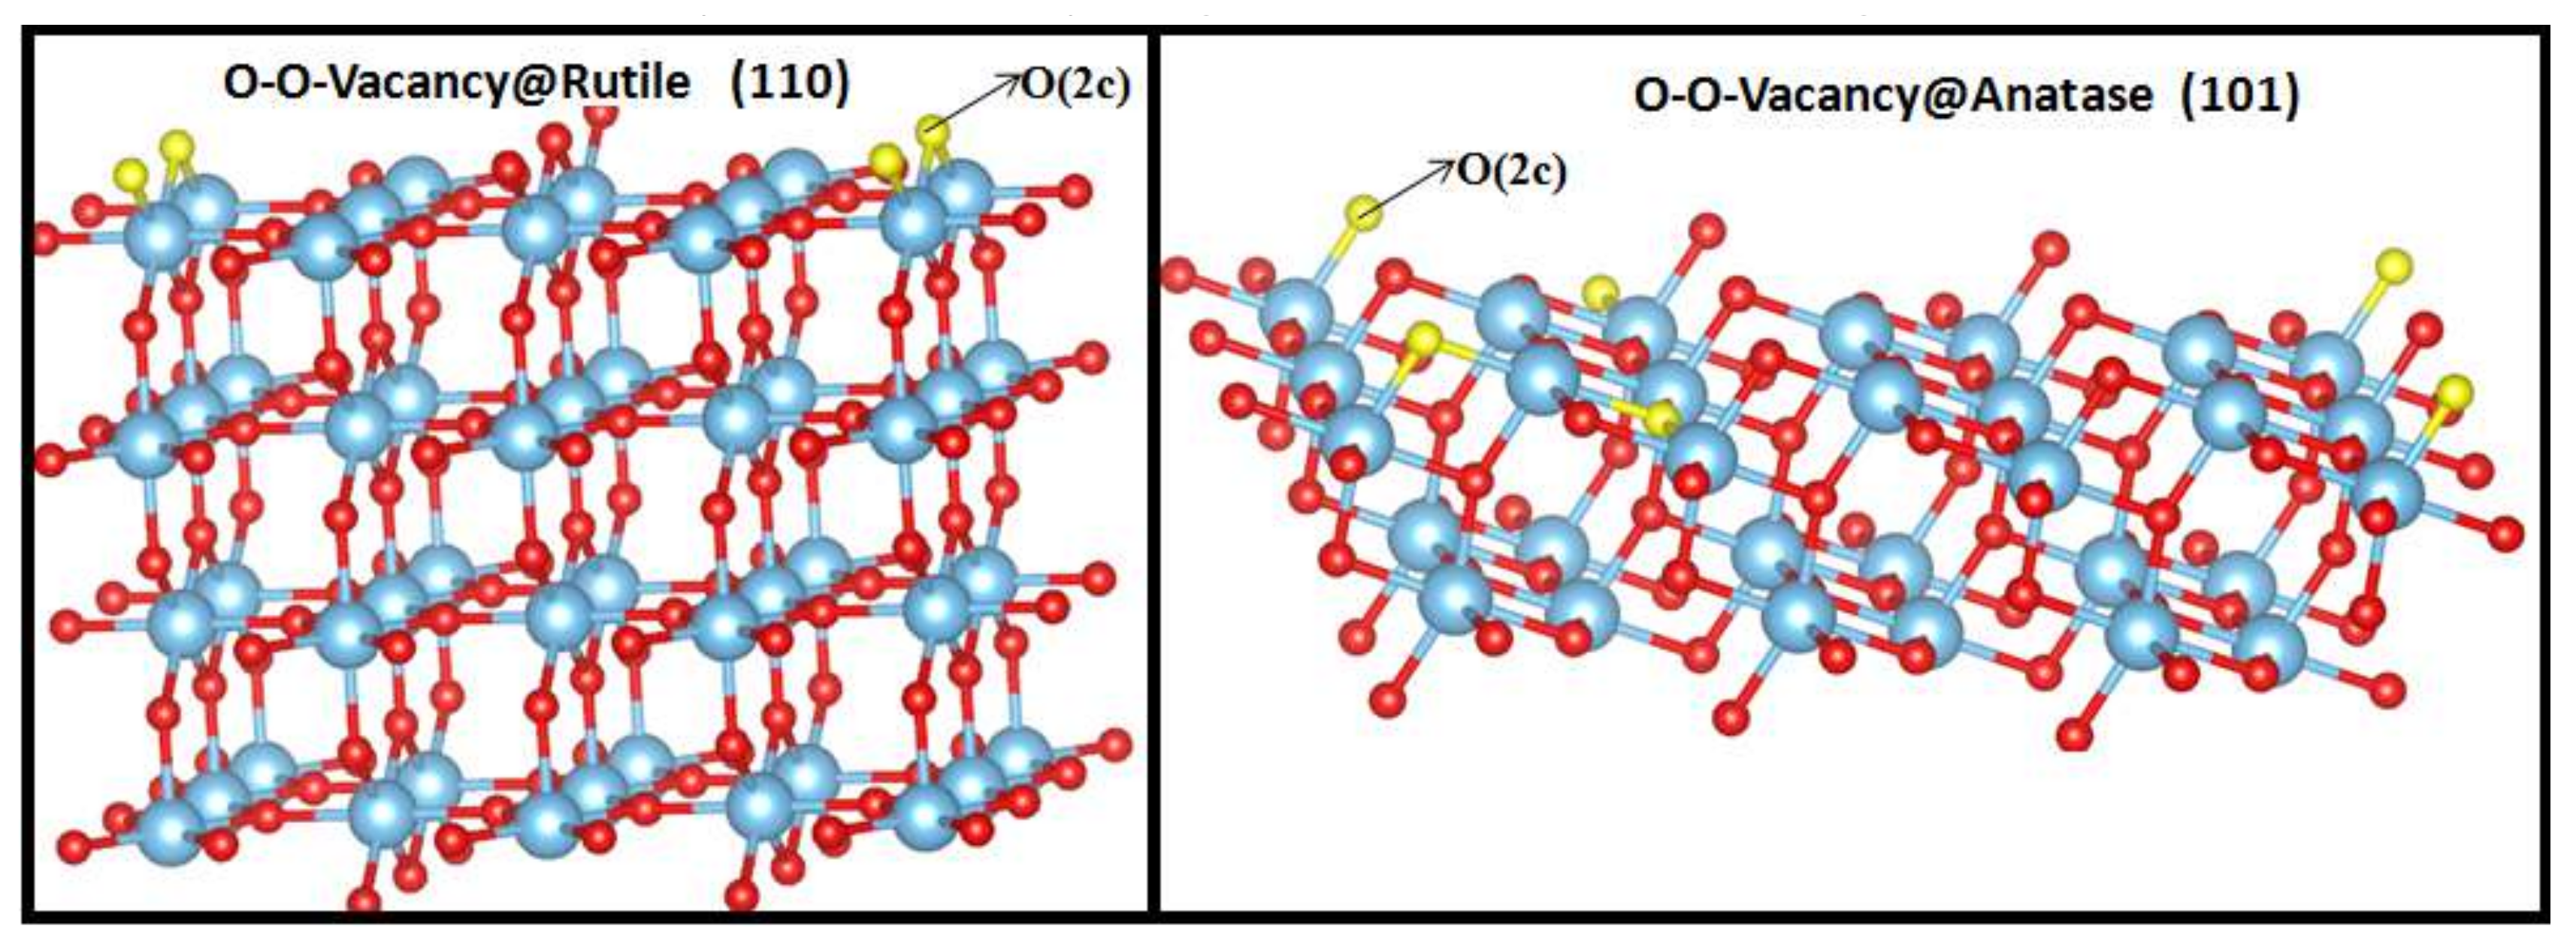
3.2. O-Vacancy on the Surface of Rutile and Anatase

While O2c (bridge) atom has been widely reported as the easiest atom to remove for the formation of O-vacancy@rutile (110) surface, contradictory results exist for O-vacancy@anatase (101) [16,22,23,24]. Hence, the simulated unit cells for the O-vacancy@anatase (101) and rutile (110) structures were optimized by eliminating one O atom from all unique positions in the first layer and sub-layers. By eliminating O from the 2c site (Figure 5), the O-vacancy formation energies were 6.5 and 6.7 eV for the most stable structures of O-vacancy@rutile (110) and anatase (101), respectively. Herein, to end more easily and clearly, an O atom was eliminated from the most stable structure of O-vacancy@rutile (110) and anatase (101) structures to make O-O-vacancy@ surface structures; second O atoms related to the first one (O2c) were removed in different structures. In anatase structure the presence of a single O2c vacancy provoked the elimination of a sub-surface oxygen atom to form the most stable O-O-vacancy@anatse (101) structure. This dispersion mode, in addition to higher O-vacancy formation energy in anatase, could have been the reason for the lower density of O-vacancy on the anatase surface that was experimentally observed.
Figure 5 shows the most stable O-O-vacancy configurations in the anatase (101) and rutile (110) structures, with the respective formation energies of 6.65 eV and 6.3 eV per each defect. In both structures, the first O-vacancy induced a synergistic effect for removing the second O atom.
The results on the surficial distribution of the O-vacancies indicated small point defects as one-atom O-vacancy sites in anatase, and large point defects as two-atom O-vacancy sites in rutile. It has been claimed that larger defect sites can impair quantum yields by acting as recombination centers for photogenerated electron–hole pairs [10]. This may also have been a reason for the lower activity of the rutile compared to anatase phase. The O-vacancies of the anatase phase distributed on the surface and sub-surface, which has been shown to increase its photocatalytic activity in water adsorption and dissociation, playing the role of active sites [24]. Thus, higher and smaller active points on the anatase surface could have played a critical role in its higher activity in comparison with rutile (Figure 6).

4. Conclusions

Plain DFT and Hybrid methods were used to study defective anatase and rutile TiO2 with single and double O-vacancy defects using the FHI aims code (and ABINIT code for confirmation). Using hybrid methods, band structure calculations resulted in band gap energies in close agreement with experimental values for rutile (3.0 eV) and anatase (3.2 eV). The most stable O-O-vacancy configuration in the rutile crystal structure was where the two O-vacancies were next to each other on the same Ti atom. However, a homogeneous dispersion in the anatase morphology was preferred. The elimination of the second O-vacancy turned out to be easier than the first one in the defective anatase and rutile TiO2. While oxygen deficiency had similar results on the electronic structures of anatase and rutile structures, their charge distributions differed; the transferred charge from two defects were localized on three nearest Ti atoms in rutile, whereas defect positions disperse their charges independently in anatase phase.
In the surface studies, a single O-vacancy was placed in an O2c-bridge atom on both (101) anatase and (110) rutile surfaces, but unlike the bulk results, the single O-vacancy formation energy value on anatase surface was higher than that of rutile. While a double cluster of O-vacancy was preferred on the rutile (110) surface, as a result of omitting the two nearest O2c-bridge atoms, the O-vacancies dispersed in the first layer (surface) and the sub-layer in anatase (101) structure, resulting in cluster- and single- defect features of O-vacancies in the rutile and anatase structures, respectively. The elimination of the first oxygen atom had a synergistic effect for the second O-vacancy for both anatase and rutile, yet these defects generated higher active sites on the surface of anatase.

Author Contributions

M.E.: Conceptualization, Investigation, Formal analysis, Visualization, Supervision, Methodology; M.R.S.: Conceptualization, Investigation, Formal analysis, Validation, Resources, Funding acquisition; A.M.: Resources, Writing—review & editing, Funding acquisition; R.B.-A.: Methodology, Resources; S.A.: Investigation, Formal analysis, Writing—original draft. All authors have read and agreed to the published version of the manuscript.

Conflicts of Interest

The authors declare no conflict of interest.

References

  1. Padervand, M.; Salari, H.; Ahmadvand, S.; Gholami, M.R. Removal of an organic pollutant from waste water by photocatalytic behavior of AgX/TiO2 loaded on mordenite nanocrystals. Res. Chem. Intermed. 2012, 38, 1975–1985. [Google Scholar] [CrossRef]
  2. Sadrian, M.R.; Calvin, W.; Engelbrecht, J. Determination of Dust Particles Mineral Percentages by Semiquantitative Analysis Using X-Ray Powder Diffraction and Linear Spectral Unmixing. AGU Fall Meeting, San Francisco, CA, USA, 9–13 December 2019. [Google Scholar]
  3. Zahiri, A.H.; Chakraborty, P.; Wang, Y.; Cao, L. Strong strain hardening in ultrafast melt-quenched nanocrystalline Cu: The role of fivefold twins. J. Appl. Phys. 2019, 126, 075103. [Google Scholar] [CrossRef]
  4. Wang, Y.; Liu, L.; Xu, L.; Meng, C.; Zhu, W. Ag/TiO2 nanofiber heterostructures: Highly enhanced photocatalysts under visible light. J. Appl. Phys. 2013, 113, 174311. [Google Scholar] [CrossRef]
  5. Divya, S.; Thankappan, A.; Vallabhan, C.P.G.; Nampoori, V.P.N.; Radhakrishnan, P.; Mujeeb, A. Electrolyte/photoanode engineered performance of TiO2 based dye sensitised solar cells. J. Appl. Phys. 2014, 115, 64501. [Google Scholar] [CrossRef]
  6. Salaoru, I.; Prodromakis, T.; Khiat, A.; Toumazou, C. Resistive switching of oxygen enhanced TiO2 thin-film devices. Appl. Phys. Lett. 2013, 102, 13506. [Google Scholar] [CrossRef]
  7. Elahifard, M.R.; Rahimnejad, S.; Pourbaba, R.; Hghighi, S.; Gholami, M.R. Photocatalytic mechanism of action of apatite-coated Ag /AgBr/TiO2 on phenol and Escherichia coli and Bacillus subtilis bacteria under various conditions. Prog. React. Kinet. Mech. 2011, 36, 38–52. [Google Scholar] [CrossRef]
  8. Sadrian, M.R.; Calvin, W.; Engelbrecht, J. Characterization of Mineral Dust using XRD and Infrared Spectroscopy. In Proceedings of the 99th American Meteorological Society Annual Meeting, Phoenix, AZ, USA, 6–10 January 2019. [Google Scholar]
  9. Elahifard, M.; Heydari, H.; Behjatmanesh-Ardakani, R.; Peik, B.; Ahmadvand, S. A computational study on the effect of Ni impurity and O-vacancy on the adsorption and dissociation of water molecules on the surface of anatase (101). J. Phys. Chem. Solids 2020, 136, 109176. [Google Scholar] [CrossRef]
  10. Kong, M.; Li, Y.; Chen, X.; Tian, T.; Fang, P.; Zheng, F.; Zhao, X. Tuning the Relative Concentration Ratio of Bulk Defects to Surface Defects in TiO2 Nanocrystals Leads to High Photocatalytic Efficiency. J. Am. Chem. Soc. 2011, 133, 16414. [Google Scholar] [CrossRef]
  11. Bikondoa, O.; Pang, C.L.; Ithnin, R.; Muryn, C.A.; Onishi, H.; Thornton, G. Direct visualization of defect-mediated dissociation of water on TiO2(110). Nat. Mater. 2006, 5, 189–192. [Google Scholar] [CrossRef]
  12. Minato, T.; Sainoo, Y.; Kim, Y.; Kato, H.S.; Aika, K.; Kawai, M.; Zhao, J.; Petek, H.; Huang, T.; He, W.; et al. The electronic structure of oxygen atom vacancy and hydroxyl impurity defects on titanium dioxide (110) surface. J. Chem. Phys. 2009, 130, 124502. [Google Scholar] [CrossRef] [PubMed]
  13. Shi, H.; Liu, Y.; Zhao, Z.; Miao, M.; Wu, T.; Wang, Q. Reactivity of the Defective Rutile TiO2 (110) Surfaces with Two Bridging-Oxygen Vacancies: Water Molecule as a Probe. J. Phys. Chem. C 2014, 118, 20257–20263. [Google Scholar] [CrossRef]
  14. Zhang, H.Z.; Banfield, J.F. Thermodynamic analysis of phase stability of nanocrystalline titania. J. Mater. Chem. 1998, 8, 2073–2076. [Google Scholar] [CrossRef]
  15. Lazzeri, M.; Vittadini, A.; Selloni, A. Structure and energetics of stoichiometric TiO2 anatase surfaces. Phys. Rev. B 2001, 63, 155409. [Google Scholar] [CrossRef]
  16. Thomas, A.G.; Flavell, W.R.; Mallick, A.K.; Kumarasinghe, A.R.; Tsoutsou, D.; Khan, N.; Chatwin, C.; Rayner, S.; Smith, G.C.; Stockbauer, R.L.; et al. Comparison of the electronic structure of anatase and rutile TiO2 single-crystal surfaces using resonant photoemission and x-ray absorption spectroscopy. Phys. Rev. B 2007, 75, 035105. [Google Scholar] [CrossRef]
  17. Diebold, U. The surface science of titanium dioxide. Surf. Sci. Rep. 2003, 48, 53–229. [Google Scholar] [CrossRef]
  18. Wendt, S.; Schaub, R.; Matthiesen, J.; Vestergaard, E.K.; Wahlström, E.; Rasmussen, M.D.; Thostrup, P.; Molina, L.M.; Lægsgaard, E.; Stensgaard, I.; et al. Oxygen vacancies on TiO2 (1 1 0) and their interaction with H2O and O2: A combined high-resolution STM and DFT study. Surf. Sci. 2005, 598, 226–245. [Google Scholar] [CrossRef]
  19. Deskins, N.R.; Rouseau, R.; Dupuis, M. Distribution of Ti3+ Surface Sites in Reduced TiO2. J. Phys. Chem. C 2011, 115, 7562–7572. [Google Scholar] [CrossRef]
  20. Yan, J.; Wu, G.; Guan, N.; Li, L.; Li, Z.; Caob, X. Understanding the effect of surface/bulk defects on the photocatalytic activity of TiO2: Anatase versus rutile. Phys. Chem. Chem. Phys. 2013, 15, 10978–10988. [Google Scholar] [CrossRef]
  21. Ranade, M.R.; Navrotsky, A.; Zhang, H.Z.; Banfield, J.F.; Elder, S.H.; Zaban, A.; Borse, P.H.; Kulkarni, S.K.; Doran, G.S.; Whitfield, H.J. Energetics of nanocrystalline TiO2. Proc. Natl. Acad. Sci. USA 2002, 99, 6476. [Google Scholar] [CrossRef] [PubMed] [Green Version]
  22. Cheng, H.; Selloni, A. Surface and subsurface oxygen vacancies in anatase TiO2 and differences with rutile. Phys. Rev. B 2009, 79, 092101. [Google Scholar] [CrossRef]
  23. Li, H.; Guo, Y.; Robertson, J. Calculation of TiO2 Surface and Subsurface Oxygen Vacancy by the Screened Exchange Functional. J. Phys. Chem. C 2015, 119, 18160–18166. [Google Scholar] [CrossRef]
  24. Scheiber, P.; Fidler, M.; Dulub, O.; Schmid, M.; Diebold, U.; Hou, W.; Aschauer, U.; Selloni, A. (Sub)Surface Mobility of Oxygen Vacancies at the TiO2 Anatase (101) Surface. Phys. Rev. Lett. 2012, 109, 136103. [Google Scholar] [CrossRef] [PubMed] [Green Version]
  25. Han, G.; Hu, S.; Yan, S.; Mei, L. Oxygen vacancy induced ferromagnetism in rutile TiO2–x. Phys. Status Solidi RRL 2009, 3, 148–150. [Google Scholar] [CrossRef]
  26. Navas, J.; Sánchez-Coronilla, A.; Aguilar, T.; Hernández, N.C.; Santos, D.M.; Sánchez-Márquez, J.; Zorrilla, D.; Fernández-Lorenzo, C.; Alcántara, R.; Martín-Calleja, J. Experimental and theoretical study of the electronic properties of Cu-doped anatase TiO2. Phys. Chem. Chem. Phys. 2014, 16, 3835–3845. [Google Scholar] [CrossRef]
  27. Lee, H.-Y.; Clark, S.J.; Robertson, J. Calculation of point defects in rutile TiO2 by the screened-exchange hybrid functional. Phys. Rev. B 2012, 86, 75209. [Google Scholar] [CrossRef] [Green Version]
  28. Janotti, A.; Varley, J.B.; Rinke, P.; Umezawa, N.; Kresse, G.; Van de Walle, C.G. Hybrid functional studies of the oxygen vacancy in TiO2. Phys. Rev. B 2010, 81, 085212. [Google Scholar] [CrossRef] [Green Version]
  29. Papageorgiou, A.C.; Beglitis, N.S.; Pang, C.L.; Teobaldi, G.; Cabailh, G.; Chen, Q.; Fisher, A.J.; Hofer, W.A.; Thornton, G. Electron traps and their effect on the surface chemistry of TiO2 (110). Proc. Natl. Acad. Sci. USA 2010, 107, 2391–2396. [Google Scholar] [CrossRef] [Green Version]
  30. Zhou, S.; Čižmár, E.; Potzger, K.; Krause, M.; Talut, G.; Helm, M.; Fassbender, J.; Zvyagin, S.A.; Wosnitza, J.; Schmidt, H. Origin of magnetic moments in defective TiO2 single crystals. Phys. Rev. B 2009, 79, 113201. [Google Scholar] [CrossRef] [Green Version]
  31. Shao, G. Red Shift in Manganese-and Iron-Doped TiO2: A DFT+U Analysis. J. Phys. Chem. C 2009, 113, 6800–6808. [Google Scholar] [CrossRef]
  32. Di Valentin, C.; Pacchioni, G.; Selloni, A. Reduced and n-Type Doped TiO2: Nature of Ti3+ Species. J. Phys. Chem. C 2009, 113, 20543–20552. [Google Scholar] [CrossRef]
  33. Stausholm-Møller, J.; Kristoffersen, H.H.; Hinnemann, B.; Madsen, G.K.H.; Hammer, B. DFT+U study of defects in bulk rutile TiO2. J. Chem. Phys. 2010, 133, 144708. [Google Scholar] [CrossRef] [PubMed]
  34. Deskins, N.A.; Rousseau, R.; Dupuis, M. Defining the Role of Excess Electrons in the Surface Chemistry of TiO2. J. Phys. Chem. C 2010, 114, 5891–5897. [Google Scholar] [CrossRef]
  35. Crespillo, M.L.; Graham, J.T.; Agulló-López, F.; Zhang, Y.; Weber, W.J. Correlation between Cr3+luminescence and oxygen vacancy disorder in strontium titanate under MeV Ion Irradiation. J. Phys. Chem. C 2017, 121, 19758–19766. [Google Scholar] [CrossRef]
  36. Finazzi, E.; Di Valentin, C.; Pacchioni, G.; Selloni, A. Excess electron states in reduced bulk anatase TiO2: Comparison of standard GGA, GGA+U, and hybrid DFT calculations. J. Chem. Phys. 2008, 129, 154113. [Google Scholar] [CrossRef]
  37. Calzado, C.J.; Hernández, N.C.; Sanz, J.F. Effect of on-site Coulomb repulsion term U on the band-gap states of the reduced rutile (110) TiO2 Surface. Phys. Rev. B 2008, 77, 45118. [Google Scholar] [CrossRef] [Green Version]
  38. Morgan, B.J.; Watson, G.W. A DFT + U description of oxygen vacancies at the TiO2 rutile (1 1 0) surface. Surf. Sci. 2007, 601, 5034–5041. [Google Scholar] [CrossRef]
  39. Li, D.X.; Li, R.Q.; Chen, Y.; Yang, J.; Guo, X.T. Electronic Structures and Magnetism of Rutile TiO2 with Vacancy Defects from First Principles: GGA + U Calculations. J. Supercond. Nov. Magn. 2017, 30, 243–249. [Google Scholar] [CrossRef]
  40. Lechermann, F.; Heckel, W.; Kristanovski, O.; Müller, S. Oxygen-vacancy driven electron localization and itinerancy in rutile-based TiO2. Phys. Rev. B 2017, 95, 195159. [Google Scholar] [CrossRef] [Green Version]
  41. Morgan, B.J.; Watson, G.W. Intrinsic n-type Defect Formation in TiO2: A Comparison of Rutile and Anatase from GGA+U Calculations. J. Phys. Chem. C 2010, 114, 2321–2328. [Google Scholar] [CrossRef]
  42. Perdew, J.P.; Burke, K.; Ernzerhof, M. Generalized Gradient Approximation Made Simple. Phys. Rev. Lett. 1996, 77, 3865. [Google Scholar] [CrossRef] [PubMed] [Green Version]
  43. Esfandfard, S.M.; Elahifard, M.R.; Behjatmanesh-Ardakani, R.; Kargar, H. DFT Study on Oxygen-Vacancy Stability in Rutile/Anatase TiO2: Effect of Cationic Substitutions. Phys. Chem. Res. 2018, 6, 547–563. [Google Scholar]
  44. Elahifard, M.; Padervand, M.; Yasini, S.; Fazeli, E. The effect of double impurity cluster of Ni and Co in TiO2 bulk; a DFT study. J. Electroceramics 2016, 37, 79–84. [Google Scholar] [CrossRef]
  45. Cococcioni, M.; De Gironcoli, S. Linear response approach to the calculation of the effective interaction parameters in the LDA+U Method. Phys. Rev. B 2005, 71, 35105. [Google Scholar] [CrossRef] [Green Version]
  46. Asahi, R.; Taga, Y.; Mannstadt, W.; Freeman, A. Electronic and optical properties of anatase TiO2. J. Phys. Rev. B 2000, 61, 7459. [Google Scholar] [CrossRef]
  47. Woicik, J.C.; Nelson, E.J.; Kronik, L.; Jain, M.; Chelikowsky, J.R.; Heskett, D.; Berman, L.E.; Herman, G.S. Hybridization and Bond-Orbital Components in Site-Specific X-Ray Photoelectron Spectra of Rutile TiO2. Phys. Rev. Lett. 2002, 89, 077401. [Google Scholar] [CrossRef] [Green Version]
Figure 1. Total and partial density of states of the pure, O-vacancy@-, and O-O-vacancy@rutile and anatase bulk.
Catalysts 10 00397 g001
Figure 2. The difference between charge densities of the single O-vacancy and pure bulk structures of rutile and anatase. The blue and yellow lobes represent the negative and positive levels of isosurfaces, respectively. The net charge transfers have also been represented. Red and blue spheres represent O and Ti atoms, respectively.
Catalysts 10 00397 g002
Figure 3. The most stable structures of O-O-vacancy@rutile and anatase bulk. The equatorial (e) and axial (a) O atoms around Ti atom in rutile structure have also been presented. Red and blue spheres represent O and Ti atoms, respectively, and yellow spheres represent O-vacancy positions.
Catalysts 10 00397 g003
Figure 4. The difference between charge densities of the double O-vacancy and pure bulk structures of rutile and anatase. The blue and yellow lobes represent the negative and positive levels of isosurfaces, respectively. The net charge transfers have also been represented. Red and blue spheres represent O and Ti atoms, respectively.
Catalysts 10 00397 g004
Figure 5. The most stable structures O-O-vacancy@rutile (110) and anatase (101) surfaces. Red and blue spheres represent O and Ti atoms, respectively, and yellow spheres represent O-vacancy positions.
Catalysts 10 00397 g005
Figure 6. O-vacancy dispersion in the bulk and on the surface of anatase and rutile structures.
Catalysts 10 00397 g006
Table 1. Relative energies and O-O-vacancy distances for different forms of double O-vacancy rutile and anatase TiO2.
Anatase FormsRelative Energy (eV)dO-O
(Å)
Rutile FormsRelative Energy (eV)dO-O
(Å)
Form 1+0.502.47Form 1+0.652.51
Form 2+0.452.80Form 20.02.78
Form 3+0.413.04Form 3+0.352.96
Form 4+0.03.79Form 4+0.353.32
Form 5+0.203.96Form 5+0.303.88
Form 6+0.304.21Form 6+1.063.98
Form 7+0.344.53Form 7+0.544.45
Form 8+0.364.88Form 8+0.694.59
Form 9+0.405.37Form 9+0.924.94
Form 10+0.335.47Form 10+0.655.46
Form 11+0.396.67Form 11+0.395.78

