Article

One-Pot Alcoholysis of the Lignocellulosic Eucalyptus nitens Biomass to n-Butyl Levulinate, a Valuable Additive for Diesel Motor Fuel

1
Department of Chemistry and Industrial Chemistry, University of Pisa, Via Giuseppe Moruzzi 13, 56124 Pisa, Italy
2
Department of Energy, Systems, Territory and Construction Engineering, University of Pisa, Largo Lucio Lazzarino, 56122 Pisa, Italy
3
Department of Chemical Engineering, Faculty of Science, University of Vigo (Campus Ourense), As Lagoas, 32004 Ourense, Spain
*
Authors to whom correspondence should be addressed.
Submission received: 17 April 2020 / Revised: 1 May 2020 / Accepted: 3 May 2020 / Published: 6 May 2020

Abstract

:
The present investigation represents a concrete example of complete valorization of Eucalyptus nitens biomass, in the framework of the circular economy. Autohydrolyzed-delignified Eucalyptus nitens was employed as a cheap cellulose-rich feedstock in the direct alcoholysis to n-butyl levulinate, adopting n-butanol as green reagent/reaction medium, very dilute sulfuric acid as a homogeneous catalyst, and different heating systems. The effect of the main reaction parameters to give n-butyl levulinate was investigated to check the feasibility of this reaction and identify the coarse ranges of the main operating variables of greater relevance. High n-butyl levulinate molar yields (35–40 mol%) were achieved under microwave and traditional heating, even using a very high biomass loading (20 wt%), an eligible aspect from the perspective of the high gravity approach. The possibility of reprocessing the reaction mixture deriving from the optimized experiment by the addition of fresh biomass was evaluated, achieving the maximum n-butyl levulinate concentration of about 85 g/L after only one microwave reprocessing of the mother liquor, the highest value hitherto reported starting from real biomass. The alcoholysis reaction was further optimized by Response Surface Methodology, setting a Face-Centered Central Composite Design, which was experimentally validated at the optimal operating conditions for the n-butyl levulinate production. Finally, a preliminary study of diesel engine performances and emissions for a model mixture with analogous composition to that produced from the butanolysis reaction was performed, confirming its potential application as an additive for diesel fuel, without separation of each component.

Graphical Abstract

1. Introduction

Levulinic acid (LA) is a biomass-derived platform chemical which has attracted increasing interest in recent years due to the possibility to be converted into added-value derivatives, such as biofuels, fragrances, solvents, pharmaceuticals, and plasticizers [1], thus justifying the increasing worldwide market demand for LA production [2]. LA is traditionally produced in water medium via dehydration of C6 sugars through the formation of 5-hydroxymethylfurfural as the main reaction intermediate, the overall reaction occurring in the presence of a suitable acid catalyst [3,4,5,6,7]. Among the LA-derived platforms chemicals, alkyl levulinates appear significantly attractive due to their potential applications developed in recent years for the global market scenario, such as fuel blending additives for diesel/gasoline, and as intermediates for the synthesis of valuable polymers, perfumes, and flavoring formulations [8,9]. Levulinates can be synthesized by the esterification of pure LA with a simple equilibrium reaction, requiring a mild acid catalysis/reaction conditions, and generally affording very high yields towards the desired ester products. Both the reduced number of process units and the enhanced performances of new technological solutions, such as the reactive distillation, should allow significant improvements in the economics of the esterification process [10,11,12]. However, despite these ascertained potentials, the catalysis issue can be further improved, taking into account both the synthetic strategy and the adopted feedstock. Up to now, much work has been done on the synthesis of methyl and ethyl levulinates, which were recognized as effective additives for diesel and biodiesel transportation fuels, showing excellent performances, including non-toxicity, high lubricity and good flashpoint stability and flow properties under cold conditions [13,14,15]. In addition, the conversion of these short-chain alkyl levulinates into more added-value bio-products, such as γ-valerolactone, is preferred respect to that of LA due to the improved selectivity. Moreover, the hydrogenation of alkyl levulinates with short alkyl chains facilitates down-stream processing as separation of alcohol in the final step is easier and cheaper, compared to water [16]. The synthesis of alkyl levulinates was carried out in the presence of homogeneous or, more advantageously, heterogeneous catalysts due to their easy recovery from the reaction mixture, starting from pure LA or expensive pure model precursors, such as C6 carbohydrates (glucose, fructose, and clean cellulose), C5 derivatives (furfuryl alcohol), and even real lignocellulosic biomasses [17,18]. The one-pot synthesis of these levulinates directly from monosaccharides, polysaccharides, and, above all, starting from lignocellulosic biomass, has gained more interest due to the low cost of these feedstocks, and the feasibility of this approach was demonstrated, in particular for the biomass alcoholysis to ethyl levulinate [19]. A key advantage of the direct alcoholysis is represented by the limited formation of undesired furanic products, named humins, when using alcohol (instead of water) as the solvent for biomass conversion [20,21]. On the other hand, the yields of levulinate esters from real biomass are generally lower than those obtained from pure model compounds due to the usually higher recalcitrance of the former [18], and to the increased formation of reaction by-products, such as formates, HMF ethers and, above all, dialkyl ethers, originating from the alcohol dehydration [20,21]. Differently, n-butyl levulinate (BL) was less studied, but its use as an efficient fuel additive was already demonstrated [22], resulting in a more promising diesel additive than EL [18,23]. In addition, n-butanol (n-BuOH) is a green reagent/solvent, being obtainable by fermentation and also by catalytic conversion of bio-ethanol [
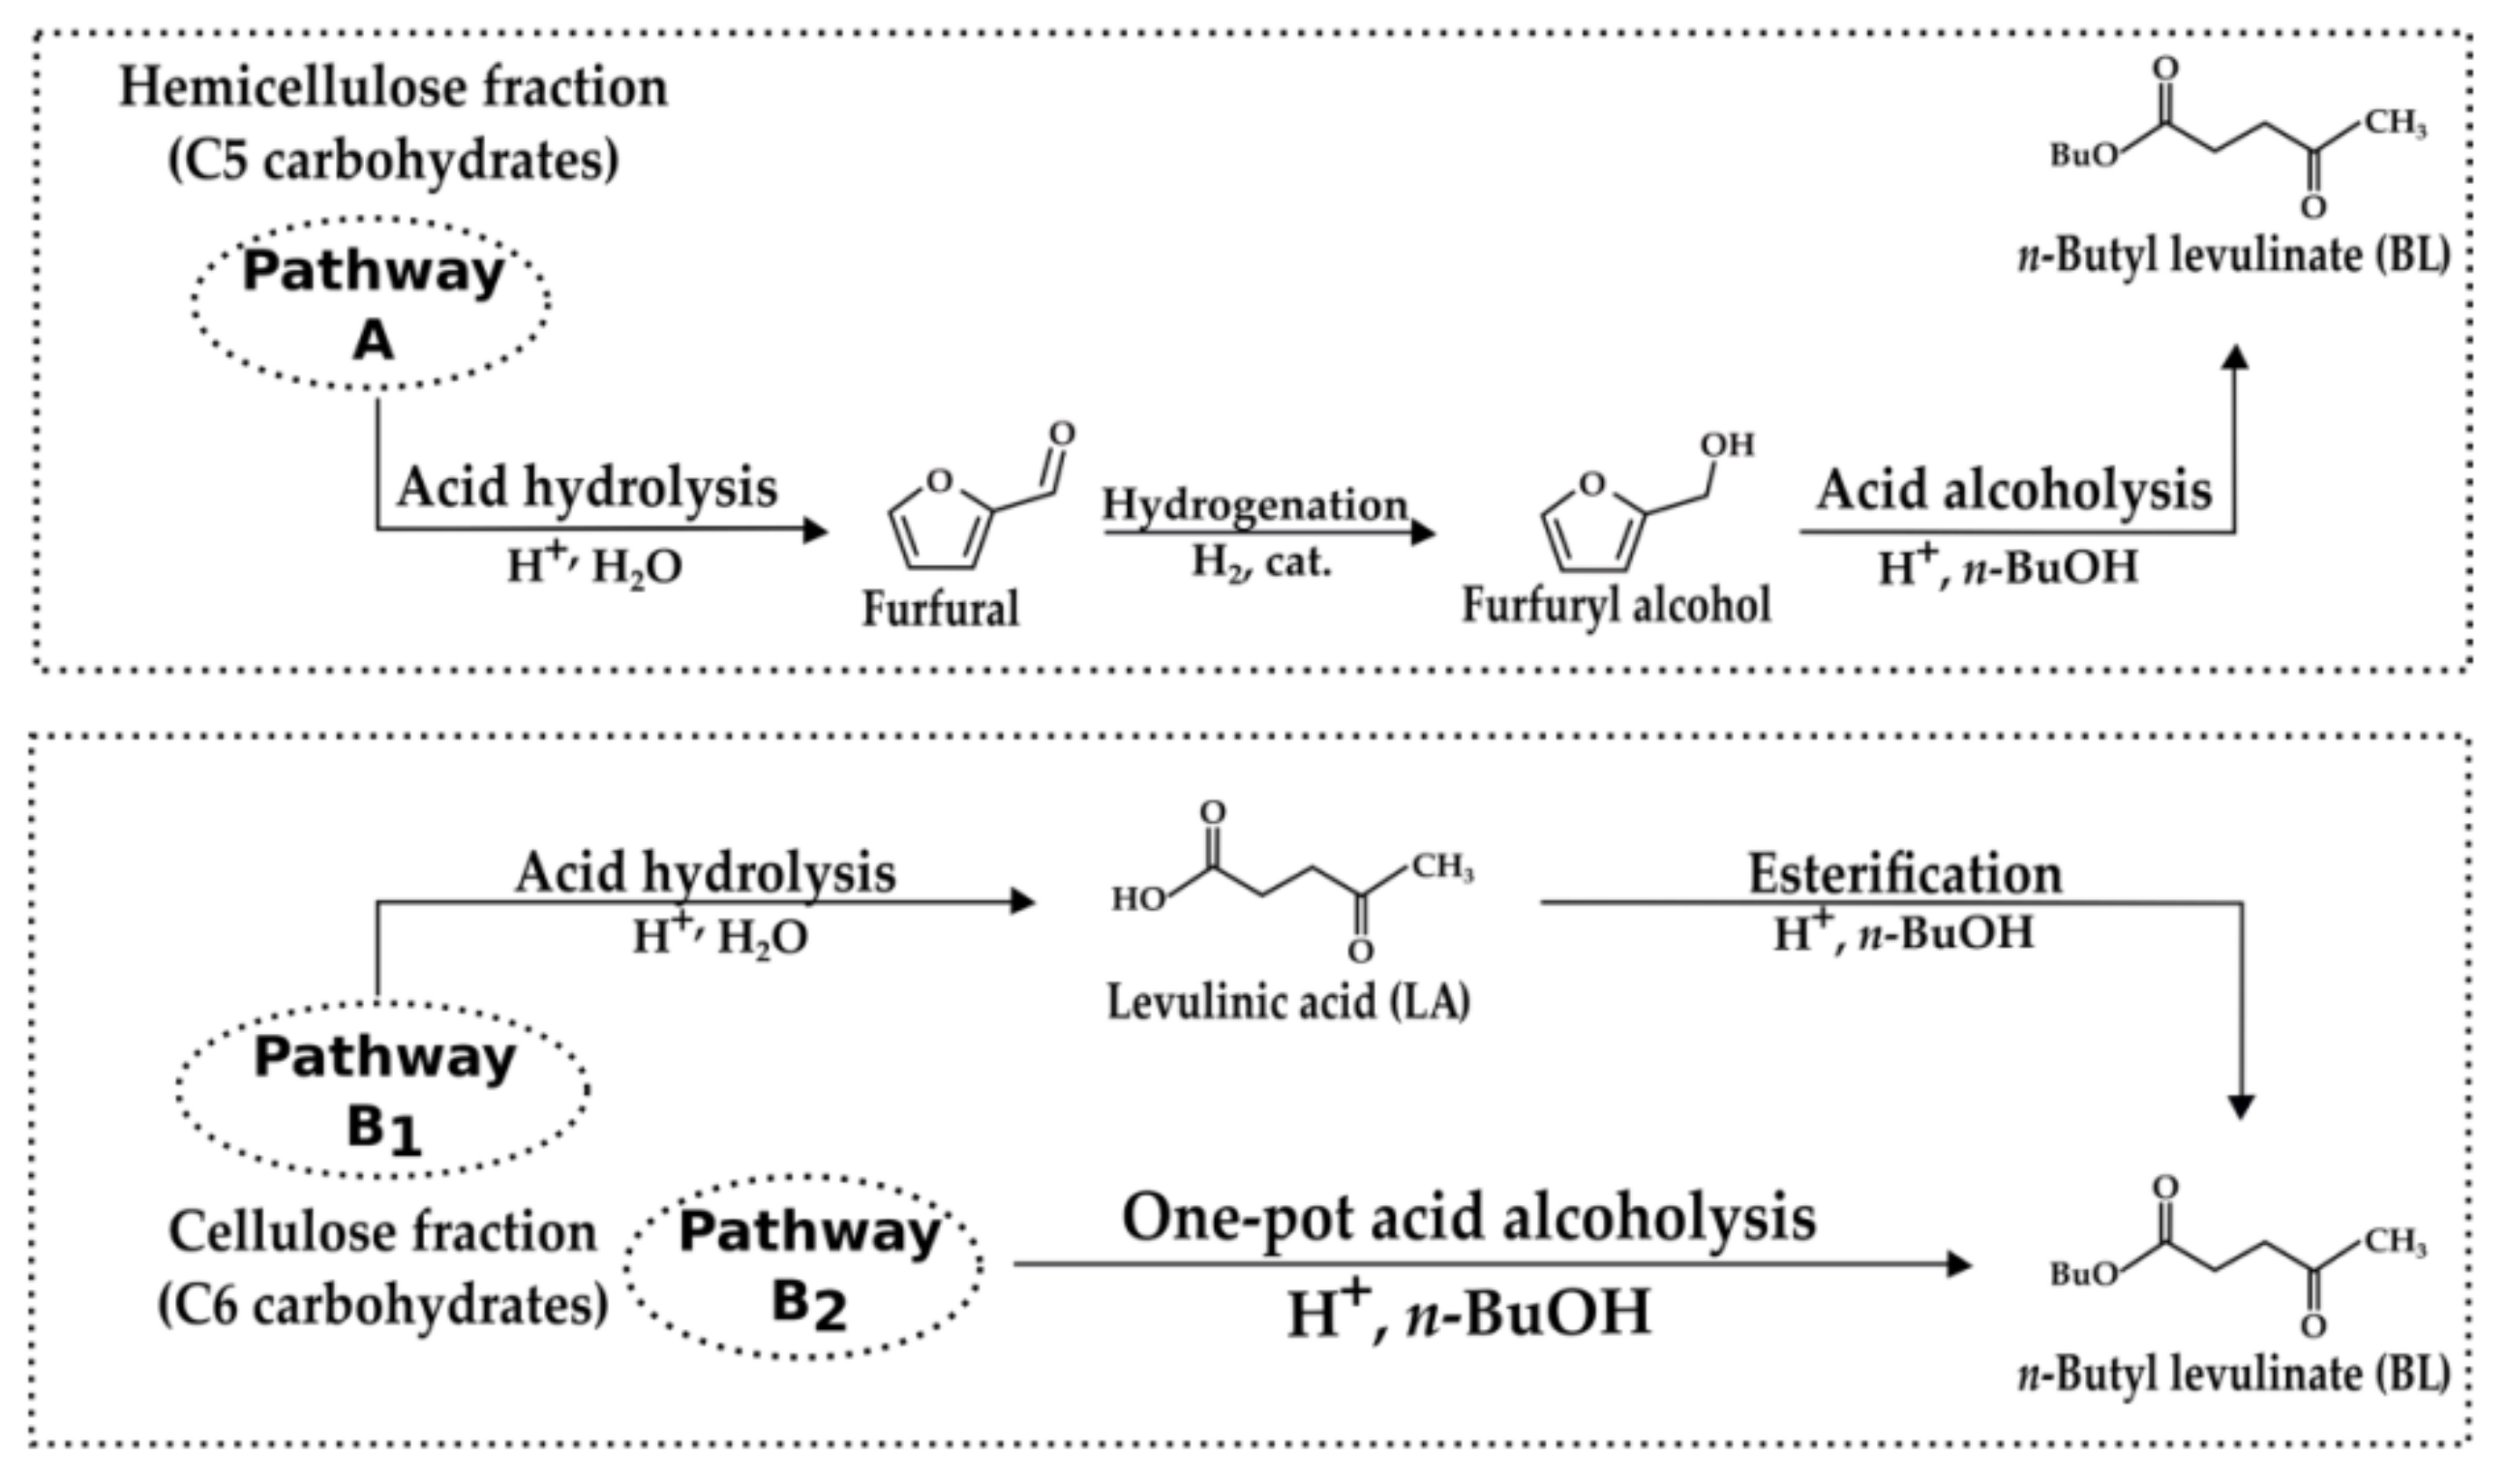
24], thus further justifying the interest towards the sustainable production of BL. Regarding the possible pathways for BL production, as previously stated for methyl and ethyl levulinates, it can also be obtained with a two-steps process from C5 or C6 carbohydrates or their conversion products (Pathway A or Pathway B1, respectively, in Figure 1) or, more advantageously, with a one-pot approach from C6 carbohydrates (Pathway B2, Figure 1). In the first case, furfuryl alcohol or LA (from hemicellulose and cellulose fractions, respectively) must be synthesized in the first step, recovered, and properly purified before the subsequent stage, consisting of acid alcoholysis or esterification, respectively. The C5 route (Pathway A, Figure 1) is a three-step process consisting of: (1) acid-catalyzed hydrolysis of the hemicellulose fraction to simpler C5 sugars and their dehydration to furfural; (2) hydrogenation of furfural over a suitable catalyst to furfuryl alcohol; (3) acid alcoholysis of furfuryl alcohol to BL, occurring in the presence of strong acid catalysts [25]. The C5 route was investigated in the literature adopting furfuryl alcohol as starting feedstock, in the presence of heterogeneous catalysts, due to their easier separation from the liquid reaction mixture [26,27,28,29]. On the other hand, BL synthesis through the C6 route (Pathway B1, Figure 1) provides the hydrolysis of the C6 carbohydrates to LA, followed by its esterification in n-BuOH, and both steps occur in the presence of a suitable acid catalyst.
Regarding this C6 route, in the literature, it is possible to find many BL synthesis from pure LA, the intermediate compound, usually preferring the use of heterogeneous catalysts, achieving excellent yields (>90 mol%) under sustainable reaction conditions [9,30,31]. On the contrary, BL synthesis from C6 carbohydrates was not exploited with the same emphasis, although this approach should result very attractive from the industrial perspective if realized in a single step without any intermediate purification procedures (Pathway B2, Figure 1), thus decreasing the BL production cost. In this context, some authors have reported the one-pot butanolysis of microcrystalline cellulose to BL [32,33,34,35,36,37,38,39,40,41], which is already very difficult to achieve due to its recalcitrance to the solubilization/conversion, while the butanolysis of the real biomass, which includes lignin as a further recalcitrant component, is even unexplored. In this regard, a simplified scheme of the C6 fraction butanolysis pathway is shown in
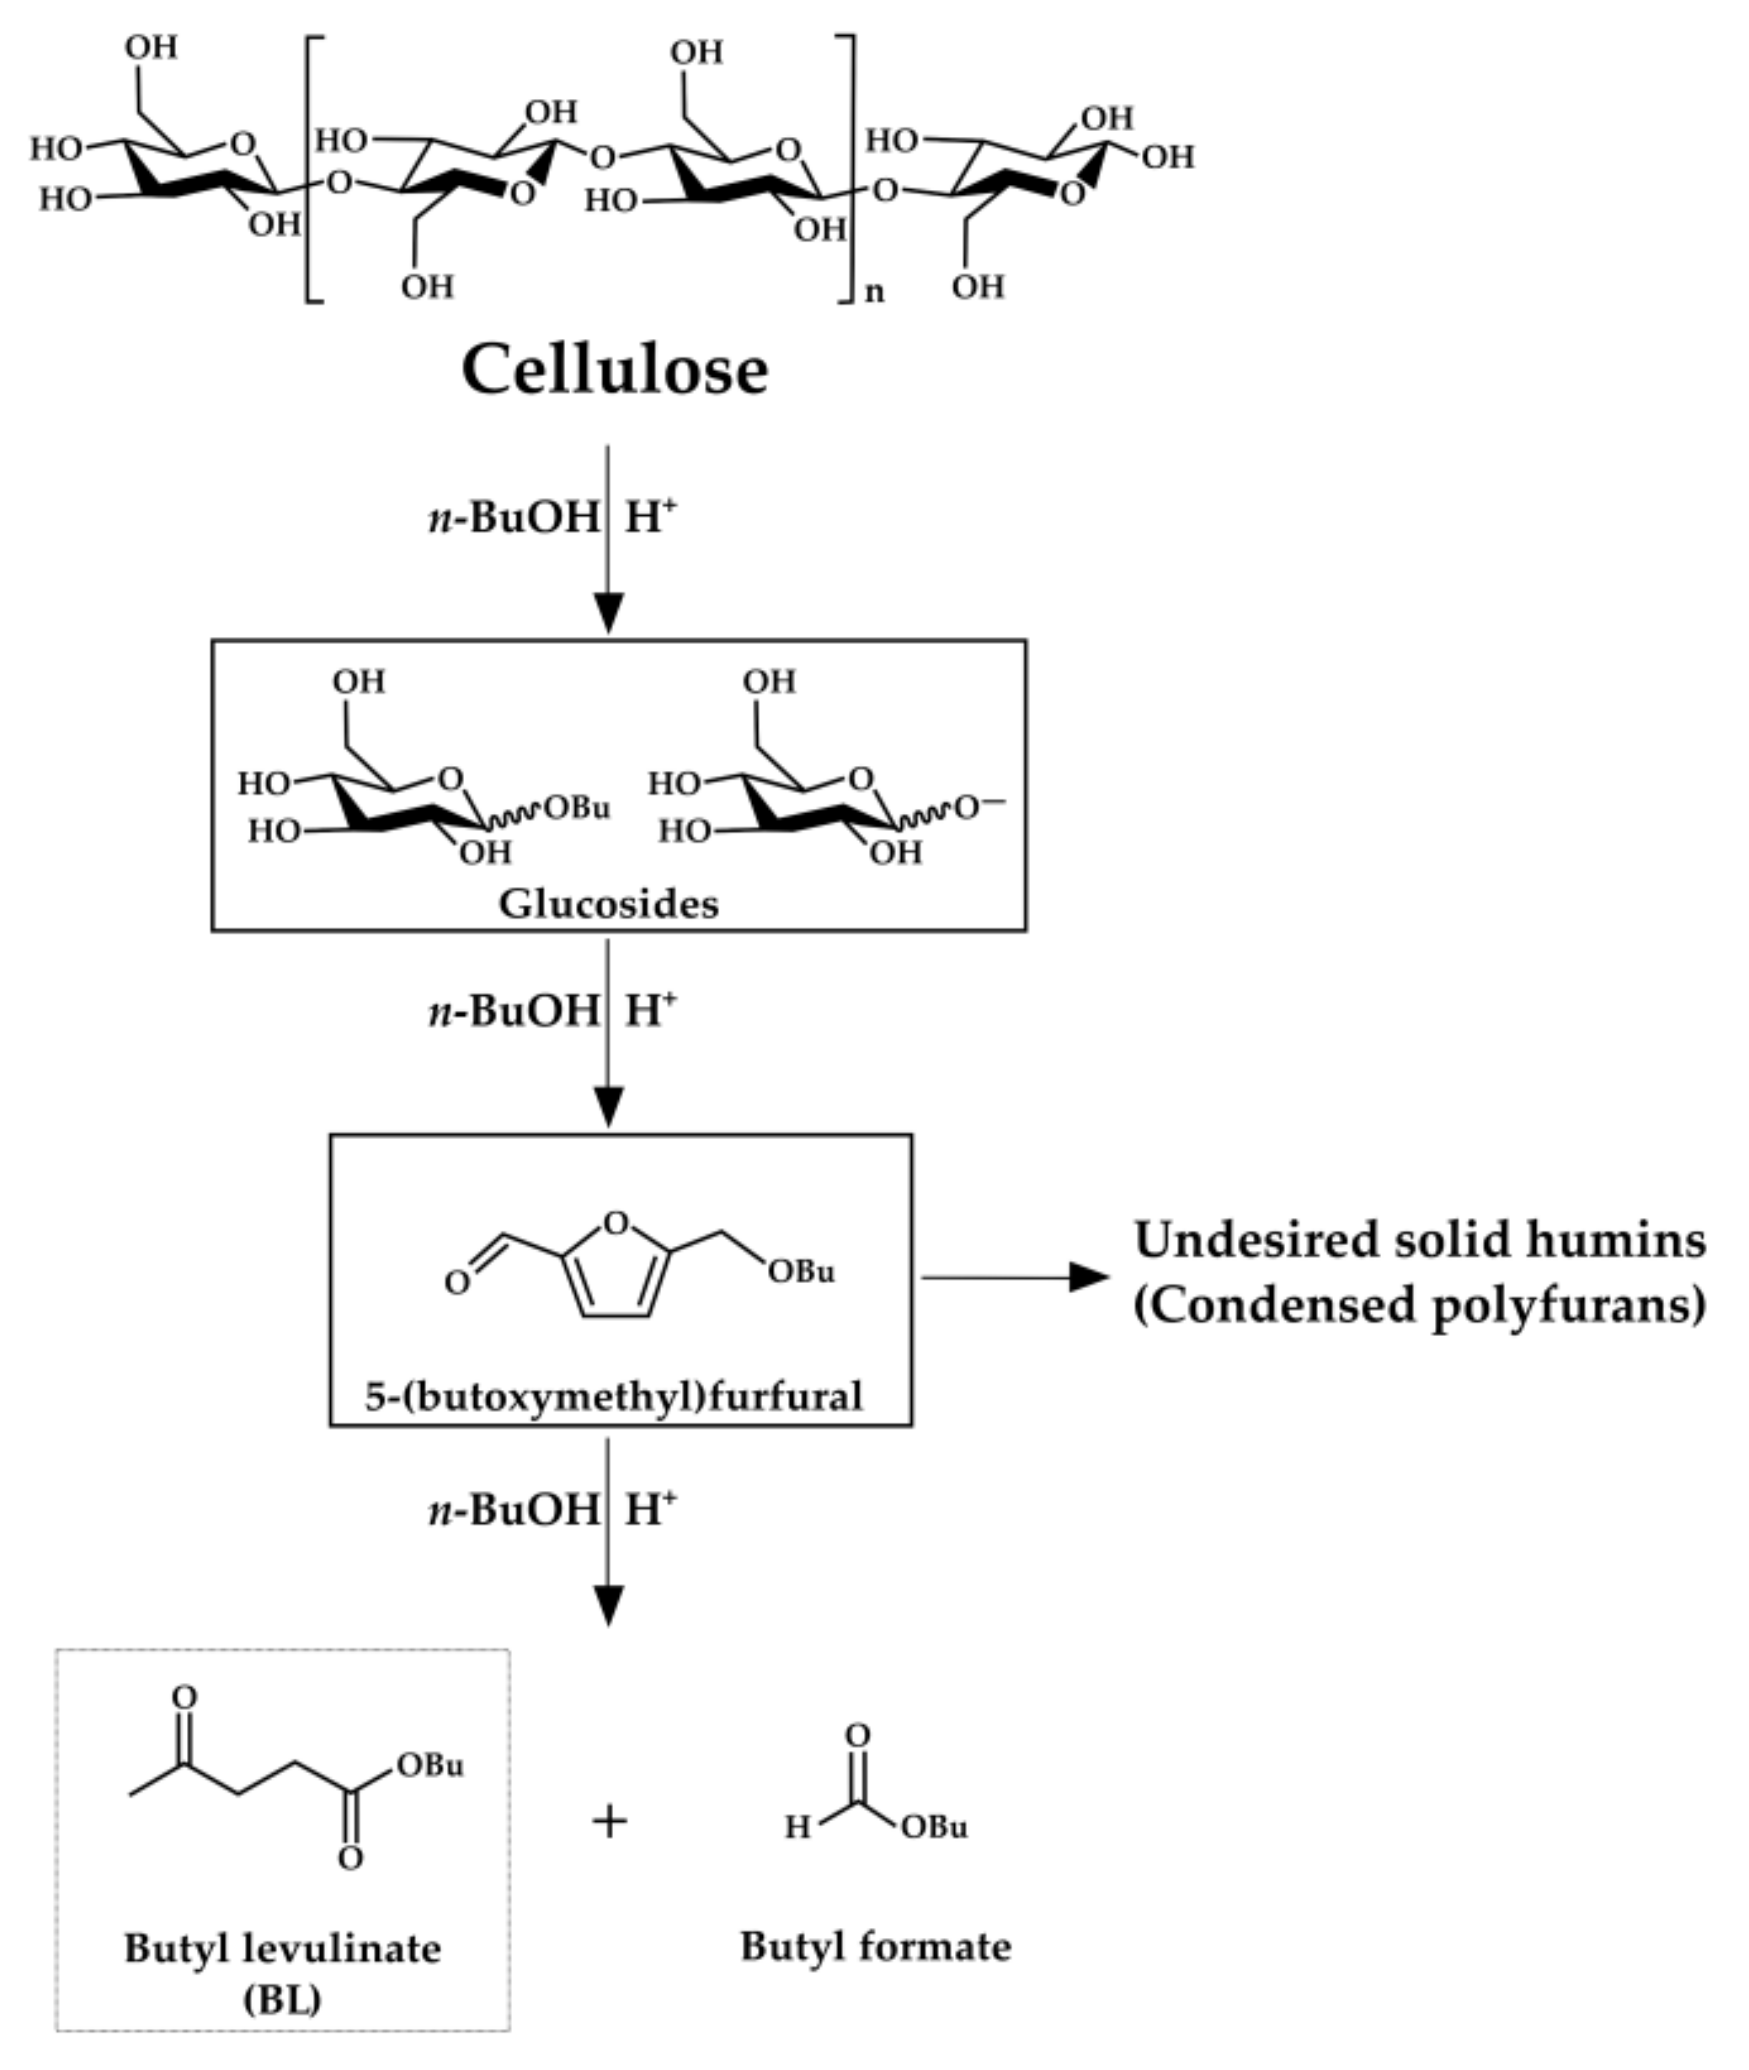
 Figure 2.
Butanolysis of the C6 fraction is a complex pathway, which involves the formation of many reactive species, in particular butyl glucosides and furanic derivatives as the main reaction intermediates, in addition to butyl formate (BF) as the main reaction co-product. Furanic intermediates are very reactive species, which could condense to solid insoluble polyfurans, the humins [40]. The first step of the butanolysis process consists of the depolymerization of cellulose chains to form glucosides, followed by the subsequent formation of furan derivatives, whereas the final step involves the conversion of the furanic intermediates to BL, and all these steps occur in the presence of an acid catalyst [40]. When the above reaction is performed adopting a real solid lignocellulosic biomass, the use of homogeneous catalysts is the best choice. Some typical drawbacks, such as the possible corrosion of the equipment, and the recovery of the acid catalyst, need to be further improved by adopting very low acid concentrations and more technological work-up solutions. Moreover, the use of a very low acid concentration in the alcoholysis reaction, which helps to minimize the corrosion of the equipment, should also control the formation extent of by-products, in particular the dialkyl ether [8,14]. In this context, it is noteworthy the work of Démolis et al. [
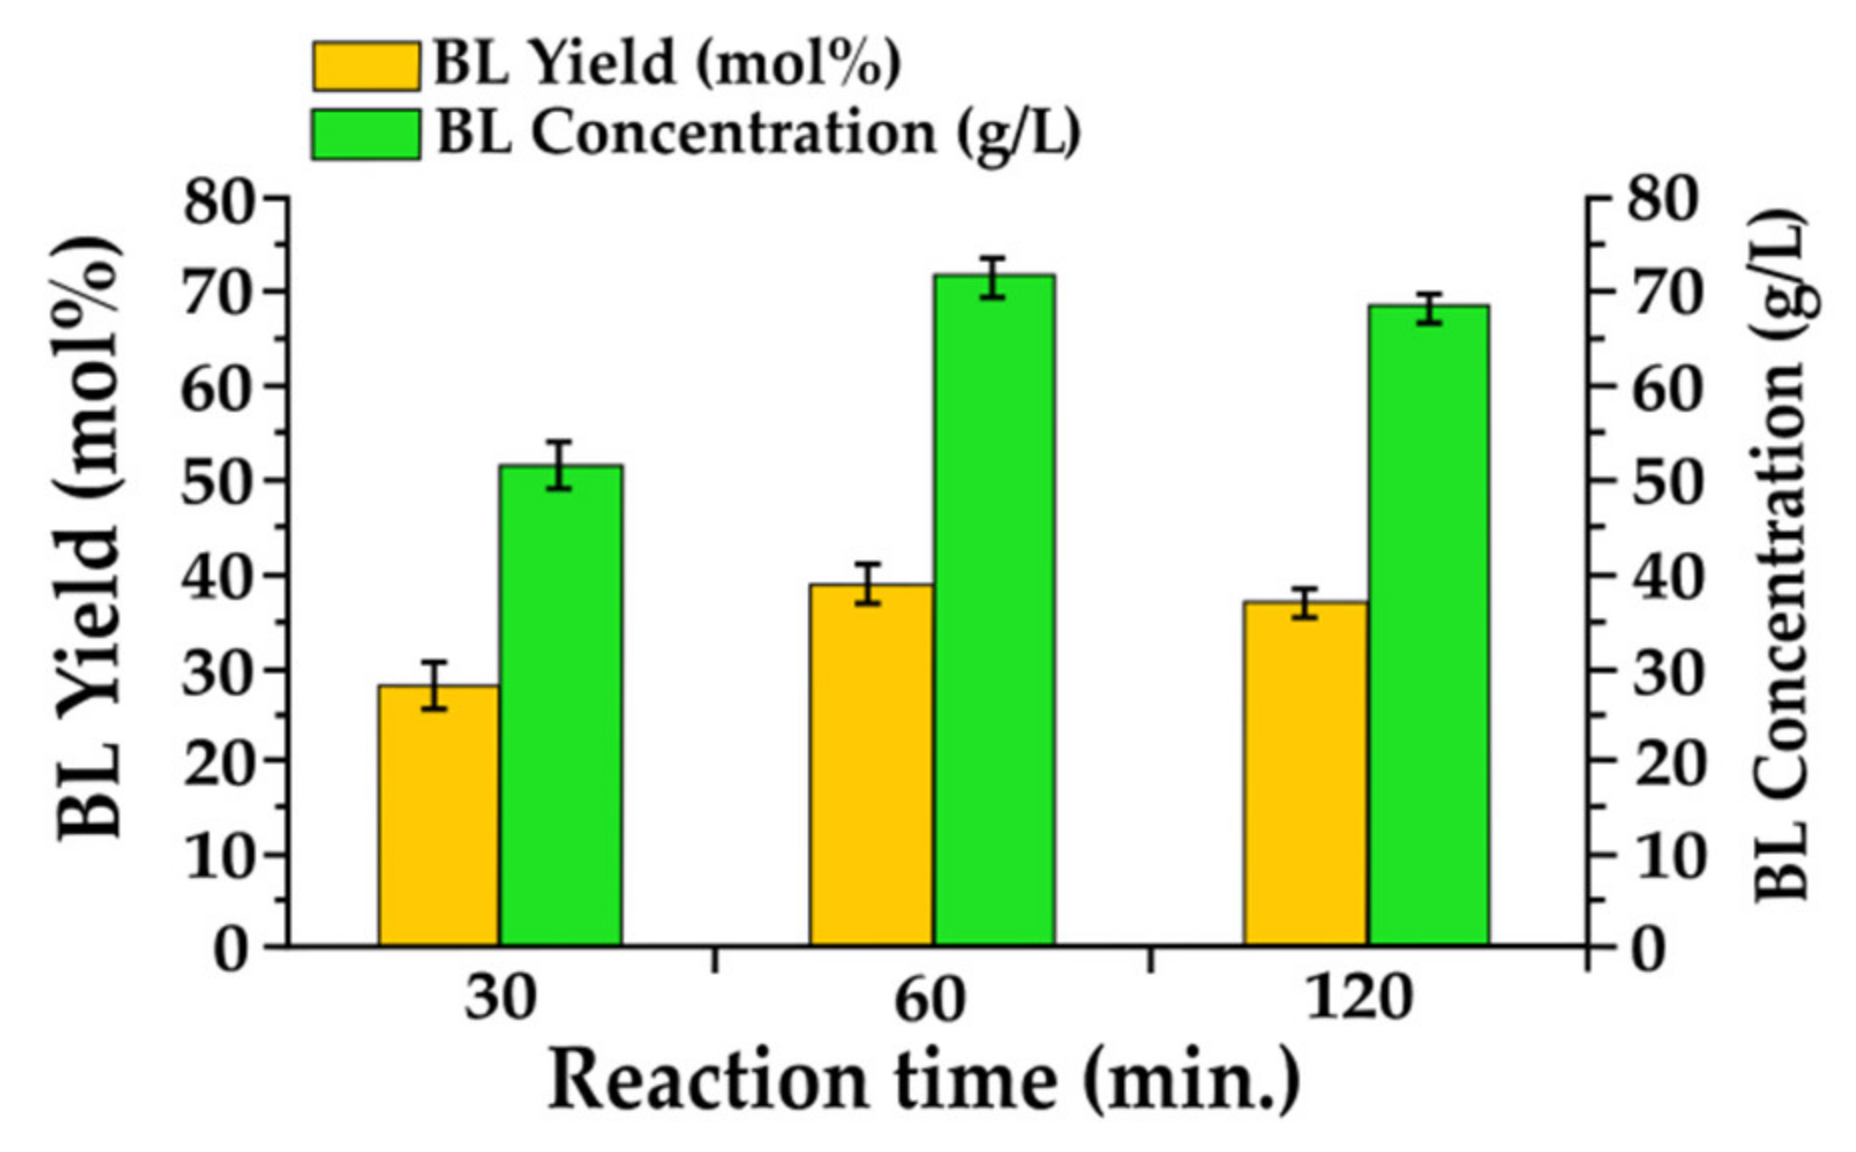
37], who achieved the highest BL molar yield of about 50 mol%, working in an autoclave at 200 °C for 30 min, adopting pure cellulose as starting feedstock (2.4 wt%), with a very low concentration of H2SO4 (0.6 wt%). However, this good BL yield, although academically interesting, was obtained with a low starting cellulose loading, which should represent significant limitations for the development on the intensified industrial scale.
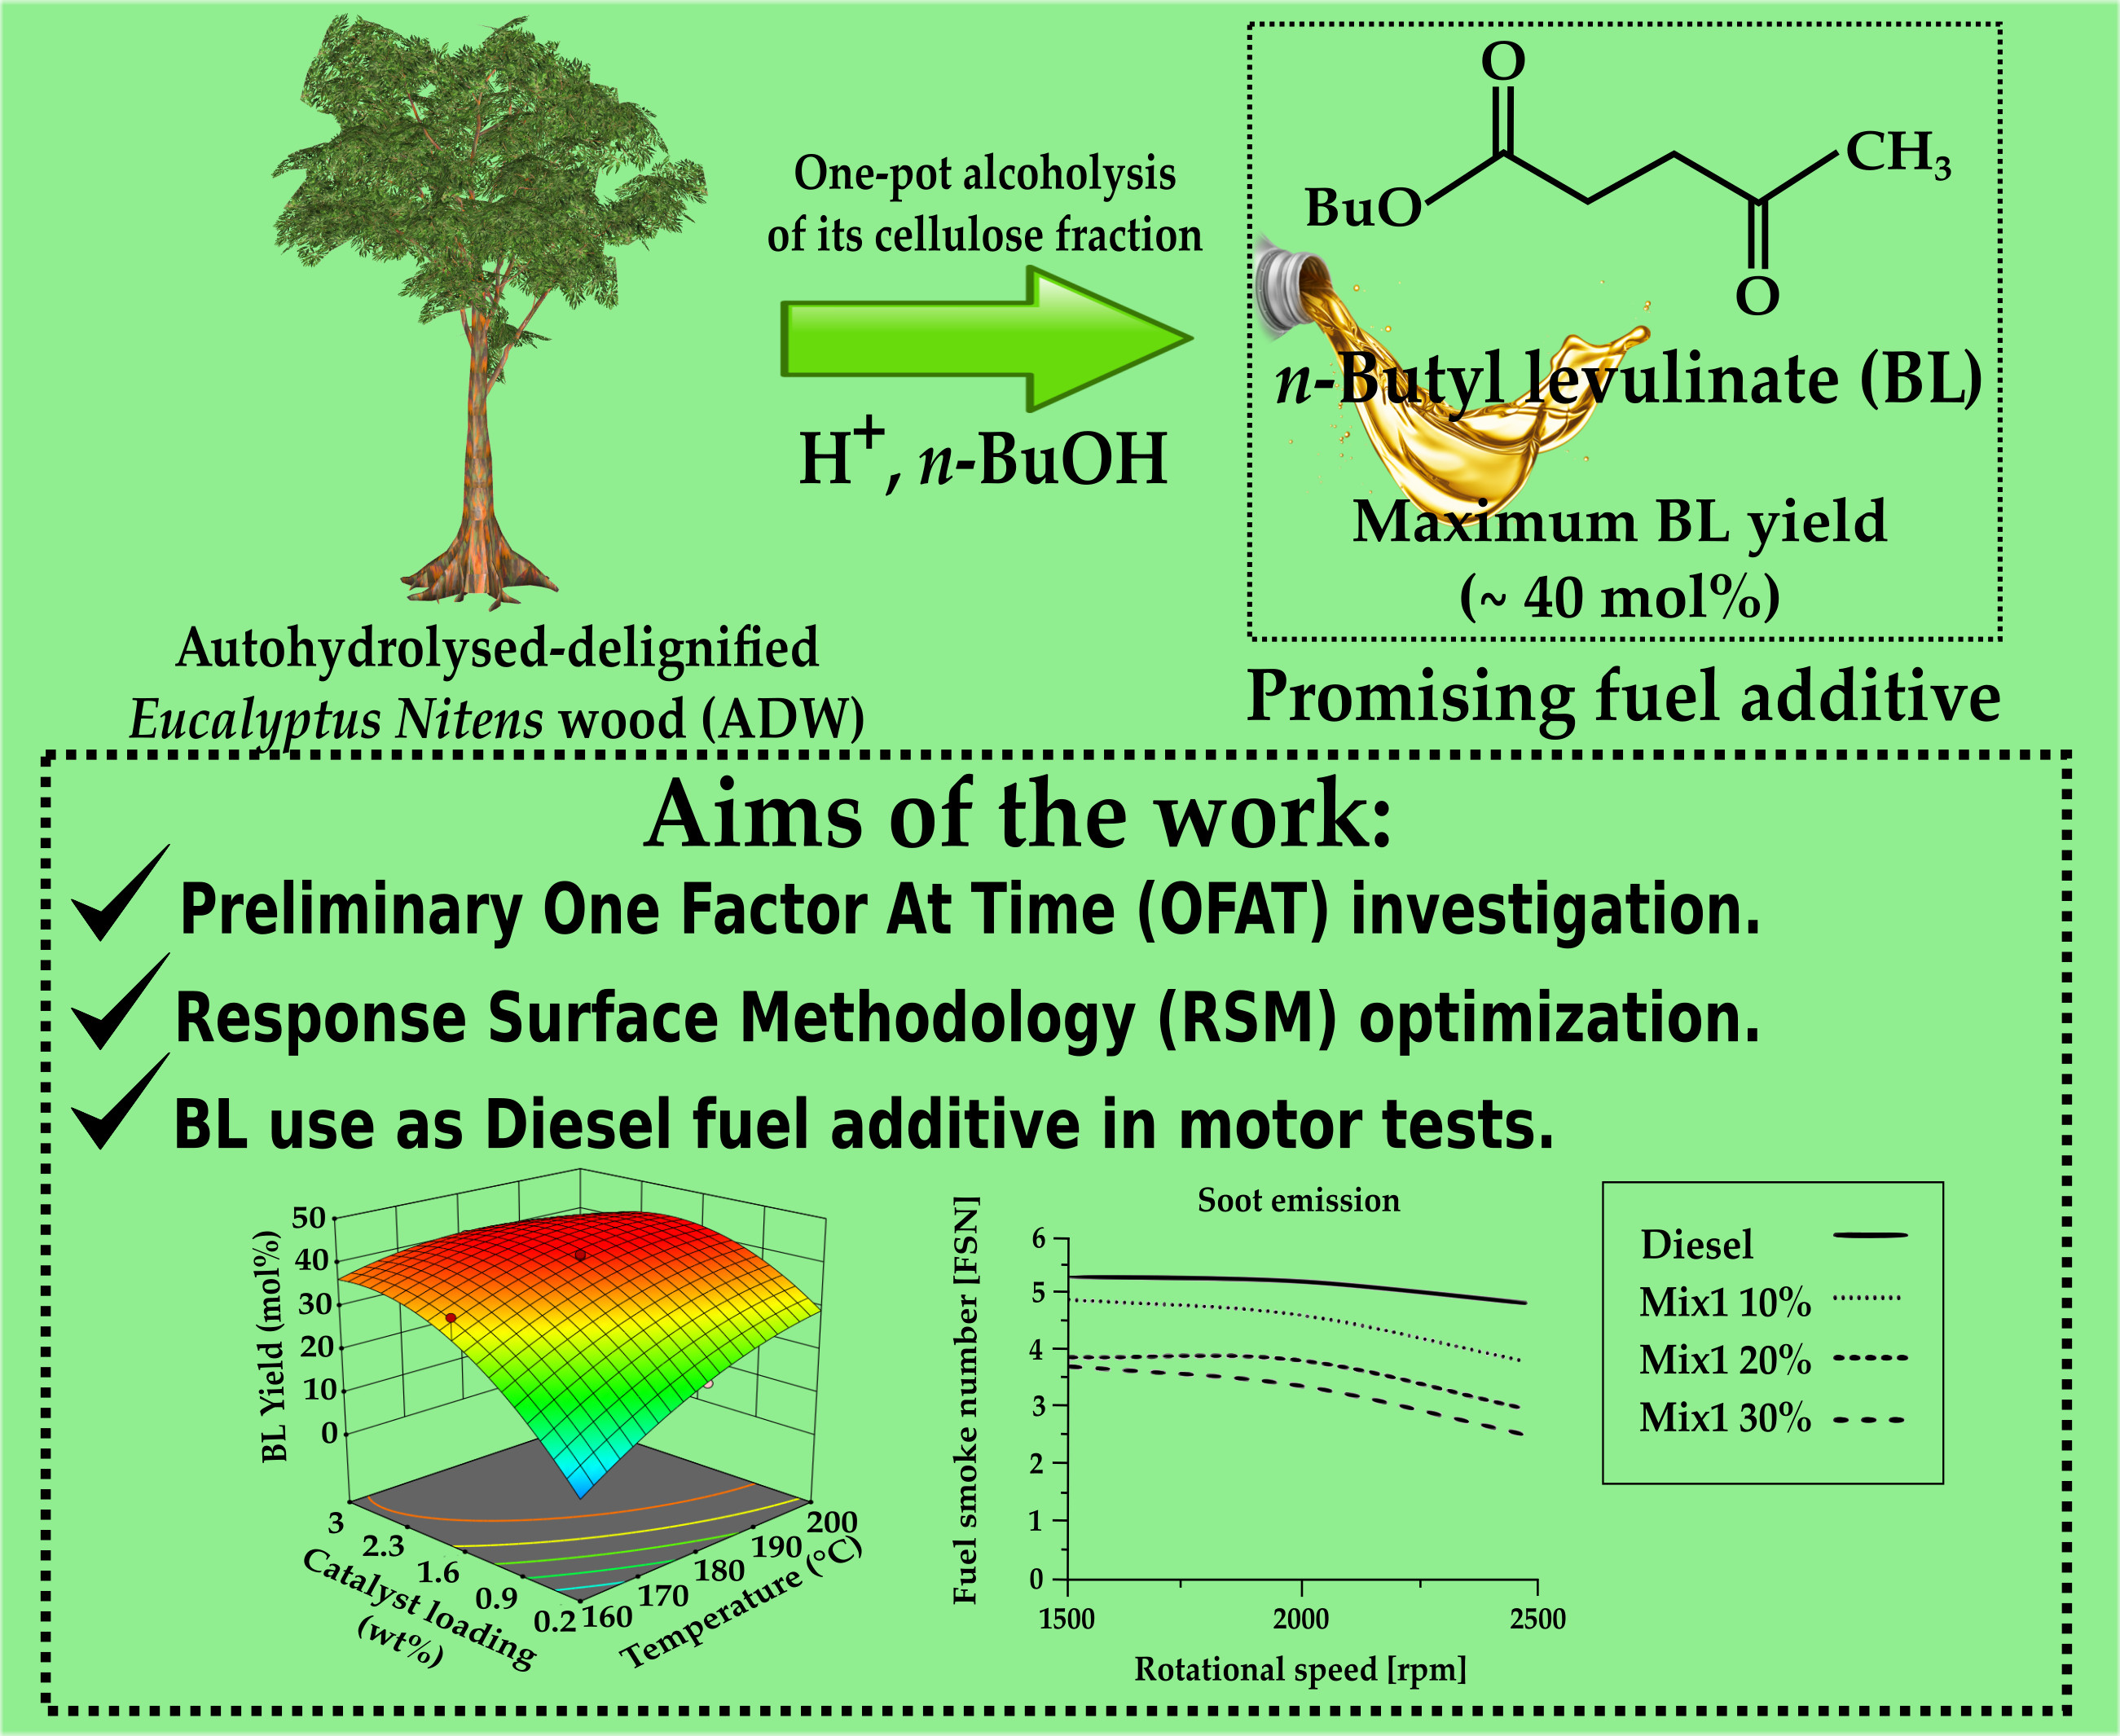
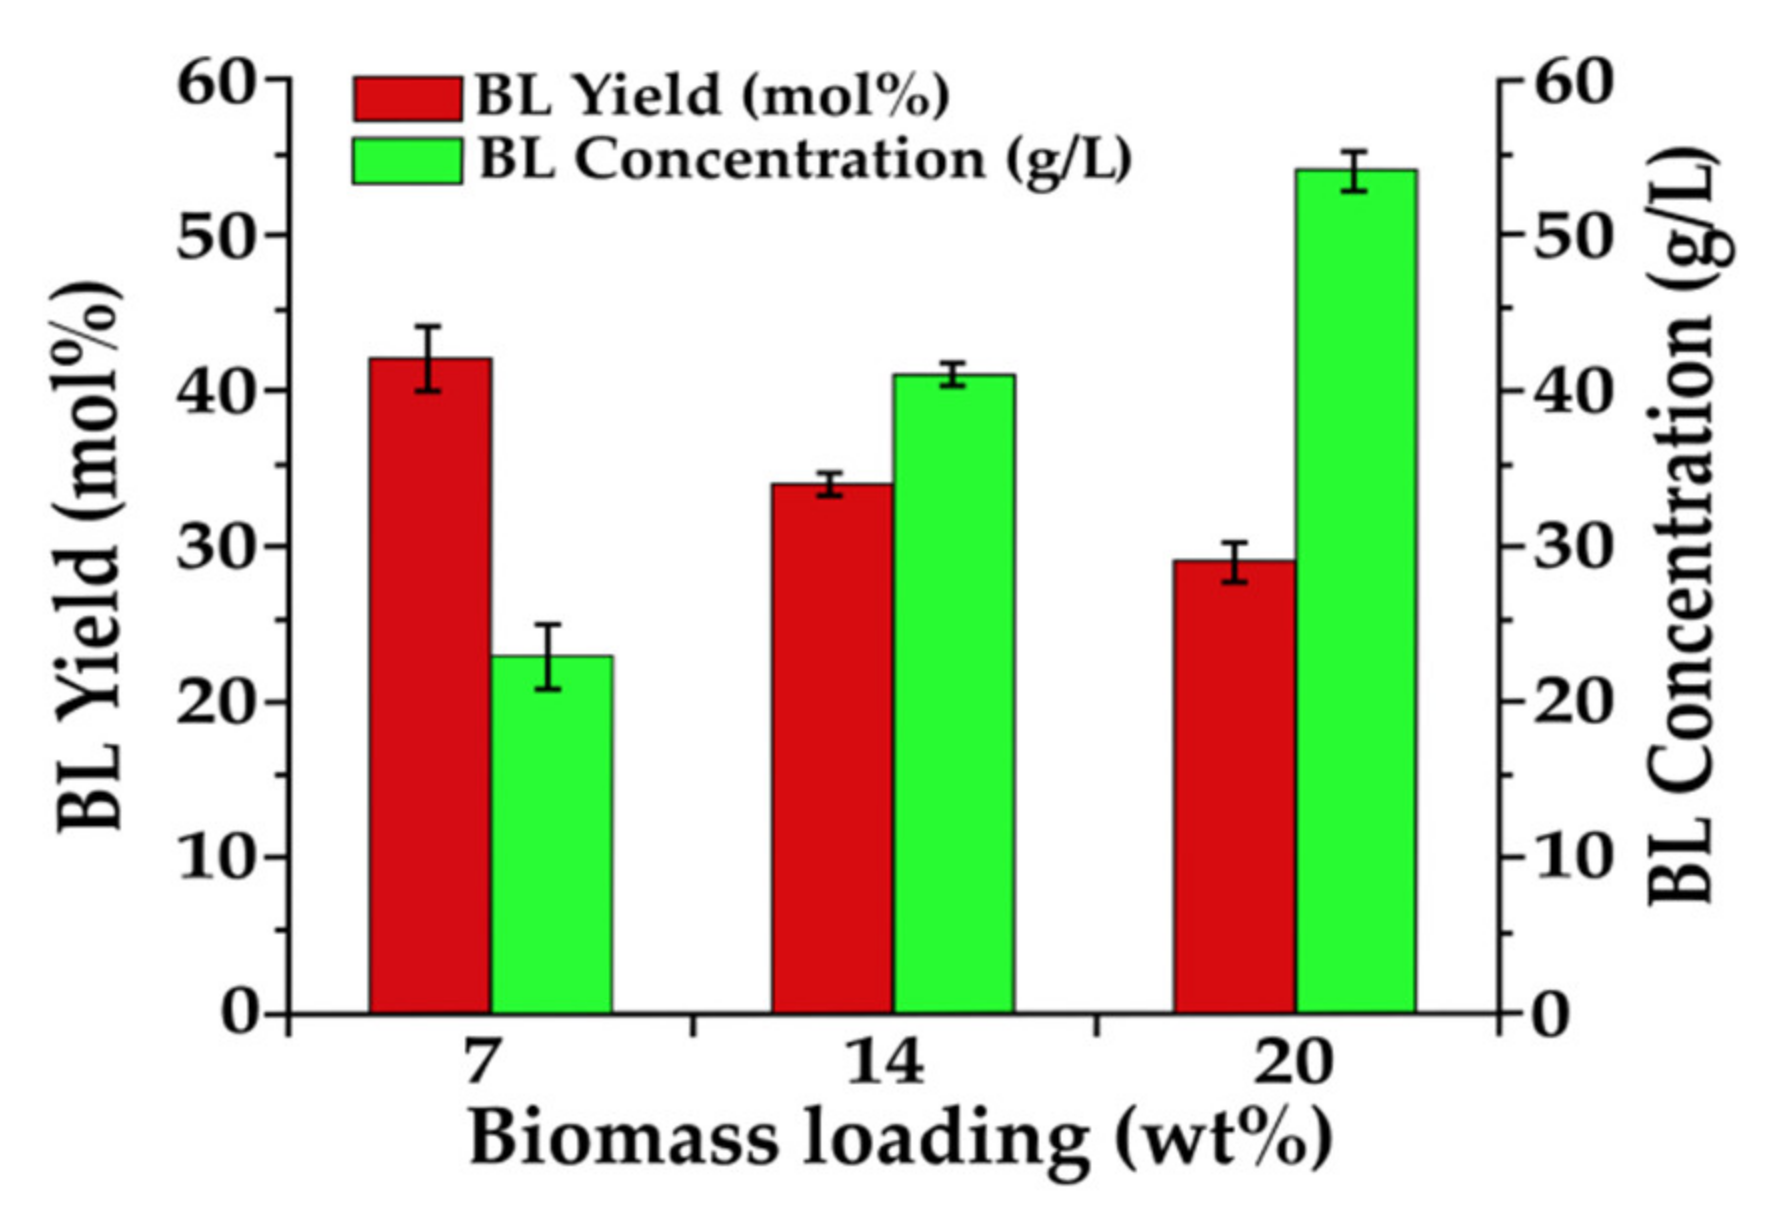
Definitely, at this state-of-the-art, the main bottlenecks of the published works are related to the adoption of (1) model compounds as starting substrates instead of the cheaper and largely available real biomasses, and (2) low substrate loading, which is not a limit for an academic investigation, in a preliminary phase, but it is certainly for the next industrial scale-up. Therefore, the resolution of both these aspects is fundamental for the BL development towards the biofuel market, and this work contributes to filling this gap. In this context, wood is the most abundant type of lignocellulosic biomass and, more in detail, Eucalyptus is a widespread, fast-growing, and widely distributed species, which shows a good adaptation to grow in zones with a high probability of freezing and affording decreased susceptibility to diseases [42,43,44]. It already shows an interesting potential in many industrial fields, as in the paper-making production, where it is already used as a valuable and cheap fiber source. Moreover, it is an ideal energy crop, thanks to its high yield, low energy input for production, low cost, minimal contents of contaminants, and low nutrient requirements. From a different perspective, it may represent a promising feedstock for many biochemical conversion processes, given its high content of C5 and C6 carbohydrates (about 60 wt%) [42,43,44]. The use of this feedstock is particularly advantageous if the complete fractionation and the successive valorization of each component are achieved, according to the perspective of an integrated biorefinery [45]. In this context, the aim of the present work is the complete exploitation of 
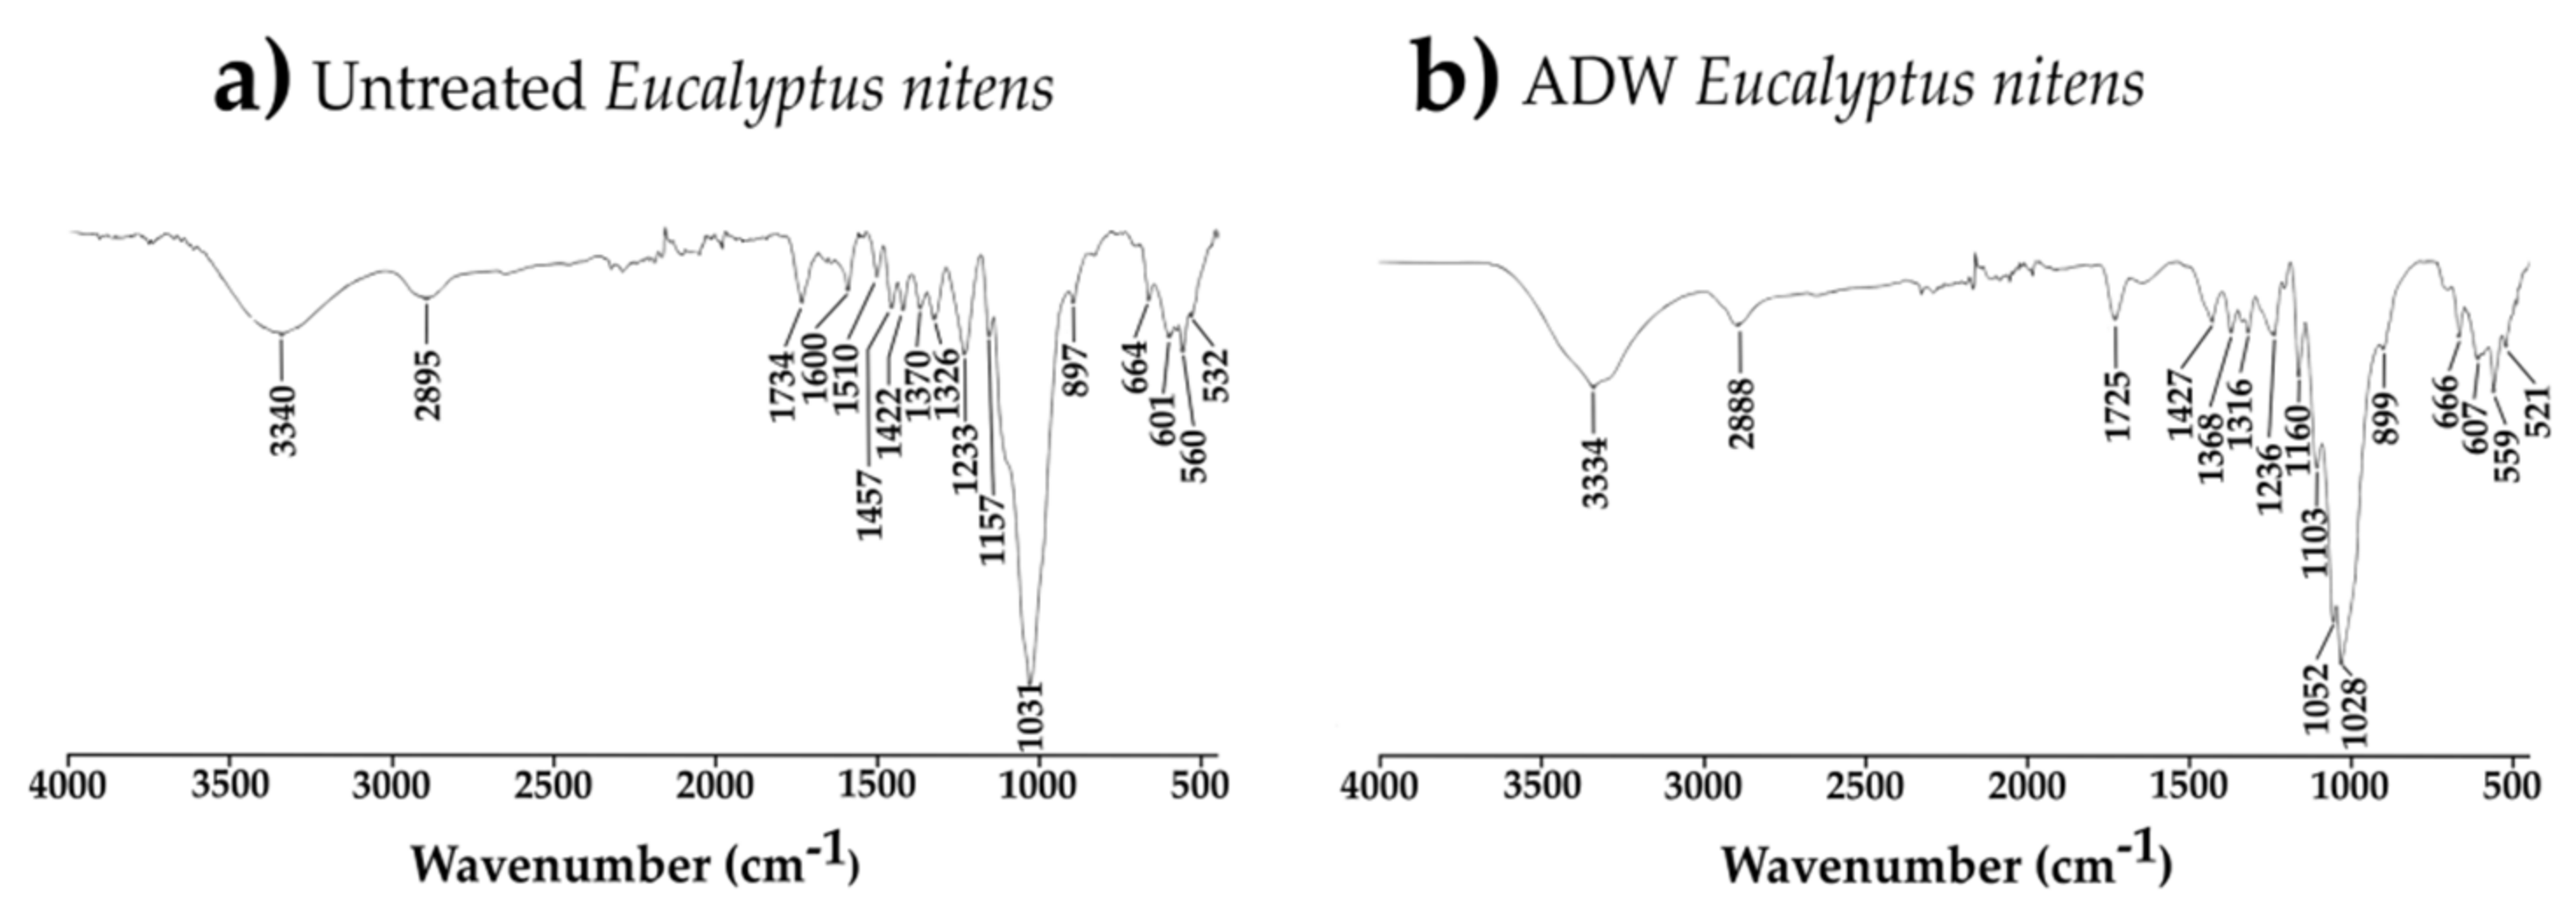
Eucalyptus nitens biomass. For this purpose, pre-treated autohydrolyzed-delignified wood (ADW) Eucalyptus nitens was obtained from a first autohydrolysis treatment of the starting raw biomass in order to remove and exploit hemicellulose and water-soluble extractives, followed by a second step of delignification on the resulting solid through the HCl-catalyzed acetic acid treatment (Acetosolv method). The recovered cellulose-rich feedstock was employed for the one-pot production of BL in n-BuOH, adopting microwave (MW) and/or traditional (TR) heating, in the presence of very dilute sulfuric acid as a homogeneous catalyst. MW heating represents an important tool because it can reduce reaction time and energy consumption, thus improving the efficiency of the process [46,47]. In the specific case of LA esterification, remarkable thermal (kinetic) advantages of MW towards this reaction were already reported by Ahmad et al. [48]. The choice of H2SO4 as the acid catalyst was done taking into account its promising catalytic performances in the alcoholysis reaction to methyl and ethyl levulinates [49,50], while other acid catalysts, such as HCl or H3PO4, resulted less active, for example in the case of the one-pot reaction from cellulose to ethyl levulinate [
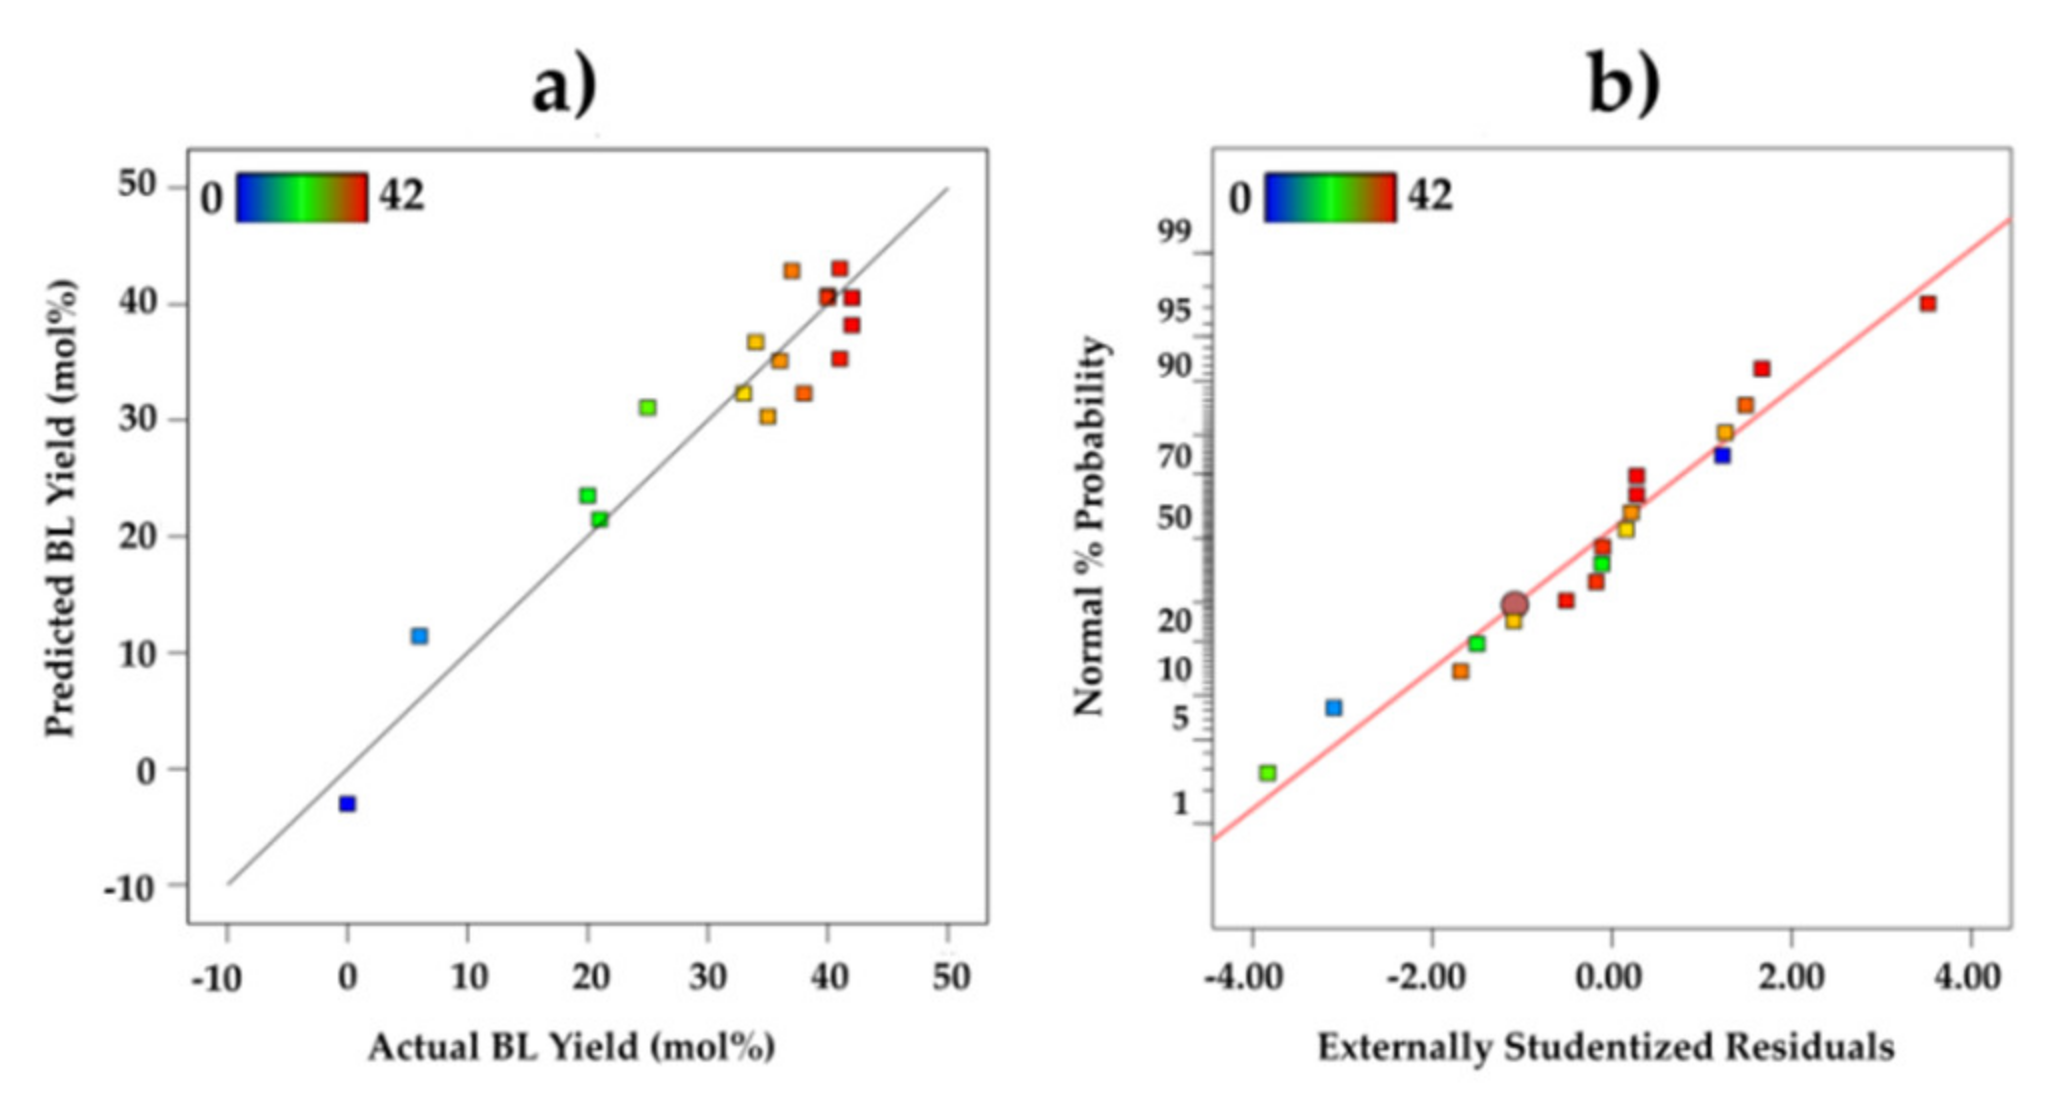
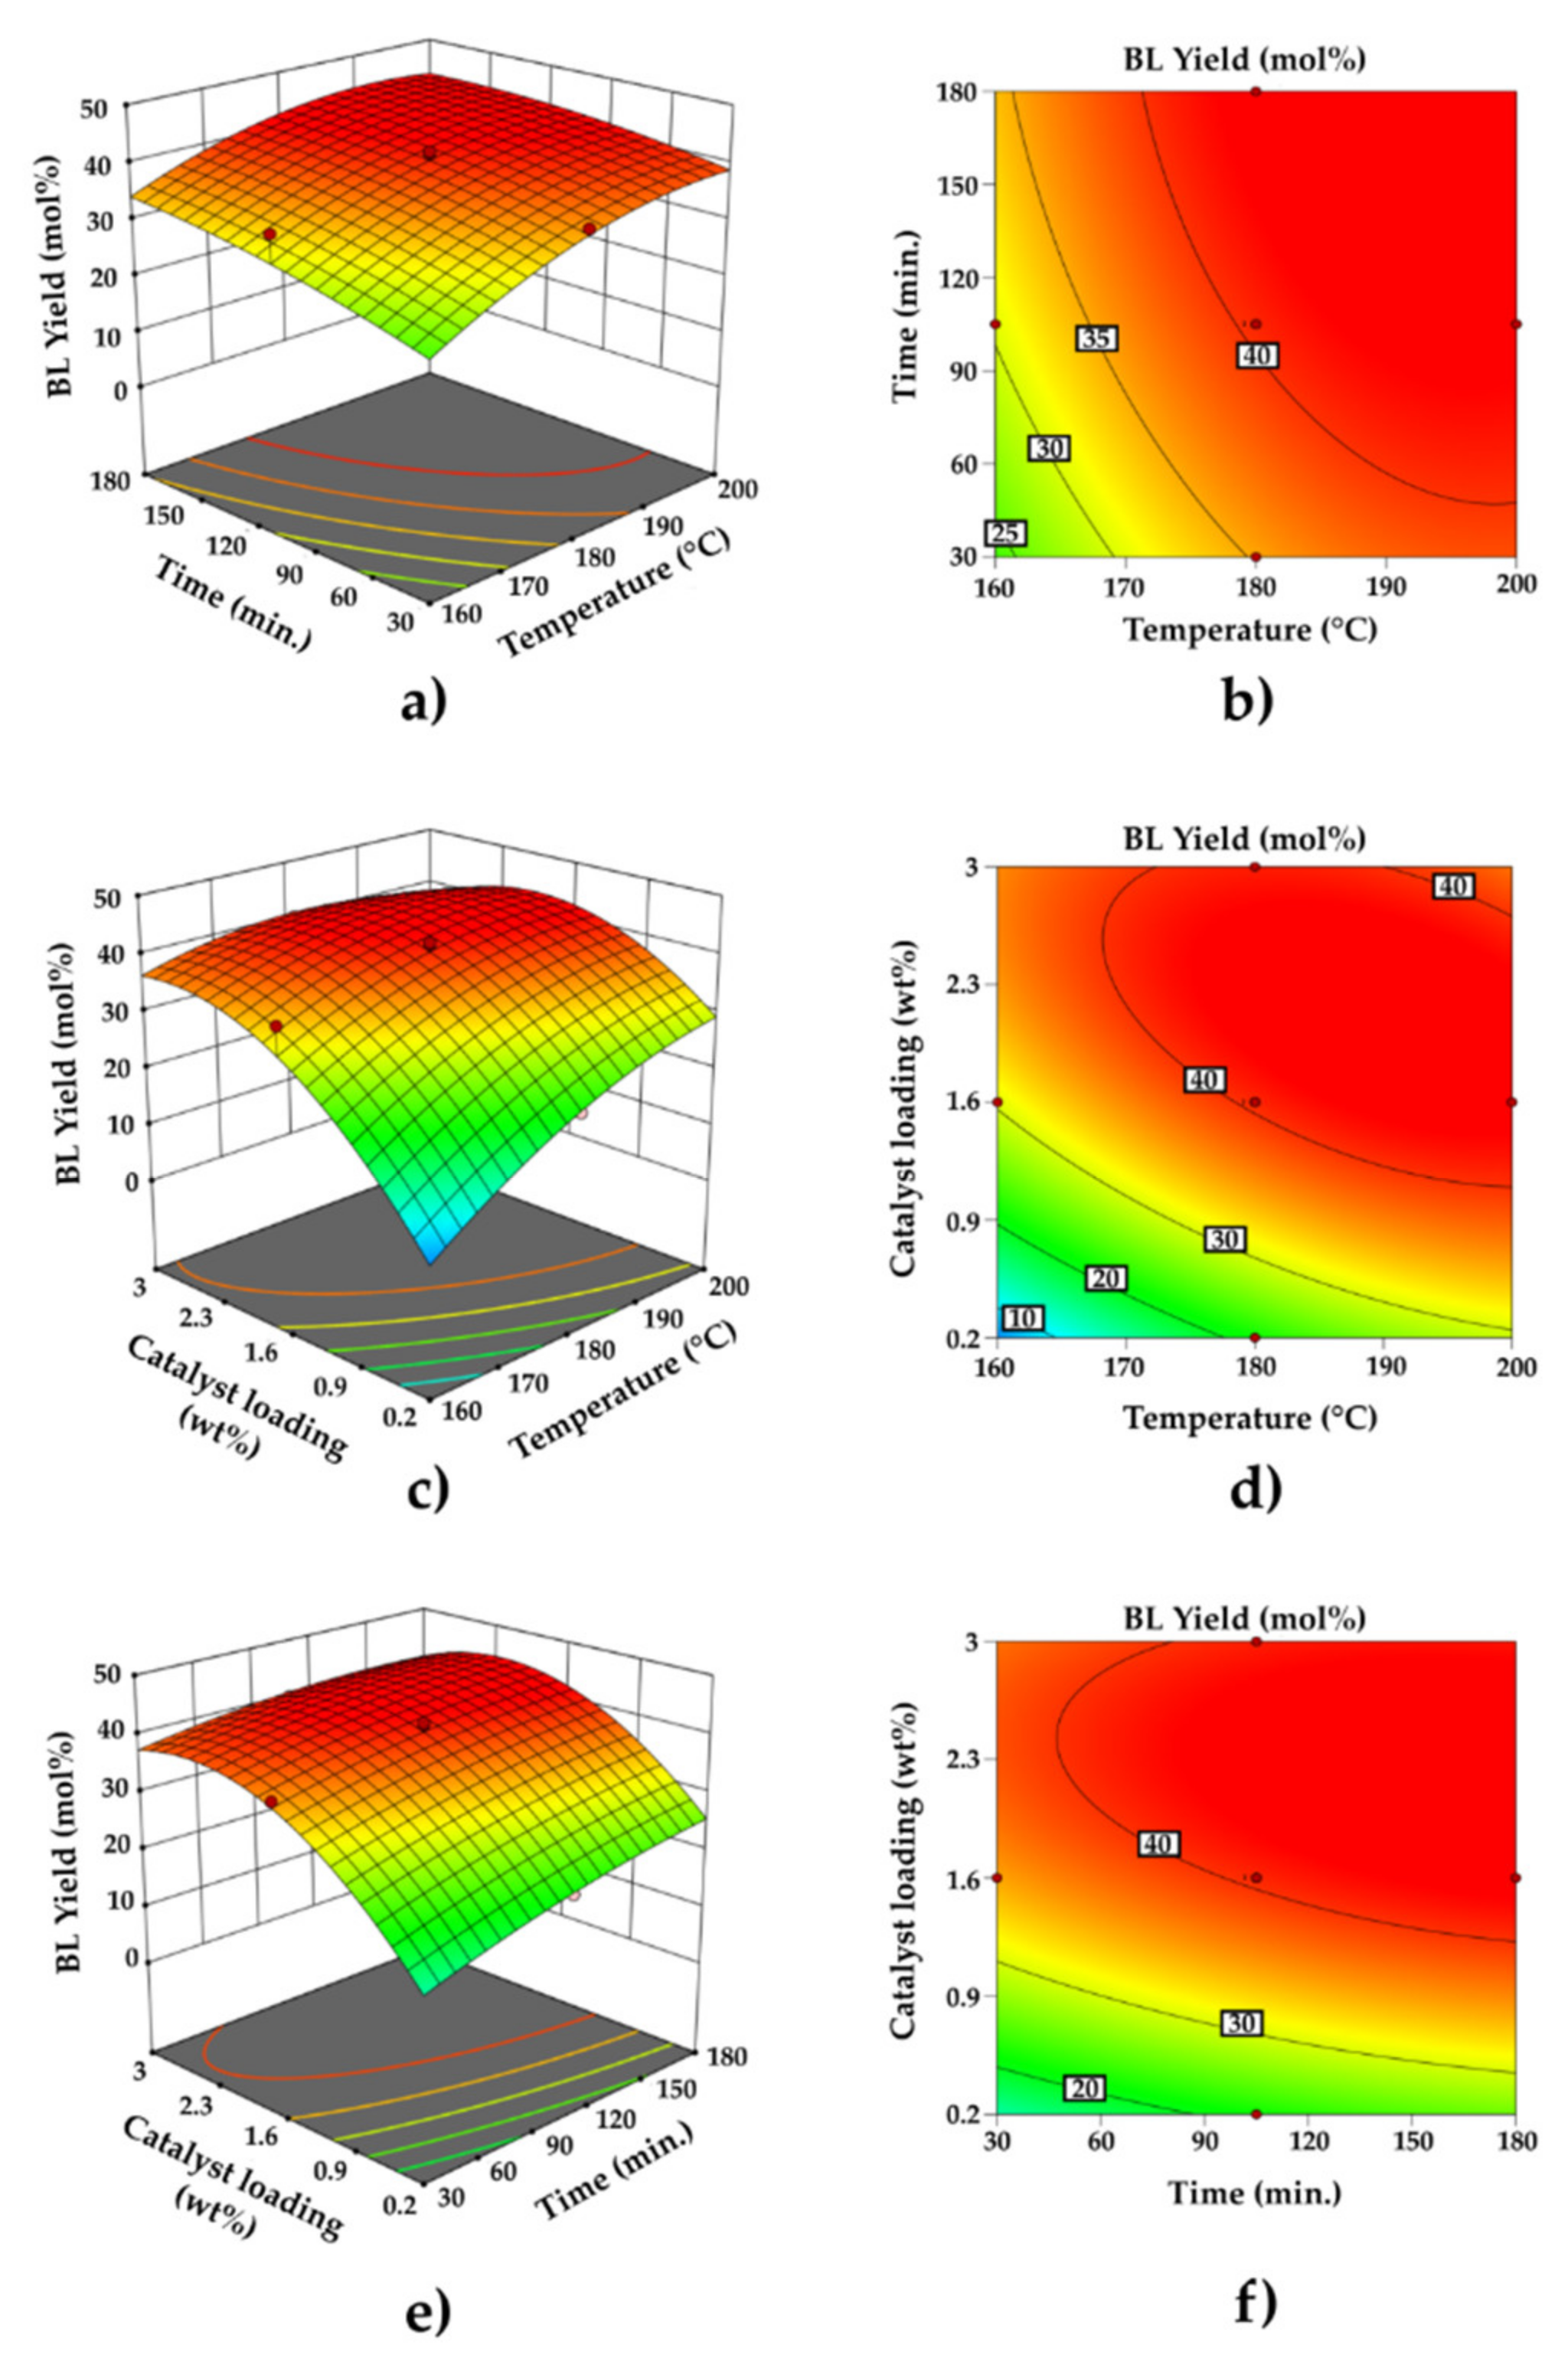
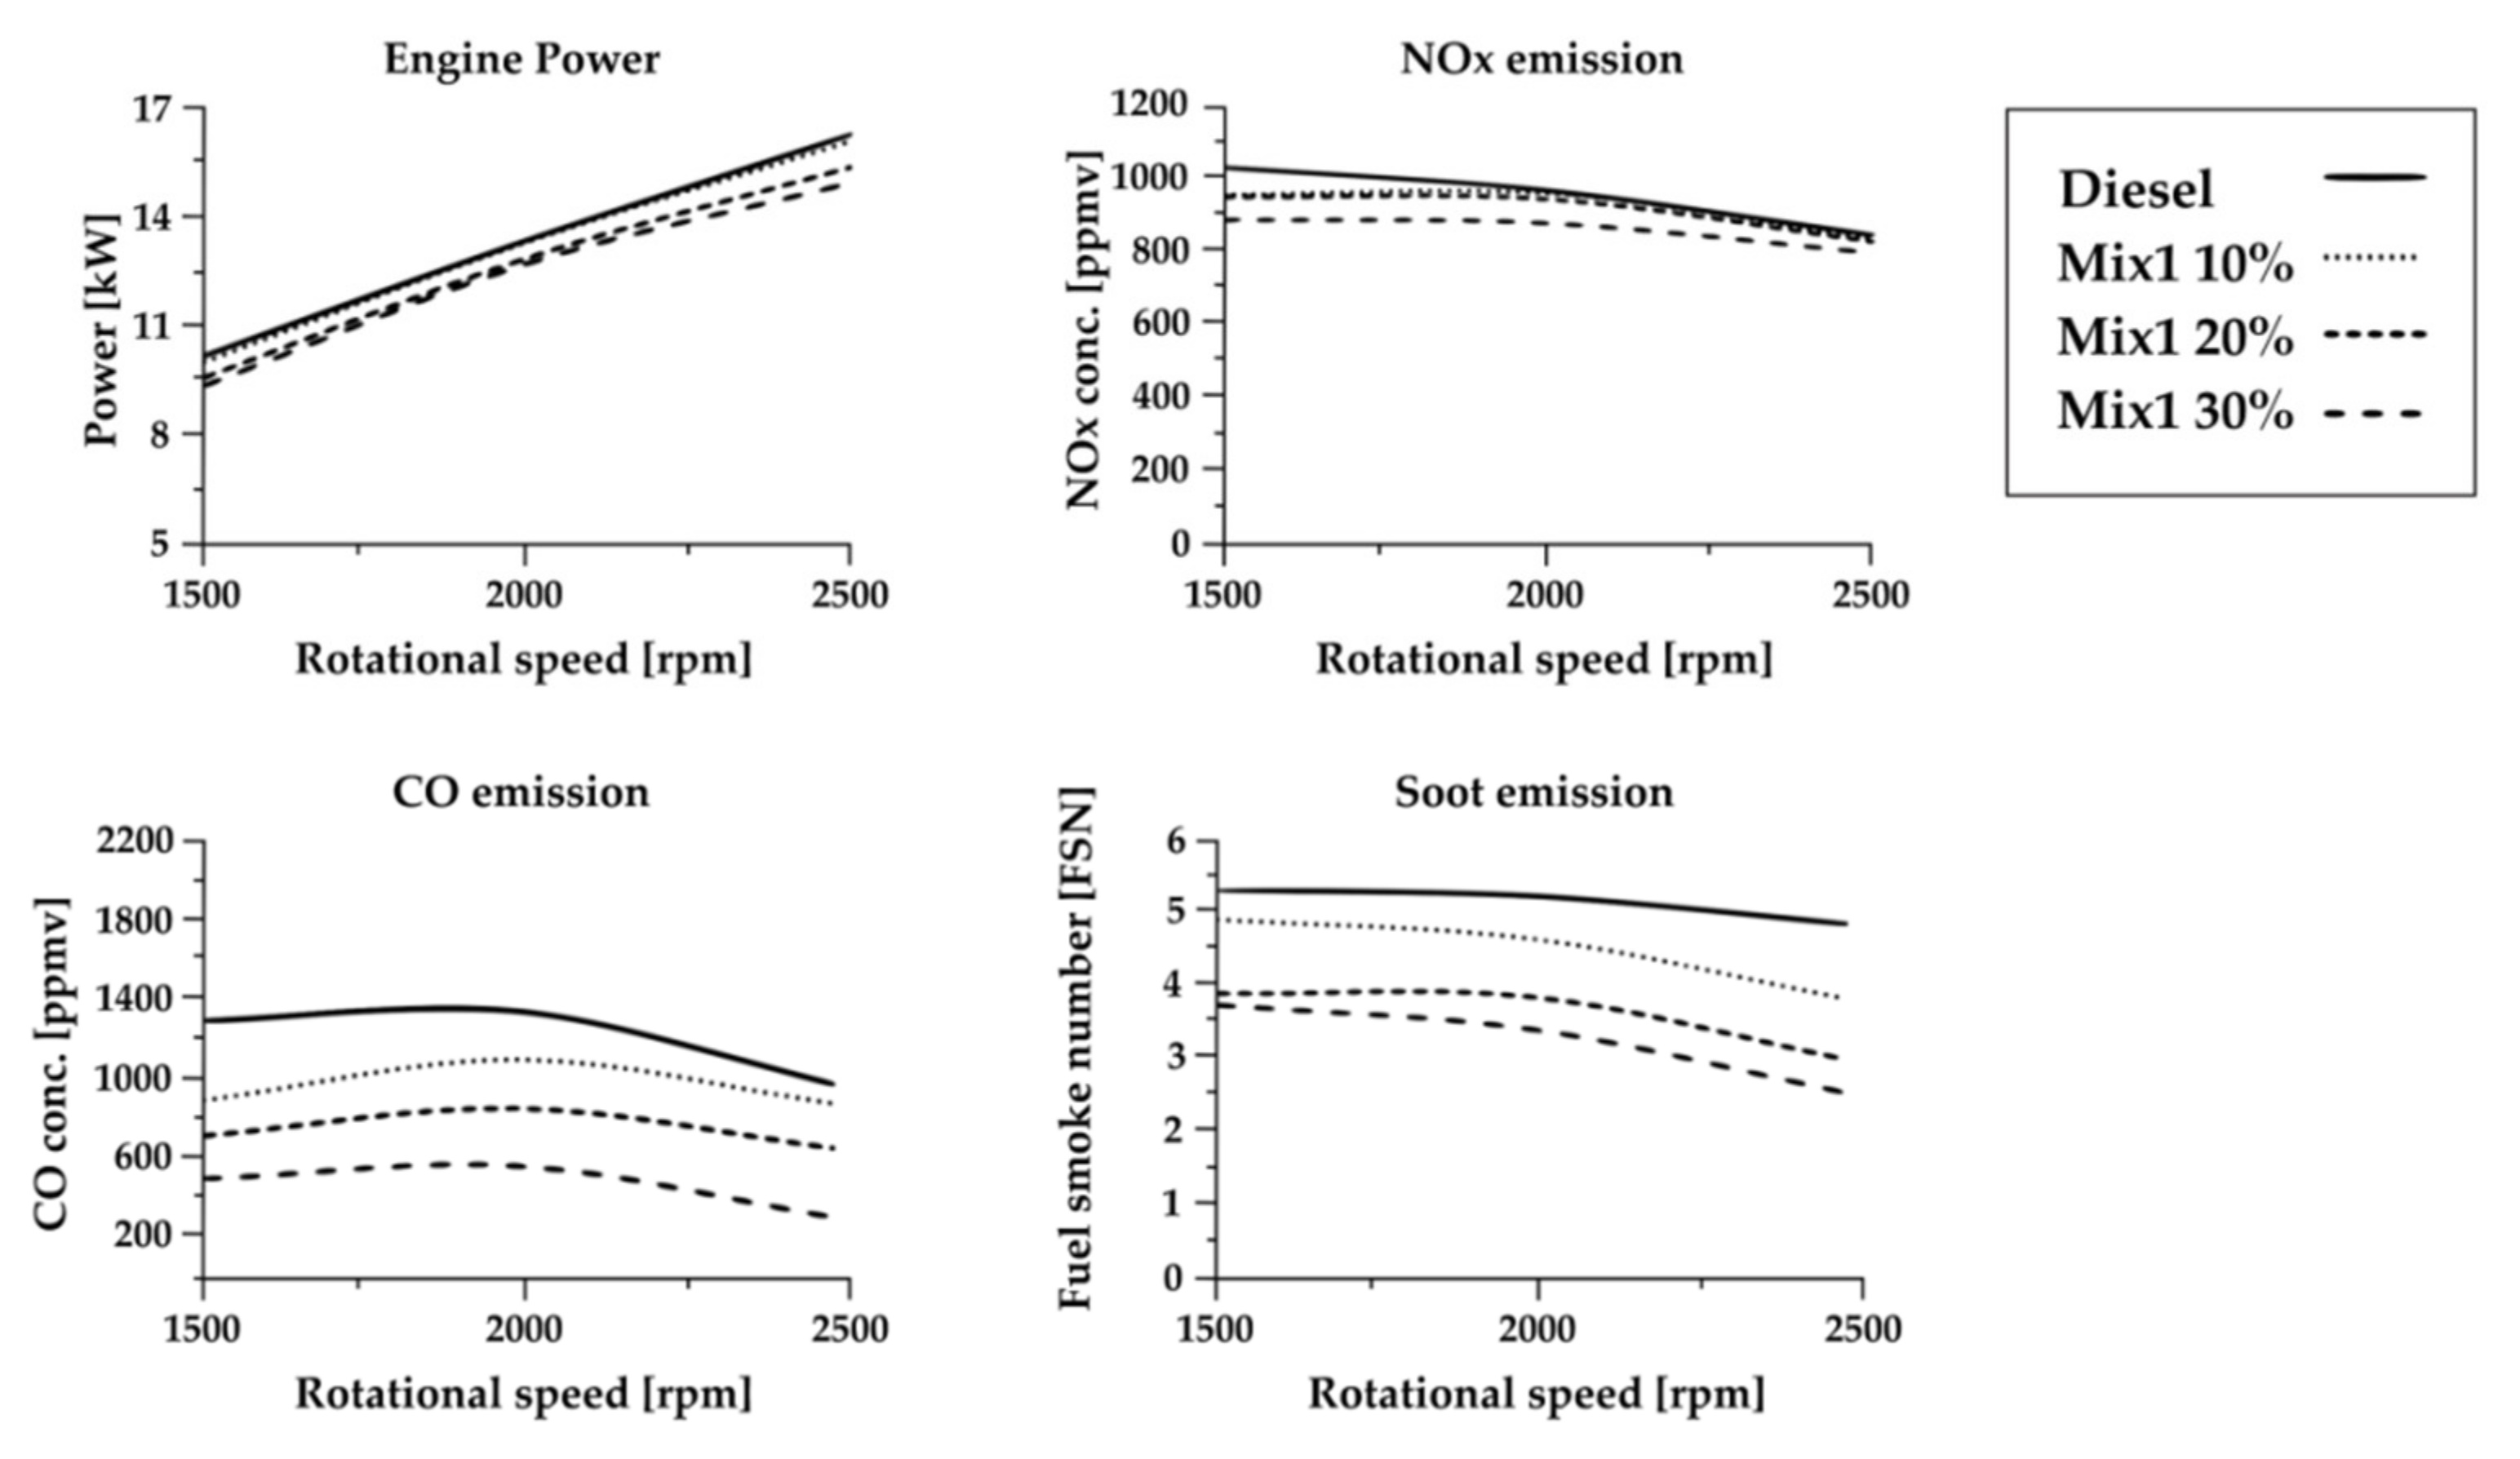
49]. The effects of the main reaction parameters, temperature, reaction time, and acid concentration were investigated by a traditional One-Factor-at-a-Time (OFAT) approach and further optimized by Response Surface Methodology (RSM), developing a Face-Centered Central Composite Design (FCCD), from the perspective of developing the BL process intensification. Finally, a preliminary study of diesel engine performances and emissions for a model mixture with analogous composition to that produced from the alcoholysis reaction was performed in order to evaluate its potential application as an additive for diesel fuel, without separation of each component.

2. Results and Discussion

2.1. Characterization of the Eucalyptus nitens Samples

The chemical composition of the starting untreated Eucalyptus nitens was as follows: 42.0 wt% of cellulose, 14.5 wt% of hemicellulose, 21.4 wt% of Klason lignin, and 22.1 wt% of unidentified compounds (including acid-soluble lignin, ash, extractives, waxes). After carrying out the autohydrolysis and Acetosolv pretreatments, the mass yield of the ADW Eucalyptus nitens sample was 45.0 wt% of the starting raw biomass, and its chemical composition resulted to be as follows: 85.0 wt% cellulose, 2.0 wt% hemicellulose, 4.1 wt% Klason lignin, 4.8 wt% acetyl groups, and 4.1 wt% of unidentified other compounds. The compositional analysis of untreated and ADW Eucalyptus nitens samples confirms the effective enrichment in cellulose and the depletion in hemicellulose and lignin as a consequence of the chemical pre-treatments [51].
XRD analysis of the untreated and ADW Eucalyptus nitens samples was attained in order to estimate the crystallinity index (CI) of the cellulose fraction, a paramount parameter for understanding the behavior of biomass to the subsequent butanolysis reaction, achievable under an appropriate severity degree [52]. The XRD spectra of the starting untreated and ADW Eucalyptus nitens biomasses are reported in Figure 3. Here, deconvoluted curves were reported, including that due to amorphous cellulose (at about 2θ = 21.5°) and those related to the crystalline planes, with Miller indices of 101, 10ī, 002 e 040.
A higher crystallinity degree was obtained for the ADW sample rather than for the untreated one (46.8 versus 43.3%, respectively), ascribed to the partial removal of both lignin and hemicellulose fractions for the ADW sample as a consequence of the pre-treatment, leading to greater exposure of the crystalline cellulose fraction [53]. Besides, autohydrolysis pre-treatment allowed the preferential removal of the amorphous component of the cellulose, leaving almost unchanged the crystalline portion [54].
FT–IR characterization of the untreated and ADW Eucalyptus nitens samples was also carried out, and the acquired spectra are reported in Figure 4.
In the IR spectrum of the untreated Eucalyptus nitens sample, typical bands of biomass macro-components, cellulose, hemicellulose, and lignin derivatives, are detected, such as that at about 3400 cm−1, assigned to the O-H stretching, and that at about 2900 cm−1, due to the C-H stretching. Moreover, the absorption band at about 1730 cm−1 is assigned to the C=O stretching of ester bonds, such as acetyl derivatives, while those at 1600 cm−1 and 1510 cm−1 indicate the presence of C=C ring vibrations, which are typical of lignin units [55,56]. In the region between 1500 and 1300 cm−1, absorption bands ascribed to the bending of the O-H bonds and the vibrations of the methyl and methylene groups of both lignin and cellulose are present. The absorption bands between 1300 and 1200 cm−1 are due to the stretching of the C-O bonds of the alcoholic, phenolic, and carboxyl groups. The shoulder at about 1160 cm−1 can be assigned to the stretching of the C-O-C bond of the hemicellulose and cellulose, while the absorption bands at about 1030 cm−1 and that at about 900 cm−1 are due to the stretching of the C-O-C β-glycosidic bonds of the cellulose [55,56]. Regarding the IR spectrum of ADW Eucalyptus nitens biomass, the absorption bands of lignin rings at 1600 cm−1 and 1510 cm−1 are absent, thus confirming the efficacy of the Organosolv treatment. In addition, a new absorption band is present at about 1050 cm−1, which is uniquely assigned to the C–O stretching of the cellulose [57], thus indirectly confirming the occurred cellulose enrichment for the ADW Eucalyptus nitens sample. The other absorption bands are similar to those discussed for the untreated Eucalyptus nitens biomass.

2.2. Univariate Optimization: OFAT Approach

After having demonstrated the occurred cellulose enrichment of the ADW Eucalyptus nitens, this biomass was our preferred choice for performing the next one-pot butanolysis to BL, thus further developing the biorefinery concept of this biomass. For this purpose, alcoholysis of ADW Eucalyptus nitens (range of biomass loading: 7–20 wt%) in n-BuOH was preliminarily investigated by a traditional One-Factor-at-a-Time (OFAT) approach, employing both MW and TR heating, in the presence of 1.2 wt% H2SO4 (Table 1). Starting from the published results [8,36], in the beginning, the biomass loading of 7 wt% and the temperature of 190 °C, under MW heating, were selected for studying the behavior of the reaction (Runs 1–3, Table 1). At the increase of the reaction time, the BL molar yield raised to 42 mol% after 15 min. The extension of the reaction time did not affect the BL molar yield, which was stable at 42 mol%. Under the optimized reaction conditions (MW, 190 °C, 15 min), the comparison between ADW and untreated Eucalyptus nitens biomass was investigated (Runs 2 and 4, Table 1): the employment of the starting crude Eucalyptus nitens without any pre-treatment allowed us to obtain the same BL molar yield of 42 mol% as the corresponding ADW sample, but the BL concentrations in the final reaction mixtures were 23 g/L for the ADW sample against 12 g/L for the crude Eucalyptus nitens due to the higher cellulose content in the ADW biomass. Finally, a further test employing TR heating was carried out (Run 5, Table 1) employing the ADW Eucalyptus nitens wood as substrate: after 120 min, the BL molar yield of 49 mol% was obtained together with the BL concentration of 27 g/L, demonstrating that analogous promising results can be also achieved with TR heating, even if a longer reaction time was necessary.
Taking into account the low cost of the starting biomass, it is more important to achieve high BL concentrations in the final mixture rather than to maximize the BL molar yield respect to cellulose fraction present in the starting biomass, making the entire process economically convenient due to the significant reduction of the purification cost, from the perspective of the high gravity approach [58]. On this basis, the biomass loading was increased to 14 and 20 wt% and the obtained results adopting MW heating, working at 190 °C, for 15 min, in the presence of H2SO4 1.2 wt%, are shown in Figure 5.
The increase of the initial biomass loading caused the decrease of BL molar yield as expected considering that, when a higher initial biomass loading is employed, adopting the same amount of catalyst, not only the catalyst/biomass weight ratio decreases, but also the mixture mixing can become more difficult, working in slurry phase. However, at the increase of initial biomass loading, the decrease of BL molar yield was not significant and it was associated with a huge increase of BL concentrations, highlighting the effectiveness of the high gravity approach. The same reactions were also carried out under TR heating to confirm the feasibility of this reaction on a larger scale, and the comparison between the two systems is shown in Table 2.
The shift from the MW to the TR heating system was demonstrated, in the latter case requiring much longer reaction times to get comparable BL molar yields. As already achieved for the MW heating, also for TR, the systematic decrease of the BL molar yield, occurring with the increase of the initial biomass loading, may be due to the increase of the substrate/catalyst ratio, leading to an insufficient amount of catalyst, and to the inefficient agitation of the reaction slurry.
At this level of investigation, the above tests with TR heating confirm the MW data, further justifying and claiming our high gravity approach. Good results were achieved with the biomass loading of 20 wt% (Runs 10 and 11, Table 2), and therefore, 25 wt% of biomass loading was also tested, always under TR heating. Unfortunately, in this last case, although the decrease of BL molar yield (35 mol%) was not significant with a related very high BL concentration (87 g/L), considerable practical difficulties were encountered in filtering and recovering the liquid phase. For this reason, even in the case of TR heating, the best result, in the application perspective, is obtained with the biomass loading of 20 wt%. The achieved results are very interesting because, up to now, BL molar yield higher than 30 mol%, corresponding to the best BL concentration of about 70 g/L, with the initial biomass loading of 20 wt%, has never been ascertained under TR heating, opening the way towards the industrial adoption of this approach for BL synthesis.
On the basis of the promising results obtained with the biomass loading of 20 wt%, the best alcoholysis test under TR heating (Run 10, Table 2) was further investigated, adopting lower reaction times (30 and 60 min), to gather more information about the kinetics. These new data are reported in Figure 6. This figure shows that the most significant improvement, in terms of BL molar yield, was achieved already after 60 min. Lower reaction times (30 min) are not sufficient for the complete conversion of the reaction intermediates to BL, while higher ones (120 min) are not advantageous, not leading to further raise of BL molar yield. In terms of BL concentration, the increase is remarkably moving from 30 to 60 min (52 and 72 g/L, respectively), while it remains almost constant at longer reaction times.
The increase of the final BL concentration is certainly a key parameter for the industrial scale-up of the reaction. In our case, only by acting on the biomass loading (up to the maximum of 20 wt%), it was possible to significantly increase the final BL concentration from the perspective of the high gravity approach. To further boost the concentration of the desired BL, it is possible to reprocess the mother liquor with fresh biomass, without adding further solvent and catalyst, according to the cross-flow approach [42]. This approach is certainly advantageous and smart, especially starting from cheap biomasses, as in our case. In this regard, the mother liquor deriving from the best alcoholysis run carried out under TR heating (run at 60 min, Figure 6) was used for a subsequent analogous alcoholysis reaction. In this additional step, a lower biomass loading (10 wt%) was adopted due to the very high viscosity of the liquor, and the results are reported in Table 3.
The final high BL concentration achieved with an additional alcoholysis step (85 g/L) justifies the validity of our approach. Regarding the BL molar yield, the small decrease occurred in the second step, despite the lower biomass loading, is probably due to the presence of reaction by-products obtained at the end of the first alcoholysis step, such as dibutyl ether (DBE), in other words to the lower amount of n-BuOH available for the second alcoholysis step. However, these differences, in terms of BL molar yield, are not significant, being largely rewarded by the increase in BL concentration, the latter being a much more important process output, especially from an industrial perspective, allowing significant cost reduction of purification and separation treatments.

2.3. Design of Experiments and Optimization by RSM

The above promising preliminary results, prompted us to study the combined effect of three main factors, including temperature, reaction time and catalyst loading, on the butanolysis reaction, adopting an FCCD (α = 1). BL molar yield was chosen as the response of interest, but the other main components of the reaction mixture were also determined. The ranges of the independent variables for planning the DOE were selected on the previous OFAT screening: temperature, x1 (160–200 °C); reaction time, x2 (30–180 min), catalyst loading, x3 (0.2–3 wt%). These actual parameters were coded in three levels according to Equation (1):
Xi = (xi − x0)/Δx
where Xi is the coded value of the independent variable, xi is the real value of the independent variable, x0 is the real value of the independent variable at the center point, and Δx is the step change value. The complete case studies of 18 experiments, realized at the constant biomass loading of 20 wt%, are shown in Table 4, together with the respective experimental responses.
The experimental data were analyzed by Design-Expert software and a second-order polynomial model was developed to correlate the process parameters with the response, thus obtaining Equation (2):
Y = 40.54 + 6.27X1 + 3.97X2 + 9.63X3 − 1.41X1X2 − 5.59X1X3 − 1.84X2X3 − 3.95X12 − 1.45X22 − 9.45X32
According to the monomial coefficient value of the regression model equation, the order of priority among the main effects of impact factors is the following: catalyst loading > temperature > reaction time. Linear parameters have a significant synergistic effect on the response, since they have a positive coefficient, whereas the remaining combined and quadratic terms show significant antagonistic effects, thus highlighting the importance of the DOE optimization.
In Table 5, the results of the analysis of variance (ANOVA) are summarized to test the soundness and suitability of the model [59]. The mean squares values were calculated by dividing the sum of the squares of each variation source by their degrees of freedom, and a 95% confidence level was used to determine the statistical significance in all analyses. Results were assessed with p-value and F-value as the main statistical parameters of interest. The R2 value for the quadratic model is 0.9102, which demonstrates a close agreement between experimental and predicted values of the BL molar yield. The R2 adjusted is 0.8091 (>0.6), expressing that the model is significant. An adequate precision value of 11.2385 (>4) highlights a good signal, therefore this model can be used to describe the design space. Regarding the other parameters, both high F- and low p-values indicate the high significance of the corresponding coefficients of the model [58]. In our case, the model has an F-value of 9.01 (much greater than unity) and a p-value of 0.0025 (<0.05), which also implies that the model is significant. There is only a 0.25% chance that such a large F-value could occur due to noise. F-values of C, A, AC, and C2 in Table 5 show that these are significant model terms, firstly C (catalyst loading) and secondly A (temperature), thus confirming the key roles of both these reaction variables on the butanolysis reaction, while reaction time has a modest effect. This latter aspect is certainly assessed to the chemistry of the butanolysis reaction, but also to the very efficient MW heating, which narrows the range of reaction time for reaching the optimal BL molar yield. Moreover, the same order of importance of the independent variables is deduced taking into account the p-values, whose significances are ascertained because of p < 0.05.
Diagnostic plots (predicted vs. actual plot and normal plot of residues) were checked for the adequacy and accuracy of the proposed model equation. The predicted vs. actual plot indicates that the points should be aligned with a straight line, and the normal plot of residues shows whether the residuals are in normal distribution [60]. A predicted vs. an actual plot of BL molar yield is shown in Figure 7a, which shows as the predicted values are close to the observed ones, in agreement with the above discussion. Additionally, the residuals showed a good fit to a normal distribution, indicating a high significance (Figure 7b).
Design-Expert software was used to produce three-dimensional (3D) response surfaces and two-dimensional (2D) contour plots. The 3D surfaces and 2D contour plots are graphical representations of the regression equation for the optimization of reaction conditions, which are very useful to visualize the relationship between the response variables and experimental levels of each factor. In such plots, the response functions of two factors are presented, while the remaining factor is kept constant at the central values. These graphs are shown in Figure 8.
Figure 8a,b confirms that the positive effect of the temperature on BL molar yield is more significant than that of the reaction time, at constant catalyst loading. In detail, a temperature higher than 180 °C is necessary to ensure the highest BL molar yield (about 40 mol%), together with relatively short times (up to about 120 min). On the other hand, a temperature lower than 180 °C is insufficient to achieve high BL molar yield, regardless of the adopted reaction times. Figure 8c,d elucidates that, firstly the catalyst loading, and secondly the temperature, strongly affect the BL yield, at constant time. This trend provides that a catalyst loading higher than 1.6 wt% is necessary to accomplish a very high BL molar yield, and that a lower catalyst loading should be associated with a corresponding higher reaction temperature (190–200 °C). Lastly, Figure 8e,f further confirms that, at a constant temperature, the catalyst loading has a strong non-linear influence on BL molar yield, and it should be higher than 1.6 wt%, while reaction time has a weaker effect, showing a feeble and presumably not significant curvature, as previously stated.
Starting from the above discussion, it is evident that the optimal solution for the BL optimization is not univocal, but involves rather a spatial region of the 3D response surfaces and 2D contour plots, depending on the combined choice of independent variables. The final stage of the design is the determination of the criteria for optimization and model validation. The optimization criterion was the maximum BL molar yield within the space design, with the independent variables kept within the range. For this purpose, starting from the acquired response surfaces and contour plots (Figure 8), the ranges of catalyst loading, temperature and reaction time, were further narrowed to those of greatest and practical interest for maximizing BL molar yield, avoiding the highest levels, in agreement with a more sustainable optimization approach. The identified ranges of interest were selected as follows: 180–190 °C for the temperature, 1.6–2.3 wt% for the catalyst loading, and 90–150 min for the reaction time. One of the possible solutions at the optimum levels (183 °C, 146 min, H2SO4 1.9 wt%) was experimentally carried out, and the experimental BL molar yield was compared with that predicted, as shown in Table 6. The results confirm the good agreement between the predictive and experimental results, at the optimum levels for BL synthesis, thus demonstrating the validity of our proposed model.

2.4. Identification of the Reaction By-Products and Application Perspectives of the Final Reaction Mixture

Before developing the possible engine applications of the final alcoholic mixture, it is necessary to analyze more in-depth its chemical composition, to better define its final use as biofuel. In this context, some authors have identified some reaction intermediates/by-products, but their quantification has not been reported [37], which is very useful for dealing with an in-depth discussion about the possible applications of this alcoholic mixture. Some possible intermediates/by-products were already defined in the Section 1 (Figure 2), in particular, furanic derivatives and glucosides as main reaction intermediates, and BF as the main reaction co-product. Furanic intermediates are very reactive species, which could condense to give solid polyfurans, or humins [40] and, in our case, their partial solubilization in the alcoholic mixture is more favored, if compared to the traditional hydrothermal path due to the presence of the alcoholic solvent, which acts as a polymerization inhibitor for humins growth [21,61]. Taking into account the chemical composition of ADW Eucalyptus nitens, which has a significant content of acetyl groups (4.8 wt%), deriving from the upstream Acetosolv treatment, these groups can be released during the alcoholysis, thus enabling the acid-catalyzed formation of butyl acetate (BA). Lastly, n-BuOH can be etherified to give dibutyl ether (DBE) and water, the latter in equimolar amount respect to DBE, and also this reaction favorably occurs in the presence of the adopted sulfuric acid catalyst [37].
To confirm the presence of the above by-products, the reaction mixtures recovered from the experiments planned for the FCCD (Table 4) and the model validation (Table 6), were qualitatively analyzed by GC–MS, identifying BF, DBE, and BA as main reaction by-products, together with the unconverted n-BuOH. These compounds were subsequently quantified by GC–FID, and the corresponding mass yields in the organic phase are reported in Table 7, together with that of the product of interest (BL).
The above data show that the variation of BA and BL yield within the investigated ranges of the independent variables is modest, if compared with that of DBE (and consequently that of n-BuOH), which represents the main reaction by-product, even in the case of the optimum experiment for BL synthesis (Run 19, Table 7). DBE represents a high cetane component (CN = 100) and it was already tested in blend with diesel fuel, leading to very short ignition delays, so its possible application in compression ignition engines is favorable and attractive [22]. However, different experimental conditions should allow a significant modulation of the DBE to n-BuOH weight ratio, etherification being significantly favored by the acidity increase (compare Runs 1 and 8). On this basis, the best experimental choice for performing the biomass butanolysis should lead to a good production of both BL and DBE, while the unconverted n-BuOH could be eventually recovered and reused within the same process [62]. In principle, the organic ternary mixture BL/DBE/n-BuOH could be immediately exploited, without separation of its components as an innovative diesel fuel additive, thus making the alcoholysis reaction a viable route to the direct production of a blending component. In addition, the amount of the adopted mineral acid for the butanolysis reaction should be as low as possible, to avoid costly work-up procedures and, on this basis, the reaction mixture deriving from Run 1 represents the best compromise for developing the next application of this mixture as a diesel additive. In order to explore this never reported perspective, a preliminary study was carried out employing a model mixture BL/DBE/n-BuOH as an additive for diesel fuel. At this preliminary level of investigation, the addition of BA, which is a minor product closely related to the adopted biomass, was not considered.

2.5. Engine Experimental Activity

A preliminary engine experimental activity was carried out to verify the influence of these oxygenated fuel additives on diesel engine performance. As aforementioned, the ternary mixture available from one-pot butanolysis of raw and ADW biomass is mainly composed of BL, DBE, and unreacted n-BuOH. These compounds represent valuable oxygenated fuels and their properties were already investigated, singularly, in blend with diesel [22,63,64,65,66]. The properties of all fuel components are shown in Table 8 and compared with those of commercial diesel fuel.
The above properties show that both n-BuOH and BL have a lower Cetane Number than diesel. This is a known behavior reported by Koivisto et al. [66,67] for alcohols and levulinates, including n-BuOH and BL, respectively. These compounds are characterized by higher ignition delays (i.e., lower Cetane Number) than alkanes of the same carbon atom chain length. However, ethers, such as DBE, have an opposite behavior and show lower ignition delays in comparison with alkanes [67]. Taking into account the components of the ternary mixture obtained from alcoholysis reaction of biomass, DBE can play a fundamental role as a cetane enhancer, making its controlled coproduction in the alcoholysis highly valuable in this applicative perspective. Moreover, this characteristic enables us to test diesel blended with a high-volume percentage of the ternary mixture. In addition, the use of the n-BuOH/DBE/BL mixture leads to an increase in the fuel oxygen content. Generally, oxygenated diesel blends ensure, especially in the areas of the cylinder with a low air-to-fuel ratio, the presence of oxygen directly from the fuel and, consequently, soot precursors reduction [22,68]. In this context, n-BuOH and BL represent the two components of the mixture which mostly influence the oxygen content in the final blend with diesel.
By considering that the final composition of the reaction can be easily tuned, a model mixture with a composition similar to that of Run 1 in Table 7 was prepared and tested on a small diesel engine. The mixture, whose composition is reported in Table 9, was blended in three different volume percentages with diesel: 10, 20, and 30 vol % (named MIX1 10%, MIX1 20%, MIX1 30%).
This mixture was utilized in the experimental engine at different rpm values (1500, 2000, and 2500 rpm) at full power (Tmax). Data of the engine performance were compared with those obtained with diesel fuel alone, and all the data of the engine performances are reported in Figure 9. Fuel injection timing was maintained constant along with the experimentation.
The use of different blending (from 10 to 30 vol %) with diesel fuel does not significantly affect the power of the employed engine, meaning that the calorific values and the reactivity of these mixtures do not significantly differ from those of commercial diesel fuel. Moreover, no considerable variation of HC and NOx emissions occurs with the use of the adopted mixtures. Literature reports different nitrogen oxides behavior as a function of the fuel type, which indicates that its emission strongly depends on several other factors besides the employed fuel, and these are not easily detachable within the performed analysis [69,70].
On the other hand, a strong reduction of both CO and soot emission was obtained as the blend of both the ternary mixtures was increased. This can be addressed to the increased combustion oxygen availability which plays a key role in the formation process of the carbon-based pollutants, such as soot or CO. Particularly, the oxygen provided by the fuel reduces the low air excess zones which are the main cause of the soot formation. Furthermore, more oxygen is available from fuel, and less carbon is present for CO or soot formation. Svensson et al. [71] found that the soot emissions could be reduced to 0 when fuel oxygen content reaches 27–35 wt%. Another aspect that contributes to decreased CO and soot when applying the two mixtures is the lower boiling point of the oxygenated components in comparison with diesel fuel. This leads to a kind of “droplet explosion” once the fuel mixture is introduced in a hot ambient, such as the cylinder at the end of the compression stroke, increasing the spray fragmentation and mixing [72,73], so increasing the combustion completion of carbon-based molecules is necessary.

3. Materials and Methods

3.1. Materials

Eucalyptus nitens was collected locally in the Galicia region (Spain). The starting untreated and ADW Eucalyptus nitens biomasses were milled with a knife mill, using a 0.5 mm metal mesh, air-dried, and further processed according to the following pre-treatments. Regarding the ADW treatment, the raw Eucalyptus nitens was first subjected to autohydrolysis. For this purpose, the sample was suspended in water and treated in a stainless steel reactor (Parr Instruments Company, Moline, IL, USA) under non-isothermal conditions, adopting a water/biomass weight ratio of 10/1, up to the final temperature of 193 °C [51]. Then, the solid residue was recovered and subsequently underwent an Acetosolv treatment, with a mixture of 90.00% acetic acid, 9.78% water, and 0.22% hydrochloric acid. For this purpose, the temperature was maintained at 134 °C for 30 min, adopting the solid/liquid weight ratio of 1/10 [51]. Solid residue obtained from this treatment was recovered by filtration, washed with water, and finally air-dried.

3.2. Characterization of the Starting Eucalyptus nitens Samples

The compositional analysis of the starting untreated and ADW Eucalyptus nitens samples was carried out based on the standard NREL procedures [74,75]. XRD analysis was carried out using a vertical goniometer diffractometer D2-PHASER (Bruker, Billerica, MA, USA). The analyses were performed using the CuKα radiation at 1.54 Å as the X-ray source. The interval used was 5° < 2θ < 40°, with a resolution of 0.016°. DIFFRAC software (Bruker AXS, Karlsruhe, Germany) was used for spectra processing. The crystallinity index of the Eucalyptus nitens samples was calculated after deconvolution of the curves, which was carried out by the PeakFit software (Systat Software Inc., San Jose, CA, USA), taking into account the contribution of the amorphous component (at about 2θ = 21.5°) and the peaks related to the crystalline plans with Miller indices 101, 10ī, 002 e 040, as reported in the literature [52]. The integration of the areas of these peaks allowed the estimation of the crystallinity index (CI) of the cellulose, based on Equation (3):
CI(%) = [1 − (AAM/ATotal)] × 100
where AAM is the area of the peak corresponding to the amorphous cellulose, and ATOT is the total area of all peaks.
Fourier Transform–Infrared (FT–IR) characterization of the biomass samples was performed with a Perkin-Elmer Spectrum-Two spectrophotometer (Perkin–Elmer, Waltham, MA, USA), equipped with an Attenuated Total Reflectance (ATR) apparatus. The acquisition of each spectrum has provided 12 scans, with a resolution of 8 cm−1, in the wavenumber range between 4000 and 450 cm−1.

3.3. Alcoholysis Experiments

MW-assisted alcoholysis of the untreated and ADW Eucalyptus nitens samples to BL was performed in the single-mode MW reactor (CEM Discover S-class System), employing the 35 mL vessel with a Teflon stir bar. Once the starting biomass, n-BuOH, n-dodecane (internal standard) and sulfuric acid (catalyst) were weighed in the vessel, the reactor was closed and the sealed system was irradiated up to the set-point temperature. The maximum pulsed-power of 300 W was used to heat the samples. During the reaction, pressure and temperature values were continuously acquired with the software and controlled with a feedback algorithm to maintain the constant temperature. At the end of each hydrolysis reaction, the reactor was rapidly cooled at room temperature by blown air and the solid-liquid slurry was recovered, filtered under vacuum, properly diluted with acetone, and analyzed by Gas Chromatography.
Alcoholysis experiments with conventional heating were carried out in the 60 mL glass reactor. Once the starting biomass, n-BuOH, n-dodecane (internal standard) and sulfuric acid (catalyst) were weighed in the reactor, it was closed and the sealed system was placed in an oil bath, previously heated to the set-point temperature. At the end of each alcoholysis reaction, the reactor was rapidly cooled at room temperature by blown air and the solid-liquid slurry was recovered, filtered under vacuum, properly diluted with acetone, and analyzed by Gas Chromatography. For this purpose, the reaction products were qualitatively identified by Gas Chromatography coupled with Mass Spectrometry (GC–MS), and subsequently quantified by Gas Chromatography coupled with Flame Ionization Detector (GC–FID). Regarding GC–MS analysis, a gas chromatograph Hewlett-Packard (Hewlett-Packard HP, Palo Alto, CA, USA) HP 6890 equipped with an MSDHP 5973 detector and with a G.C. column Phenomenex Zebron with a 100% methyl polysiloxane stationary phase (30 m × 0.25 mm × 0.25 µm), was used. The transport gas was helium 5.5 and the flow was 1 mL/min. The temperatures of the injection port and detector were set at 250 °C and 290 °C, respectively. The carrier pressure at 100 kPa and the split flow at 3.40 ms−1 were adopted. The oven was heated at 60 °C for 3 min, and then the temperature was raised at 10 °C/min up to 260 °C for 5 min, and lastly, 10 °C/min up to 280 °C for 3 min. GC–FID analysis was carried out by a DANI GC 1000 DPC (Dani Instruments S.P.A., Cologno Monzese, Italy) gas chromatograph, equipped with a fused silica capillary column—HP-PONA cross-linked methyl silicone gum (20 m × 0.2 mm × 0.5 μm). The FID ports were set at 250 °C. The oven temperature program was set at 90 °C for 3 min and then increased at the rate of 10 °C/min up to 260 °C, where it was maintained for 5 min, then up to 280 °C with the rate of 10 °C/min and maintained for 3 min. Nitrogen was used as the carrier gas, at the flow rate of 0.2 mL/min. Quantitative determination of BL, DBE, BA, and unconverted n-BuOH was carried out with the internal standard method, using n-dodecane as the internal standard. Each analysis was carried out in duplicate and the reproducibility of the technique was within 5%.
The yield to BL was calculated as follows:
Yield to BL (mol%) = (mol BL/mol C6H10O5 units in the starting biomass) × 100
Besides, in the case of the Cross-Flow experiments, BL yield was calculated as follows:
Yield to BL (mol%) = (mol BL obtained in the 2nd step/mol C6H10O5 units in the biomass added in the 2nd step) × 100

3.4. Experimental Design

Response Surface Methodology (RSM) and Face-Centered Central Design (FCCD) were employed for the reaction optimization by maximizing the response, that is BL molar yield, investigating appropriate ranges of the independent variables. The chosen independent variables are temperature, reaction time, and catalyst loading, as reported in Table 4. Their levels were selected starting from preliminary One-Factor-at-a-Time (OFAT) experiments. The experimental design in this study required 18 experimental runs, which included 4 replicates. The software Design-Expert 12 (12.0.1.0) Trial Version (Stat-Ease, Inc., Minneapolis, MN, USA) was adopted to process and analyze the results. The data were fitted to the polynomial model and presented in the analysis of variance (ANOVA). The quadratic equation that represents the correlation between independent variables and the response can be expressed by the quadratic polynomial Equation (6):
Y = b 0 + b 1 X 1 + b 2 X 2 + b 3 X 3 + b 11 X 1 2 + b 22 X 2 2 + b 33 X 3 2 + b 12 X 1 X 2 + b 13 X 1 X 3 + b 23 X 2 X 3
where Y is the predicted response, b0 the constant, b1, b2, and b3 the linear coefficients, b12, b13, and b23 the cross-product coefficients, and b11, b22, and b33 are the quadratic coefficients.

3.5. Engine Experimental Setup

A small diesel engine, whose specifications are reported in Table 10, was chosen and coupled with a Borghi and Saveri eddy current brake with rpm/torque controller. An AVL gravimetric fuel balance was used to online measure fuel consumption. An Environnement SA test bench, equipped with a Non-Dispersive Infra-Red (NDIR) Sensor, a paramagnetic sensor, a Heated Chemiluminescence Detector (HCLD), and a Heated Flame Ionization Detector (HFID) was employed to measure, respectively, CO and CO2, O2, NOx, and THC (Total Hydro-Carbons). The particulate matter was determined using a dedicated sample line and an AVL smoke meter. An exhaust gas K-type thermocouple was employed to verify the occurrence of the steady-state conditions, for each different test condition. Once the engine was stabilized in a particular operating condition, data were collected and analyzed to provide average values.

4. Conclusions

In this work, autohydrolyzed-delignified Eucalyptus nitens wood was employed as cheap cellulose-rich feedstock for the one-pot alcoholysis to n-butyl levulinate, adopting n-butanol as green reagent/reaction medium, very dilute sulfuric acid as a homogeneous catalyst, and microwave as an efficient heating system. The effect of the main reaction parameters to n-butyl levulinate was investigated firstly by a traditional One-Factor-at-a-Time approach, to verify the feasibility of this reaction and identify the coarse ranges of the operating variables. Under the best reaction conditions (microwave heating, 190 °C, 15 min, biomass loading 20 wt%, 1.2 wt% H2SO4), the maximum n-butyl levulinate molar yield of about 30 mol% was achieved, using a very high biomass loading (20 wt%), an eligible aspect from the perspective of an intensified high gravity approach. However, even higher molar yields (up to about 40 mol%) were obtained adopting traditional heating (190 °C, 120 min, biomass loading 20 wt%, 1.2 wt% H2SO4), demonstrating the good feasibility of the reaction also with traditional heating systems, aspect of paramount industrial interest. The possibility of reprocessing the reaction mixture deriving from the optimized experiment by addition of fresh biomass, was evaluated, achieving the maximum n-butyl levulinate concentration of about 85 g/L after only one reprocessing of the mother liquor, and this is the highest n-butyl levulinate concentration hitherto reported in the literature starting from real biomass.
The butanolysis reaction was further optimized by Response Surface Methodology, utilizing a Face-Centered Central Composite Design. The chosen design appropriately describes the studied real system, which requires mild acidity and high temperature, for maximizing n-butyl levulinate production, while the effect of the reaction time is softened due to the efficient microwave heating. The significance of the independent variables and their possible interactions was tested using ANOVA with a 95% confidence level, and the model was experimentally validated at the optimal operating conditions for n-butyl levulinate production.
Finally, a preliminary study of diesel engine performances and emissions for a model mixture with a composition analogous to that of the main components of the reaction mixture was performed, to draw an indication of its potential application as an additive for diesel fuel, without performing the separation of each component.

Author Contributions

S.G., A.M.R.G., and S.F. conceived the experiments; S.G., A.M.R.G, C.A., S.F., M.L., D.L., and G.P. designed the experiments; S.G., M.L., and G.P. performed the experiments and analysis; all the authors analyzed the data; D.L. and S.G. wrote the paper; J.C.P., S.F., A.M.R.G., and C.A. revised and supervised the writing of the manuscript. All authors have read and agreed to the published version of the manuscript.

Funding

The Spanish Ministry of Economy and Competitivity supported this study in the framework of the research project “Modified aqueous media for wood Biorefineries” (reference CTQ2017-82962-R), partially funded by the FEDER program of the European Union. Mar López thanks the European Social Fund (ESF) for economic support and the “Xunta de Galicia” for her predoctoral grant (reference ED481A-2017/316). MIUR supported this study in the framework of the research project VISION PRIN 2017 FWC3WC_002.

Conflicts of Interest

The authors declare no conflict of interest.

References

  1. Girisuta, B.; Heeres, H.J. Levulinic acid from biomass: Synthesis and applications. In Production of Platform Chemicals from Sustainable Resources; Fang, Z., Smith, R.L., Qi, X., Eds.; Springer Nature Pte Ltd.: Singapore, 2017; Volume 7, pp. 143–169. [Google Scholar] [CrossRef]
  2. Available online: https://www.psmarketresearch.com/market-analysis/levulinic-acid-market (accessed on 23 March 2020).
  3. Rivas, S.; Raspolli Galletti, A.M.; Antonetti, C.; Santos, V.; Parajó, J.C. Sustainable production of levulinic acid from the cellulosic fraction of Pinus Pinaster wood: Operation in aqueous media under microwave irradiation. J. Wood Chem. Technol. 2015, 35, 315–324. [Google Scholar] [CrossRef]
  4. Antonetti, C.; Licursi, D.; Fulignati, S.; Valentini, G.; Raspolli Galletti, A.M. New frontiers in the catalytic synthesis of levulinic acid: From sugars to raw and waste biomass as starting feedstock. Catalysts 2016, 6, 196. [Google Scholar] [CrossRef]
  5. Licursi, D.; Antonetti, C.; Martinelli, M.; Ribechini, E.; Zanaboni, M.; Raspolli Galletti, A.M. Monitoring/characterization of stickies contaminants coming from a papermaking plant—Toward an innovative exploitation of the screen rejects to levulinic acid. Waste Manag. 2016, 49, 469–482. [Google Scholar] [CrossRef] [PubMed]
  6. Rivas, S.; Raspolli Galletti, A.M.; Antonetti, C.; Santos, V.; Parajó, J.C. Sustainable conversion of Pinus Pinaster wood into biofuel precursors: A biorefinery approach. Fuel 2016, 164, 51–58. [Google Scholar] [CrossRef]
  7. Licursi, D.; Antonetti, C.; Mattonai, M.; Pérez-Armada, L.; Rivas, S.; Ribechini, E.; Raspolli Galletti, A.M. Multi-valorisation of giant reed (Arundo Donax L.) to give levulinic acid and valuable phenolic antioxidants. Ind. Crop. Prod. 2018, 112, 6–17. [Google Scholar] [CrossRef]
  8. Deémolis, A.; Essayem, N.; Rataboul, F. Synthesis and applications of alkyl levulinates. ACS Sustain. Chem. Eng. 2014, 2, 1338–1352. [Google Scholar] [CrossRef]
  9. Badgujar, K.C.; Badgujar, V.C.; Bhanage, B.M. A review on catalytic synthesis of energy rich fuel additive levulinate compounds from biomass derived levulinic acid. Fuel Process. Technol. 2020, 197, 106213. [Google Scholar] [CrossRef]
  10. Chung, Y.-H.; Peng, T.-H.; Lee, H.-Y.; Chen, C.-L.; Chien, I.-L. Design and control of reactive distillation system for esterification of levulinic acid and n-butanol. Ind. Eng. Chem. Res. 2015, 54, 3341–3354. [Google Scholar] [CrossRef]
  11. Li, C.; Duan, C.; Fang, J.; Li, H. Process intensification and energy saving of reactive distillation for production of ester compounds. Chin. J. Chem. Eng. 2019, 27, 1307–1323. [Google Scholar] [CrossRef]
  12. Vázquez-Castillo, J.A.; Contreras-Zarazúa, G.; Segovia-Hernández, J.G.; Kiss, A.A. Optimally designed reactive distillation processes for eco-efficient production of ethyl levulinate. J. Chem. Technol. Biotehnol. 2019, 94, 2131–2140. [Google Scholar] [CrossRef] [Green Version]
  13. Christensen, E.; Williams, A.; Paul, S.; Burton, S.; McCormick, R.L. Properties and performance of levulinate esters as diesel blend components. Energy Fuels 2011, 25, 5422–5428. [Google Scholar] [CrossRef]
  14. Li, H.; Peng, L.; Lin, L.; Chen, K.; Zhang, H. Synthesis, isolation and characterization of methyl levulinate from cellulose catalyzed by extremely low concentration acid. J. Energy Chem. 2013, 22, 895–901. [Google Scholar] [CrossRef]
  15. Ahmad, E.; Alam, M.I.; Pant, K.K.; Haider, M.A. Catalytic and mechanistic insights into the production of ethyl levulinate from biorenewable feedstocks. Green Chem. 2016, 18, 4804–4823. [Google Scholar] [CrossRef]
  16. Negahdar, L.; Al-Shaal, M.G.; Holzhäuser, F.J.; Palkovits, R. Kinetic analysis of the catalytic hydrogenation of alkyl levulinates to γ-valerolactone. Chem. Eng. Sci. 2017, 158, 545–551. [Google Scholar] [CrossRef]
  17. Filiciotto, L.; Balu, A.M.; Van der Waal, J.C.; Luque, R. Catalytic insights into the production of biomass-derived side products methyl levulinate, furfural and humins. Catal. Today 2018, 302, 2–15. [Google Scholar] [CrossRef] [Green Version]
  18. Shrivastav, G.; Khan, T.S.; Agarwal, M.; Haider, M.A. Reformulation of gasoline to replace aromatics by biomass-derived alkyl levulinates. ACS Sustain. Chem. Eng. 2017, 5, 7118–7127. [Google Scholar] [CrossRef]
  19. Zhao, T.; Zhang, Y.; Zhao, G.; Chen, X.; Han, L.; Xiao, W. Impact of biomass feedstock variability on acid-catalyzed alcoholysis performance. Fuel Process. Technol. 2018, 180, 14–22. [Google Scholar] [CrossRef]
  20. Hu, X.; Li, C.-Z. Levulinic esters from the acid-catalysed reactions of sugars and alcohols as part of a bio-refinery. Green Chem. 2011, 13, 1676–1679. [Google Scholar] [CrossRef]
  21. Hu, X.; Wu, L.; Wang, Y.; Mourant, D.; Lievens, C.; Gunawan, R.; Li, C.-Z. Mediating acid-catalyzed conversion of levoglucosan into platform chemicals with various solvents. Green Chem. 2012, 14, 3087–3098. [Google Scholar] [CrossRef]
  22. Kremer, F.; Pischinger, S. Butyl ethers and levulinates. In Biofuels from Lignocellulosic Biomass: Innovations Beyond Bioethanol; Boot, M., Ed.; Wiley-VCH GmbH & Co. KGaA: Weinheim, Germany, 2016; pp. 87–104. [Google Scholar] [CrossRef]
  23. Christensen, E.; Yanowitz, J.; Ratcliff, M.; McCormick, R.L. Renewable oxygenate blending effects on gasoline properties. Energ. Fuel 2011, 25, 4723–4733. [Google Scholar] [CrossRef]
  24. Benito, P.; Vaccari, A.; Antonetti, C.; Licursi, D.; Schiarioli, N.; Rodriguez-Castellón, E.; Raspolli Galletti, A.M. Tunable copper-hydrotalcite derived mixed oxides for sustainable ethanol condensation to n-butanol in liquid phase. J. Clean. Prod. 2019, 209, 1614–1623. [Google Scholar] [CrossRef]
  25. Mishra, D.K.; Kumar, S.; Shukla, R.S. Chapter 12—Furfuryl alcohol—A promising platform chemical. In Biomass, Biofuels, Biochemicals. Recent Advances in Development of Platform Chemicals; Saravanamurugan, S., Pandey, A., Li, H., Riisager, A., Eds.; Elsevier: Amsterdam, The Netherlands, 2020; pp. 323–353. [Google Scholar] [CrossRef]
  26. Gitis, V.; Chung, S.-H.; Shiju, N.R. Conversion of furfuryl alcohol into butyl levulinate with graphite oxide and reduced graphite oxide. Flat Chem. 2018, 10, 39–44. [Google Scholar] [CrossRef]
  27. Gupta, S.S.R.; Kantam, M.L. Catalytic conversion of furfuryl alcohol or levulinic acid into alkyl levulinates using a sulfonic acid-functionalized hafnium-based MOF. Catal. Commun. 2019, 124, 62–66. [Google Scholar] [CrossRef]
  28. Bernal, H.G.; Oldani, C.; Funaioli, T.; Raspolli Galletti, A.M. AQUIVION® perfluorosulfonic acid resin for butyl levulinate production from furfuryl alcohol. N. J. Chem. 2019, 43, 14694–14700. [Google Scholar] [CrossRef]
  29. Yu, X.; Peng, L.; Pu, Q.; Tao, R.; Gao, X.; He, L.; Zhang, J. Efficient valorization of biomass-derived furfuryl alcohol to butyl levulinate using a facile lignin-based carbonaceous acid. Res. Chem. Intermed. 2020, 46, 1469–1485. [Google Scholar] [CrossRef]
  30. Iborra, M.; Tejero, J.; Fité, C.; Ramírez, E.; Cunill, F. Liquid-phase synthesis of butyl levulinate with simultaneous water removal catalyzed by acid ion exchange resins. J. Ind. Eng. Chem. 2019, 78, 222–231. [Google Scholar] [CrossRef]
  31. Yang, J.; Li, G.; Zhang, L.; Zhang, S. Efficient production of n-butyl levulinate fuel additive from levulinic acid using amorphous carbon enriched with oxygenated groups. Catalysts 2018, 8, 14. [Google Scholar] [CrossRef] [Green Version]
  32. Garves, K. Acid catalyzed degradation of cellulose in alcohols. J. Wood Chem. Technol. 1988, 8, 121–134. [Google Scholar] [CrossRef]
  33. Hishikawa, Y.; Yamaguchi, M.; Kubo, S.; Yamada, T. Direct preparation of butyl levulinate by a single solvolysis process of cellulose. J. Wood Sci. 2013, 59, 179–182. [Google Scholar] [CrossRef]
  34. Liu, Y.; Lin, L.; Liu, D.; Zhuang, J.; Pang, C. Conversion of biomass sugars to butyl levulinate over combined catalyst of solid acid and other acid. Adv. Mater. Res. 2014, 955, 779–784. [Google Scholar] [CrossRef]
  35. Ma, H.; Long, J.-X.; Wang, F.-R.; Wang, L.-F.; Li, X.-H. Conversion of cellulose to butyl levulinate in bio-butanol medium catalyzed by acidic ionic liquids. Acta Phys. Chim. Sin. 2015, 31, 973–979. [Google Scholar] [CrossRef]
  36. Yamada, T.; Yamaguchi, M.; Kubo, S.; Hishikawa, Y. Direct production of alkyl levulinates from cellulosic biomass by a single-step acidic solvolysis system at ambient atmospheric pressure. BioResources 2015, 10, 4961–4969. [Google Scholar] [CrossRef] [Green Version]
  37. Démolis, A.; Eternot, M.; Essayem, N.; Rataboul, F. Influence of butanol isomers on the reactivity of cellulose towards the synthesis of butyl levulinates catalyzed by liquid and solid acid catalysts. N. J. Chem. 2016, 40, 3747–3754. [Google Scholar] [CrossRef]
  38. Elumalai, S.; Agarwal, B.; Runge, T.M.; Sangwan, R.S. Integrated two-stage chemically processing of rice straw cellulose to butyl levulinate. Carbohydr. Polym. 2016, 150, 286–298. [Google Scholar] [CrossRef] [PubMed]
  39. An, R.; Xu, G.; Chang, C.; Bai, J.; Fang, S. Efficient one-pot synthesis of n-butyl levulinate from carbohydrates catalyzed by Fe2(SO4)3. J. Energy Chem. 2017, 26, 556–563. [Google Scholar] [CrossRef] [Green Version]
  40. Deng, L.; Chang, C.; An, R.; Qi, X.; Xu, G. Metal sulfates-catalyzed butanolysis of cellulose: Butyl levulinate production and optimization. Cellulose 2017, 24, 5403–5415. [Google Scholar] [CrossRef]
  41. Liang, C.; Wang, Y.; Hu, Y.; Wu, L.; Zhang, W. Study of a new process for the preparation of butyl levulinate from cellulose. ACS Omega 2019, 4, 9828–9834. [Google Scholar] [CrossRef] [Green Version]
  42. Rivas, S.; Raspolli Galletti, A.M.; Antonetti, C.; Licursi, D.; Santos, V.; Parajó, J.C. A biorefinery cascade conversion of hemicellulose-free Eucalyptus Globulus wood: Production of concentrated levulinic acid solutions for γ-valerolactone sustainable preparation. Catalysts 2018, 8, 169. [Google Scholar] [CrossRef] [Green Version]
  43. Pérez-Cruzado, C.; Merino, A.; Rodríguez-Soalleiro, R. A management tool for estimating bioenergy production and carbon sequestration in Eucalyptus globulus and Eucalyptus nitens grown as short rotation woody crops in north-west Spain. Biomass Bioenerg. 2011, 35, 2839–2851. [Google Scholar] [CrossRef]
  44. Peleteiro, S.; Raspolli Galletti, A.M.; Antonetti, C.; Santos, V.; Parajó, J.C. Manufacture of furfural from xylan-containing biomass by acidic processing of hemicellulose-derived saccharides in biphasic media using microwave heating. J. Wood Chem. Technol. 2018, 38, 198–213. [Google Scholar] [CrossRef]
  45. Chen, X.; Zhang, K.; Xiao, L.-P.; Sun, R.-C.; Song, G. Total utilization of lignin and carbohydrates in Eucalyptus grandis: An integrated biorefinery strategy towards phenolics, levulinic acid, and furfural. Biotechnol. Biofuels 2020, 13, 1–10. [Google Scholar] [CrossRef] [PubMed]
  46. Antonetti, C.; Licursi, D.; Raspolli Galletti, A.M.; Martinelli, M.; Tellini, F.; Valentini, G.; Gambineri, F. Application of microwave irradiation for the removal of polychlorinated biphenyls from siloxane transformer and hydrocarbon engine oils. Chemosphere 2016, 159, 72–79. [Google Scholar] [CrossRef] [PubMed]
  47. Di Fidio, N.; Raspolli Galletti, A.M.; Fulignati, S.; Licursi, D.; Liuzzi, F.; De Bari, I.; Antonetti, C. Multi-step exploitation of raw Arundo donax L. for the selective synthesis of second-generation sugars by chemical and biological route. Catalysts 2020, 10, 79. [Google Scholar] [CrossRef] [Green Version]
  48. Ahmad, E.; Alam, E.I.; Pant, K.K.; Haider, M.A. Insights into the synthesis of ethyl levulinate under microwave and non-microwave heating conditions. Ind. Eng. Chem. Res. 2019, 58, 16055–16064. [Google Scholar] [CrossRef]
  49. Dai, J.; Peng, L.; Li, H. Intensified ethyl levulinate production from cellulose using a combination of low loading H2SO4 and Al(OTf)3. Catal. Commun. 2018, 103, 116–119. [Google Scholar] [CrossRef]
  50. Grisel, R.J.H.; van der Waal, J.C.; de Jong, E.; Huijgen, W.J.J. Acid catalysed alcoholysis of wheat straw: Towards second generation furan-derivatives. Catal. Today 2014, 223, 3–10. [Google Scholar] [CrossRef]
  51. Penín, L.; Peleteiro, S.; Santos, V.; Alonso, J.L.; Parajo, J.C. Selective fractionation and enzymatic hydrolysis of Eucalyptus nitens wood. Cellulose 2019, 26, 1125–1139. [Google Scholar] [CrossRef]
  52. Park, S.; Baker, J.O.; Himmel, M.E.; Parilla, P.A.; Johnson, D.K. Cellulose crystallinity index: Measurement techniques and their impact on interpreting cellulase performance. Biotechnol. Biofuels 2010, 3, 1–10. [Google Scholar] [CrossRef] [Green Version]
  53. Banerjee, D.; Mukherjee, S.; Pal, S.; Khowala, S. Enhanced saccharification efficiency of lignocellulosic biomass of mustard stalk and straw by salt pretreatment. Ind. Crops Prod. 2016, 80, 42–49. [Google Scholar] [CrossRef]
  54. Fan, S.; Zhang, P.; Li, F.; Jin, S.; Wang, S.; Zhou, S. A review of lignocellulose change during hydrothermal pretreatment for bioenergy production. Curr. Org. Chem. 2016, 20, 1–11. [Google Scholar] [CrossRef]
  55. Licursi, D.; Antonetti, C.; Bernardini, J.; Cinelli, P.; Coltelli, M.B.; Lazzeri, A.; Martinelli, M.; Raspolli Galletti, A.M. Characterization of the Arundo Donax L. solid residue from hydrothermal conversion: Comparison with technical lignins and application perspectives. Ind. Crops Prod. 2015, 76, 1008–1024. [Google Scholar] [CrossRef]
  56. Düdder, H.; Wütscher, A.; Stoll, R.; Muhler, M. Synthesis and characterization of lignite-like fuels obtained by hydrothermal carbonization of cellulose. Fuel 2016, 171, 54–58. [Google Scholar] [CrossRef]
  57. Popescu, C.-M.; Popescu, M.-C.; Singurel, G.; Vasile, C.; Argyropoulos, D.S.; Willfor, S. Spectral characterization of Eucalyptus wood. Appl. Spectrosc. 2007, 61, 1168–1177. [Google Scholar] [CrossRef] [PubMed]
  58. Xiros, C.; Janssen, M.; Byström, R.; Børresen, B.T.; Cannella, D.; Jørgensen, H.; Koppram, R.; Larsson, C.; Olsson, L.; Tillman, A.M.; et al. Toward a sustainable biorefinery using high-gravity technology. Biofuels Bioprod. Bioref. 2017, 11, 15–27. [Google Scholar] [CrossRef] [Green Version]
  59. Peng, L.; Gao, X.; Chen, K. Catalytic upgrading of renewable furfuryl alcohol to alkyl levulinates using AlCl3 as a facile, efficient, and reusable catalyst. Fuel 2015, 160, 123–131. [Google Scholar] [CrossRef]
  60. Asghar, A.; Raman, A.; Aziz, A.; Daud, W.M.A.W. A comparison of central composite design and Taguchi method for optimizing Fenton process. Sci. World J. 2014, 2014, 1–14. [Google Scholar] [CrossRef] [PubMed] [Green Version]
  61. Gao, X.; Peng, L.; Li, H.; Chen, K. Formation of humin and alkyl levulinate in the acid-catalyzed conversion of biomass-derived furfuryl alcohol. Bioresources 2015, 10, 6548–6564. [Google Scholar] [CrossRef]
  62. Aron, M.; Rust, H. Separating off Butanol and Dibutyl Ether with the Aid of a Two-Pressure Distillation. Canadian Patent CA2227280A1; Published on 06-03-1997,
  63. Naik, S.N.; Goud, V.V.; Rout, P.K.; Dalai, A.K. Production of first and second generation biofuels: A comprehensive review. Renew. Sustain. Energy Rev. 2010, 14, 578–597. [Google Scholar] [CrossRef]
  64. Rakopoulos, D.C.; Rakopoulos, C.D.; Giakoumis, E.G.; Dimaratos, A.M.; Kyritsis, D.C. Effects of butanol-diesel fuel blends on the performance and emissions of a high-speed DI diesel engine. Energy Convers. Manag. 2010, 51, 1989–1997. [Google Scholar] [CrossRef]
  65. Qureshi, N.; Saha, B.C.; Dien, B.; Hector, R.E.; Cotta, M.A. Production of butanol (a biofuel) from agricultural residues: Part I—Use of barley straw hydrolysate. Biomass Bioenerg. 2010, 34, 559–565. [Google Scholar] [CrossRef]
  66. Koivisto, E.; Ladommatos, N.; Gold, M. Compression ignition and exhaust gas emissions of fuel molecules which can be produced from lignocellulosic biomass: Levulinates, valeric esters, and ketones. Energy Fuels 2015, 29, 5875–5884. [Google Scholar] [CrossRef]
  67. Koivisto, E.; Ladommatos, N.; Gold, M. The influence of various oxygenated functional groups in carbonyl and ether compounds on compression ignition and exhaust gas emissions. Fuel 2015, 159, 697–711. [Google Scholar] [CrossRef]
  68. Westbrook, C.K.; Pitz, W.J.; Curran, H.J. Chemical kinetic modeling study of the effects of oxygenated hydrocarbons on soot emissions from diesel engines. J. Phys. Chem. A. 2006, 110, 6912–6922. [Google Scholar] [CrossRef] [PubMed] [Green Version]
  69. Ganesh, D.; Ayyappan, P.R.; Murugan, R. Experimental investigation of iso-butanol/diesel reactivity controlled compression ignition combustion in a non-road diesel engine. Appl. Energy 2019, 242, 1307–1319. [Google Scholar] [CrossRef]
  70. Kumar, S.; Cho, J.H.; Park, J.; Moon, I. Advances in diesel–alcohol blends and their effects on the performance and emissions of diesel engines. Renew. Sustain. Energy Rev. 2013, 22, 46–72. [Google Scholar] [CrossRef]
  71. Tree, D.R.; Svensson, K.I. Soot processes in compression ignition engines. Prog. Energy Combust. Sci. 2007, 33, 272–309. [Google Scholar] [CrossRef]
  72. Rao, D.C.K.; Karmakar, S.; Basu, S. Atomization characteristics and instabilities in the combustion of multi-component fuel droplets with high volatility differential. Sci. Rep. 2017, 7, 8925. [Google Scholar] [CrossRef] [Green Version]
  73. Lasheras, J.C.; Fernandez-Pello, A.C.; Dryer, F.L. Experimental observations on the disruptive combustion of free droplets of multicomponent fuels. Combust. Sci. Technol. 1980, 22, 195–209. [Google Scholar] [CrossRef]
  74. Sluiter, A.; Hames, B.; Ruiz, R.; Scarlata, C.; Sluiter, J.; Templeton, D.; Crocker, D. Determination of Structural Carbohydrates and Lignin in Biomass; NREL/TP-510–42618; National Renewable Energy Laboratory: Golden, CO, USA, 2008. [Google Scholar]
  75. Sluiter, A.; Ruiz, R.; Scarlata, C.; Sluiter, J.; Templeton, D. Determination of Extractives in Biomass; NREL/TP-510–42619; National Renewable Energy Laboratory: Golden, CO, USA, 2008. [Google Scholar]
Figure 1. C5 and C6 sugar-based routes to n-butyl levulinate.
Catalysts 10 00509 g001
Figure 2. C6 fraction butanolysis pathway starting from cellulose feedstock (adapted from [40]).
Catalysts 10 00509 g002
Figure 3. XRD spectra of (a) untreated and (b) autohydrolyzed-delignified wood (ADW) Eucalyptus nitens samples.
Catalysts 10 00509 g003
Figure 4. FT–IR spectra of (a) untreated and (b) ADW Eucalyptus nitens samples.
Catalysts 10 00509 g004
Figure 5. One-pot MW-assisted butanolysis of the ADW Eucalyptus nitens sample to BL, adopting different biomass loadings (7, 14, and 20 wt%). Reaction conditions: 190 °C, 15 min, H2SO4 1.2 wt%, MW heating.
Catalysts 10 00509 g005
Figure 6. Kinetics of the one-pot butanolysis of the ADW Eucalyptus nitens sample (20 wt%) to BL. Reaction conditions: biomass loading 20 wt%, 190 °C, H2SO4 1.2 wt%, TR heating.
Catalysts 10 00509 g006
Figure 7. (a) Predicted versus actual plot, and (b) normal plot of residues.
Catalysts 10 00509 g007
Figure 8. Three-dimensional (3D) response surfaces and two-dimensional (2D) contour plots: effect of temperature, reaction time, and acid concentration on BL molar yield. (a,b) catalyst loading was kept constant at 1.6 wt%; (c,d) reaction time was kept constant at 105 min; (e,f) temperature was kept constant at 180 °C.
Catalysts 10 00509 g008
Figure 9. Engine performances obtained with diesel fuel, alone and in blends with n-BuOH/dibutyl ether (DBE)/BL.
Catalysts 10 00509 g009
Table 1. One-pot butanolysis of the untreated or ADW Eucalyptus nitens to n-butyl levulinate (BL), adopting microwave (MW), or traditional (TR) heating. Reaction conditions: biomass loading 7 wt%, 190 °C, H2SO4 1.2 wt%.
RunBiomassHeatingTime (min)BL Yield (mol%)BL Conc. (g/L)
1ADWMW103218
2ADWMW154223
3ADWMW304223
4UntreatedMW154212
5ADWTR1204927
Table 2. One-pot butanolysis of the ADW Eucalyptus nitens to BL, with different biomass loadings (7, 14, and 20 wt%), adopting MW and TR heating systems. Reaction conditions: 190 °C, H2SO4 1.2 wt%.
RunBiomass Loading (wt%)HeatingTime (min)BL Yield (mol%)BL Conc. (g/L)
6ADW 7 wt%TR1204927
7ADW 7 wt%MW154223
8ADW 14 wt%TR1204453
9ADW 14 wt%MW153441
10ADW 20 wt%TR1203769
11ADW 20 wt%MW152954
Table 3. Cross-flow butanolysis of ADW Eucalyptus nitens to BL. Reaction conditions: 190 °C, 60 min, H2SO4 1.2 wt% (added only at the 1st step), TR heating.
StepBiomass Loading (wt%)BL Yield (mol %)BL Conc. (g/L)
1st203972
2nd102185
Table 4. Experimental design and BL molar yield (%) response of the Face-Centered Central Composite Design (FCCD) for different combinations of temperature, reaction time, and catalyst loading, all realized at the constant biomass loading of 20 wt%.
RunCoded Parameter (Temp.) X1Coded Parameter (Time) X2Coded Parameter (Cat. Loading) X3Actual Parameter (Temp.) x1, °CActual Parameter (Time) x2, minActual Parameter (Cat. Loading) x3, wt%BL Molar Yield Y, mol%
111−12001800.238
2−1001601051.635
3−11−11601800.26
41−1−1200300.220
5−1111601803.042
60−10180301.636
70011801053.040
81112001803.034
90001801051.640
101002001051.637
1111−12001800.233
121−11200303.041
130001801051.642
14−1−1−1160300.20
15−1−11160303.025
160001801051.642
170101801801.641
1800−11801050.221
Table 5. ANOVA for the response surface quadratic model.
SourceSum of SquaresDegree of FreedomMean SquaresF-Valuep-ValueRemark
Model2452.429272.499.010.0025Significant
ATemp.416.241416.2413.760.0060
B—Time166.851166.855.510.0468
C—Cat. Load.982.231982.2332.460.0005
AB17.18117.180.56760.4728
AC268.381268.388.870.0177
BC29.01129.010.95860.3562
A241.99141.991.390.2726
B25.6715.670.18730.6766
C2240.221240.227.940.0226
Residual242.08830.26
Lack of fit226.91545.388.980.0503Not significant
Pure error15.1735.06
Cor Total
R2 = 0.9102
R2adj = 0.8091
2694.50 17
p < 0.05 is considered significant.
Table 6. Predicted and experimental BL yield: model validation.
RunActual Parameter x1, °CActual Parameter x2, minActual Parameter x3, wt%BL Yield (mol%)Desirability
PredictedExperimental
191831461.944421000
Table 7. Composition of the organic reaction mixtures recovered from the experiments planned for the FCCD and for the model validation, working at the constant biomass loading of 20 wt%.
RunTemperature (°C)Time (min)Catalyst Loading (wt%)Composition (wt%)
BLDBEBAn-BuOH
12001800.2918370
21601051.6913376
31601800.214391
4200300.266385
51601803.01123363
6180301.6911.7377
71801053.01037.9349
82001803.01058.3328
91801051.61026.8361
102001051.6945.0343
112001800.2710.6380
12200303.01037.9349
131801051.61023.8363
14160300.200.8297
15160303.079.4381
161801051.61026.2361
171801801.61033.3354
181801050.257.1385
191831461.91139.4347
Table 8. Overview of biomass resources available from the literature [13,21,61].
PropertiesDBEBLn-BuOHDiesel
Tevaporation (°C)140232118180–360
O2 (wt%)122821.60
Density (g/L)769 a974 a810 b837 b
CN c (−)100142550
LHV d (MJ/Kg)42.827.433.143
ν e (mm2/s)0.721.52.222.6
a Density at 25 °C. b Density at 20 °C. c Cetane Number. d Lower Heating Value. e Kinematic viscosity at 40 °C.
Table 9. Composition of the prepared ternary mixture.
Mixturen-BuOH (wt%)DBE (wt%)BL (wt%)
MIX1702010
Table 10. Experimental engine characteristics.
Engine TypeLombardini LD 625/2
Number of cylinders2
Cooling systemForced air
Displacement (cm3)1248
Bore (mm)95
Stroke (mm)88
Compression ratio17.5:1
Max rotational speed (rpm)3000
Power @ 3000 rpm (kW)21
Max Torque @ 2200 rpm (Nm)29.4
Fuel injection systemDirect Mechanic

