Article

A Colorimetric Aptamer Sensor Based on the Enhanced Peroxidase Activity of Functionalized Graphene/Fe3O4-AuNPs for Detection of Lead (II) Ions

1
State Key Laboratory of Food Science and Technology, Jiangnan University, Wuxi 214122, China
2
School of Food Science and Technology, Jiangnan University, Wuxi 214122, China
3
International Joint Laboratory on Food Safety, Jiangnan University, Wuxi 214122, China
4
Wuxi Municipal Administration for Market Regulation, Wuxi 214023, China
5
Collaborative Innovation Center of Food safety and Quality Control of Jiangsu Province, Jiangnan University, Wuxi 214122, China
*
Author to whom correspondence should be addressed.
Submission received: 12 May 2020 / Revised: 25 May 2020 / Accepted: 26 May 2020 / Published: 29 May 2020
(This article belongs to the Special Issue Advanced Nanomaterials - Synthesis and Applications in Catalysis)

Abstract

:
Lead (II) is regarded as one of the most hazardous heavy metals, and lead contamination has a serious impact on food chains, human health, and the environment. Herein, a colorimetric aptasensor based on the graphene/Fe3O4-AuNPs composites with enhanced peroxidase-like activity has been developed to monitor lead ions (Pb2+). In short, graphene/Fe3O4-AuNPs were fabricated and acted as an enzyme mimetic, so the color change could be observed by chromogenic reaction. The aptamer of Pb2+ was decorated on the surface of the amine magnetic beads by streptavidin–biotin interaction, and the complementary strands of the aptamer and target Pb2+ competed for the binding Pb2+ aptamer. In the presence of Pb2+, aptamers bonded the metal ions and were removed from the system by magnetic separation; the free cDNA was adsorbed onto the surface of the graphene/Fe3O4-AuNPs composites, thus inhibiting the catalytic activity and the color reaction. The absorbance of the reaction solution at 652 nm had a clear linear correlation with the Pb2+ concentration in the range of 1–300 ng/mL, and the limit of detection was 0.63 ng/mL. This assay is simple and convenient in operation, has good selectivity, and has been used to test tap water samples, which proves that it is capable for the routine monitoring of Pb2+.

Graphical Abstract

1. Introduction

Lead contamination is an increasingly important issue accompanied by the wide use of lead in industry sectors such as batteries [1], gasoline [2], metallurgies [3], and paints [4]. Lead poses a serious threat to food chains [5], human health [6], and the environment as a whole through chemical waste, soil, and water [7]. Due to its non-biodegradability, lead is hard to detoxify, and has different degrees of damage to many organs and tissues of the human body, especially the hematopoietic system, nervous system, and kidneys [8]. Even low levels of lead can pose serious threats for the central nervous system of infants and children, affecting their growth and development and leading to mental retardation [9,10]. For adults, long-term intake of lead-contaminated food or water may result in various health disorders such as anemia [11], hypertension [12], diabetes [13], and reproductive dysfunctions [14]. The maximum contaminant level of Pb2+ in drinking water is 15 ng/mL, as established by the U.S. Environmental Protection Agency (EPA) [15]. The U.S. Food and Drug Administration (FDA) sets the maximum level of Pb2+ in food such as candy at 100 ng/g [16].
For food safety and public health, it is essential to develop advanced detection techniques for sensitive and selective monitoring of this heavy metal. The conventional methods for Pb2+ determination are based on inductively coupled plasma mass spectrometry (ICP-MS) [17], high performance liquid chromatography (HPLC) [18], and graphite furnace atomic absorption spectrometry (GF-AAS) [19], which provide sensitivity and accuracy, but usually depend on sophisticated procedures, expensive equipment, and complicated sample preparation processes, limiting the practical sensing of Pb2+, especially in developing and undeveloped countries or dealing with on-site emergencies. In this context, some alternative methods have been developed for Pb2+ sensing including electrochemistry [20], fluorescence [21], colorimetry [22], and surface plasmon resonance [23]. These techniques have exhibited promising performance in the detection of Pb2+. Xiong et al. proposed an electrochemiluminescence biosensor for sensing Pb2+ using nitrogen doped carbon dots in a range of 1.0 ng/mL to 1375.0 ng/mL [24]. Chaiyo et al. developed a microfluidic paper-based analytical device using a boron-doped diamond electrode for the detection of Pb2+, and the limit of detection was 0.1 ng/mL [25].
In recent years, aptamers have shown great advantages in establishing biosensors for the determination of heavy metals [26]. Aptamers are synthetic DNA or RNA single chain oligonucleotides selected by SELEX (Systematic Evolution of Ligands by exponential enrichment) procedures, can recognize targets ranging from ions and small molecules to cells with high binding affinity and specificity [27,28]. Compared with antibodies, aptamers possess the advantages of low cost, ease of synthesis and modification, great thermal stability, and without immunogenicity and toxicity [29]. Aptamer-based sensing methods coupled with colorimetry [30], electrochemistry [31], and fluorescence [32] have been regarded as competitive alternatives to overcome the above-mentioned limitations of conventional assays.
Another promising material are enzyme mimetics. Enzyme mimetics have catalytic activity similar to natural enzymes to catalyze enzyme-like reactions. Compared with natural protein enzymes, enzyme mimetics offer various advantages such as simpler synthesis, higher stability, lower cost, easier modification, and are more efficient [33,34]. Over the past decade, a great number of nanoparticles have been found to have catalytic activity either alone or as hybrids in conjunction with other nanomaterials. These nanoscale enzyme mimetics are composed of carbon and its derivative nanomaterials and metallic nanozymes such as carbon nanodots, carbon nanohorns, graphene, Fe3O4 nanoparticles, Cu nanoclusters, and noble metals, most of which belong to peroxidase-like nanozymes that could induce the oxidation of peroxidase substrates in the presence of H2O2 [35,36]. These peroxidase nanozymes have been attractive for various applications due to the large surface-to-volume ratio as well as the fundamental and technological characteristics, and the development of enzyme mimetic-based biosensors has provided highly accurate and precise sensing of various targets from small molecules to proteins and cells including the Ebola virus, foodborne pathogens, and tumor cells [37,38,39].
Among which, graphene has a large specific surface area and is an excellent candidate for immobilizing a large number of functionalized metal oxide and noble metal nanoparticles such as Fe3O4 and AuNPs, which also have relative catalytic activity, thus, the synergy of these nanozymes could enhance the peroxidase-like activity through accelerating electron transfer [36,40,41,42]. Furthermore, Liu et al. reported that the catalytic activity of functionalized graphene materials may be inhibited by interaction with ssDNA nucleotides, which occupy the active catalytic sites of graphene [43].
Herein, for the first time, a colorimetric detection method using aptamer recognition and the synergetic effect of graphene/Fe3O4-AuNP composite triggered enzyme catalysis was established and used for the detection of lead ions. The aptamer of Pb2+ was decorated on the surface of amine magnetic beads by streptavidin–biotin interaction, the complementary chains of aptamers (cDNA) and lead ions were added into the system, so that the aptamers will preferentially bind to lead ions, while the cDNA was adsorbed on the surface of the graphene/Fe3O4-AuNPs, inhibiting active catalytic sites and preventing the peroxidase-like catalytic activity of the nanocomposites. While in the absence of lead ions, cDNA was combined with the aptamer which anchored on beads, and then removed by magnetic separation. In this scenario, the graphene/Fe3O4-AuNPs composites could play the function of enhanced peroxidase-like activity to stimulate the color reaction, thereby visual detection of Pb2+ can be achieved with the addition of 3,3′,5,5′-Tetramethylbenzidine (TMB) chromogenic reagents.

2. Results and Discussion

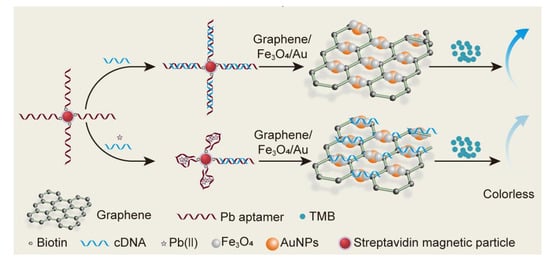
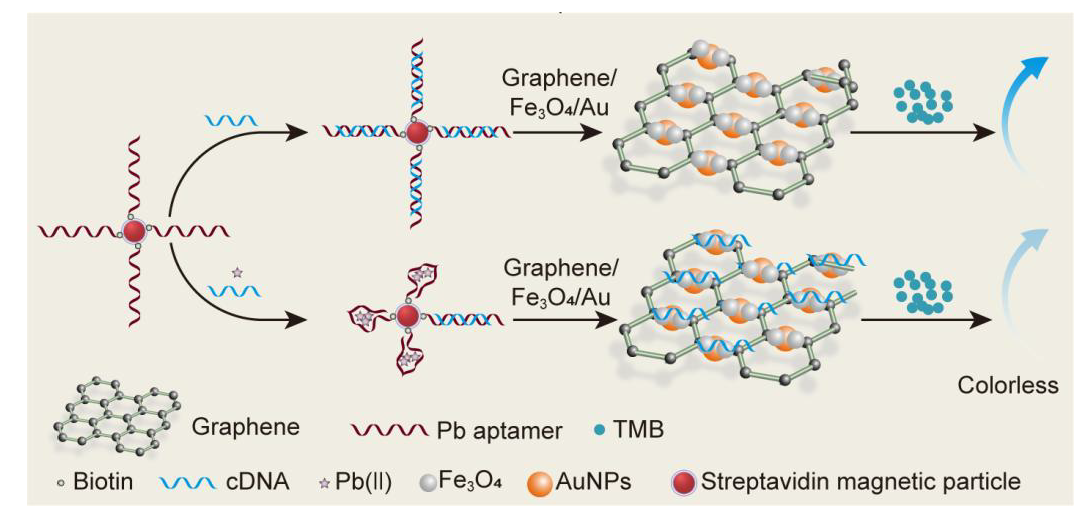
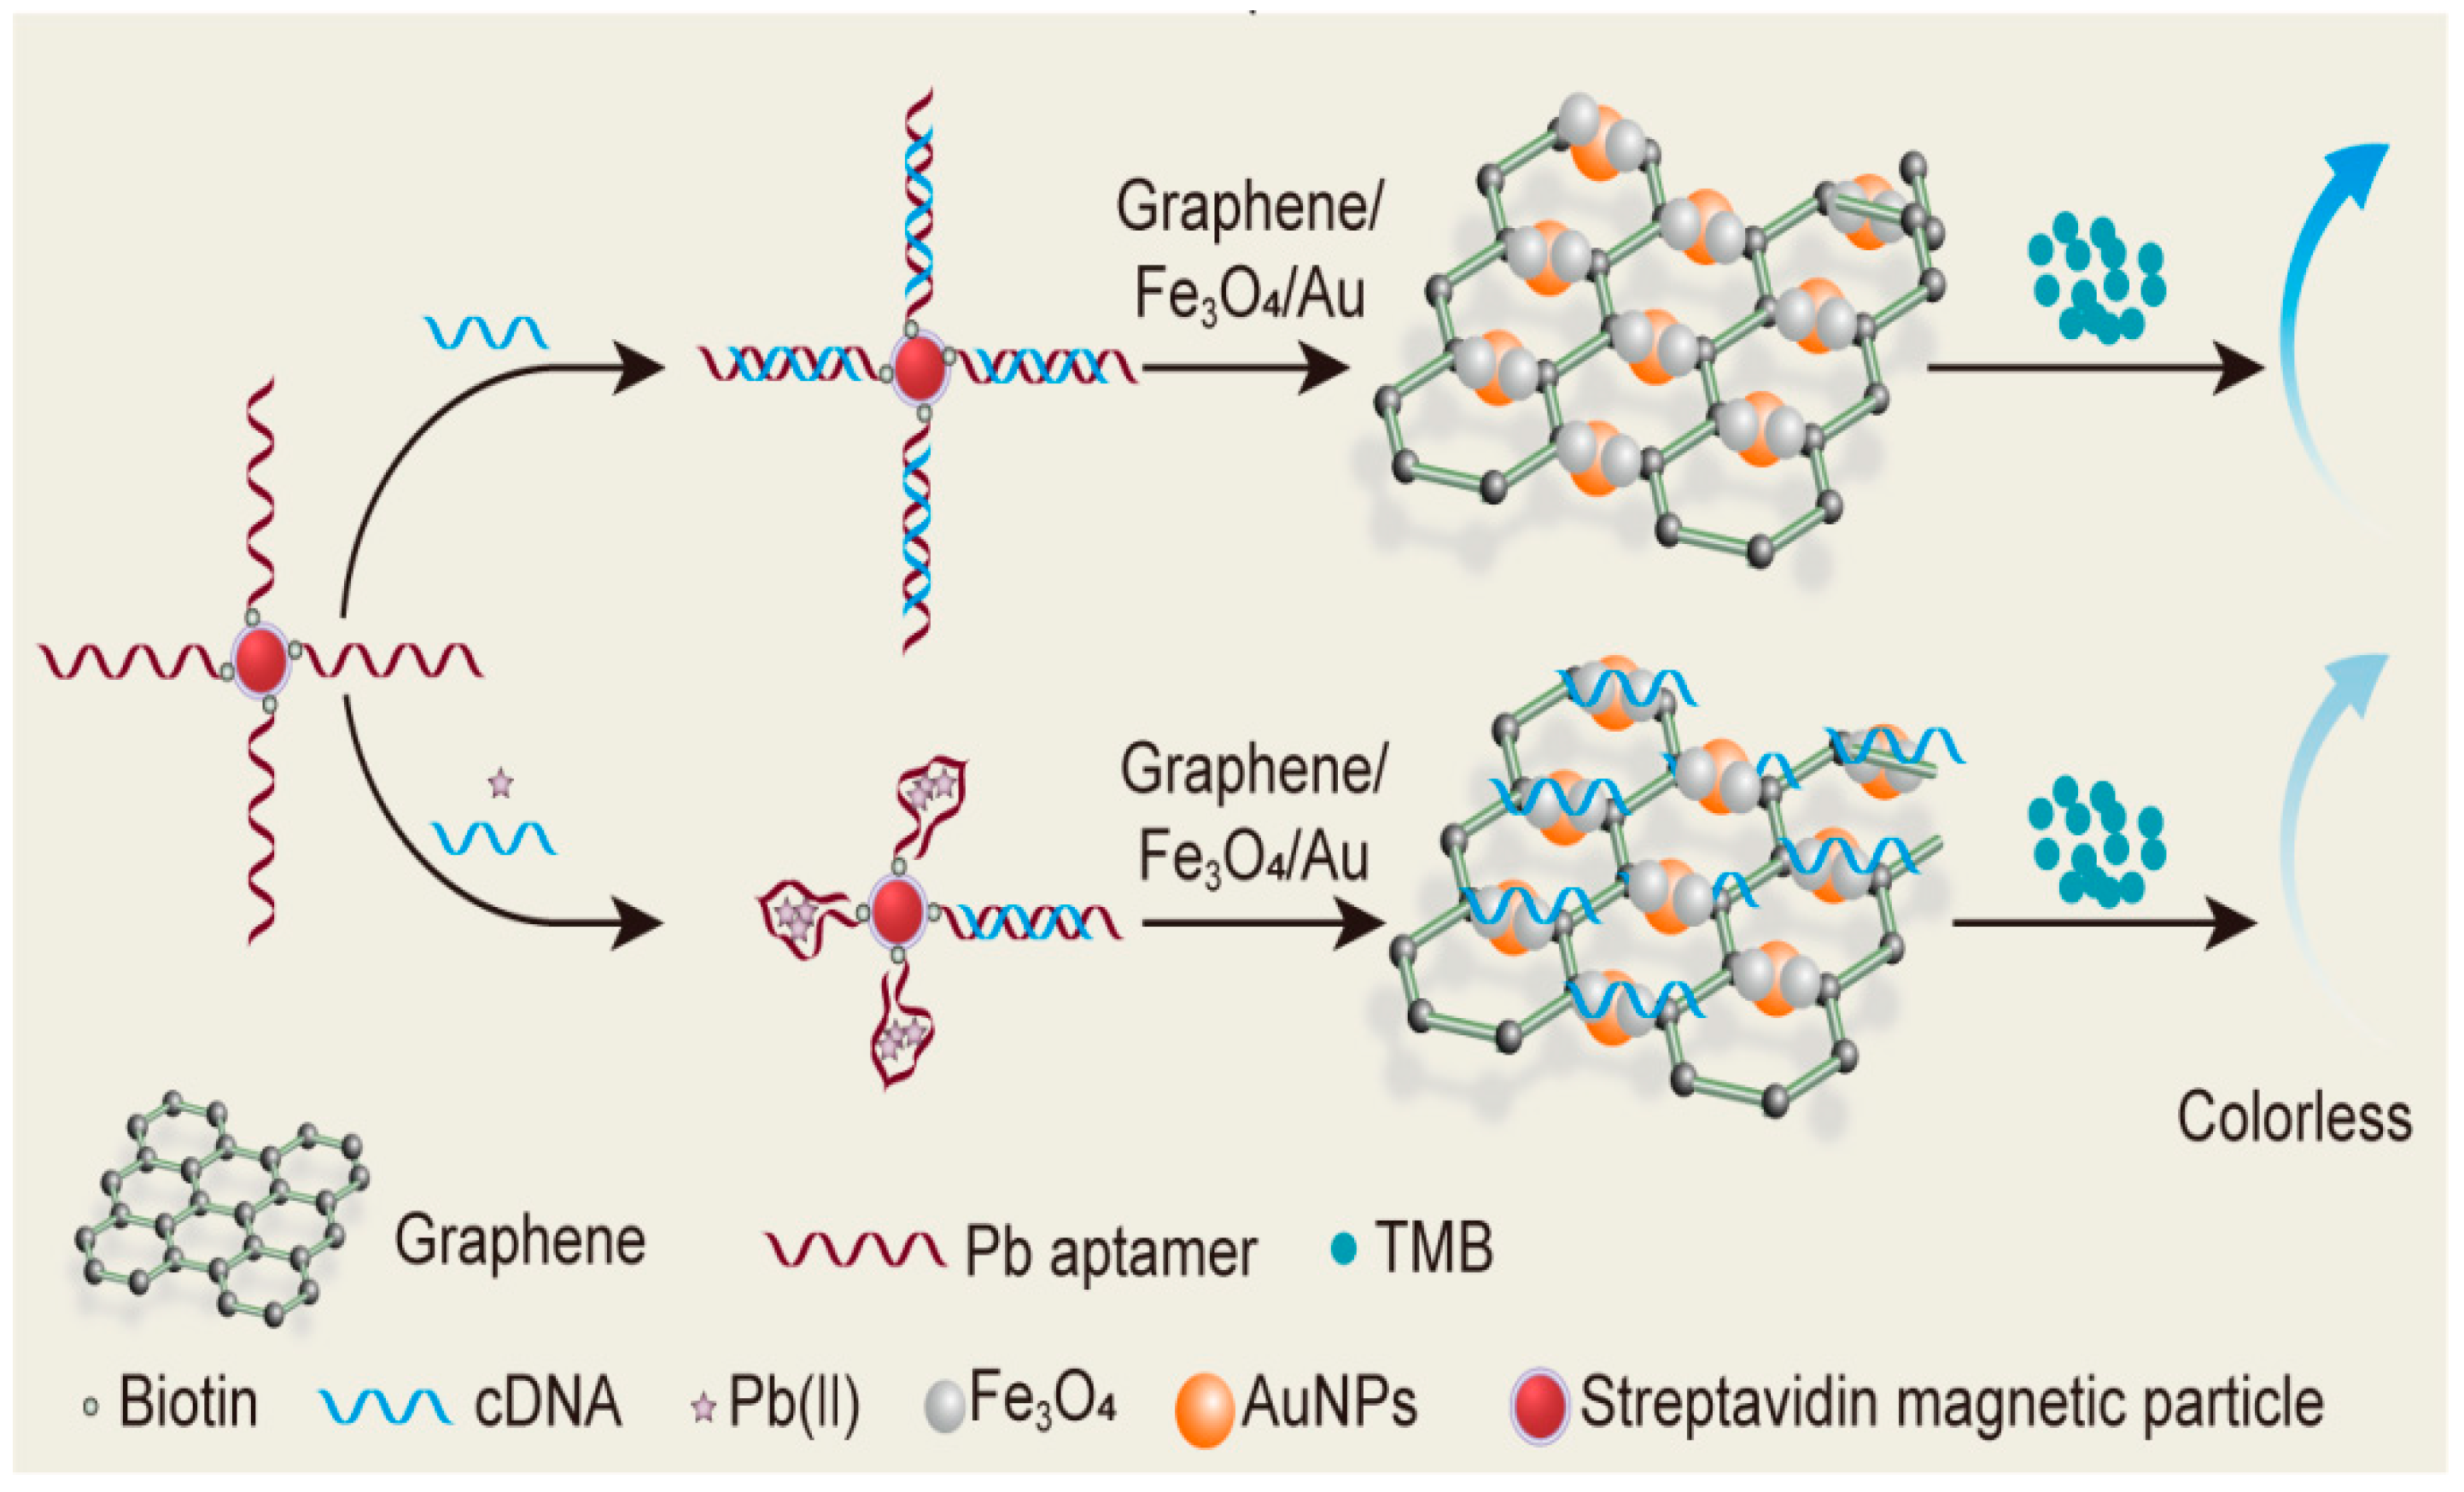
2.1. The Principle of the Colorimetric Assay

The principle of the assay is shown in Figure 1. The biotin-labeled Pb2+ aptamer was connected to the surface of the streptavidin-coated amine magnetic beads to form a capture probe. In the absence of lead ions, the aptamer on the surface of the magnetic beads will combine with the cDNA, and then the magnetic beads are separated by magnetic adsorption. For the graphene/Fe3O4-AuNP composites, graphene plays a role as a nanozyme to catalyze the oxidation of TMB by H2O2 reduction, Fe3O4 nanoparticles, and AuNPs, which grow in situ on the surface of grapheme, improving the efficiency of electron transfer from TMB, accelerating the catalytic reactions [44]. The color of the reaction solution changes from colorless to blue and can be observed by the naked eye. In addition, the absorbance value of the solution at 652 nm was measured by the microplate reader for quantitative analysis. In the presence of the lead ions, the aptamer preferentially binds to lead ions, leaving a large amount of cDNA in a free state. The magnetic beads and the aptamer bound metal ions were separated by magnetic adsorption, the free cDNA was adsorbed onto the surface of the graphene/Fe3O4-AuNPs composites by the strong π–π stacking interaction to occupy the active catalytic sites of the nanozyme, and the cDNA could also stick to the AuNPs due to the flexible structure [38]; all of these adsorptions prevent the catalytic ability of the nanocomposites to oxidize TMB to trigger the color reaction, so the color of the reaction solution turns lighter, enabling the quantitative analysis of lead ions by measuring the absorbance value of the solution.

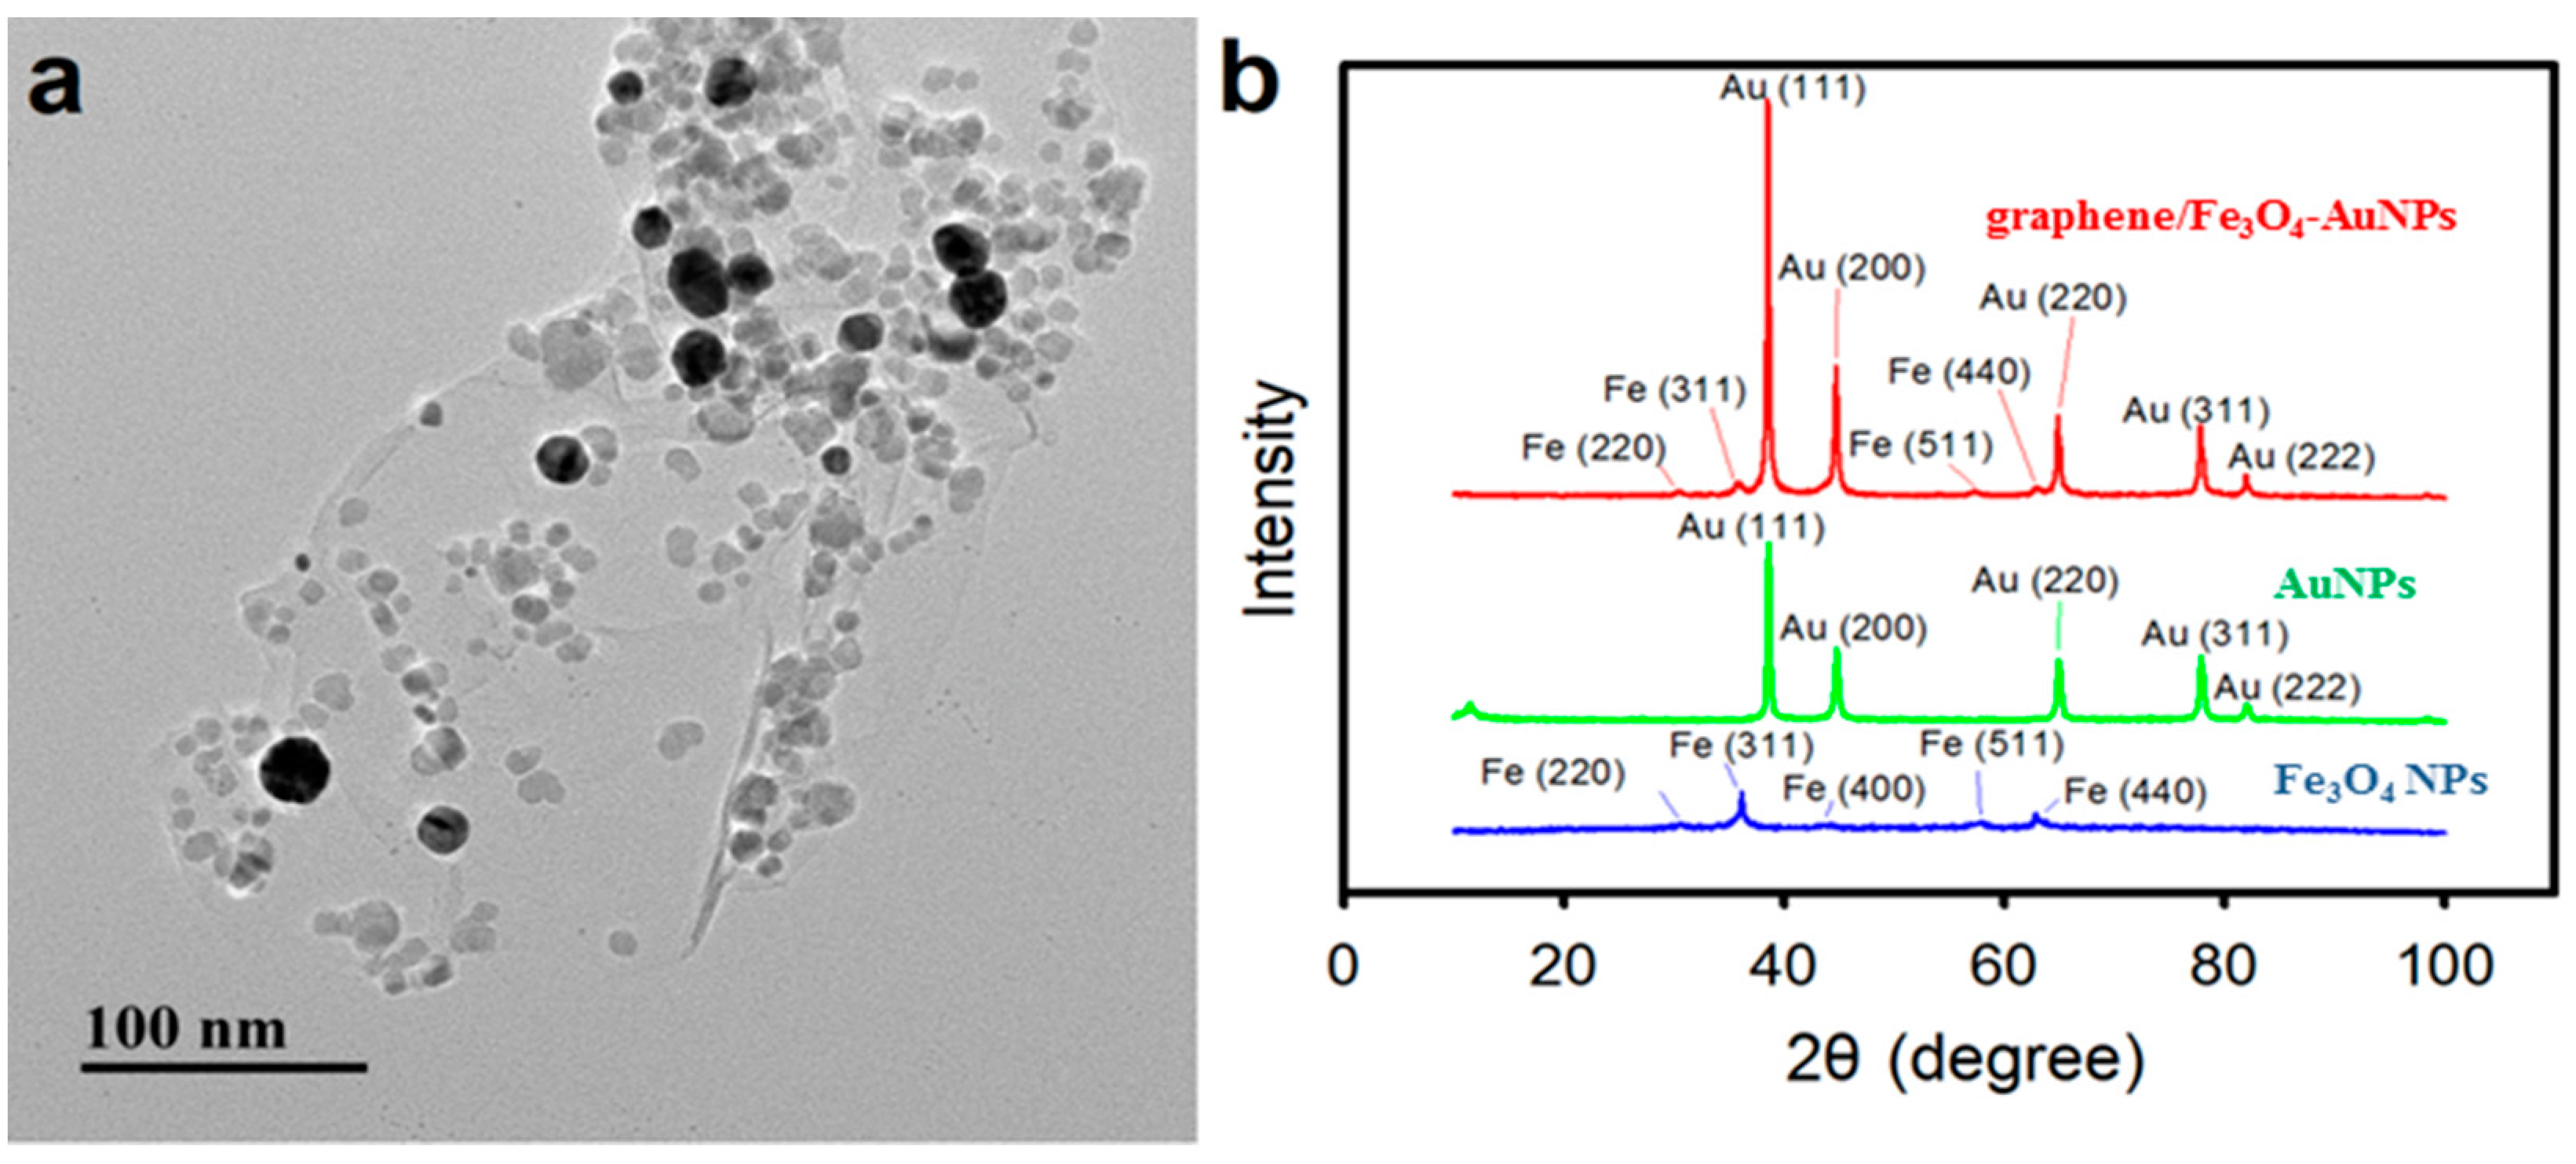
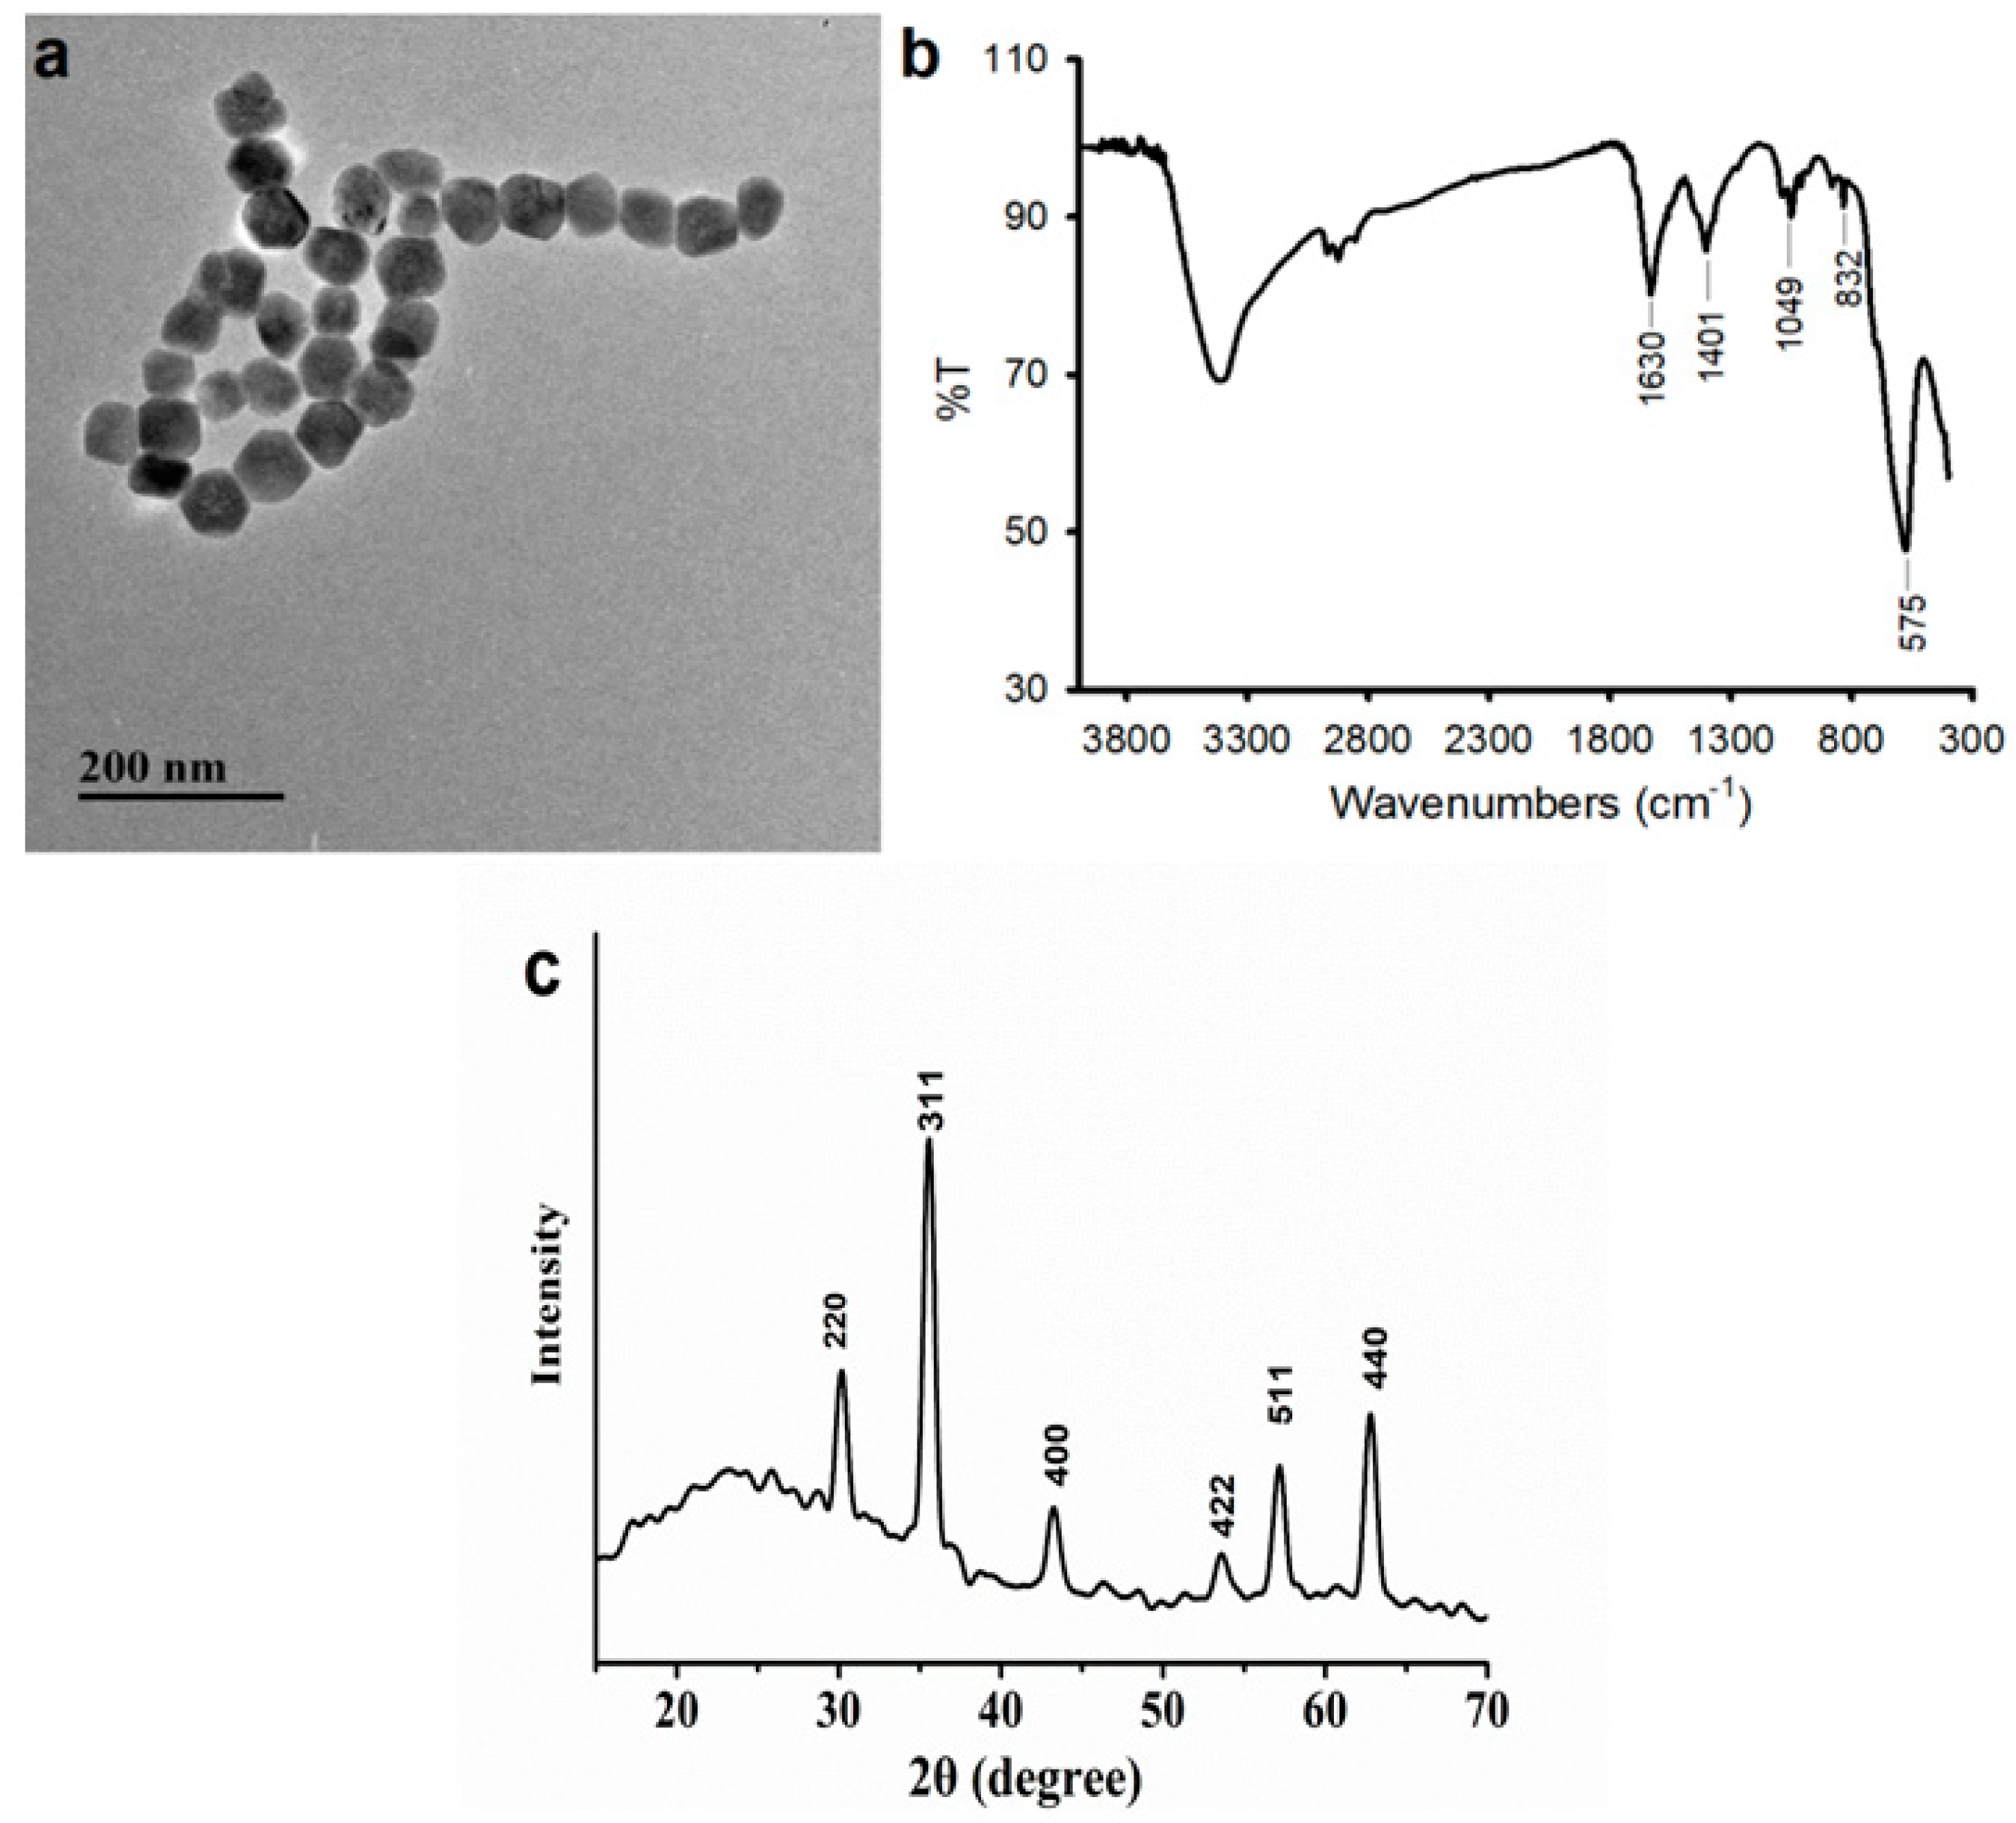
2.2. Characterization of Graphene/Fe3O4-AuNP Composites

The prepared graphene/Fe3O4-AuNPs composites were characterized by TEM and XRD. Figure 2a is the TEM of the composites, where the lamellar materials at the bottom of the figure are graphene, the light gray particles are Fe3O4 nanoparticles grown in situ, the dark particles are gold nanoparticles grown in situ, and the two kinds of nanoparticles are evenly distributed on the graphene. Figure 2b is the XRD spectrogram, from top to bottom are the XRD patterns of graphene/Fe3O4-AuNP composites (red pattern), AuNPs (green pattern), and Fe3O4 nanoparticles (blue pattern). As shown in the figure, characteristic peaks of Au crystal positioned in the 2θ scale at 38.6°, 44.7°, 64.9°, 77.9°, and 82.0° can be attributed to the Au(111), Au(200), Au(220), Au(311), and Au(222) planes, respectively, and the characteristic absorption peaks at 2θ = 30.5 °, 36.0 °, 43.6 °, 57.9 °, and 62.8 ° can be attributed to Fe(220), Fe(311), Fe(400), Fe(511), and Fe(440), respectively. These characteristic peaks can be observed in the XRD pattern of graphene/Fe3O4-AuNP composites, which proves that AuNPs and Fe3O4 nanoparticles have been successfully fabricated on the prepared composites.

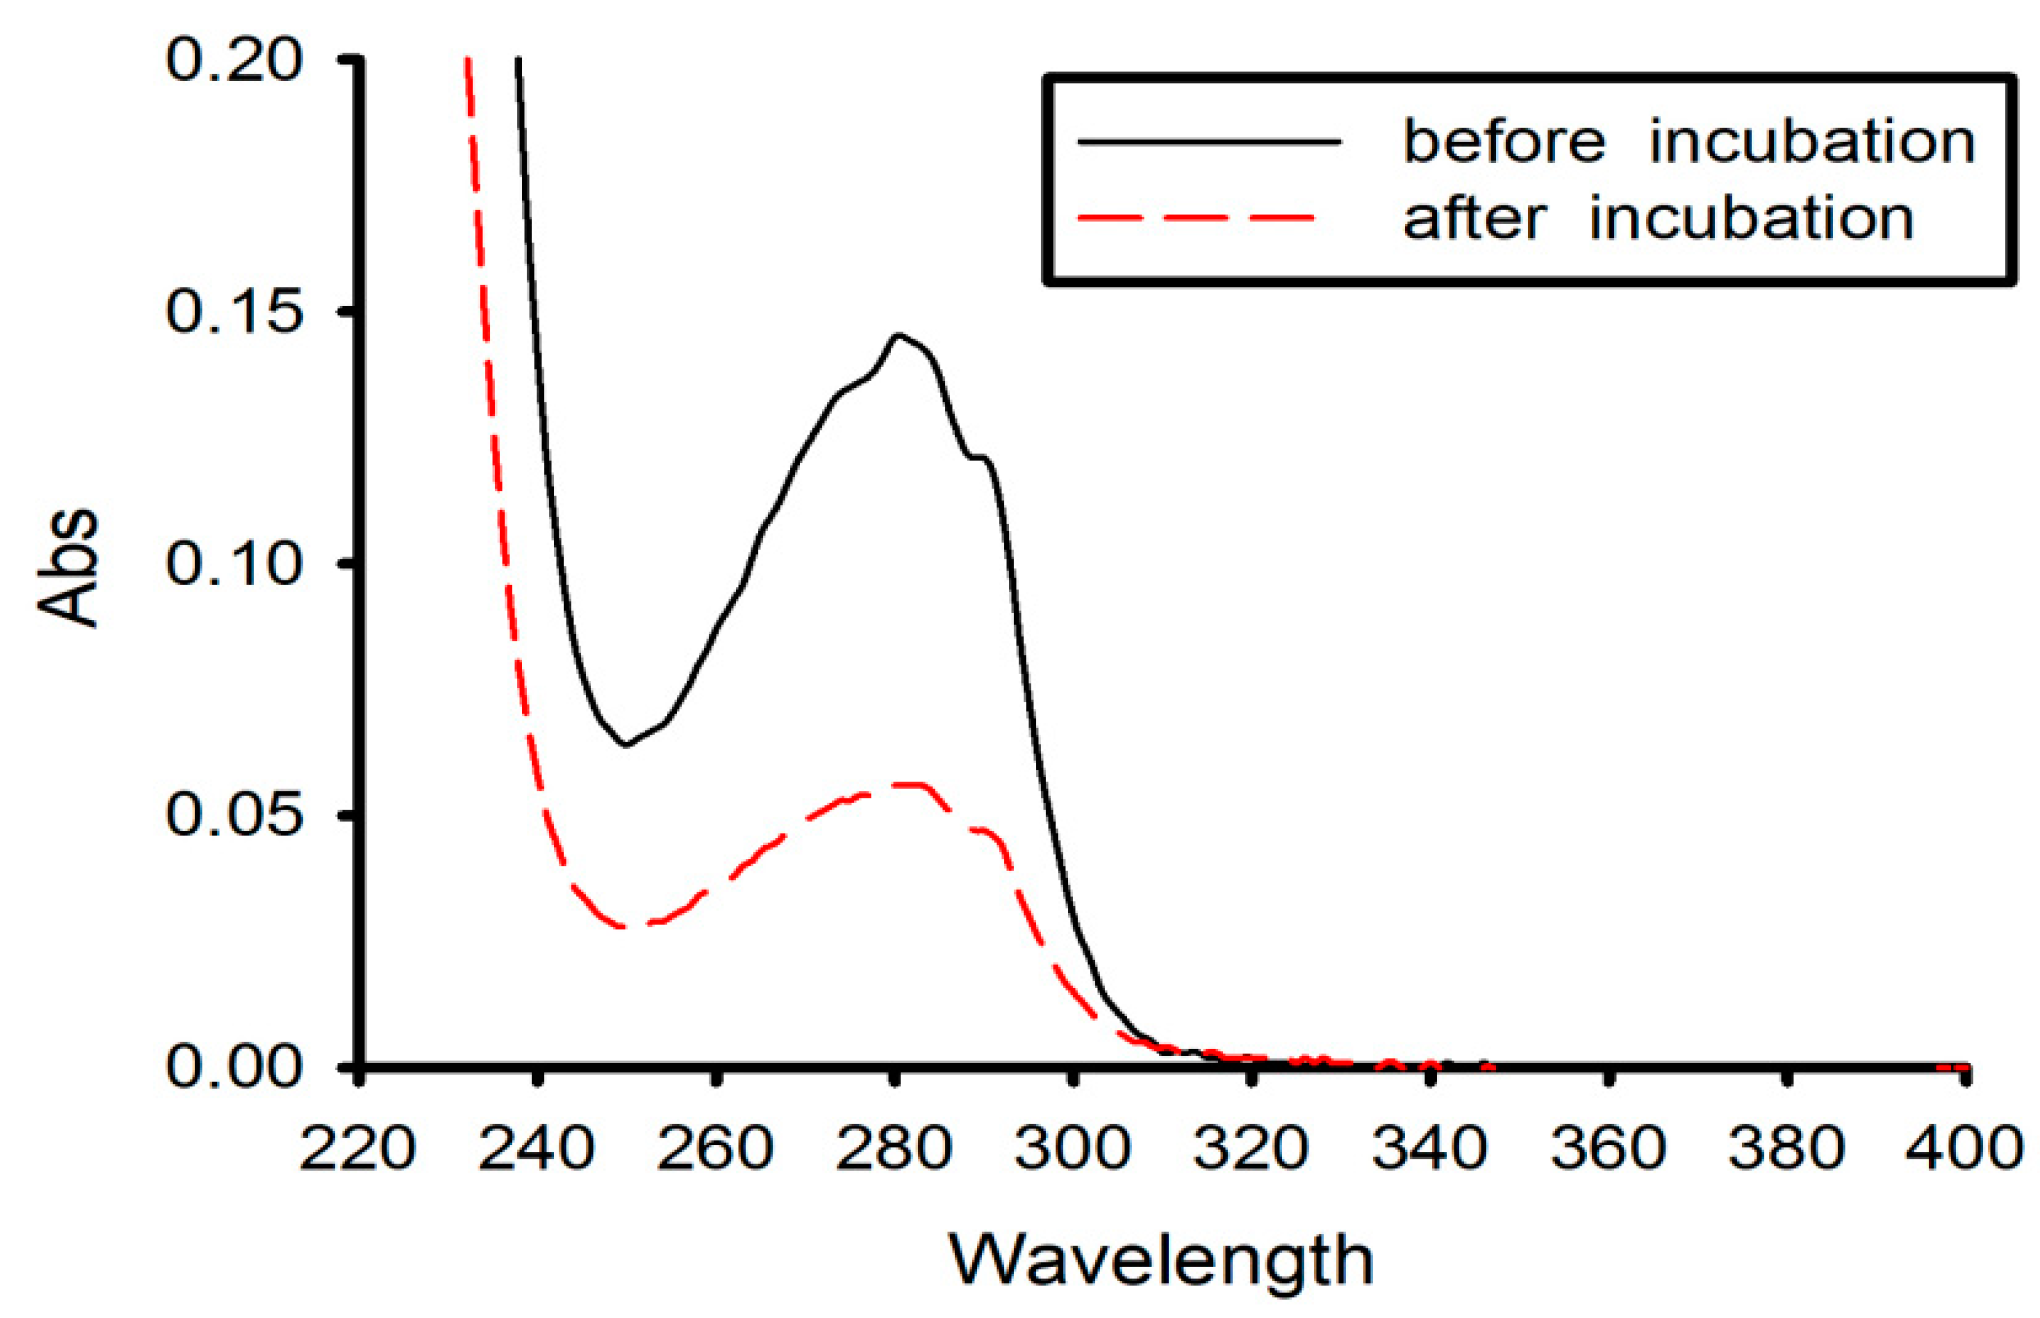
2.3. Characterization of Amine Magnetic Beads

The prepared amine magnetic beads were characterized by TEM, FTIR, and XRD. Figure 3a is the TEM image of the amine magnetic beads. It indicates that the prepared magnetic beads have a particle size of 50 to 70 nm and good dispersibility. Figure 3b is the Fourier infrared spectrum of the magnetic beads. The fabricated magnetic beads had characteristic absorption peaks of Fe–O at 575 cm−1, and the characteristic absorption peaks of NH at 1630 cm−1, 1049 cm−1, and 832 cm−1, which proved that the amino group had been successfully modified on the surface of magnetic beads. Figure 3c is the XRD pattern of amine magnetic beads, which represented six characteristic peaks at 2θ = 30.1°, 35.5°, 43.5°, 53.4°, 57.1°, and 62.5° corresponded to Fe(220), Fe(311), Fe(400), Fe(422), Fe(511), and Fe(440) crystallographic planes, respectively, which indicates the crystal structure of the amine magnetic beads.

2.4. Characterization of Streptavidin-Coated Amine Magnetic Beads

Streptavidin and amine magnetic beads are connected by using glutaraldehyde as a cross-linker, according to the principle that the aldehyde group reacts with the amino group to form a Schiff base. Ultraviolet spectrophotometry was used to verify the reaction. The supernatant of the solution was extracted by magnetic separation, and as shown in Figure 4, the characteristic absorption peak of streptavidin in the supernatant at 280 nm was about 0.15, and the absorption peak reduced to 0.05 after streptavidin connected with the magnetic beads, indicating that most of the streptavidin in the solution had connected to the magnetic beads.

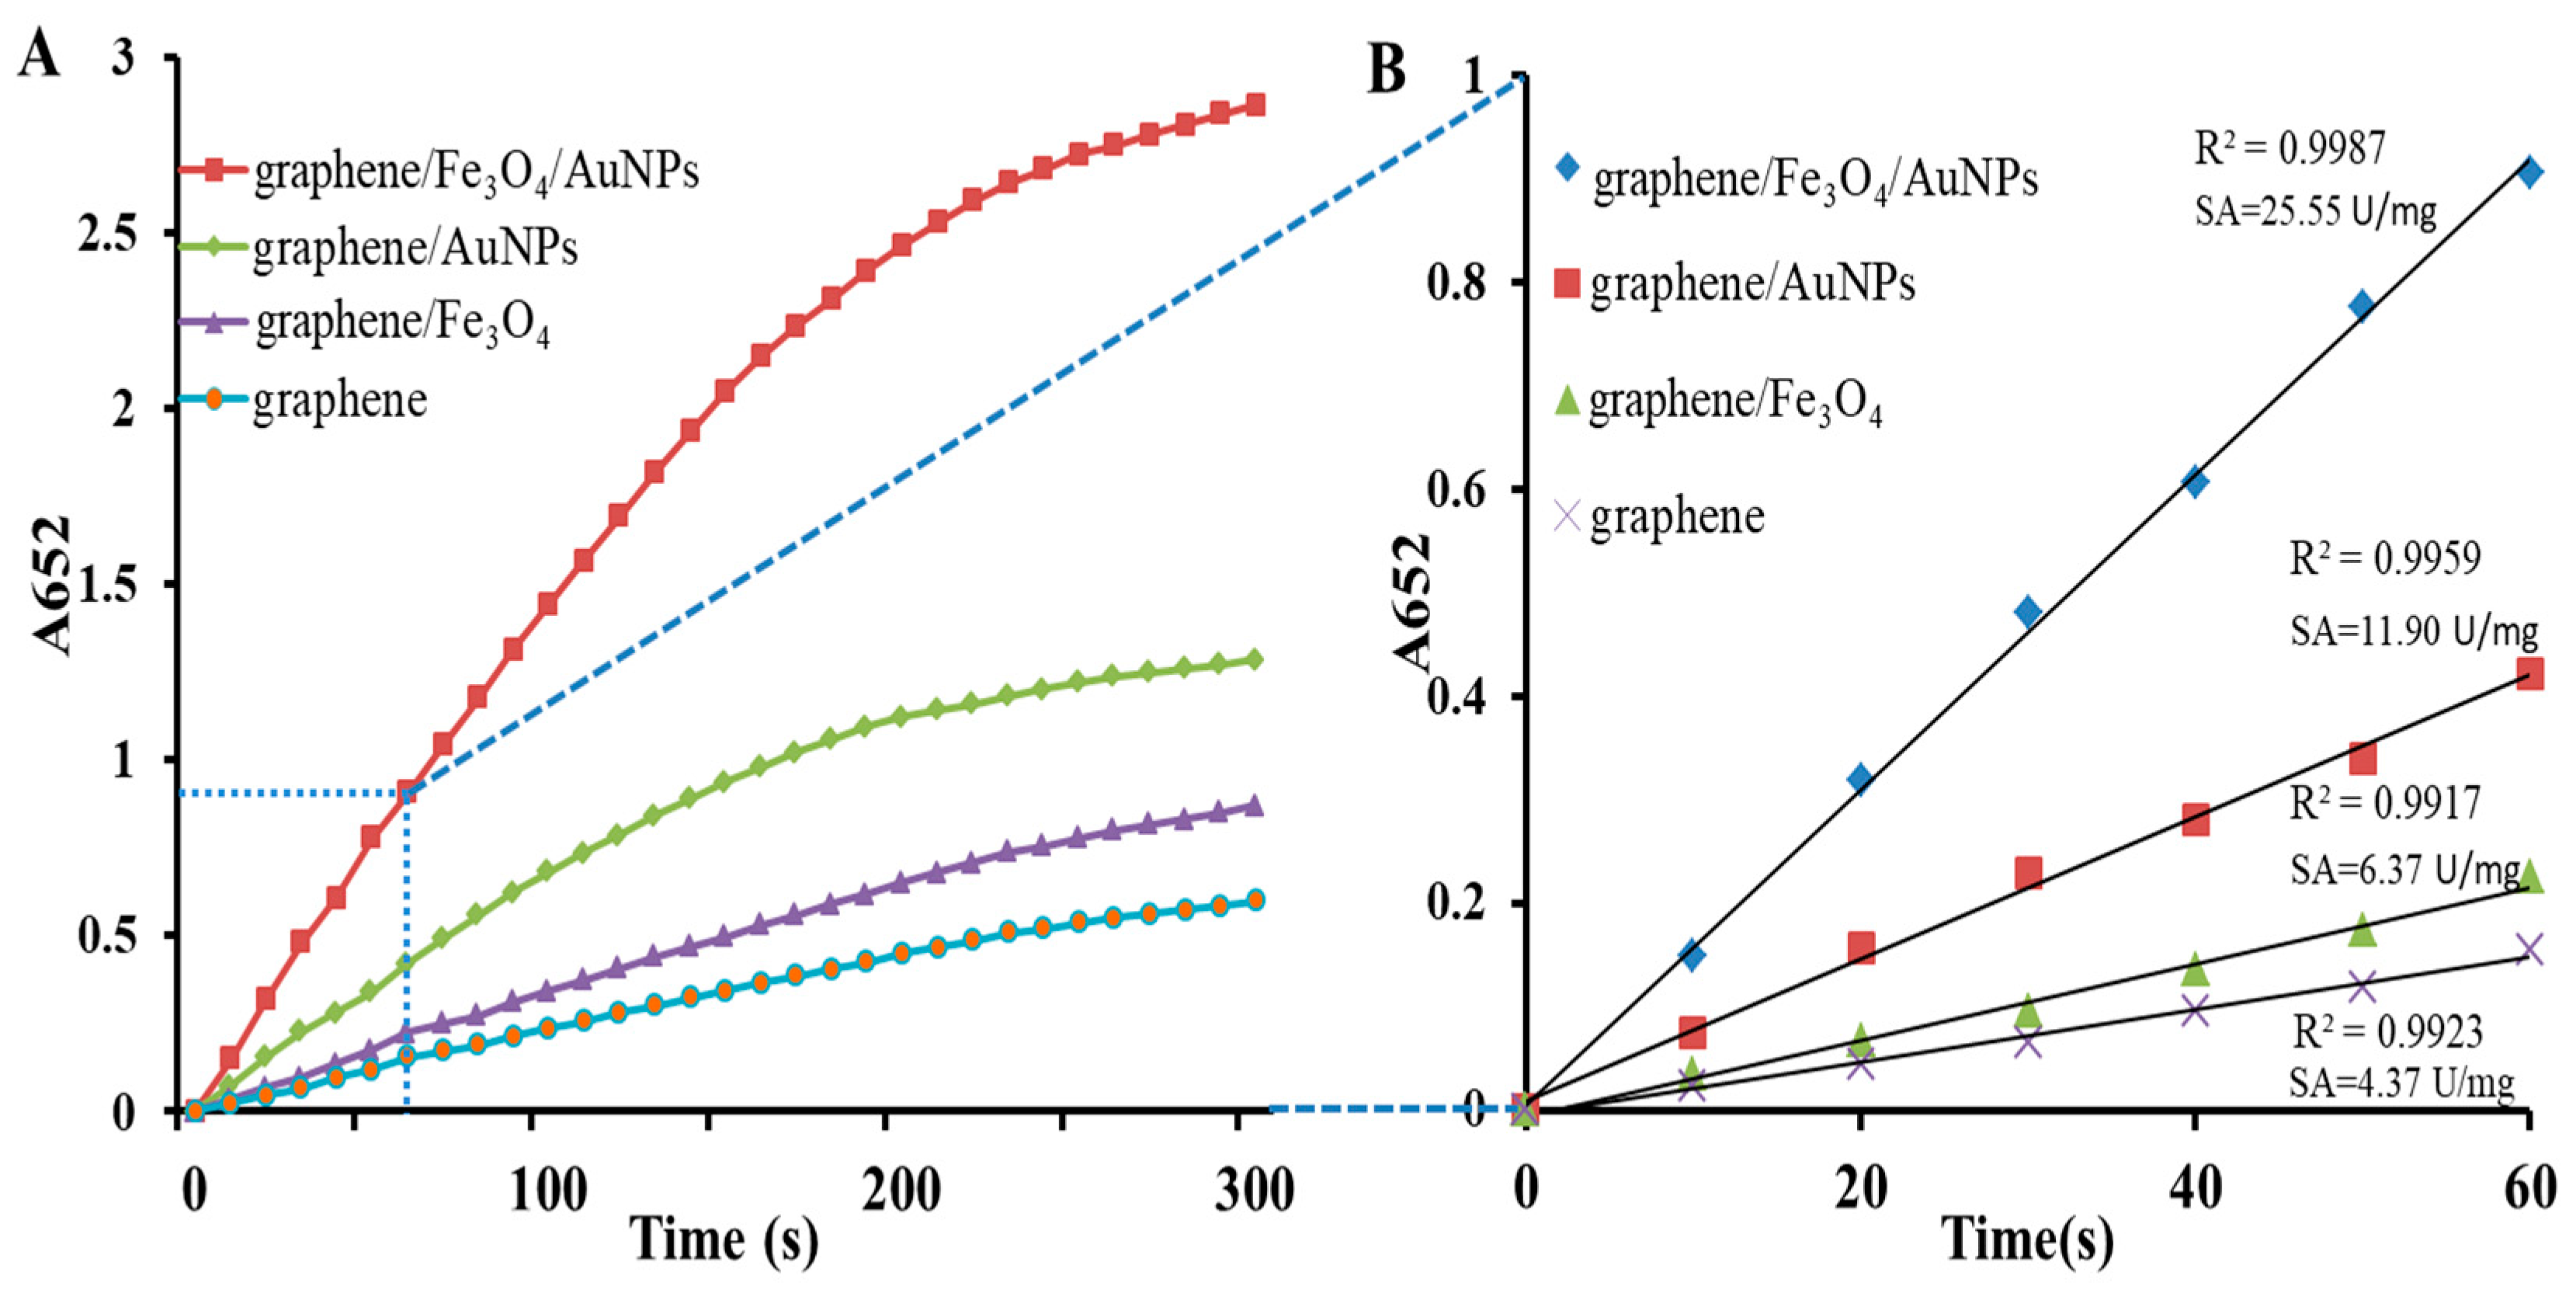
2.5. Catalytic Performance Verification of Graphene/Fe3O4−AuNPs

To verify that the synergy of graphene/Fe3O4/Au enhanced the catalytic specific activity, graphene/Fe3O4/AuNPs, graphene/AuNPs, graphene/Fe3O4, and graphene were simultaneously tested for specific activity. Figure 5A shows the time–absorbance curves of the reaction. The absorbance increased within the whole reaction time, and was linear in the initial 60 s, so 60 s was selected as the initial rate period (Figure 5B). According to the above-mentioned equation, the specific activities of graphene/Fe3O4/AuNPs, graphene/AuNPs, graphene/Fe3O4, and graphene were calculated as 25.55 U/mg, 11.90 U/mg, 6.37 U/mg, and 4.37 U/mg, respectively. Among these, graphene/Fe3O4/AuNPs had the highest specific activity, which proved that the synergetic coupling effect of graphene, Fe3O4, and AuNPs enhanced the catalytic activity of the nanozyme.

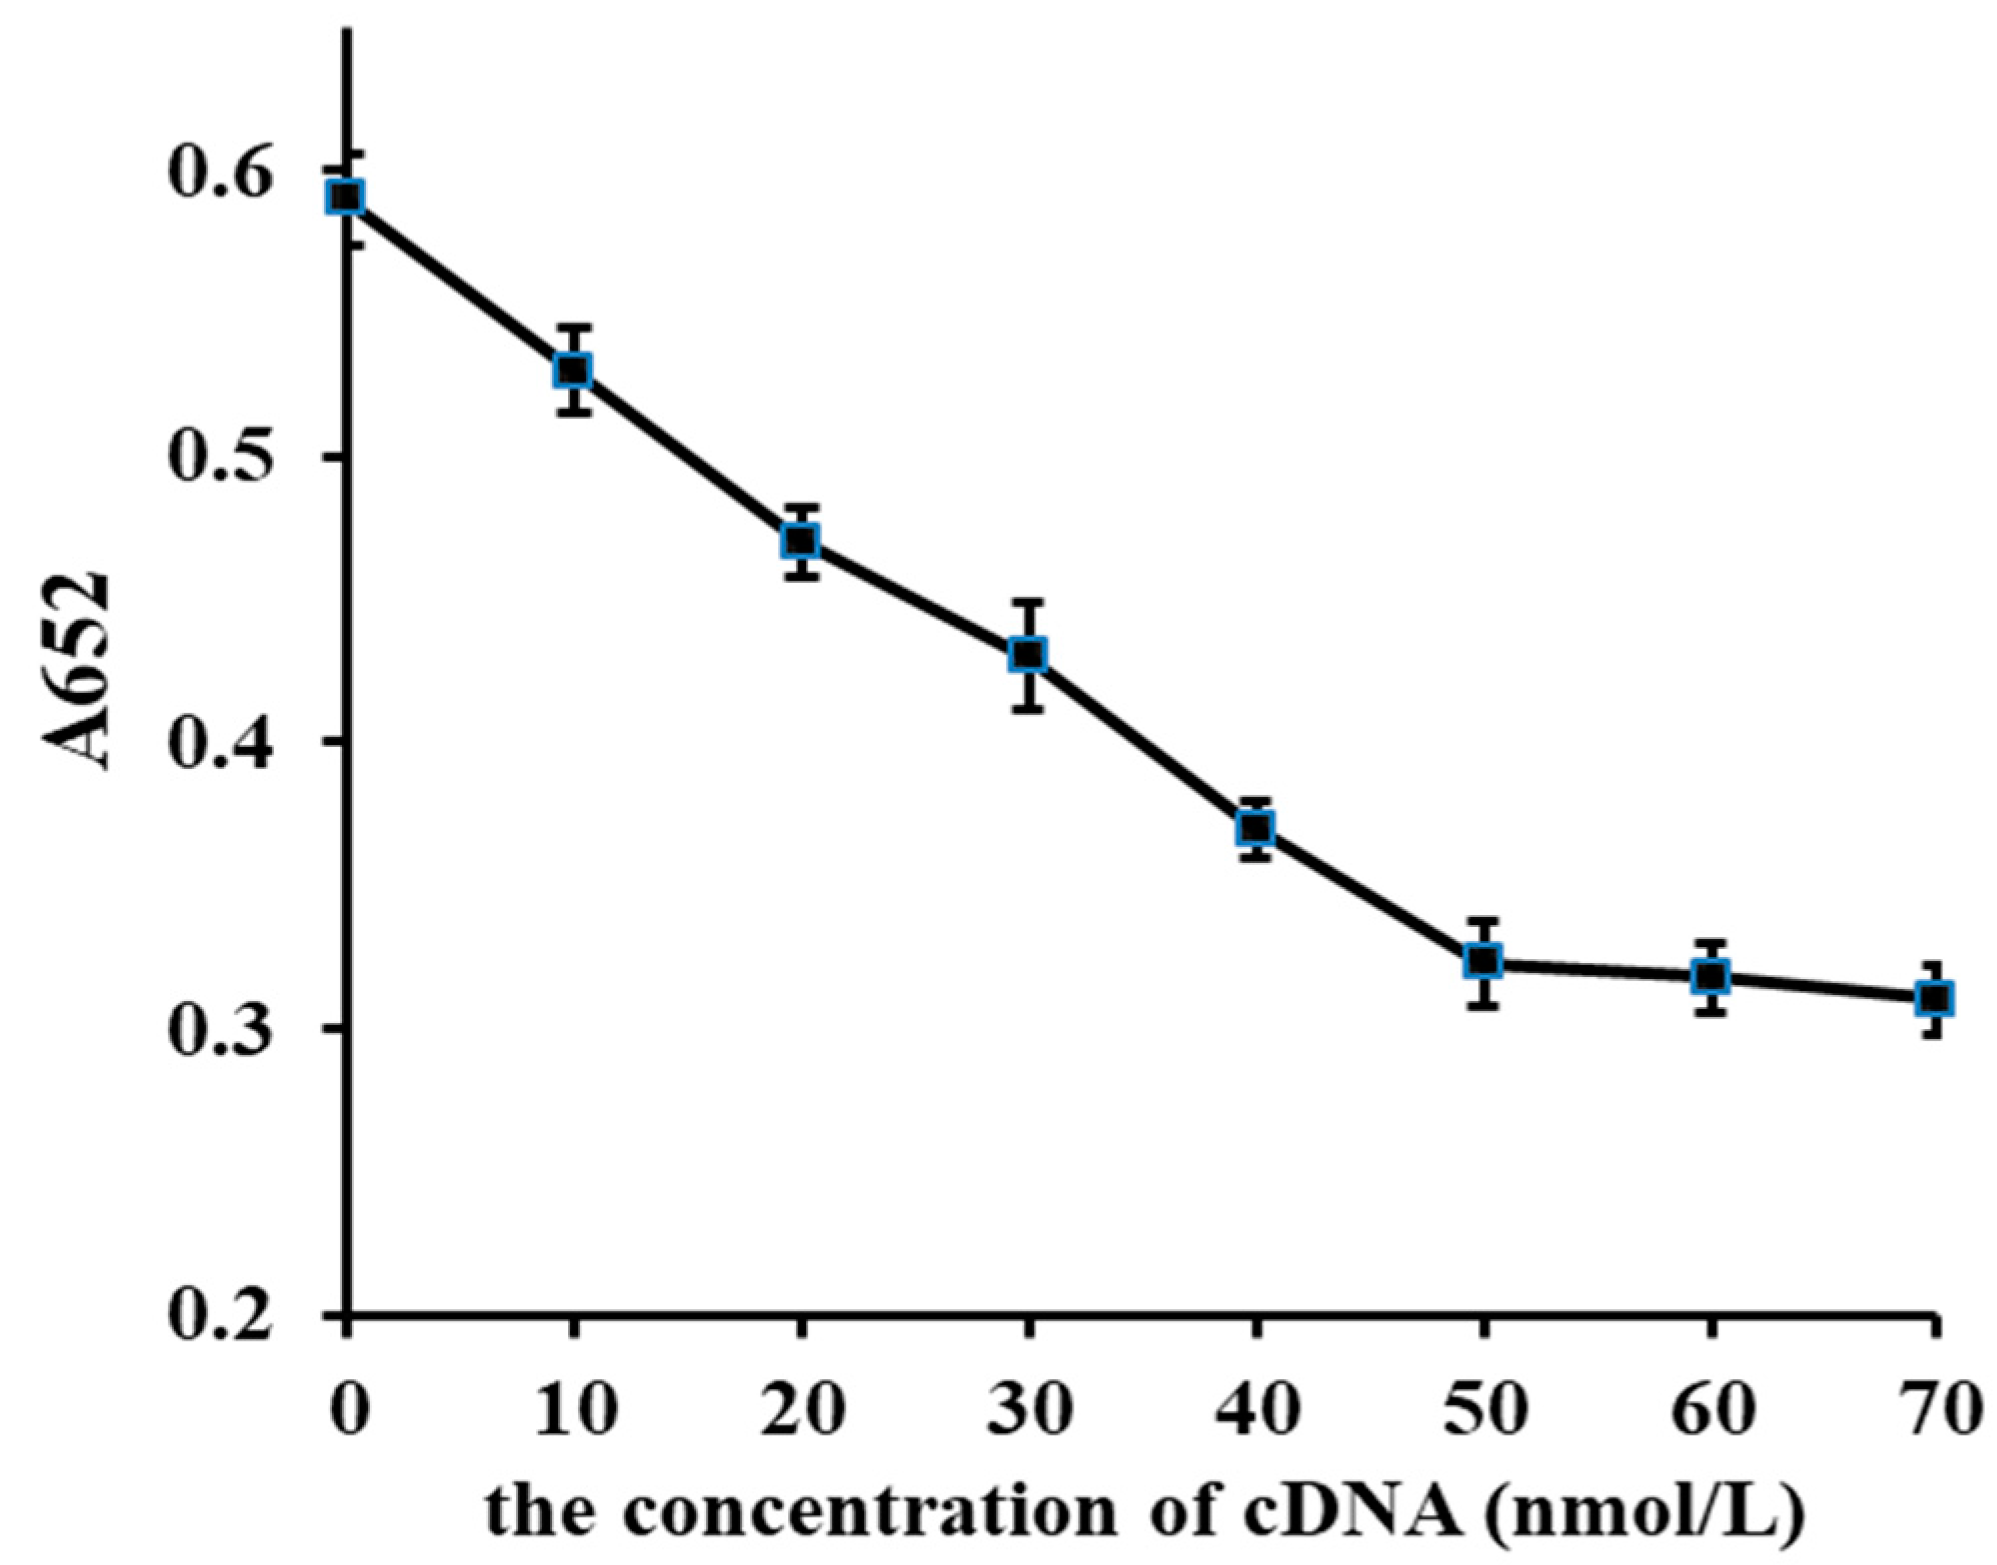
2.6. Optimization of the Concentration of Complementary Strands

Complementary strands of the aptamer can be adsorbed on the surface of graphene/Fe3O4-AuNP composites and inhibit the catalytic activity of the nanozyme. In the optimization process, eight different concentrations (0, 10, 20, 30, 40, 50, 60, and 70 nmol/L) of cDNA were studied. As shown in Figure 6, the A652 value decreased as the concentration of the cDNA increased, indicating that the catalytic activity of the graphene/Fe3O4-AuNP composite was suppressed due to the adsorption of the cDNA onto the surface. When the concentration of cDNA reached 50 nmol/L, the A652 value tended to be stable, which proves that the catalytic activity of graphene/Fe3O4-AuNPs had reduced to the lowest level. Thus, 50 nmol/L was employed as the concentration of the cDNA.

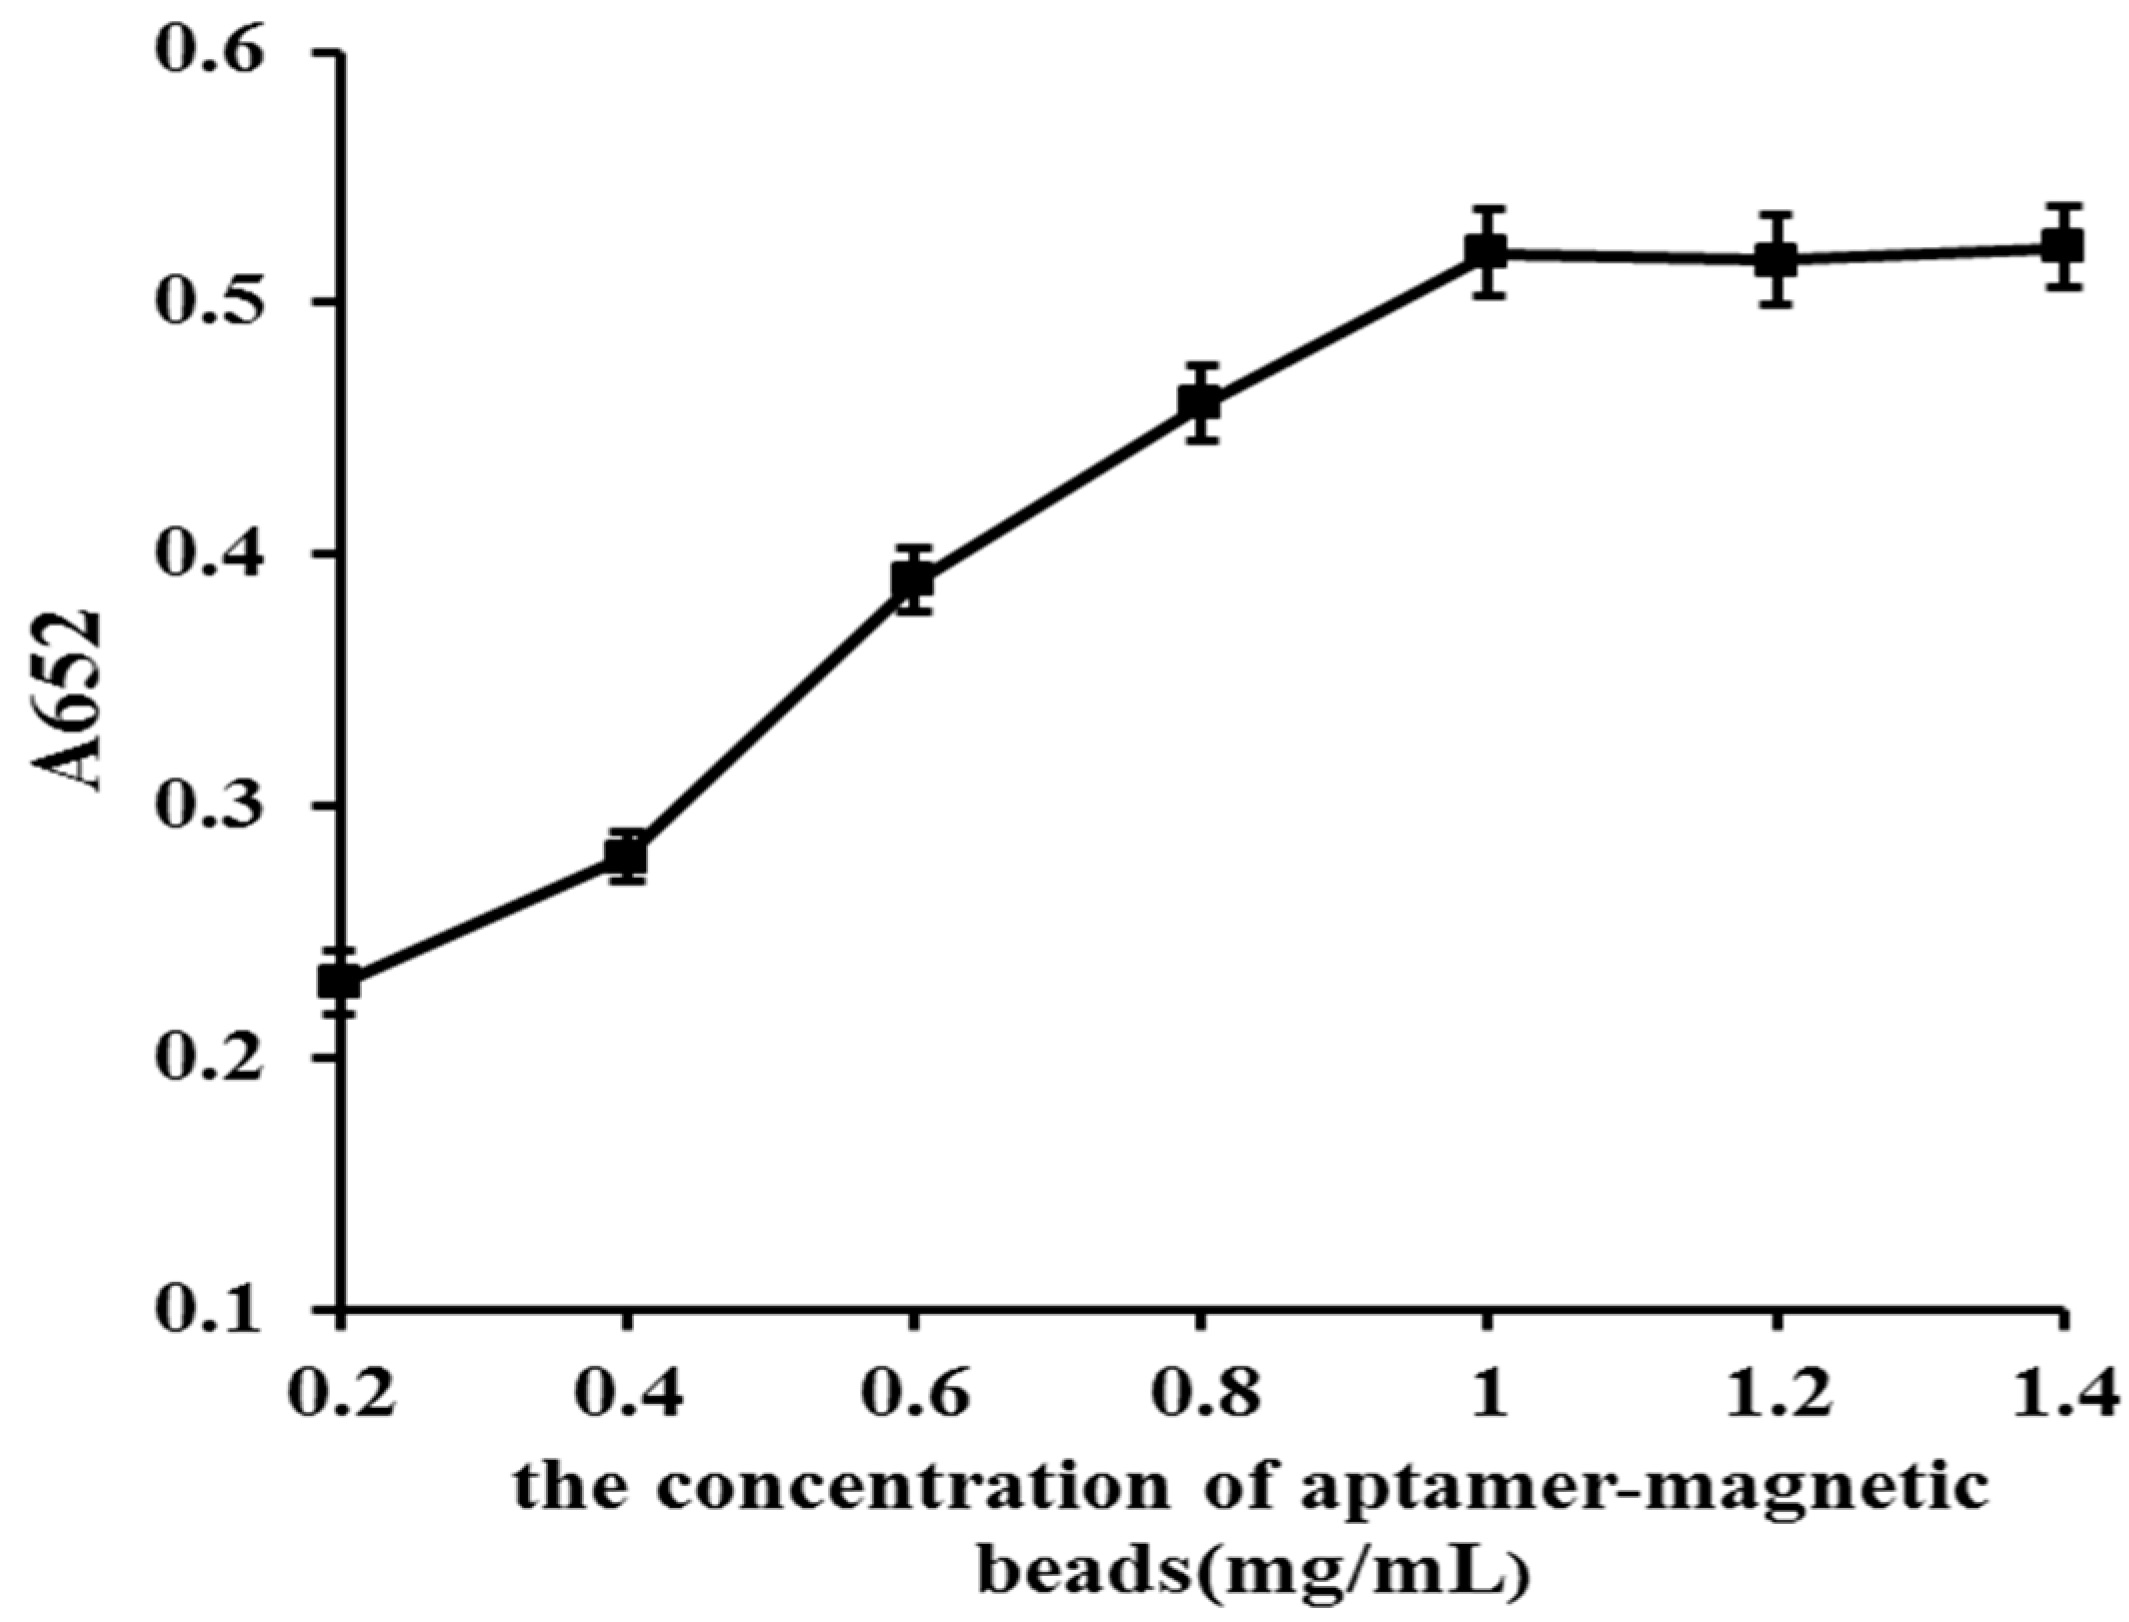
2.7. Optimization of the Concentration of Magnetic Beads

The concentration of the aptamer decorated magnetic beads was optimized, and seven different concentrations (0.2, 0.4, 0.6, 0.8, 1, 1.2, and 1.4 mg/mL) were selected. As shown in Figure 7, as the concentration of the complex increased from 0 to 1 mg/mL, the value of A652 gradually increased, indicating that the cDNA had been combined with the aptamer decorated magnetic beads and subsequently removed from the system by magnetic separation. When the concentration of the complex reached 1 mg/mL, the A652 value tended to no longer increase, which proved that almost all of the cDNA in the system had been removed by magnetic separation, and the optimal concentration was 1 mg/mL.

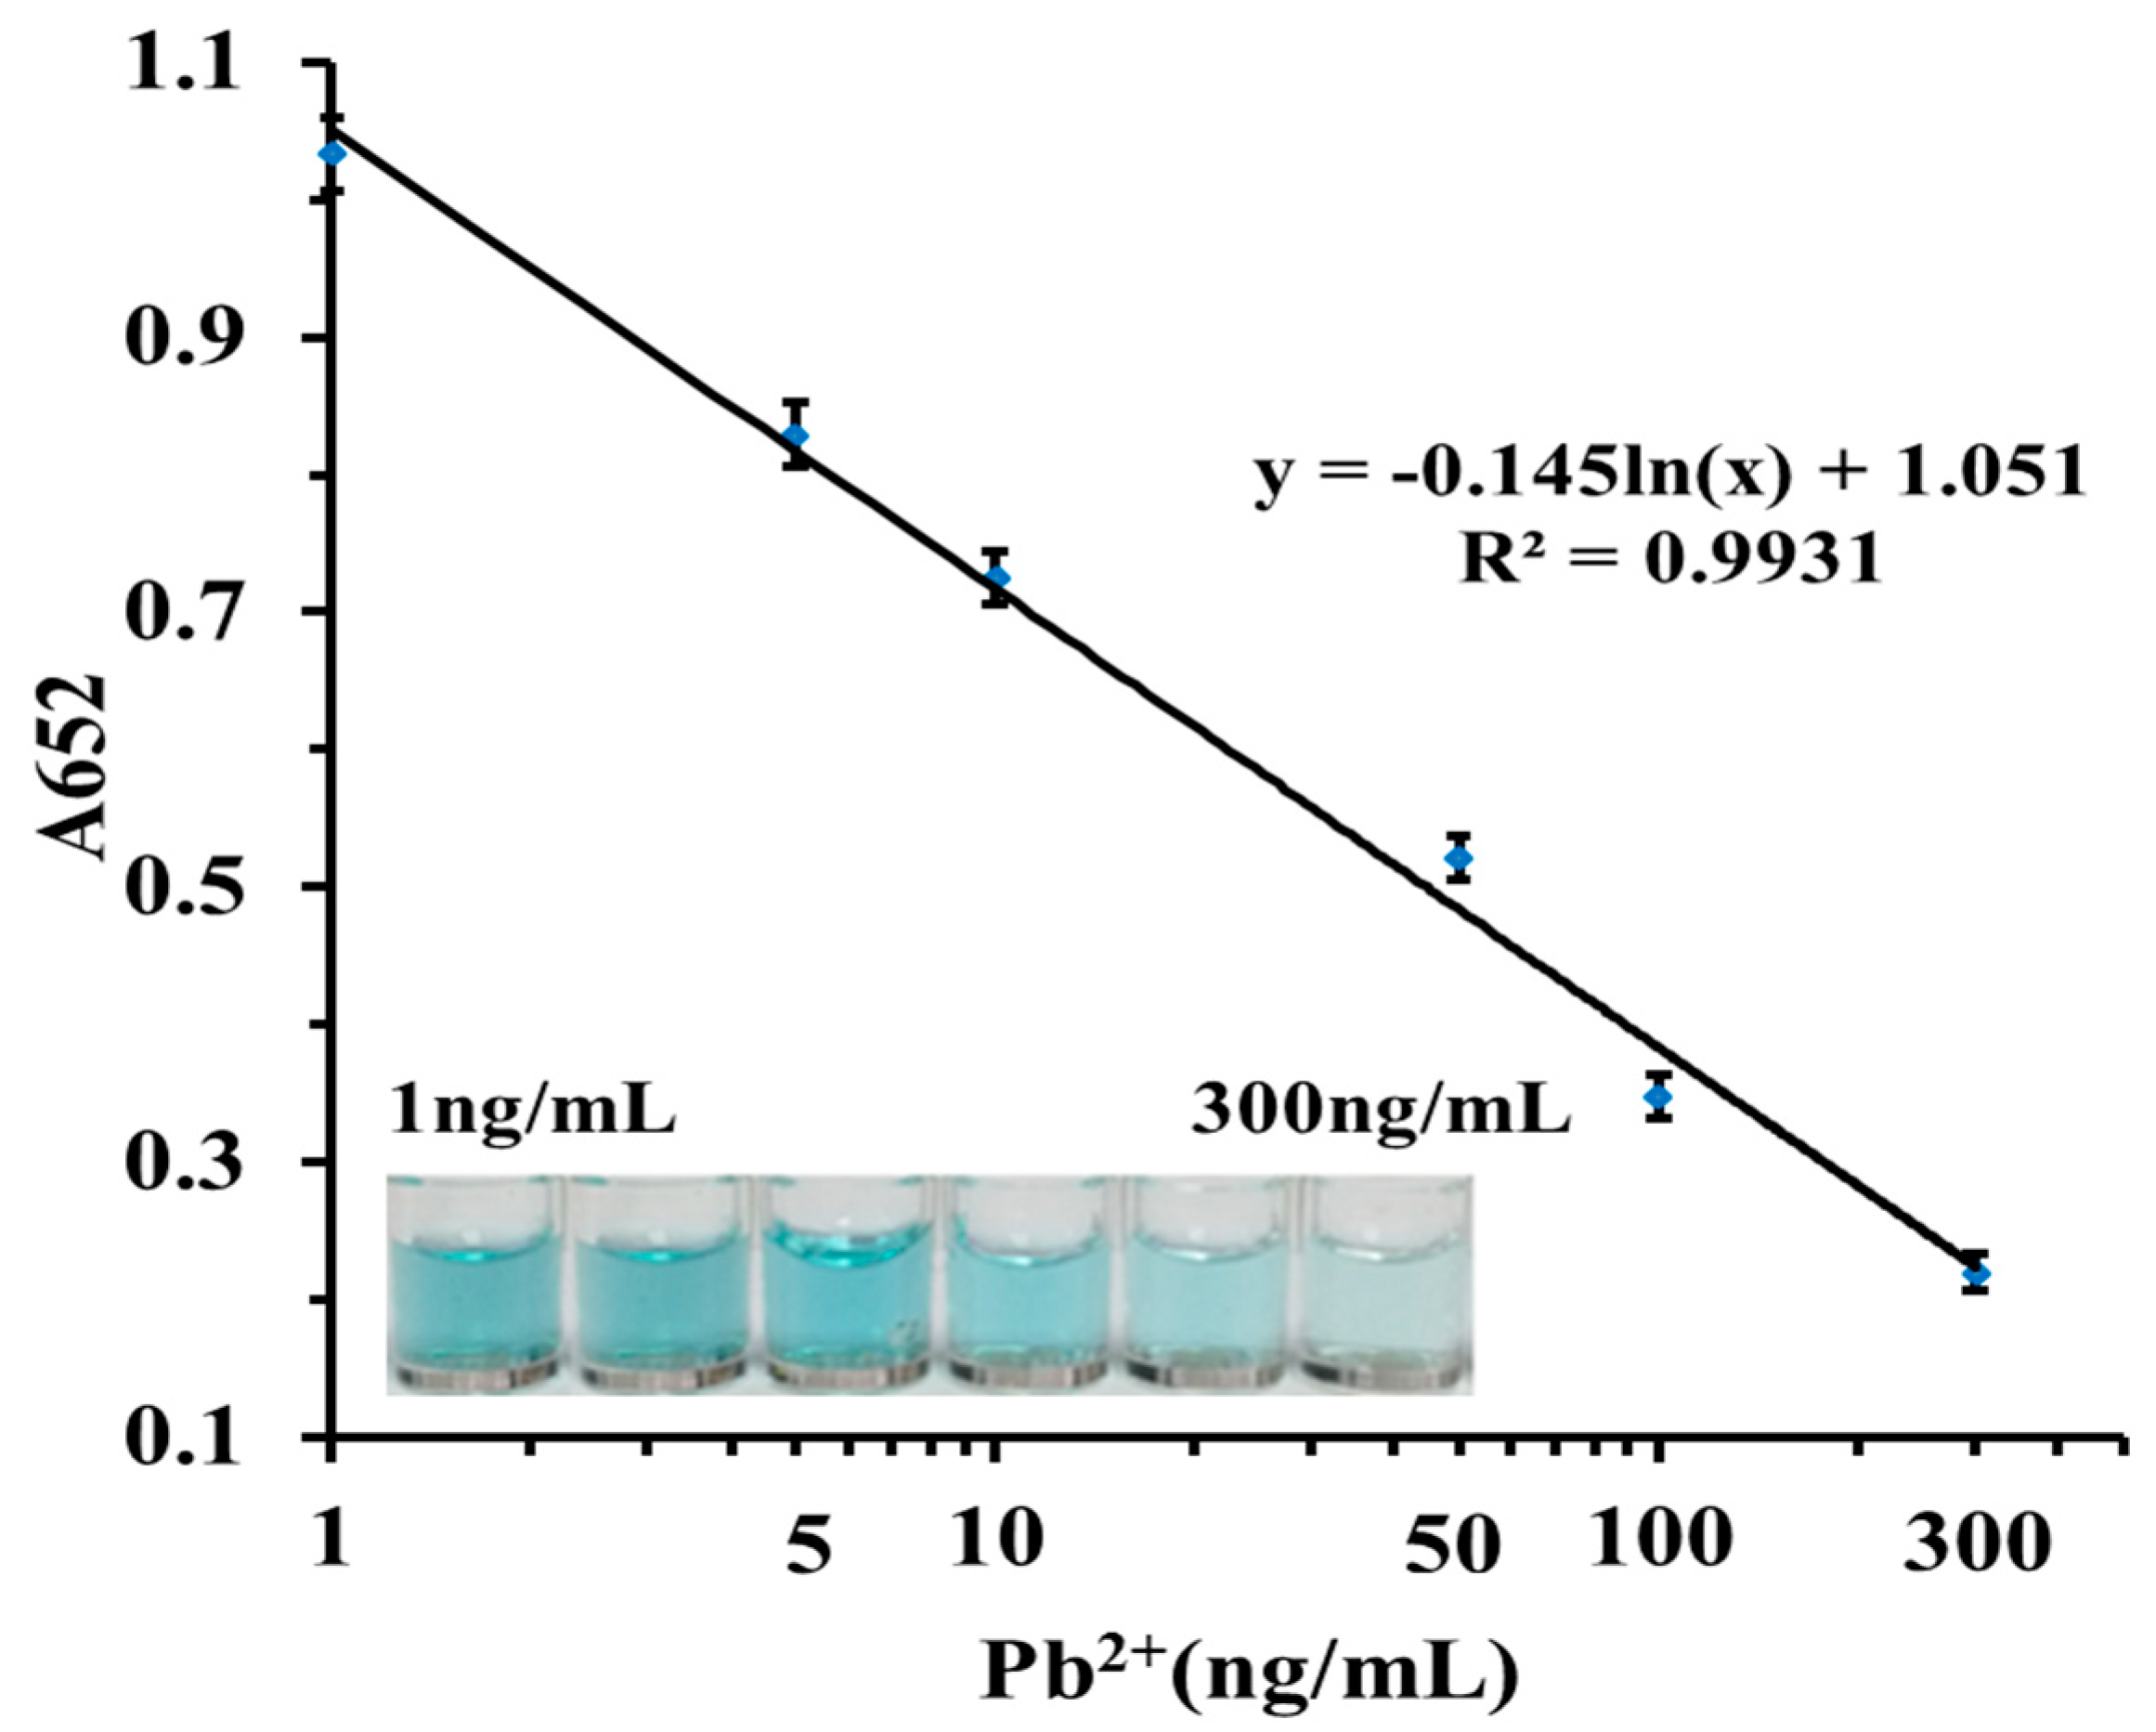
2.8. Detection Performances

Under the optimal conditions, the proposed method was used to detect lead ion standard samples of different concentrations. As shown in Figure 8, the absorbance value at 652 nm decreased when the concentration of Pb2+ increased, and the color of the solution gradually changed from dark blue to light blue, which could be observed by the naked eye, exhibiting good linear relationship within the working range from 1 to 300 ng/mL (R2 = 0.9931). The limit of detection was 0.63 ng/mL, which was determined by a 3 Sb/slope. The relative standard deviation of the ten test results was 2.3%, which proves that this assay has good repeatability. The proposed method and other recently developed methods for the detection of Pb2+ are summarized and compared in Table 1, and indicate that the linear range and the LOD of this assay are competitive among the listed methods.

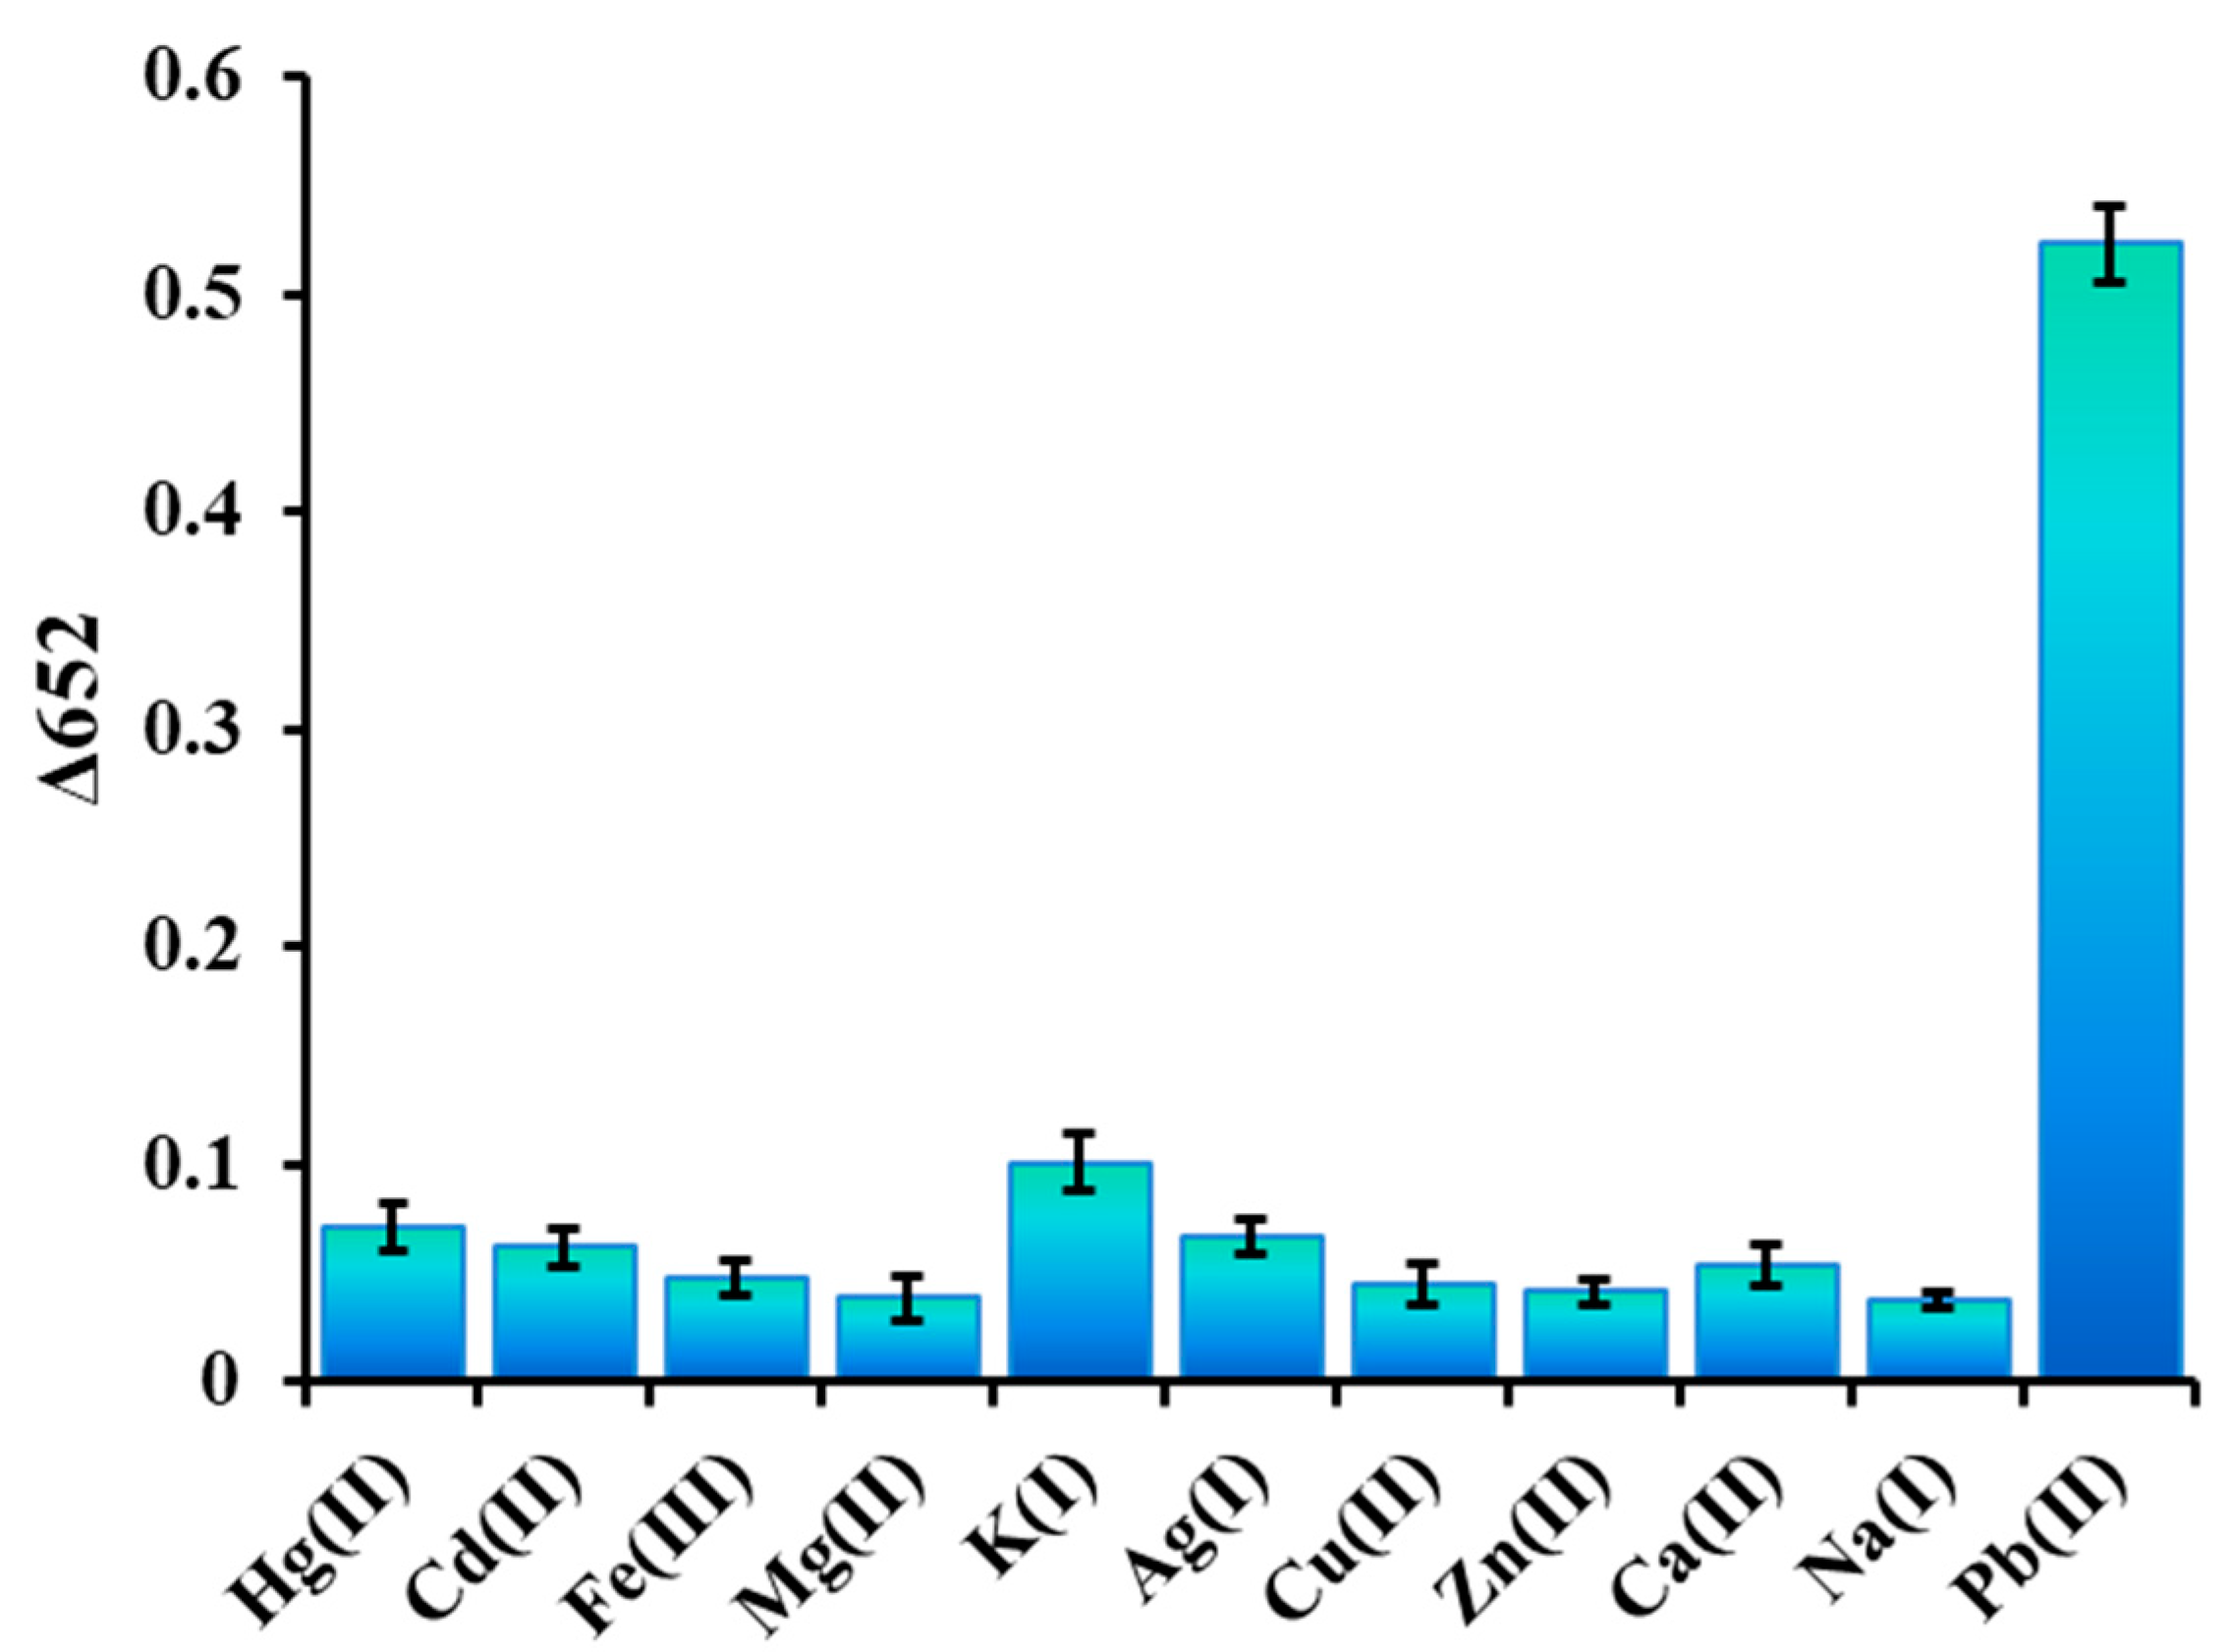
2.9. Evaluation of Specificity

To explore the effect of the potentially foreign ions on this assay, ten metal ions including Hg2+, Cd2+, Fe3+, Mg2+, K+, Ag+, Cu2+, Zn2+, Ca2+, and Na+ were studied under the optimized conditions, the concentration of Pb2+ was 50 ng/mL, each concentration of the competitive metal ions was 10-fold higher than Pb2+, and the results are shown in Figure 9. Compared to the A652 value of the blank sample, no noticeable changes were detected in the presence of interference metal ions, while an obvious variation in the absorbance value was observed after the addition of Pb2+, indicating that the developed method possesses great selectivity for Pb2+ detection.

2.10. Analysis of Pb2+ in Real Samples

To further determine whether the assay was applicable to the real samples, the prepared method was applied to detect Pb2+ in tap water. The water samples were filtered with a 0.22 μm membrane (Millipore) and then diluted with 10 mmol/L Tris-HCl buffer (pH 7.4). The lead ions contained in the spiked water sample were measured by this proposed method and atomic absorption spectrometry. The measurement results are exhibited in Table 2, where there were no noticeable differences between the two methods, and the recoveries of water samples tested by this assay ranged from 95.3% to 106.0%, which demonstrates that the proposed method is capable of the accurate detection of PB2+ in water samples.

3. Materials and Methods

3.1. Chemicals and Apparatus

Graphene, graphene/Fe3O4, and graphene/AuNPs were bought from Jiangsu XFNANO Materials Co. Ltd. (Nanjing, China). Standard solution of Pb2+ (1000 μg/mL in 1.0 mol/L nitric acid) was obtained from Aladdin Reagent Company (Shanghai, China). Glutamic acid, sodium acetate, and TMB chromogen reagent were obtained from Sigma-Aldrich (Shanghai, China). CH3OH, CH3CH2OH, C2H6O2, C5H8O2, FeCl3·6H2O, HAuCl4, and other chemicals used without further purification were obtained from Sinopharm Chemical Reagent Ltd. (Shanghai, China). Ultrapure water used throughout this work was purified by a Milli-Q Integral water system. The aptamer and complementary strand were synthesized according to Li et al.’s report [48] by Sangon Biotech Co. Ltd. (Shanghai, China) and the sequences were as follows:
Biotin labeled Pb2+ aptamer sequence: 5′-biotin-GGGTGGGTGGGTGGGT-3′;
Pb2+ aptamer complementary strand sequence (cDNA): 3′-CCACCCTCCCAC-5′.
A JEM-2100HR transmission electron microscope (TEM, JEOL Ltd., Japan) was used to observed the size and morphology of the nanocomposites. X-ray diffraction (XRD) was performed on a D8-Avance (Bruker AXS Ltd., Germany) to detect the crystal phase of the composites. The amine magnetic beads were verified by a Nicolet Nexus 470 FTIR ESP spectrometer (Thermo Nicolet Co., USA). The UV–Visible absorption was measured by a UV-1800 spectrophotometer (Shimadzu Co., Japan). The background of Pb2+ in real samples was measured by an AA240 atomic adsorption spectrometer (Varian Co., USA). Absorbance values were measured using a Synergy H1 hybrid multi-mode microplate reader (BioTek Instruments Inc., USA).

3.2. Preparation of Graphene/Fe3O4-AuNPs Composites

Based on Yuan et al.’s method [44], 4 mg of graphene oxide, 37.6 mg of glutamic acid, 69 mg of FeCl3·6H2O, and 8.3 mL of HAuCl4 (1%) were added into 7.5 mL ethylene glycol and mixed thoroughly. The pH of the mixture was adjusted to 10 with the addition of NaOH (1 mol/L). After sonicating for 2 h at room temperature, the solution was transferred to a Teflon lined autoclave in the next 12 h at 180 °C for the solvothermal reaction. After cooling to room temperature, the fabricated composite was adsorbed to the bottom by magnetic adsorption, the supernatant of the solution was discarded, and then ultrapure water was added and the solution sonicated for 5 min. The product was again adsorbed to the bottom by magnetic adsorption, the supernatant was discarded, and finally followed by repeated washing three times with ultrapure water and ethanol, respectively. Finally, the fabricated graphene/Fe3O4-AuNPs was kept in an oven for 6 h at 60 °C, then the dried composite was ground in an agate mortar into powders, and characterized by transmission electron microscopy (TEM) and X-ray diffraction (XRD).

3.3. Preparation of Amine Magnetic Beads

Amine magnetic beads were prepared by the one-step solvothermal reaction. Two grams of FeCl3·6H2O and 4 g of sodium acetate were mixed with 60 mL of ethylene glycol, and then 13 g of 1,6-ethylenediamine was added. The mixture was heated and stirred at 50 °C until the color of the solution turned yellow-brown, subsequently, the solution was transferred to a Teflon lined autoclave for 12 h at 198 °C. After cooling to room temperature, the magnetic beads were adsorbed to the bottom of the autoclave by magnetic adsorption, the supernatant was discarded, and then ultrapure water was added and the solution was sonicated for 5 min. The composite was adsorbed to the bottom by magnetic adsorption again, the supernatant was discarded, and followed by repeated washing three times with ultrapure water and ethanol, respectively. The fabricated product was kept in an oven at 50 °C; the dried amine magnetic beads were ground in an agate mortar into powders and characterized by TEM, FTIR, and XRD.

3.4. Streptavidin Coated Amine Magnetic Beads

A total of 5 mg of the fabricated amine magnetic beads were added into 5 mL of Tris-HCl buffer solution (10 mmol/L, pH 7.4) and sonicated for 30 min, and then 200 μL of 25% (v/v) glutaraldehyde was added in the solution and incubated in a shaker in the dark at 37 °C for 3 h. The solution was washed three times by phosphate buffer saline (PBS buffer) and dispersed in 4.5 mL of Tris-HCl buffer. A sample of 0.5 mL of 1 mg/mL streptavidin was added thereto and the solution was placed in a shaker in the dark at 4 °C for 12 h. After the reaction, the magnetic beads were adsorbed to the bottom by magnetic adsorption, the supernatant was discarded, and then Tris-HCl buffer was added and the solution was sonicated for 1 min before the supernatant was discarded again after magnetic adsorption of the product, followed by repeated washing three times with PBS buffer. The streptavidin coated amine magnetic beads were dissolved in 5 mL of Tris-HCl buffer (10 mmol/L, pH 7.4), kept in a refrigerator at 4 °C, and the coating process was verified by ultraviolet spectrophotometry.

3.5. Biotin-Labeled Aptamers Decorated on the Surface of Magnetic Beads

A total of 2.8 mL of the solution of the streptavidin-coated amine magnetic beads and 20 μL of the 10 μmol/L biotin-labeled aptamer were mixed in a 5 mL centrifuge tube and the mixture was incubated in a shaker at 37 °C for 30 min. After the reaction, the product was adsorbed to the bottom by magnetic adsorption, the supernatant was discarded, Tris-HCl buffer was added, the solution was sonicated for 1 min, and the supernatant was discarded after magnetic adsorption of the product, followed by repeated washing three times with PBS buffer. The aptamer modified magnetic beads were dissolved in 5 mL of Tris-HCl buffer (10 mmol/L, pH 7.4) and kept in a refrigerator in the dark at 4 °C.

3.6. Evaluation of the Specific Activity

The specific activity (SA) of graphene/Fe3O4/AuNPs, graphene/AuNPs, graphene/Fe3O4, and graphene were evaluated according to the protocol by Jiang et al. [49]. The specific activity of the enzyme mimics (units) was evaluated using the Equation as follows:
α = Δ A Δ t × V m × 1 ε l
where α is the specific activity of the enzyme mimics (U/mg); ΔA/Δt is the initial rate of change in absorbance (min−1); m is the amount of enzyme mimics (mg); V is the volume of reaction solution (μL); l is the optical path length through the reaction solution (cm); and ε is the molar absorption coefficient of TMB (39,000 M−1 cm−1 at 652 nm).
The experiments were performed at 37 °C, where 20 μL of 0.01 mg/mL solution of the four materials were added into 200 μL TMB solution respectively and mixed, and the absorbance value at 652 nm was measured at a 10 s interval within 5 min.

3.7. Detection Procedure of Lead Ion Standards Solution

The lead standard solution was diluted by gradient (1, 5,10, 50, 100, and 300 ng/mL), 500 μL of the diluted lead standard solution, 50 μL of 50 nmol/L complementary strand, and 50 μL of 1 mg/mL aptamer-decorated magnetic beads were mixed and heated at 95 °C for 10 min, and then reacted in a sharker at 37 °C. After the reaction, the magnetic beads were adsorbed to the bottom by magnetic adsorption, and then 100 μL of the supernatant was extracted and 100 μL of 1 mg/mL graphene/Fe3O4-AuNPs was added into the system before the solution was reacted in a shaker at 37 °C for 30 min. A total of 100 μL of color reaction solution (containing 1.25 mmol/L of TMB and 2.21 mmol/L of hydrogen peroxide) was added, reacted at room temperature for 5 min, and the absorbance of the solution at 652 nm was measured. All of the measurements were performed in triplicate.

3.8. Detection of Lead Ions in Real Samples

The proposed assay was used to test tap water for verification. The water samples were filtered with a 0.22 μm membrane. One, 10, 50, and 100 ng/mL of Pb2+ standard solution were added to the samples and detected by this assay under the optimal sensing conditions and graphite furnace atomic absorption spectrometry. For the atomic absorption spectrometry, microwave digestion was performed in sample pre-treatment, the calibration standards were prepared by serial dilution of lead reference solution, the pyrolysis temperature of 750 °C and atomization temperature of 2300 °C were employed, the absorption wavelength of 283.3 nm was selected, and the sampling volume of 20 µL was used for determination.

4. Conclusions

In summary, a colorimetric aptamer based method for the sensitive and selective detection of Pb2+ was developed and validated. In this system, Fe3O4NPs and AuNPs were grown on the graphene to form graphene/Fe3O4-AuNP composites, which served as an enzyme mimetic of peroxidase to catalyze a color reaction. The aptamer of Pb2+ was anchored on the amine magnetic beads. In the presence of lead ions, the complementary strands of the Pb2+ aptamer were adsorbed onto the surface of the nanozyme composites, inhibiting the catalytic activity and the color reaction. The concentration of target lead ions was inversely proportional to the color of the solution and A652 value. Pb2+ was detected in the range of 1–300 ng/mL with a low detection limit of 0.63 ng/mL. The results show the potential of this method for practical application in the detection of Pb2+, especially in on-site analysis.

Author Contributions

Data curation, Z.T. and Y.Z.; Formal analysis, Z.T. and N.D.; Funding acquisition, Z.W.; Methodology, Z.T. and Y.Z.; Supervision, Z.W.; Validation, Y.Z.; Writing—original draft, Z.T.; Writing—review & editing, N.D. and Z.W. All authors have read and agreed to the published version of the manuscript.

Funding

This work was partly funded by the National Natural Science Foundation of China (31871881); the Jiangsu Agriculture Science and Technology Innovation Fund (JASTIF) (CX (18) 2025); S&T Support Program of Jiangsu Province (BE2017623); the National First-class Discipline Program of Food Science and Technology (JUFSTR20180303); and the Distinguished Professor Program of Jiangsu Province.

Conflicts of Interest

The authors declare no conflict of interest.

References

  1. Gottesfeld, P. The lead battery: A growing global public health challenge. Am. J. Public Health 2017, 107, 1049. [Google Scholar] [CrossRef] [PubMed]
  2. Zahran, S.; Iverson, T.; McElmurry, S.P.; Weiler, S. The effect of leaded aviation gasoline on blood lead in children. J. Assoc. Environ. Resour. Econ. 2017, 4, 575–610. [Google Scholar] [CrossRef] [Green Version]
  3. Mariet, A.L.; Sarret, G.; Bégeot, C.; Walter-Simonnet, A.V.; Gimbert, F. Lead highly available in soils centuries after metallurgical activities. J. Environ. Qual. 2017, 46, 1236–1242. [Google Scholar] [CrossRef] [PubMed]
  4. Turner, A.; Lewis, M. Lead and other heavy metals in soils impacted by exterior legacy paint in residential areas of south west England. Sci. Total Environ. 2018, 619, 1206–1213. [Google Scholar] [CrossRef] [PubMed]
  5. Rather, I.A.; Koh, W.Y.; Paek, W.K.; Lim, J. The sources of chemical contaminants in food and their health implications. Front. Pharmacol. 2017, 8, 830. [Google Scholar] [CrossRef] [PubMed] [Green Version]
  6. Zhai, Q.; Narbad, A.; Chen, W. Dietary strategies for the treatment of cadmium and lead toxicity. Nutrients 2015, 7, 552–571. [Google Scholar] [CrossRef] [Green Version]
  7. Tóth, G.; Hermann, T.; Da Silva, M.R.; Montanarella, L. Heavy metals in agricultural soils of the European Union with implications for food safety. Environ. Int. 2016, 88, 299–309. [Google Scholar] [CrossRef]
  8. Carrington, C.D.; Sheehan, D.M.; Bolger, P.M. Hazard assessment of lead. Food Addit. Contam. 1993, 10, 325–335. [Google Scholar] [CrossRef]
  9. Hauptman, M.; Bruccoleri, R.; Woolf, A.D. An update on childhood lead poisoning. Clin. Pediatr. Emerg. Med. 2017, 18, 181–192. [Google Scholar] [CrossRef]
  10. Maloney, B.; Bayon, B.L.; Zawia, N.H.; Lahiri, D.K. Latent consequences of early-life lead (Pb) exposure and the future: Addressing the Pb crisis. NeuroToxicology 2018, 68, 126–132. [Google Scholar] [CrossRef]
  11. Jang, W.H.; Lim, K.M.; Kim, K.; Noh, J.Y.; Kang, S.; Chang, Y.K.; Chung, J.H. Low level of lead can induce phosphatidylserine exposure and erythrophagocytosis: A new mechanism underlying lead-associated anemia. Toxicol. Sci. 2011, 122, 177–184. [Google Scholar] [CrossRef] [PubMed] [Green Version]
  12. Vaziri, N.D.; Liang, K.; Ding, Y. Increased nitric oxide inactivation by reactive oxygen species in lead-induced hypertension. Kidney Int. 1999, 56, 1492–1498. [Google Scholar] [CrossRef] [PubMed] [Green Version]
  13. Leff, T.; Stemmer, P.; Tyrrell, J.; Jog, R. Diabetes and exposure to environmental lead (Pb). Toxics 2013, 6, 54. [Google Scholar] [CrossRef] [Green Version]
  14. Ren, J.; Cui, J.; Chen, Q.; Zhou, N.; Zhou, Z.; Zhang, G.H.; Cao, J. Low-level lead exposure is associated with aberrant sperm quality and reproductive hormone levels in Chinese male individuals: Results from the MARHCS study low-level lead exposure is associated with aberrant sperm quality. Chemosphere 2020, 244, 125402. [Google Scholar] [CrossRef] [PubMed]
  15. Drinking Water Requirements for States and Public Water. Available online: https://www.epa.gov/dwreginfo/drinking-water-regulations (accessed on 3 May 2020).
  16. Lead in Food, Foodwares, and Dietary Supplements. Available online: https://www.fda.gov/food/metals-and-your-food/lead-food-foodwares-and-dietary-supplements (accessed on 3 May 2020).
  17. Ettler, V.; Mihaljevič, M.; Komárek, M. ICP-MS measurements of lead isotopic ratios in soils heavily contaminated by lead smelting: Tracing the sources of pollution. Anal. Bioanal. Chem. 2004, 378, 311–317. [Google Scholar] [CrossRef]
  18. Candan, N.; Tuzmen, N. Very rapid quantification of malondialdehyde (MDA) in rat brain exposed to lead, aluminium and phenolic antioxidants by high-performance liquid chromatography-fluorescence detection. Neurotoxicology 2008, 29, 708–713. [Google Scholar] [CrossRef] [PubMed]
  19. de Oliveira, T.M.; Peres, J.A.; Felsner, M.L.; Justi, K.C. Direct determination of Pb in raw milk by graphite furnace atomic absorption spectrometry (GF AAS) with electrothermal atomization sampling from slurries. Food Chem. 2017, 229, 721–725. [Google Scholar] [CrossRef]
  20. Bansod, B.; Kumar, T.; Thakur, R.; Rana, S.; Singh, I. A review on various electrochemical techniques for heavy metal ions detection with different sensing platforms. Biosens. Bioelectron. 2017, 94, 443–455. [Google Scholar] [CrossRef]
  21. Gherase, M.R.; Feng, R.; Fleming, D.E. Optimization of L-shell X-ray fluorescence detection of lead in bone phantoms using synchrotron radiation. X-ray Spectrom. 2017, 46, 537–547. [Google Scholar] [CrossRef]
  22. Dolati, S.; Ramezani, M.; Abnous, K.; Taghdisi, S.M. Recent nucleic acid based biosensors for Pb2+ detection. Sens. Actuators B Chem. 2017, 246, 864–878. [Google Scholar] [CrossRef]
  23. Boruah, B.S.; Biswas, R. Localized surface plasmon resonance based U-shaped optical fiber probe for the detection of Pb2+ in aqueous medium. Sens. Actuators B Chem. 2018, 276, 89–94. [Google Scholar] [CrossRef]
  24. Xiong, C.; Liang, W.; Wang, H.; Zheng, Y.; Zhuo, Y.; Chai, Y.; Yuan, R. In situ electro-polymerization of nitrogen doped carbon dots and their application in an electrochemiluminescence biosensor for the detection of intracellular lead ions. Chem. Commun. 2016, 52, 5589–5592. [Google Scholar] [CrossRef] [PubMed]
  25. Chaiyo, S.; Apiluk, A.; Siangproh, W.; Chailapakul, O. High sensitivity and specificity simultaneous determination of lead, cadmium and copper using μPAD with dual electrochemical and colorimetric detection. Sens. Actuators B Chem. 2016, 233, 540–549. [Google Scholar] [CrossRef]
  26. Farzin, L.; Shamsipur, M.; Sheibani, S.A. Review: Aptamer-based analytical strategies using the nanomaterials for environmental and human monitoring of toxic heavy metals. Talanta 2017, 174, 619–627. [Google Scholar] [CrossRef] [PubMed]
  27. Šmuc, T.; Ahn, I.Y.; Ulrich, H. Nucleic acid aptamers as high affinity ligands in biotechnology and biosensorics. J. Pharm. Biomed. Anal. 2013, 81, 210–217. [Google Scholar] [CrossRef]
  28. Hermann, T.; Patel, D.J. Adaptive recognition by nucleic acid aptamers. Science 2000, 287, 820–825. [Google Scholar] [CrossRef] [Green Version]
  29. Chen, A.; Yang, S. Replacing antibodies with aptamers in lateral flow immunoassay. Biosens. Bioelectron. 2015, 71, 230–242. [Google Scholar] [CrossRef]
  30. Jiang, Y.; Shi, M.; Liu, Y.; Wan, S.; Cui, C.; Zhang, L.; Tan, W. Aptamer/AuNP biosensor for colorimetric profiling of exosomal proteins. Angew. Chem. Int. Ed. 2017, 56, 11916–11920. [Google Scholar] [CrossRef]
  31. Schoukroun-Barnes, L.R.; Macazo, F.C.; Gutierrez, B.; Lottermoser, J.; Liu, J.; White, R.J. Reagentless, structure-switching, electrochemical aptamer-based sensors. Annu. Rev. Anal. Chem. 2016, 9, 163–181. [Google Scholar] [CrossRef] [Green Version]
  32. Jepsen, M.D.; Sparvath, S.M.; Nielsen, T.B.; Langvad, A.H.; Grossi, G.; Gothelf, K.V.; Andersen, E.S. Development of a genetically encodable FRET system using fluorescent RNA aptamers. Nat. Commun. 2018, 9, 18. [Google Scholar] [CrossRef]
  33. Yang, B.; Li, J.; Deng, H.; Zhang, L. Progress of mimetic enzymes and their applications in chemical sensors. Crit. Rev. Anal. Chem. 2016, 46, 469–481. [Google Scholar] [CrossRef] [PubMed]
  34. Misson, M.; Zhang, H.; Jin, B. Nanobiocatalyst advancements and bioprocessing applications. J. R. Soc. Interface 2015, 12, 20140891. [Google Scholar] [CrossRef] [PubMed] [Green Version]
  35. Sun, H.; Zhou, Y.; Ren, J.; Qu, X. Carbon nanozymes: Enzymatic properties, catalytic mechanism, and applications. Angew. Chem. Int. Ed. 2018, 57, 9224–9237. [Google Scholar] [CrossRef]
  36. Jin, S.; Wu, C.; Ye, Z.; Ying, Y. Designed inorganic nanomaterials for intrinsic peroxidase mimics: A review. Sens. Actuators B Chem. 2019, 283, 18–34. [Google Scholar] [CrossRef]
  37. Duan, D.; Fan, K.; Zhang, D.; Tan, S.; Liang, M.; Liu, Y.; Kobinger, G.P. Nanozyme-strip for rapid local diagnosis of Ebola. Biosens. Bioelectron. 2015, 74, 134–141. [Google Scholar] [CrossRef] [PubMed]
  38. Wang, K.Y.; Bu, S.J.; Ju, C.J.; Li, C.T.; Li, Z.Y.; Han, Y.; Wan, J.Y. Hemin-incorporated nanoflowers as enzyme mimics for colorimetric detection of foodborne pathogenic bacteria. Bioorg. Med. Chem. Lett. 2018, 28, 3802–3807. [Google Scholar] [CrossRef]
  39. Wang, X.; Qin, L.; Zhou, M.; Lou, Z.; Wei, H. Nanozyme sensor arrays for detecting versatile analytes from small molecules to proteins and cells. Anal. Chem. 2018, 90, 11696–11702. [Google Scholar] [CrossRef]
  40. Nirala, N.R.; Abraham, S.; Kumar, V.; Bansal, A.; Srivastava, A.; Saxena, P.S. Colorimetric detection of cholesterol based on highly efficient peroxidase mimetic activity of graphene quantum dots. Sens. Actuators B Chem. 2015, 218, 42–50. [Google Scholar] [CrossRef]
  41. Zheng, A.X.; Cong, Z.X.; Wang, J.R.; Li, J.; Yang, H.H.; Chen, G.N. Highly-efficient peroxidase-like catalytic activity of graphene dots for biosensing. Biosens. Bioelectron. 2013, 49, 519–524. [Google Scholar] [CrossRef]
  42. Garg, B.; Bisht, T.; Ling, Y.C. Graphene-based nanomaterials as efficient peroxidase mimetic catalysts for biosensing applications: An overview. Molecules 2015, 20, 14155–14190. [Google Scholar] [CrossRef] [Green Version]
  43. Liu, M.; Zhao, H.; Chen, S.; Yu, H.; Quan, X. Interface engineering catalytic graphene for smart colorimetric biosensing. ACS Nano 2012, 6, 3142–3151. [Google Scholar] [CrossRef] [PubMed]
  44. Yuan, F.; Zhao, H.; Zang, H.; Ye, F.; Quan, X. Three-dimensional graphene supported bimetallic nanocomposites with DNA regulated-flexibly switchable peroxidase-like activity. ACS Appl. Mater. Interfaces 2016, 8, 9855–9864. [Google Scholar] [CrossRef] [PubMed]
  45. Hwang, J.H.; Wang, X.; Zhao, D.; Rex, M.M.; Cho, H.J.; Lee, W.H. A novel nanoporous bismuth electrode sensor for in situ heavy metal detection. Electrochim. Acta 2019, 298, 440–448. [Google Scholar] [CrossRef]
  46. Satarpai, T.; Shiowatana, J.; Siripinyanond, A. Paper-based analytical device for sampling, on-site preconcentration and detection of ppb lead in water. Talanta 2016, 154, 504–510. [Google Scholar] [CrossRef] [PubMed]
  47. Yukird, J.; Kongsittikul, P.; Qin, J.; Chailapakul, O.; Rodthongkum, N. ZnO@ graphene nanocomposite modified electrode for sensitive and simultaneous detection of Cd (II) and Pb (II). Synth. Met. 2018, 245, 251–259. [Google Scholar] [CrossRef]
  48. Li, T.; Dong, S.; Wang, E. A lead (II)-driven DNA molecular device for turn-on fluorescence detection of lead (II) ion with high selectivity and sensitivity. J. Am. Chem. Soc. 2010, 132, 13156–13157. [Google Scholar] [CrossRef]
  49. Jiang, B.; Duan, D.; Gao, L.; Zhou, M.; Fan, K.; Tang, Y.; Xie, N. Standardized assays for determining the catalytic activity and kinetics of peroxidase-like nanozymes. Nat. Protoc. 2018, 13, 1506–1520. [Google Scholar] [CrossRef]
Figure 1. Principle of the detection of Pb2+ in this assay.
Catalysts 10 00600 g001
Figure 2. Transmission electron microscope (TEM) image (a) and x-ray diffraction (XRD) patterns (b) of graphene/Fe3O4−AuNPs.
Catalysts 10 00600 g002
Figure 3. TEM image (a), Fourier transform infrared (FTIR) spectra (b), and XRD pattern (c) of amine magnetic beads.
Catalysts 10 00600 g003
Figure 4. UV–Vis absorption spectra of the supernatants after the incubation of magnetic beads and streptavidin.
Catalysts 10 00600 g004
Figure 5. The time–absorbance curve of the 3,3′,5,5′-Tetramethylbenzidine (TMB) chromogenic reaction catalyzed by graphene/Fe3O4/AuNPs, graphene/AuNPs, graphene/Fe3O4, and graphene in 5 min (A). The calibration curve of the first 60 s of the reaction, the specific activities (SA) of graphene/Fe3O4/AuNPs, graphene/AuNPs, graphene/Fe3O4, and graphene were calculated (B).
Catalysts 10 00600 g005
Figure 6. Optimization of the concentration of complementary strands. Measurements were performed in triplicate.
Catalysts 10 00600 g006
Figure 7. Optimization of the concentration of magnetic beads. Measurements were performed in triplicate.
Catalysts 10 00600 g007
Figure 8. The linear relationship between the concentration of Pb2+ and A652 value. Measurements were performed in triplicate.
Catalysts 10 00600 g008
Figure 9. Specificity evaluation of the proposed method. Measurements were performed in triplicate.
Catalysts 10 00600 g009
Table 1. Comparison of different methods for lead ions.
Detection Method LOD
(ng/mL)
Linear Range
(ng/mL)
Reference
Surface plasmon resonance based fiber probe1.21–20 [23]
Carbon dots based electrochemical sensor0.331–1375 [24]
Microfluidic paper-based sensor0.10.5–70[25]
Nanoporous bismuth electrode sensor1.55–40[45]
Paper-based analytical device1010–100[46]
ZnO@graphene modified electrode0.810–200[47]
Aptamer based colorimetric assay0.631–300this work
Table 2. Detection and recovery results of lead in tap water samples by the developed method (n = 5).
Spiked SamplesAdded
(ng/mL)
Found
(ng/mL)
(Graphite Furnace Method)
Found
(ng/mL)
(This Method)
Spike Recovery (%)
111.031 ± 0.0241.06 ± 0.032106.0
21010.41 ± 0.3310.58 ± 0.25105.8
35048.76 ± 1.0147.63 ± 1.1795.3
4200208.5 ± 5.57206.6 ± 4.08103.3

