Photocatalytic Degradation of Chlorpyrifos with Mn-WO3/SnS2 Heterostructure


Department of Chemical Sciences, University of Johannesburg, Doornfontein Campus, P.O. Box 17011, Doornfontein, Johannesburg 2028, South Africa
*
Author to whom correspondence should be addressed.
Catalysts 2020, 10(6), 699; https://0-doi-org.brum.beds.ac.uk/10.3390/catal10060699
Submission received: 21 May 2020
/
Revised: 3 June 2020
/
Accepted: 4 June 2020
/
Published: 21 June 2020
(This article belongs to the Special Issue Materials and Processes for Photocatalytic and (Photo)Electrocatalytic Removal of Bio-Refractory Pollutants and Emerging Contaminants from Waters)
Abstract
:Tungsten trioxide (WO3) is a photocatalyst that has gained interest amongst researchers because of its non-toxicity, narrow band gap and superior charge transport. Due to its fast charge recombination, modification is vital to counteract this limitation. In this paper, we report on the fabrication of Mn-doped WO3/SnS2 nanoparticles, which were synthesised with the aim of minimising the recombination rates of the photogenerated species. The nanomaterials were characterised using spectroscopic techniques (UV-Vis-diffuse reflectance spectroscopy (DRS), Raman, XRD, photoluminescence (PL) and electrochemical impedance spectroscopy (EIS)) together with microscopic techniques (FESEM-EDS and high resolution transmission electron microscopy selected area electron diffraction (HRTEM-SAED)) to confirm the successful formation of Mn-WO3/SnS2 nanoparticles. The Mn-doped WO3/SnS2 composite was a mixture of monoclinic and hexagonal phases, confirmed by XRD and Raman analysis. The Mn-WO3/SnS2 heterojunction showed enhanced optical properties compared to those of the un-doped WO3/SnS2 nanoparticles, which confirms the successful charge separation. The Brunauer–Emmett–Teller (BET) analysis indicated that the nanoparticles were mesoporous as they exhibited a Type IV isotherm. These nanomaterials appeared as a mixture of rectangular rods and sheet-like shapes with an increased surface area (77.14 m2/g) and pore volume (0.0641 cm3/g). The electrochemical measurements indicated a high current density (0.030 mA/cm2) and low charge transfer resistance (157.16 Ω) of the Mn-WO3/SnS2 heterojunction, which infers a high charge separation, also complemented by photoluminescence with low emission peak intensity. The Mott–Schottky (M-S) plot indicated a positive slope characteristic of an n–n heterojunction semiconductor, indicating that electrons are the major charge carriers. Thus, the efficiency of Mn-WO3/SnS2 heterojunction photocatalyst was monitored for the degradation of chlorpyrifos. The effects of pH (3–9), catalyst loading (0.1–2 g) and initial chlorpyrifos concentration (100 ppb–20 ppm) were studied. It was observed that the degradation was purely due to photocatalysis, as no loss of chlorpyrifos was observed within 30 min in the dark. Chlorpyrifos removal using Mn-WO3/SnS2 was performed at the optimum conditions of pH = 7, catalyst loading = 1 g and chlorpyrifos concentration = 1000 ppb in 90 min. The complete degradation of chlorpyrifos and its major degradation by-product 3,5,6-trichloropyridin-2-ol (TCP) was achieved. Kinetic studies deduced a second order reaction at 209 × 10−3 M−1s−1.
1. Introduction
The fabrication and modification of photocatalysts has sparked interest amongst researchers due to their wide applications. Photocatalysts are used in applications ranging from water splitting, the degradation of pollutants in water, gas sensing and optoelectronic devices [1]. These can be n-type (electrons are the major charge carriers) or p-type (holes are the major charge carriers) photocatalysts [2]. The most widely studied photocatalysts are TiO2, WO3 (n-type) and ZnO, CdS (p-type) [3,4]. The photocatalytic efficiency of these materials is limited to a certain extent, primarily due to two major limitations. Firstly, they are prone to fast electron–hole recombination, which reduces the photocatalytic reactivity of the semiconductor. Secondly, they have wide band gaps that absorb only in the ultraviolet (UV) region, which accounts for 4% of the solar spectrum [5].
Modifications of photocatalysts to suit specific applications have been proposed. These include the use of metal dopants to form Schottky barriers and fusion with other semiconductor photocatalysts, resulting in heterojunctions [2]. The metal dopants that have been employed include magnesium (Mg), manganese (Mn), copper (Cu) and yttrium (Y) [6,7,8,9]. The metal doping of photocatalysts results in shifting the absorption band edge of the material to absorb the readily available visible region of the solar spectrum. They also separate photogenerated charges by forming electron traps, although a high concentration of the metal dopant may result in the creation of recombination centres, which leads to an increased recombination rate.
Heterojunctions that have shown enhanced optical and photocatalytic properties include BiVO4/WO3, CdS/ZnO and TiO2/SnO2 [10,11,12,13]. The formation of Type II heterojunctions using two different photocatalysts is sufficient to reduce the recombination rate of photogenerated charges. This occurs by the accumulation of photoexcited electrons in the conduction band (CB) of one semiconductor while photogenerated holes accumulate in the valence band (VB) of another semiconductor in the heterojunction system, which effectively leads to charge separation. Therefore, photo-oxidation and photo-reduction occur in different semiconductor surfaces of the heterojunction system due to the different migration points of the charges [14].
Tungsten trioxide (WO3) is a visible light photocatalyst with a band gap energy of 2.5–2.8 eV [15]. It is classified as an n-type semiconductor, wherein electrons are the major carriers. Due to its narrow band gap, WO3 absorbs light radiation in the visible range, and it has been used in a wide range of applications such as fuel production and combating water pollution [16,17]. This semiconductor exists in different polymorphs, which include monoclinic, triclinic, tetragonal and orthorhombic. The monoclinic phase of WO3 is the most stable and most photocatalytic compared to all the other phases.
Like most photocatalysts, WO3 suffers from limitations such as high electron–hole charge recombination. To overcome the intrinsic limitation of pristine WO3, different methods have been used, including metal doping and loading another semiconductor photocatalyst to form a heterojunction [10,18,19].
We, however, report the synthesis and characterisation of a material that fuses metal doping and a heterojunction (Mn-WO3/SnS2) that exhibits improved optical properties and minimises electron–hole recombination compared to current photocatalysts. Owing to the charge mobility in SnS2 to efficiently facilitate electron transfer to the WO3 CB, there results a high number of electrons for the oxidation reaction and separated holes that accumulate on the VB of SnS2. The Mn2+ ions also separate charges by trapping electrons in the WO3, thereby increasing their lifetime, and act as reaction centres. This photocatalyst can be applied in water remediation, energy production and sensing. Thus, this study assessed the photo-efficiency of the heterostructure in the photodegradation of chlorpyrifos, an organophosphate pesticide.
Organophosphate pesticides have been used extensively in South Africa and the world at large due to their ability to combat a vast spectrum of pests [20,21]. Chlorpyrifos (O,O-diethyl O-[3,5,6, -trichloro-2-pyridyl] phosphorothionate) (CPF) is an organophosphorus pesticide extensively used in agricultural and domestic applications [22]. Chlorpyrifos agricultural application occurs throughout the year for a variety of fruits and vegetables [23]. It, however, does not readily dissolve in water, yet adsorbs strongly to soil particles.
Chlorpyrifos is an enzyme acetylcholinesterase inhibitor and persistent pesticide pollutant. It is a class II (moderately hazardous pesticide) pollutant, with a half-life of 60 days [24]. The pesticide is toxic to humans and other animals when ingested or inhaled; this is attributed to its lipophilic nature. It causes delayed peripheral neuropathy in humans and badly affect neuro-development in children at high doses [25,26].
Due to the numerous human and environmental effects caused by chlorpyrifos, different ways to remove this pesticide from the environment have been studied. These include advanced oxidation processes and biological treatment (with fungal and bacterial strains).
Bacterial strains have displayed high chlorpyrifos removal from water of up to 98% [27]. Though it is efficient, the method is strenuous, as bacteria require controlled specific conditions such as pH and temperature and a host for optimal function. On the other hand, Ismail et al. [24] in 2013 reported the use of advanced oxidation processes (AOPs) that yield 100% removal of chlorpyrifos by using 60Co γ-rays of 30–575 Gy [24].
However, γ-rays are harmful to human health; therefore, this led to the implementation of a better and safer method requiring the use of a photocatalyst to degrade chlorpyrifos under light irradiation. To date, zinc and titanium oxides have been used to degrade chlorpyrifos. The results were satisfactory, with up to 95% chlorpyrifos removal for TiO2 and 85% for ZnO under UV light [28]. However, the photocatalysts suffer from charge recombination and the use of UV light is not viable due to the insufficient amount of UV available (4%). Therefore, visible light-absorbing photocatalysts were discovered such as BiVO2, SnS2 and WO3.
To the best of our knowledge, no work has been reported to date on the fabrication of a metal-doped heterojunction (Mn-WO3/SnS2) photocatalyst.
2. Results and Discussion
2.1. X-ray Diffraction and Raman Analyses
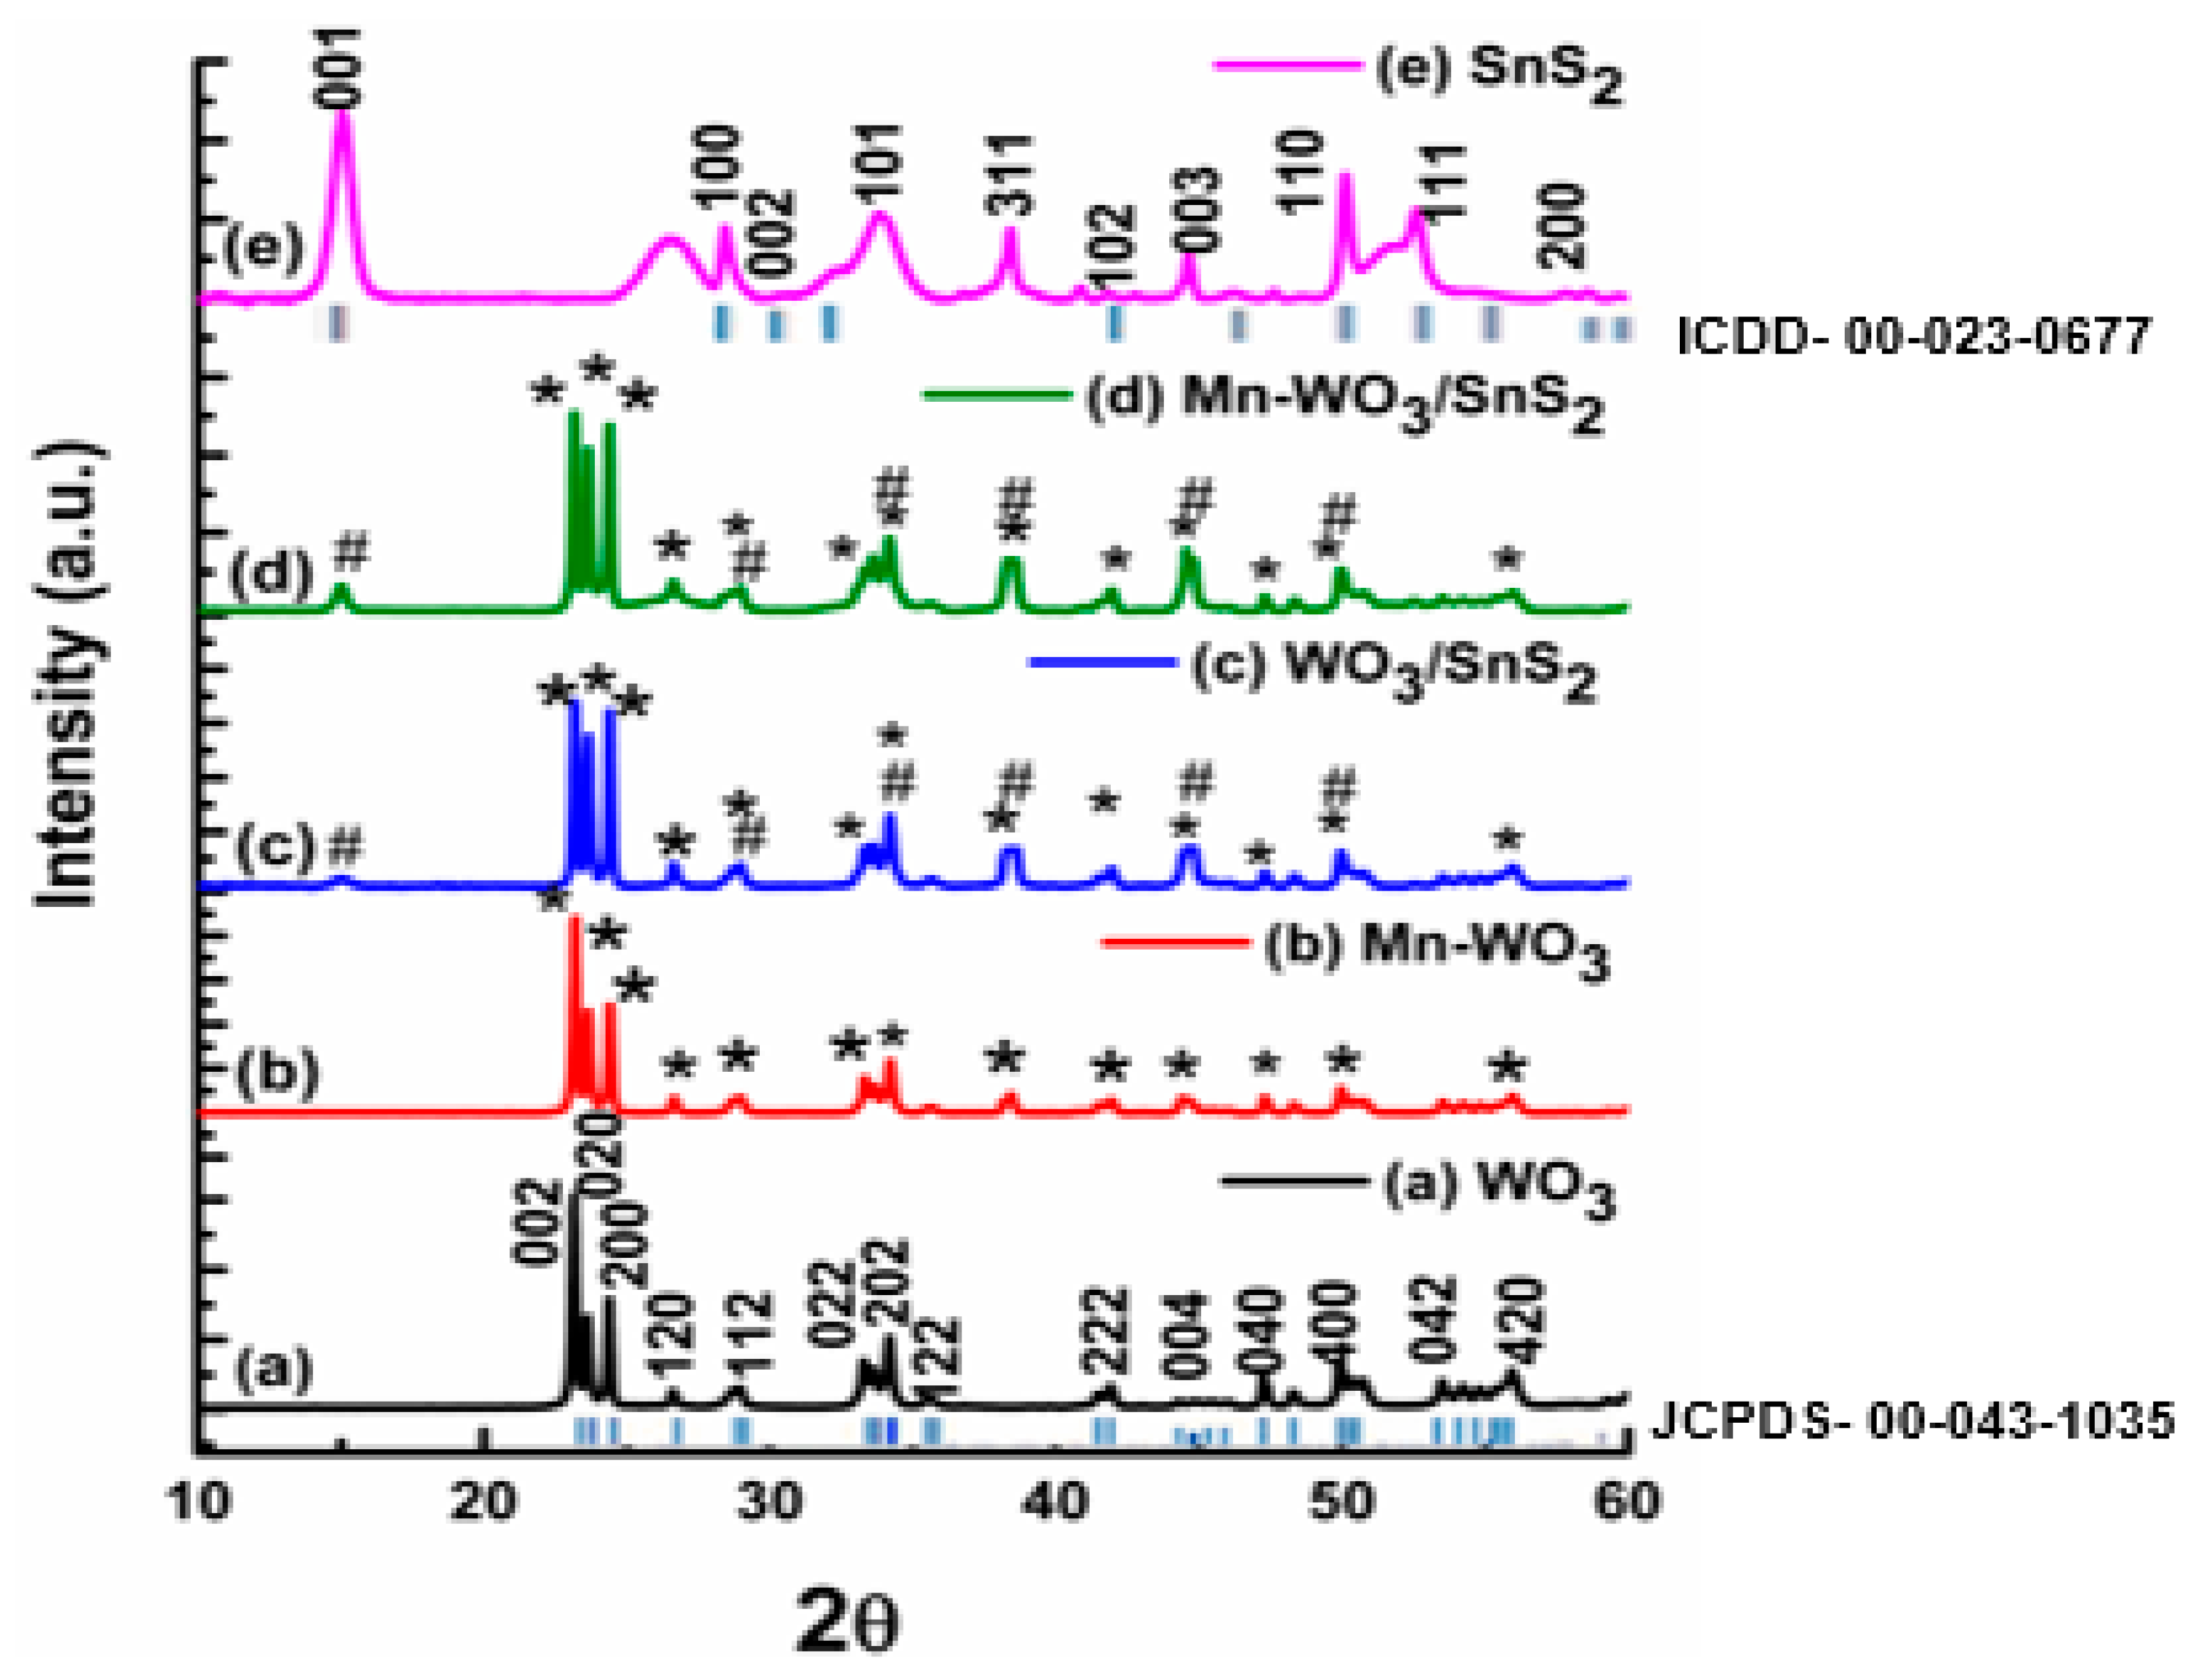
The phase and crystallographic properties of the nanomaterials were elucidated using XRD and Raman spectroscopy. Figure 1a shows the XRD pattern of WO3, which confirms the monoclinic nature of the WO3 (m-WO3). The m-WO3 was indexed and matched to the miller indices (002), (020), (200), (120), (112), (022), (202), (122), (222), (004), (040), (400), (042) and (420) (JCPDS Card No. 00-043-1035). Doping the m-WO3 with Mn2+ did not distort the phase of the WO3, which implies that it had been intrinsically inserted into the WO3 crystal lattice as depicted in Figure 1b. The XRD pattern of the WO3/SnS2 heterojunction showed the presence of both monoclinic (m-WO3) and hexagonal (h-WO3) phases, and the hexagonal phase of SnS2 could be indexed (JCPDS Card No. 00-023-0677), as shown in Figure 1c. Again, the structural integrity of the manganese-doped WO3/SnS2 heterojunction (Figure 1d) was not distorted by the incorporation of Mn2+ in the system. The average crystallite sizes of the nanomaterials were determined using the Debye–Scherrer equation and are tabulated in Table S1, all with an average size of 40 nm, with SnS2 having a crystallite size of less than 20 nm.
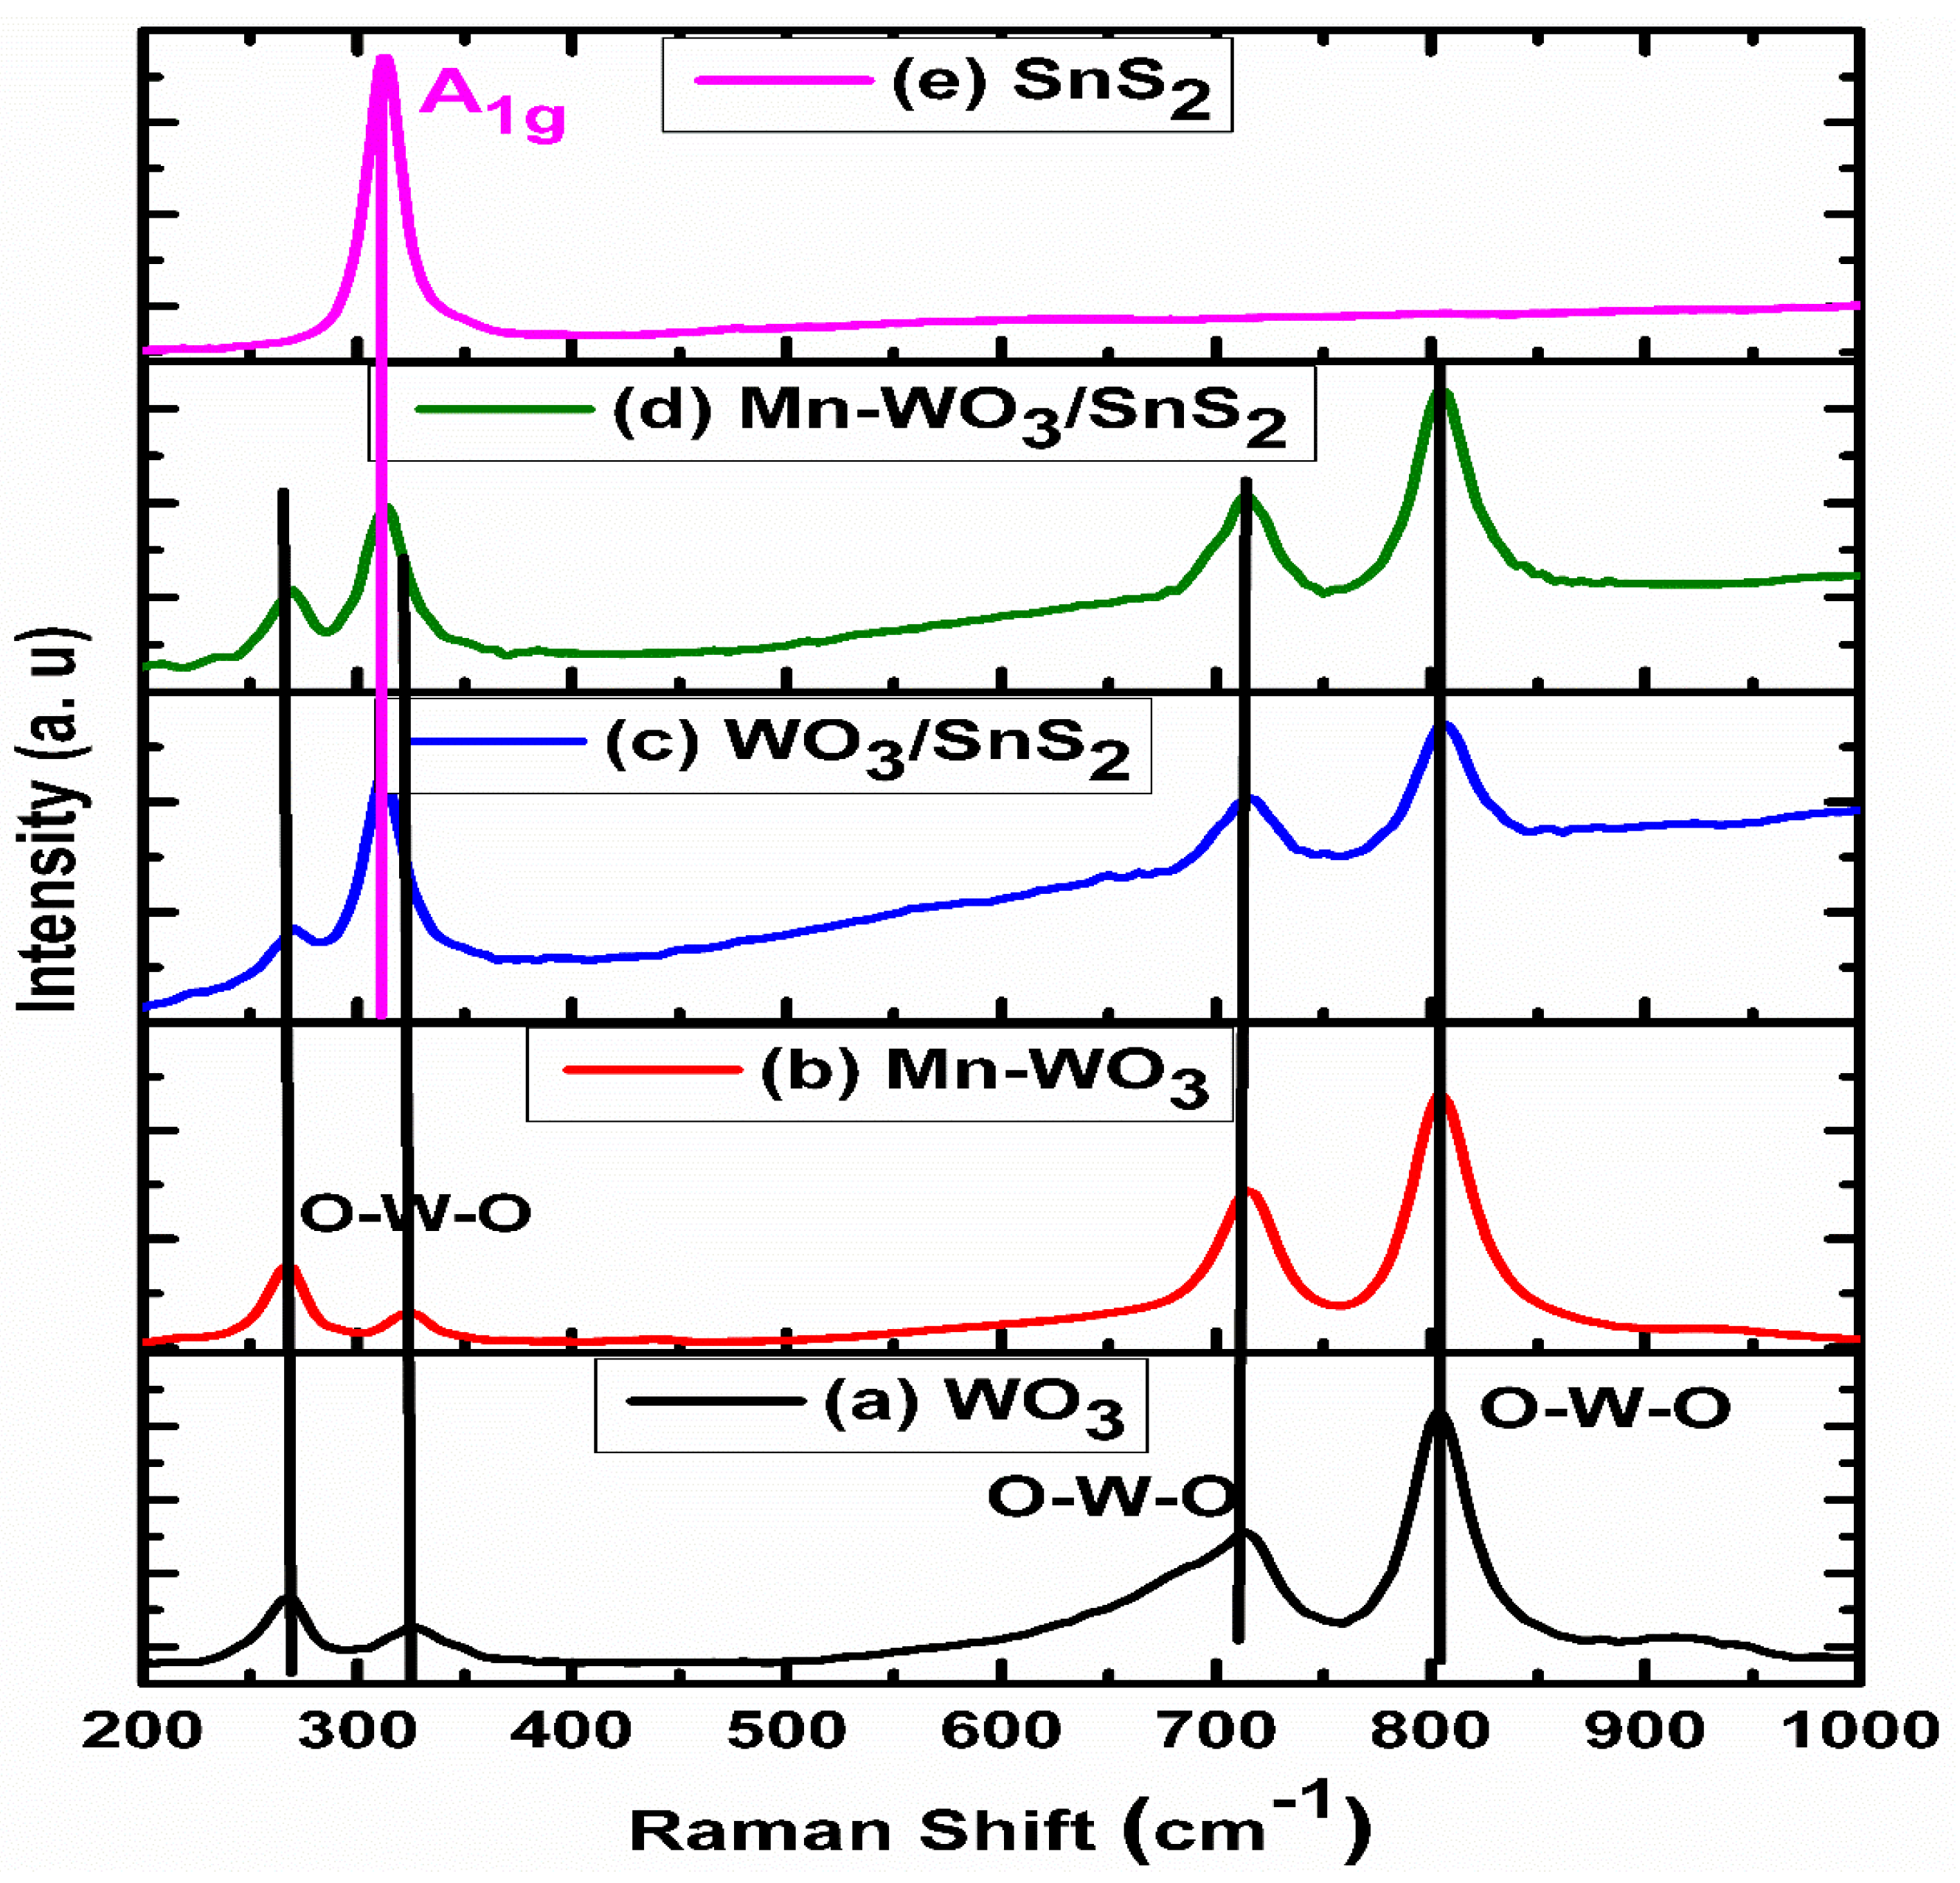
The nature of the phases was further confirmed with Raman analysis. Figure 2a illustrates Raman bands at 717 and 818 cm−1 and less intense bands at 212 and 313 cm−1 corresponding to O-W-O stretching and bending in the molecule, respectively, which confirms a monoclinic WO3; this finding was also reported by Simelane et al. 2017 and Xie et al. 2012 [3,15]. As in XRD analyses, the doping of Mn2+ had no effect on the phase of WO3, as depicted in Figure 2b. No secondary bands resulting from Mn-oxides were observed. The heterojunction (WO3/SnS2) was successfully formed and confirmed by the Raman band at 317 cm−1 corresponding to the A1g mode of hexagonal phase SnS2 as observed by Ma et al. 2015 (Figure 2c) [29]. Figure 2d displays the Raman band of Mn-WO3/SnS2 with no distortion due to Mn2+ and SnS2. Therefore, the Raman band in Figure 2e corresponds to the pristine hexagonal phase of SnS2 due to the A1g band at 317 cm−1.
2.2. Morphological Studies
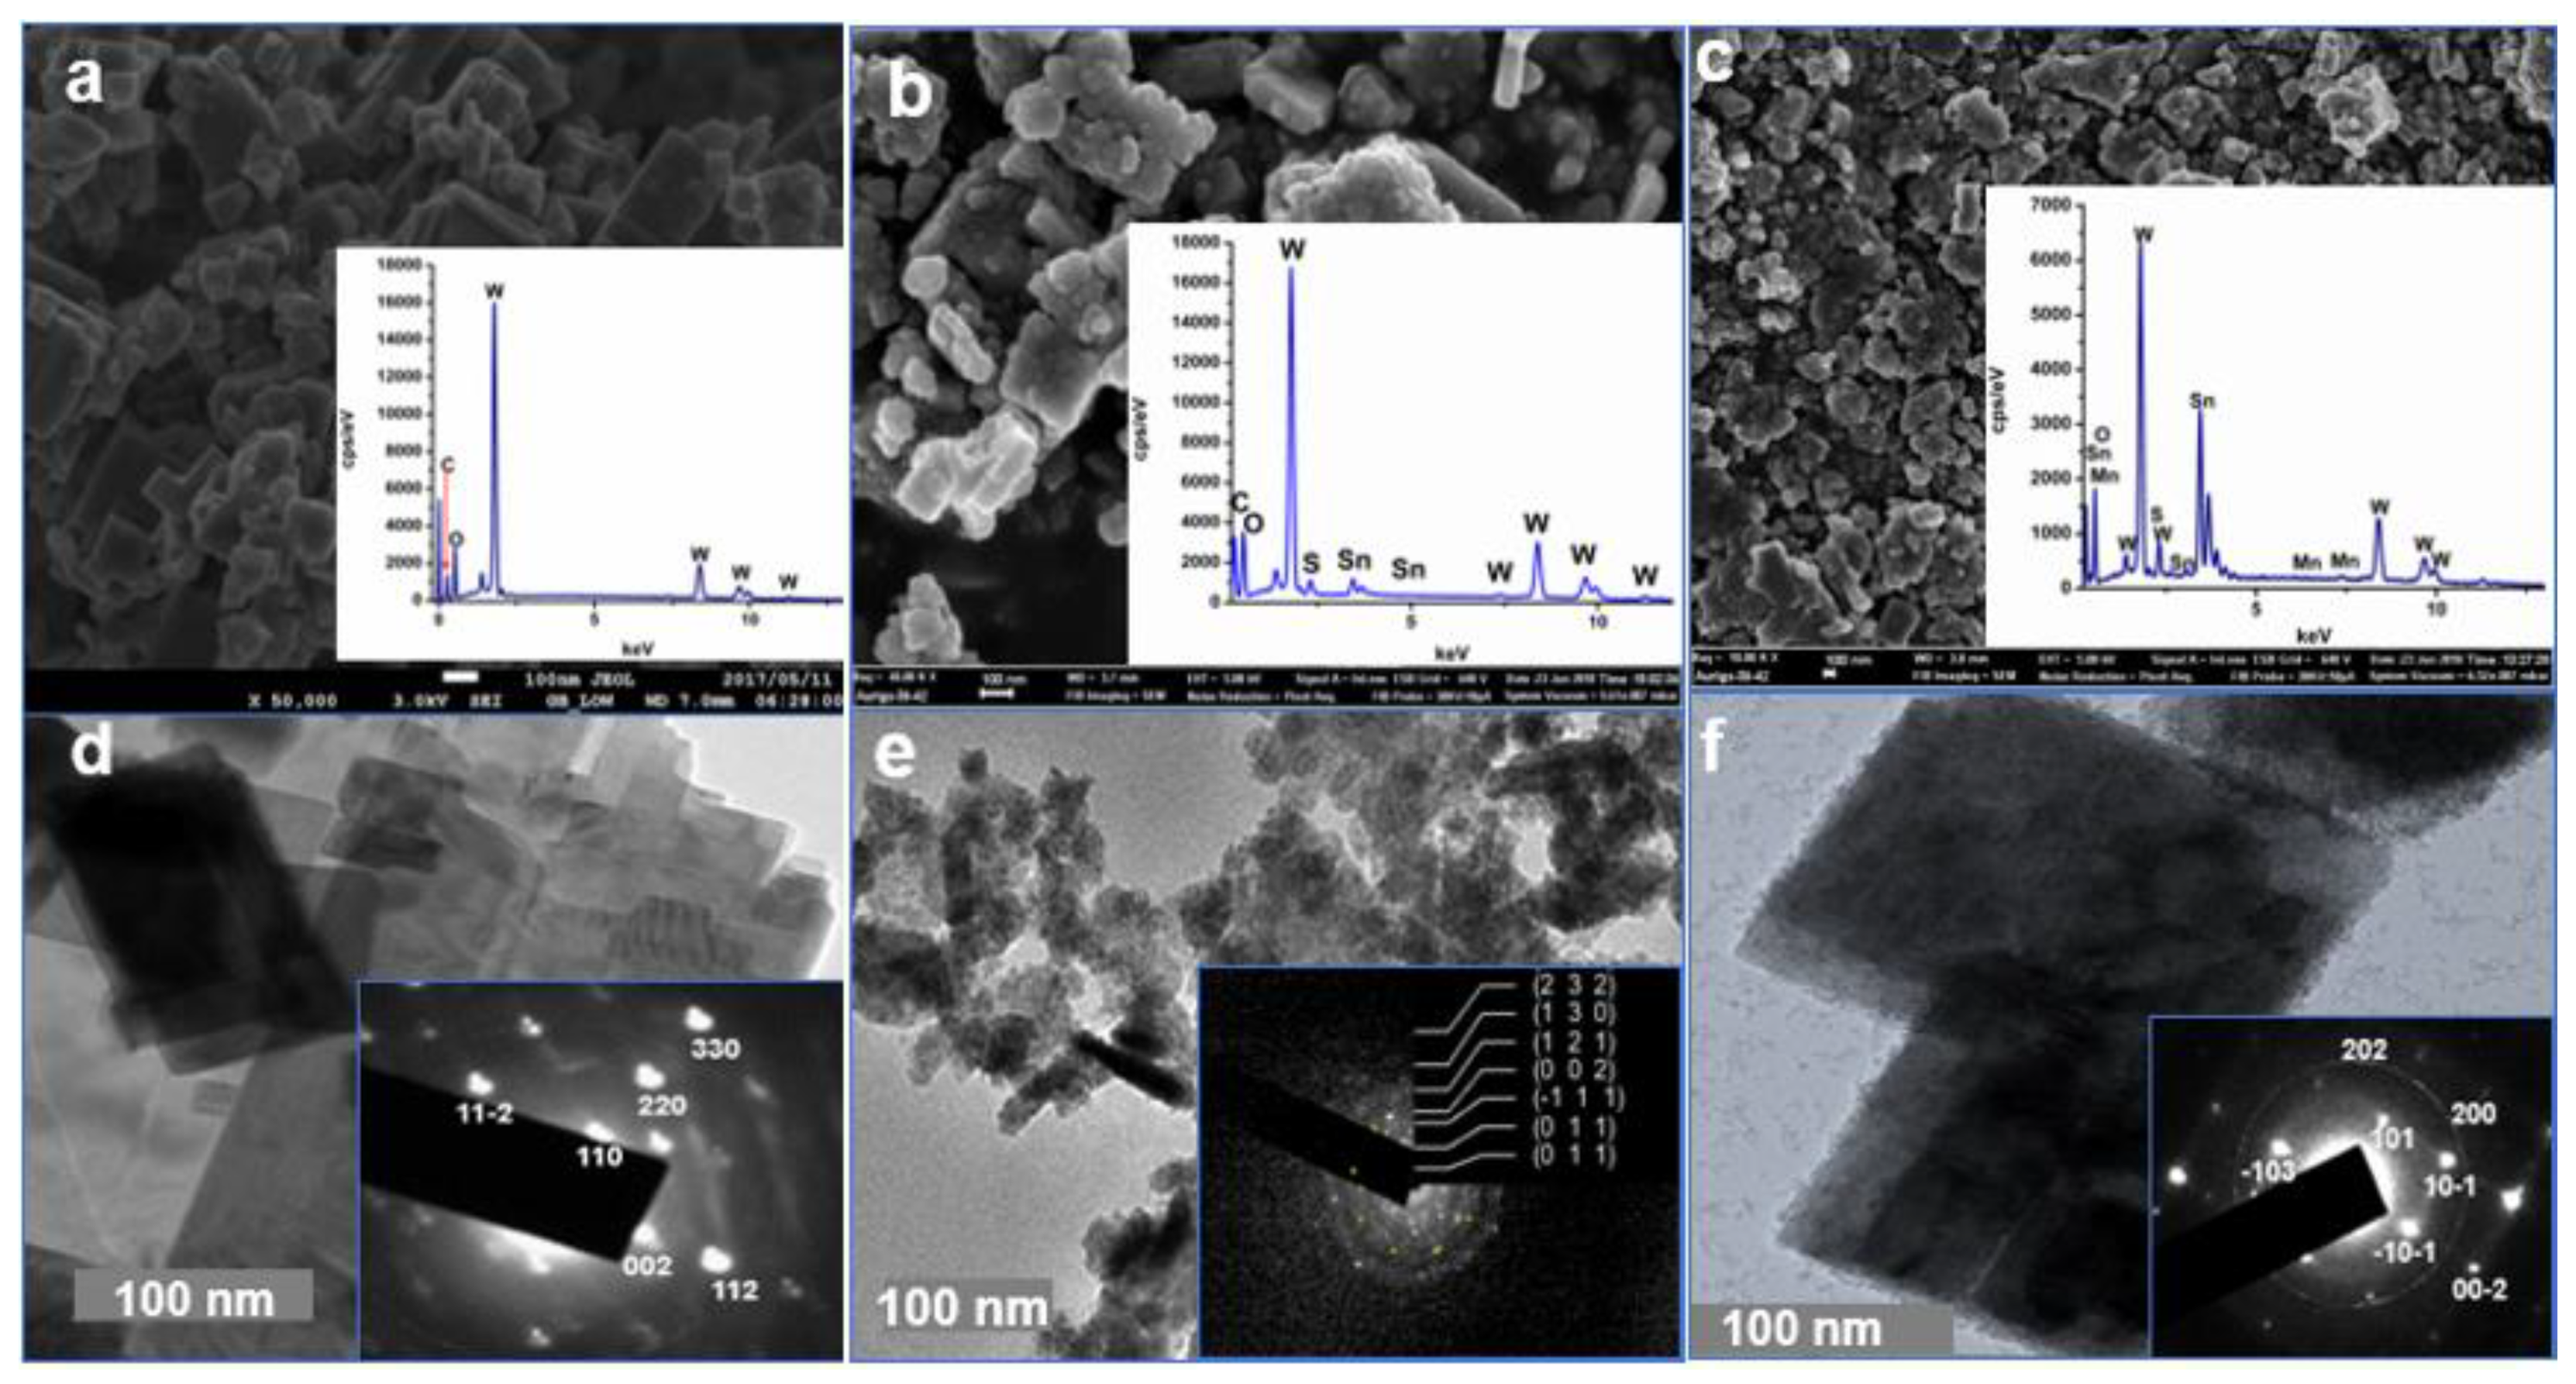
The morphological studies were conducted using microscopic techniques such as FESEM and HRTEM. Figure 3a is the FESEM image of pristine m-WO3 with rectangular sheets, rods and cubes, and the composition was confirmed by EDX (inset). The shapes of the nanomaterials did not change upon the insertion of Mn2+ or the formation of the heterojunction as illustrated in Figure 3b,c and Figures S2 and S3. The EDX spectra displayed the elemental composition of the respective heterojunctions (WO3/SnS2) and Mn-WO3/SnS2 (inset).
The HRTEM image of m-WO3 also showed rectangular sheets and rods (Figure 3d) and was further elucidated using SAED (inset) obtained through a 1–10 zone axis. The spots were indexed to (002), (220) and (112) corresponding to monoclinic WO3 as confirmed by XRD analysis. The HRTEM images (Figure 3e,f) displayed rectangular rods and sheet-like shapes as observed in Figure 3d, which implies that no shape distortion had occurred through metal doping and the formation of the heterojunction. The SAED image (inset) displays spots and rings characteristic of monoclinic WO3 and the SnS2 hexagonal phase, respectively. Furthermore, the SAED image (inset) illustrates spot (202, 200) and ring (101, −103) indices corresponding to the WO3 monoclinic phase and SnS2 hexagonal phase, respectively, captured through a 0–10 zone axis using the CrysTBox software [30] (Figure 3f). All the SAED indices correspond to the reported XRD patterns, which further confirms the successful formation of our nanomaterial. In the Mn-WO3/SnS2, the estimated percentage of Mn was 2.5%, with 47.5% of WO3 and 50% of SnS2.
2.3. Optical Properties
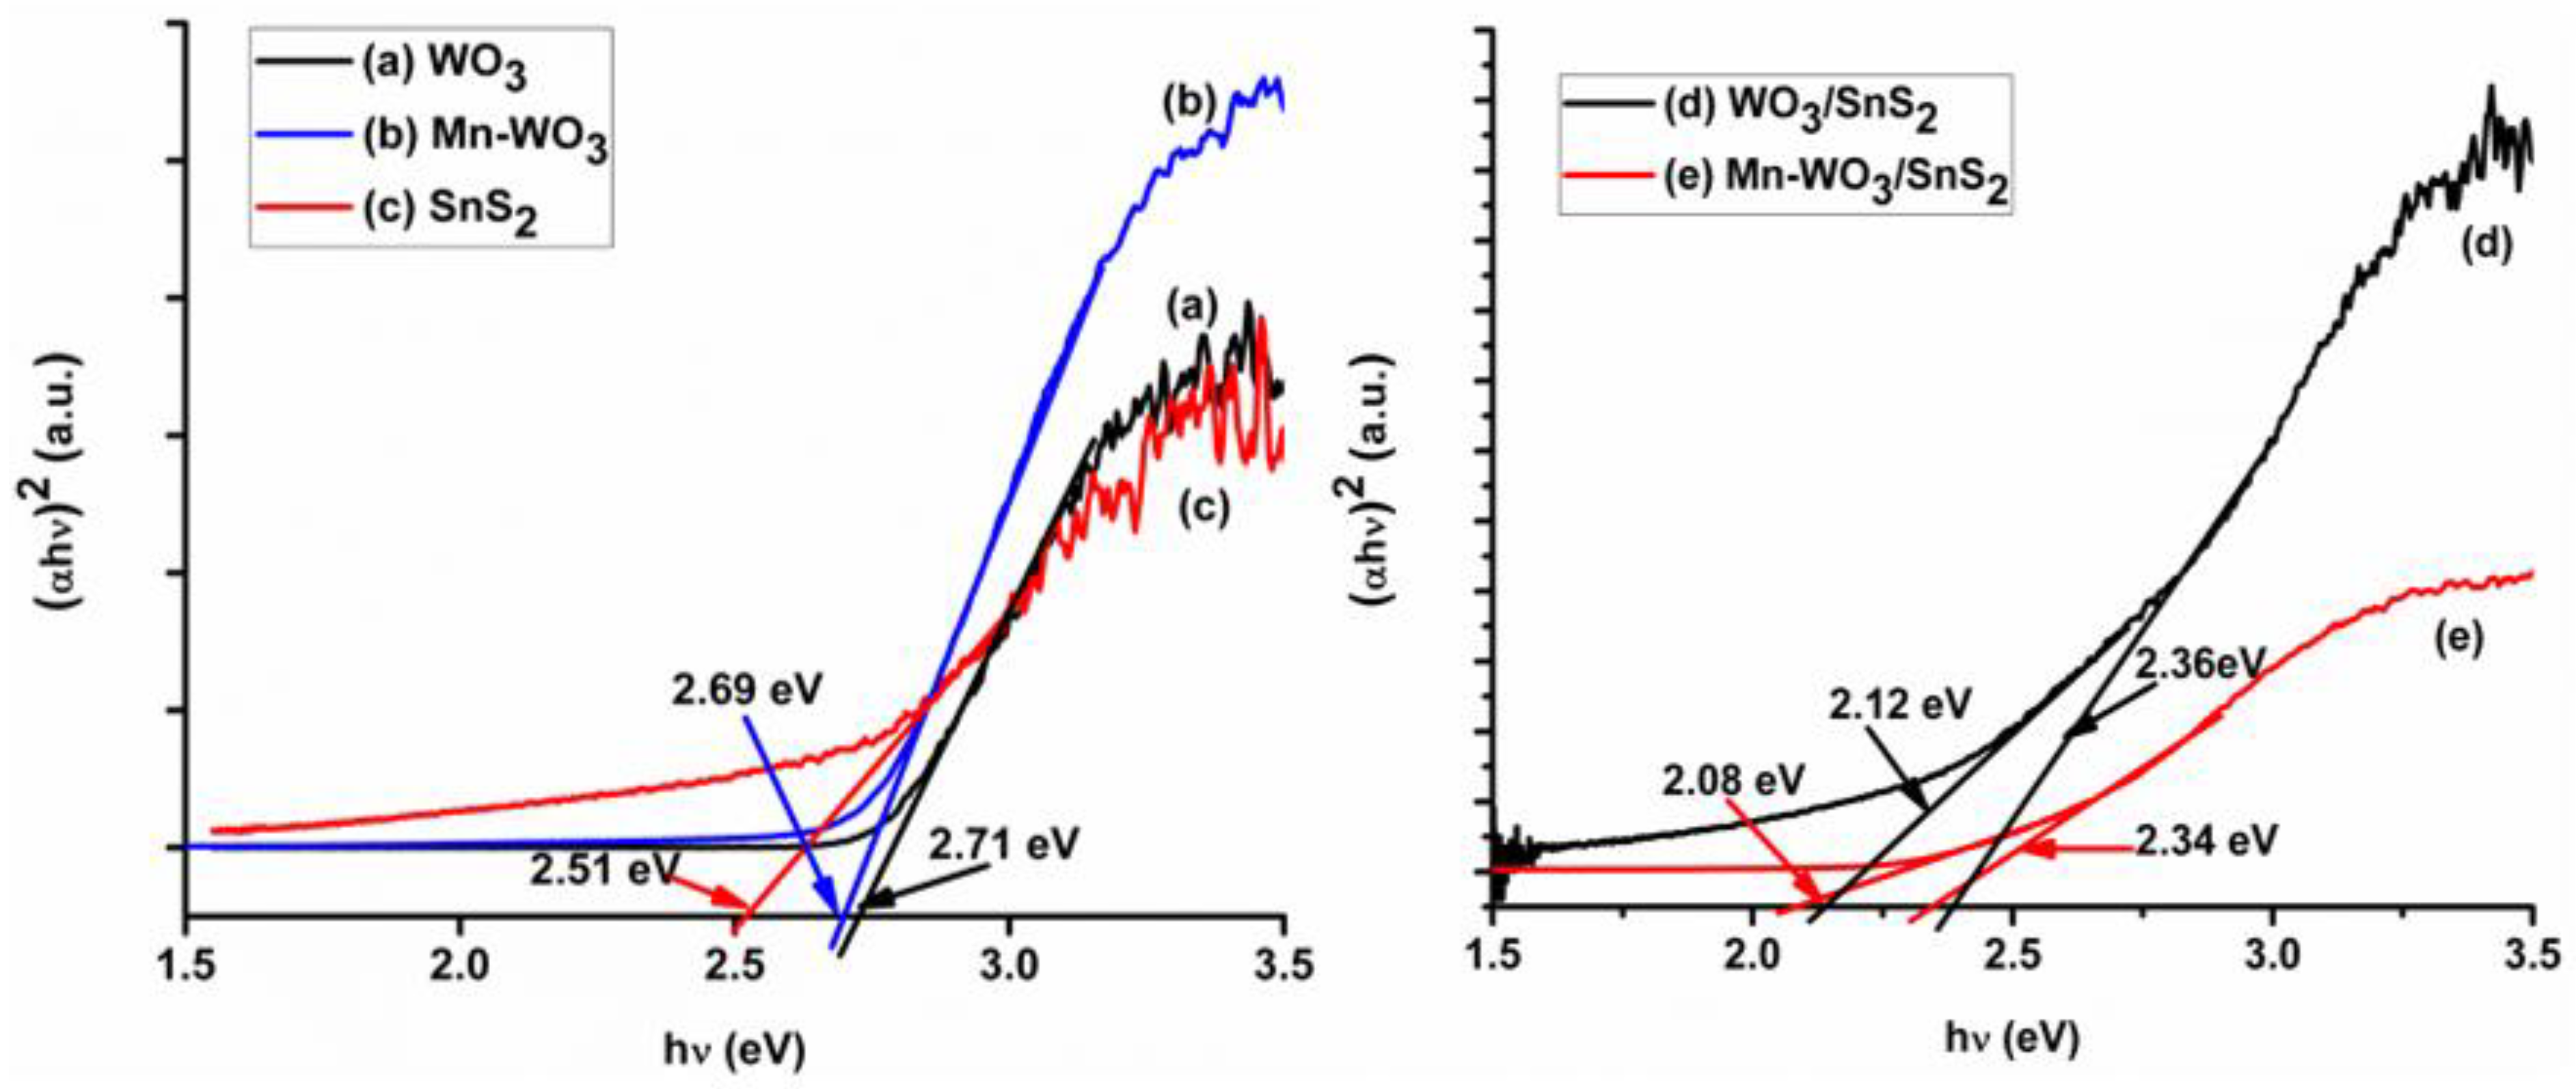
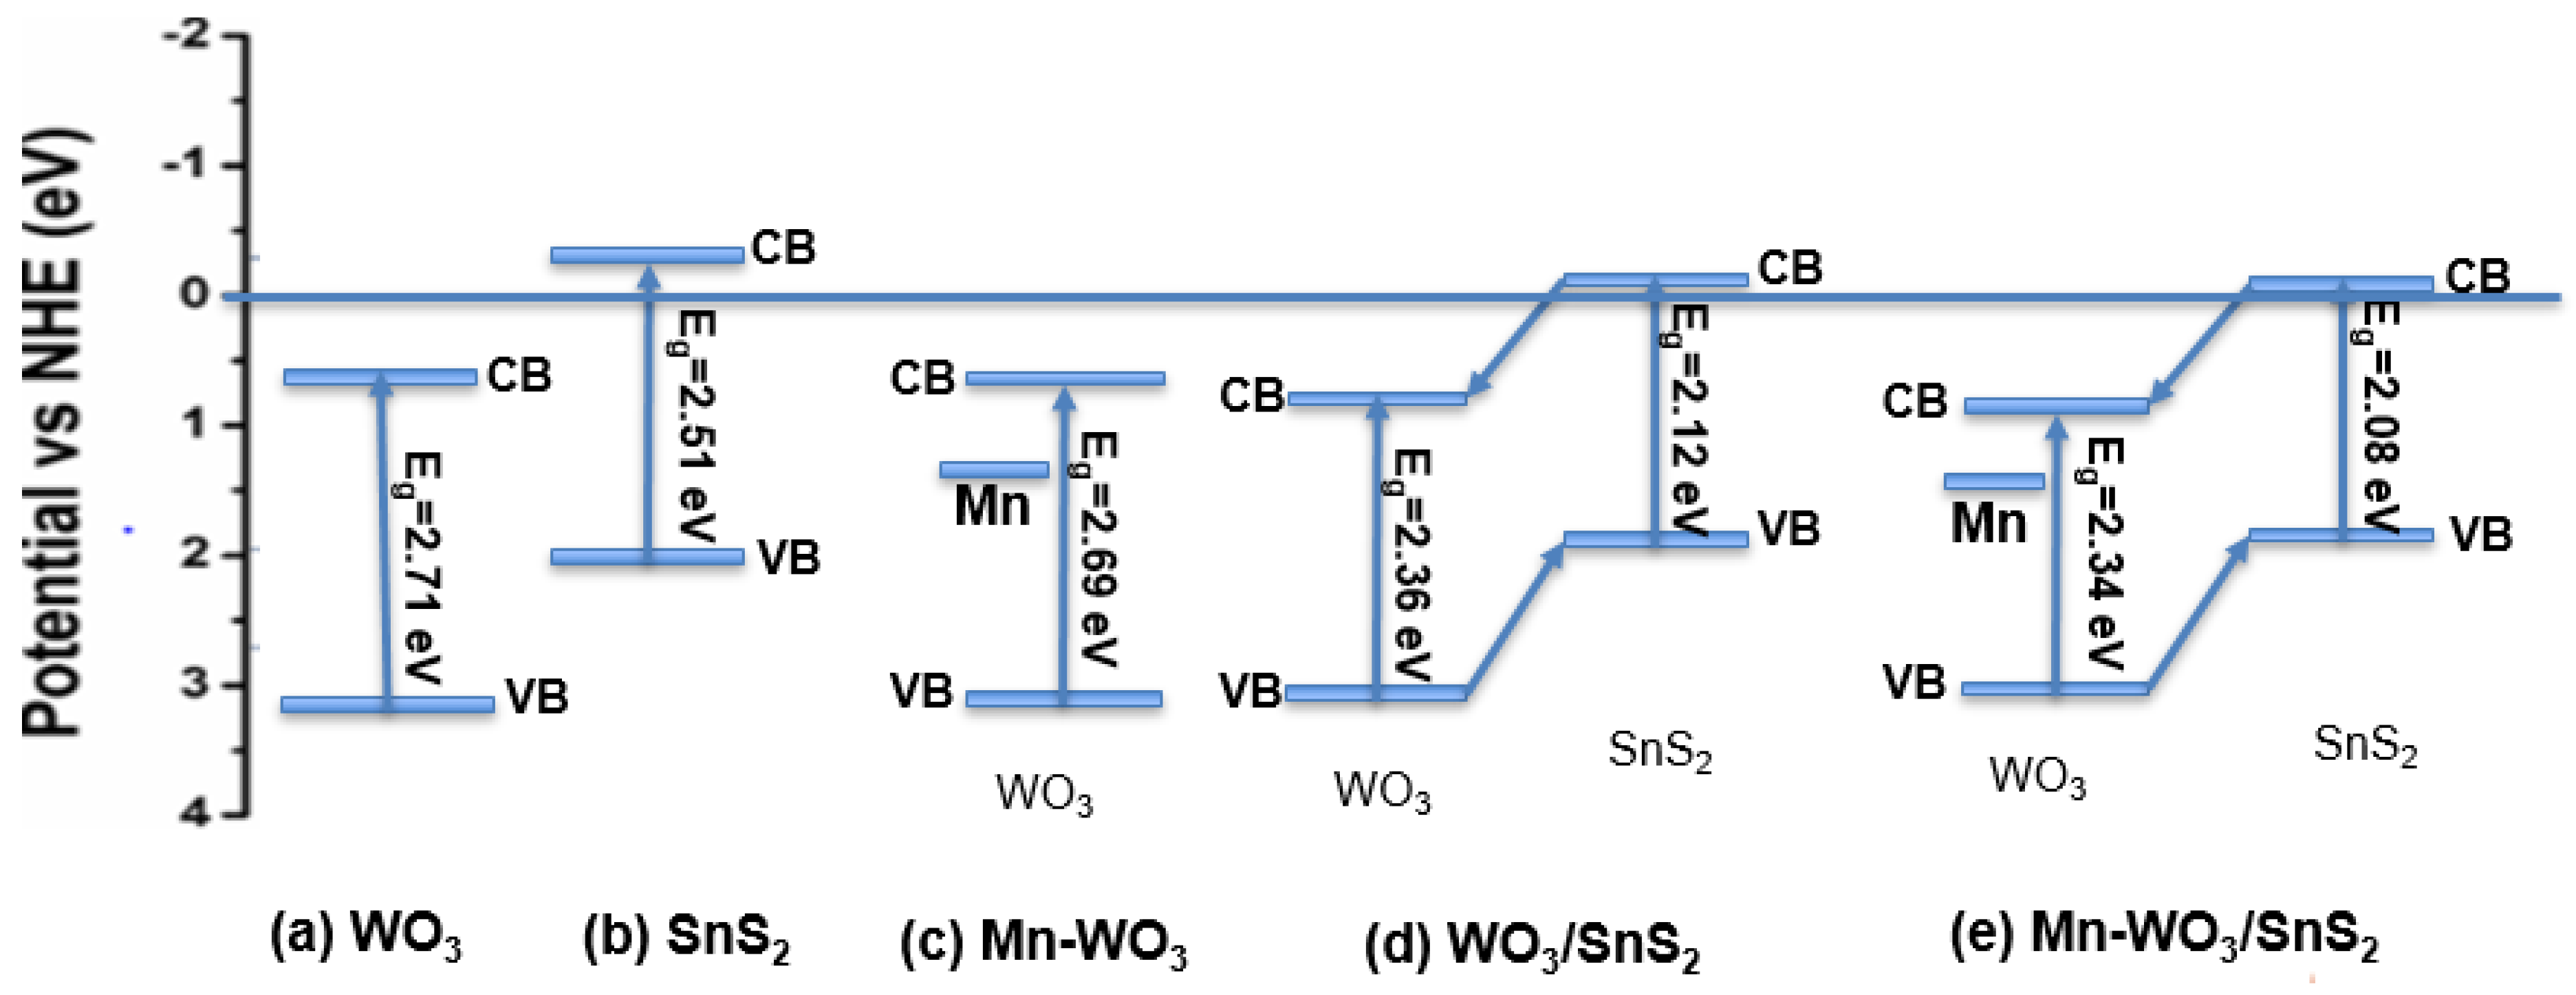
Ultraviolet-visible spectroscopy in diffuse reflectance mode was used to determine the optical properties of the synthesised nanoparticles. All the synthesised nanomaterials showed a shift of absorption to be in the visible region, which is in abundance. Pristine m-WO3 displayed a band gap of 2.71 eV, with a corresponding absorption wavelength of 466 nm, as shown in Figure 4a and Figure S4, respectively. The value obtained agrees with the value reported by Simelane et al. in 2017 [15]. The insertion of Mn2+ in the m-WO3 lattice introduced impurities and thus a shift in the Fermi level below the conduction band, promoting the red-shifting of WO3 on the absorption spectrum (Figure 4b); this was observed by Harshulkhan et al. in 2017 using magnesium as a dopant [6]. The band gap of the WO3 was reduced upon the insertion of Mn and decreased further after the formation of a heterojunction with SnS2 (Figure 4a,b,d,e). The Mn-doped heterojunction had the lowest band gaps (2.08 eV and 2.34 eV) amongst the nanomaterials (the others were WO3, SnS2, Mn-WO3 and WO3/SnS2), which correspond to a high light absorption wavelength (red-shift) (Figure S4); this was due to visible light absorption enhancement by both the Mn ion and SnS2.
The diagram in Figure 5 illustrates the change in the band edge potential of the synthesised semiconductor photocatalysts. The valence band edge potential (EVB) and the conduction band edge potential (ECB) were calculated using Equations (5) and (6). A slight decrease in both ECB and EVB was observed during the introduction of Mn and fusion with SnS2 (Mn-WO3/SnS2). The conduction band edge potential shifted to be more positive (by 0.2 eV), and the valence band edge potential moved to a less positive potential (by 0.2 eV); this was due to the insertion of an ion with a high ionic radius, which reduces the band gap by pulling the band edges closer, resulting in band edge shifts. The change in the position of the band edges enhances the absorption wavelength of the material. The heterojunction (Mn-WO3/SnS2) enhances charge separation by the movement of electrons from the SnS2 CB to the WO3 CB through the interface, thereby leaving holes in the VB of the SnS2. This effectively separates the electrons and holes as they accumulate in the CB of WO3 and the VB of SnS2, respectively.
2.4. Electrochemical and Photoluminescence Measurements
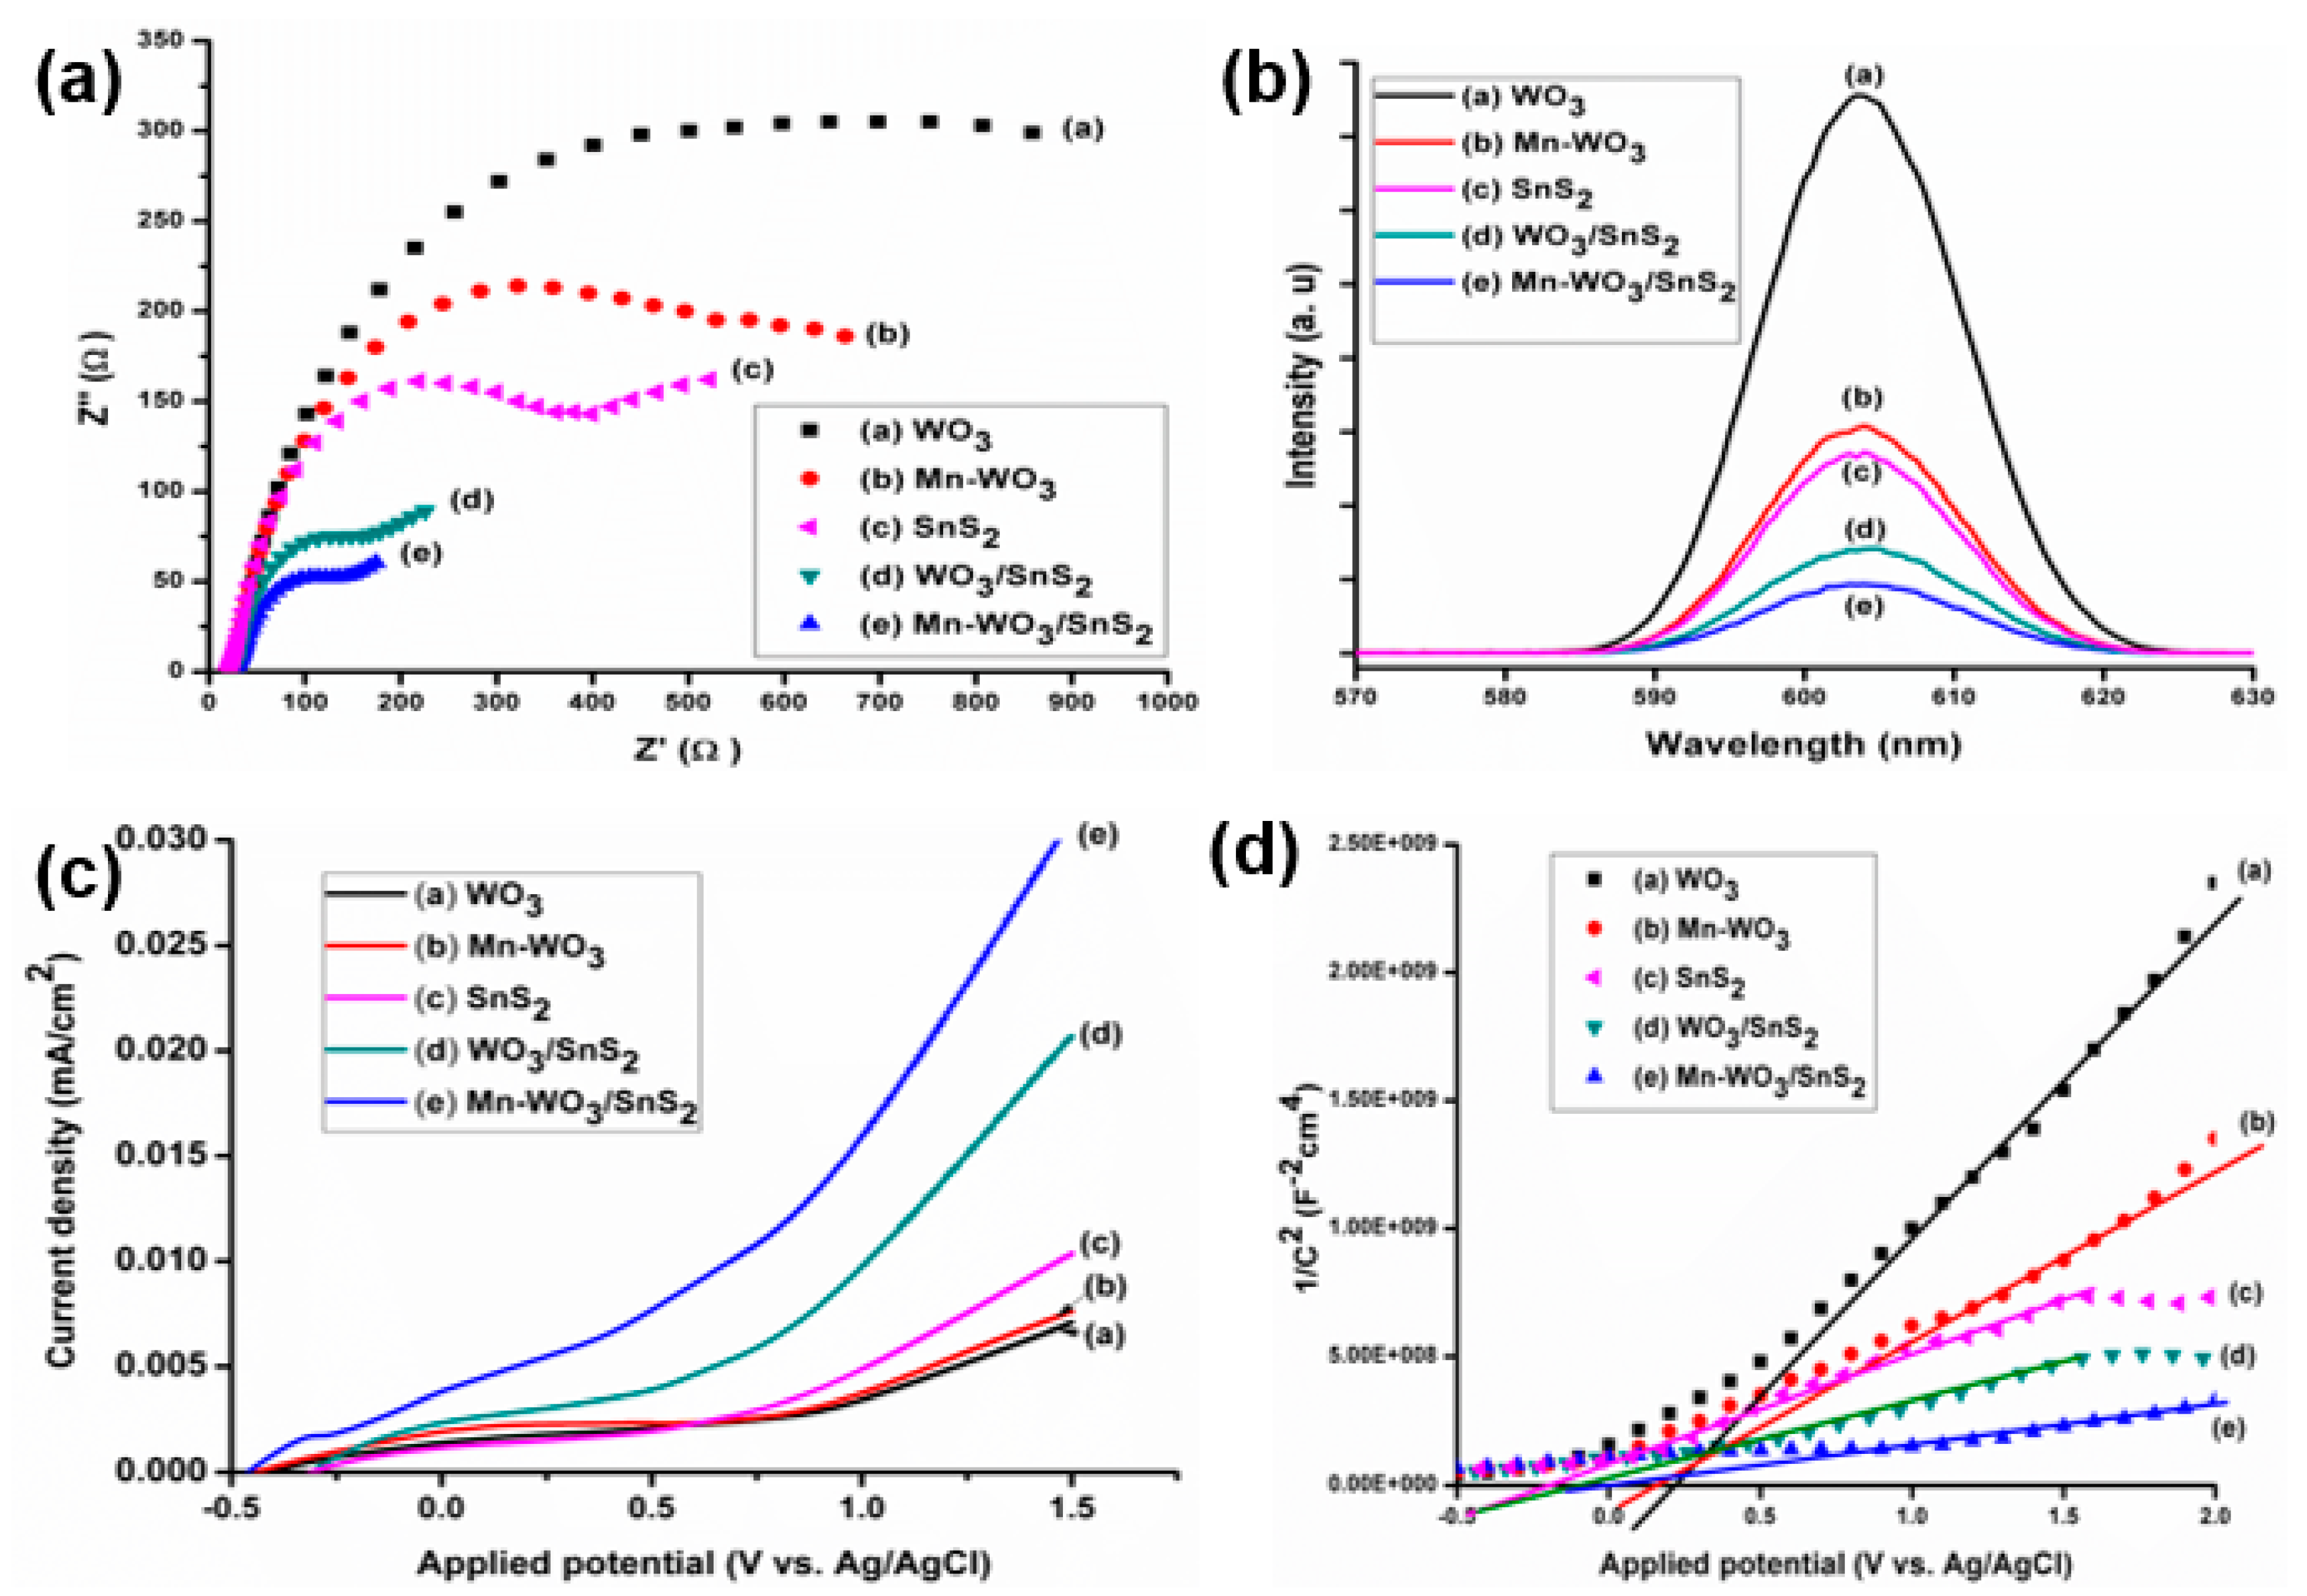
The electrochemical impedance spectroscopy (EIS) measurements were carried out to study the interfacial reactions occurring between the photoelectrode and the electrolyte. Figure 6a illustrates the EIS spectrum (Nyquist plot) with a suppressed semicircle with a large diameter. At low frequency, the current density is in phase with the potential deviation of the system, resulting in a straight line at an angle of 45° to the X-axis. The large diameter of the semicircle at high frequency corresponds to the high charge transfer impedance of WO3. This relates to the high charge recombination rate as observed in Figure 6a. The charge transfer impedance was reduced after WO3 was doped with the Mn2+ ion (Figure 6b), due to the reduced charge recombination rate and increased charge mobility. This was due to the Mn2+ ions acting as charge collection sites, thereby serving as an electrical conduction pathway, allowing ion/electron mobility on the electrode [7]. The small diameter of the semicircle of the Mn-WO3/SnS2 spectrum indicates decreased electrode–electrolyte charge-transfer resistance/impedance compared to that in the WO3/SnS2, Mn-WO3, SnS2 and WO3 in the 0.1 M Na2SO4 electrolyte. The sloping straight line in the low-frequency region corresponds to oxygen diffusion within the electrode (Figure 6a). The low charge transfer resistance of Mn-WO3/SnS2 arises from the enhanced charge carrier separation induced by the Mn2+ ion dopant and SnS2 semiconductor heterojunction with WO3. The charge transfer resistance and recombination rate decreased for WO3, Mn-WO3, SnS2 and WO3/SnS2, with the lowest rate observed in the Mn-WO3/SnS2 (Figure 6a,b).
Photoluminescence (PL) measurements (Figure 6b) support the EIS findings that the WO3 has a strong PL intensity, which indicates high charge carrier recombination, and it was reduced by the introduction of Mn and fusion with SnS2. A decrease in PL intensity was observed in the Mn-WO3/SnS2, indicating low charge carrier recombination, which implied that it would be a good photocatalyst in photocatalytic applications. This is attributed to the longer charge carrier lifetimes and enhanced charge carrier mobility provided by the Sn-S bond, thereby minimising the electron–hole recombination.
Upon the introduction of Mn2+ and SnS2, the photocurrent density of WO3 was observed to be improved by up to 0.030 mA/cm2 for Mn-WO3/SnS2 NPs (Figure 6c). This implied that there was high electron flow between the photocatalyst and the electrolyte produced from the photocatalyst upon light irradiation. The Mn2+ acts as an electron sink and reaction side, which in turn supplies electrons for interfacial reactions, and upon illumination, SnS2 helps in the production of electrons and their separation from holes, which increases the current density.
Mott–Schottky plots were used to study the interfacial capacitance of the nanomaterials. The positive slopes obtained from Figure 6d confirmed that the synthesised nanomaterials are all n-type semiconductors, which use electrons as major charge carriers. The positive slope for the heterojunction WO3/SnS2 and Mn-WO3/SnS2 NPs further inferred the formation of an n–n type heterojunction system. Upon the introduction of the Mn2+ and formation of the heterojunction, there was no significant change in the slope of the curves.
The flat-band potential (Vfb) was obtained by extrapolating a line on the slope of the graph to the x-intercept (1/C2=0). The flat-band potentials were found to be 0.214 V, 0.159 V, −0.209 V, −0.103 V and −0.039 V, corresponding to WO3, Mn-WO3, SnS2, WO3/SnS2 and Mn-WO3/SnS2, respectively. The flat-band potential in n-type semiconductors corresponds to the bottom of the conduction band of the semiconductor photocatalyst, which was observed to decrease upon doping and the formation of the heterojunction (Figure 6d). The obtained flat-band potential (Vfb) values were found to correspond to the calculated conduction band edge potentials (ECB) from UV-Vis DRS.
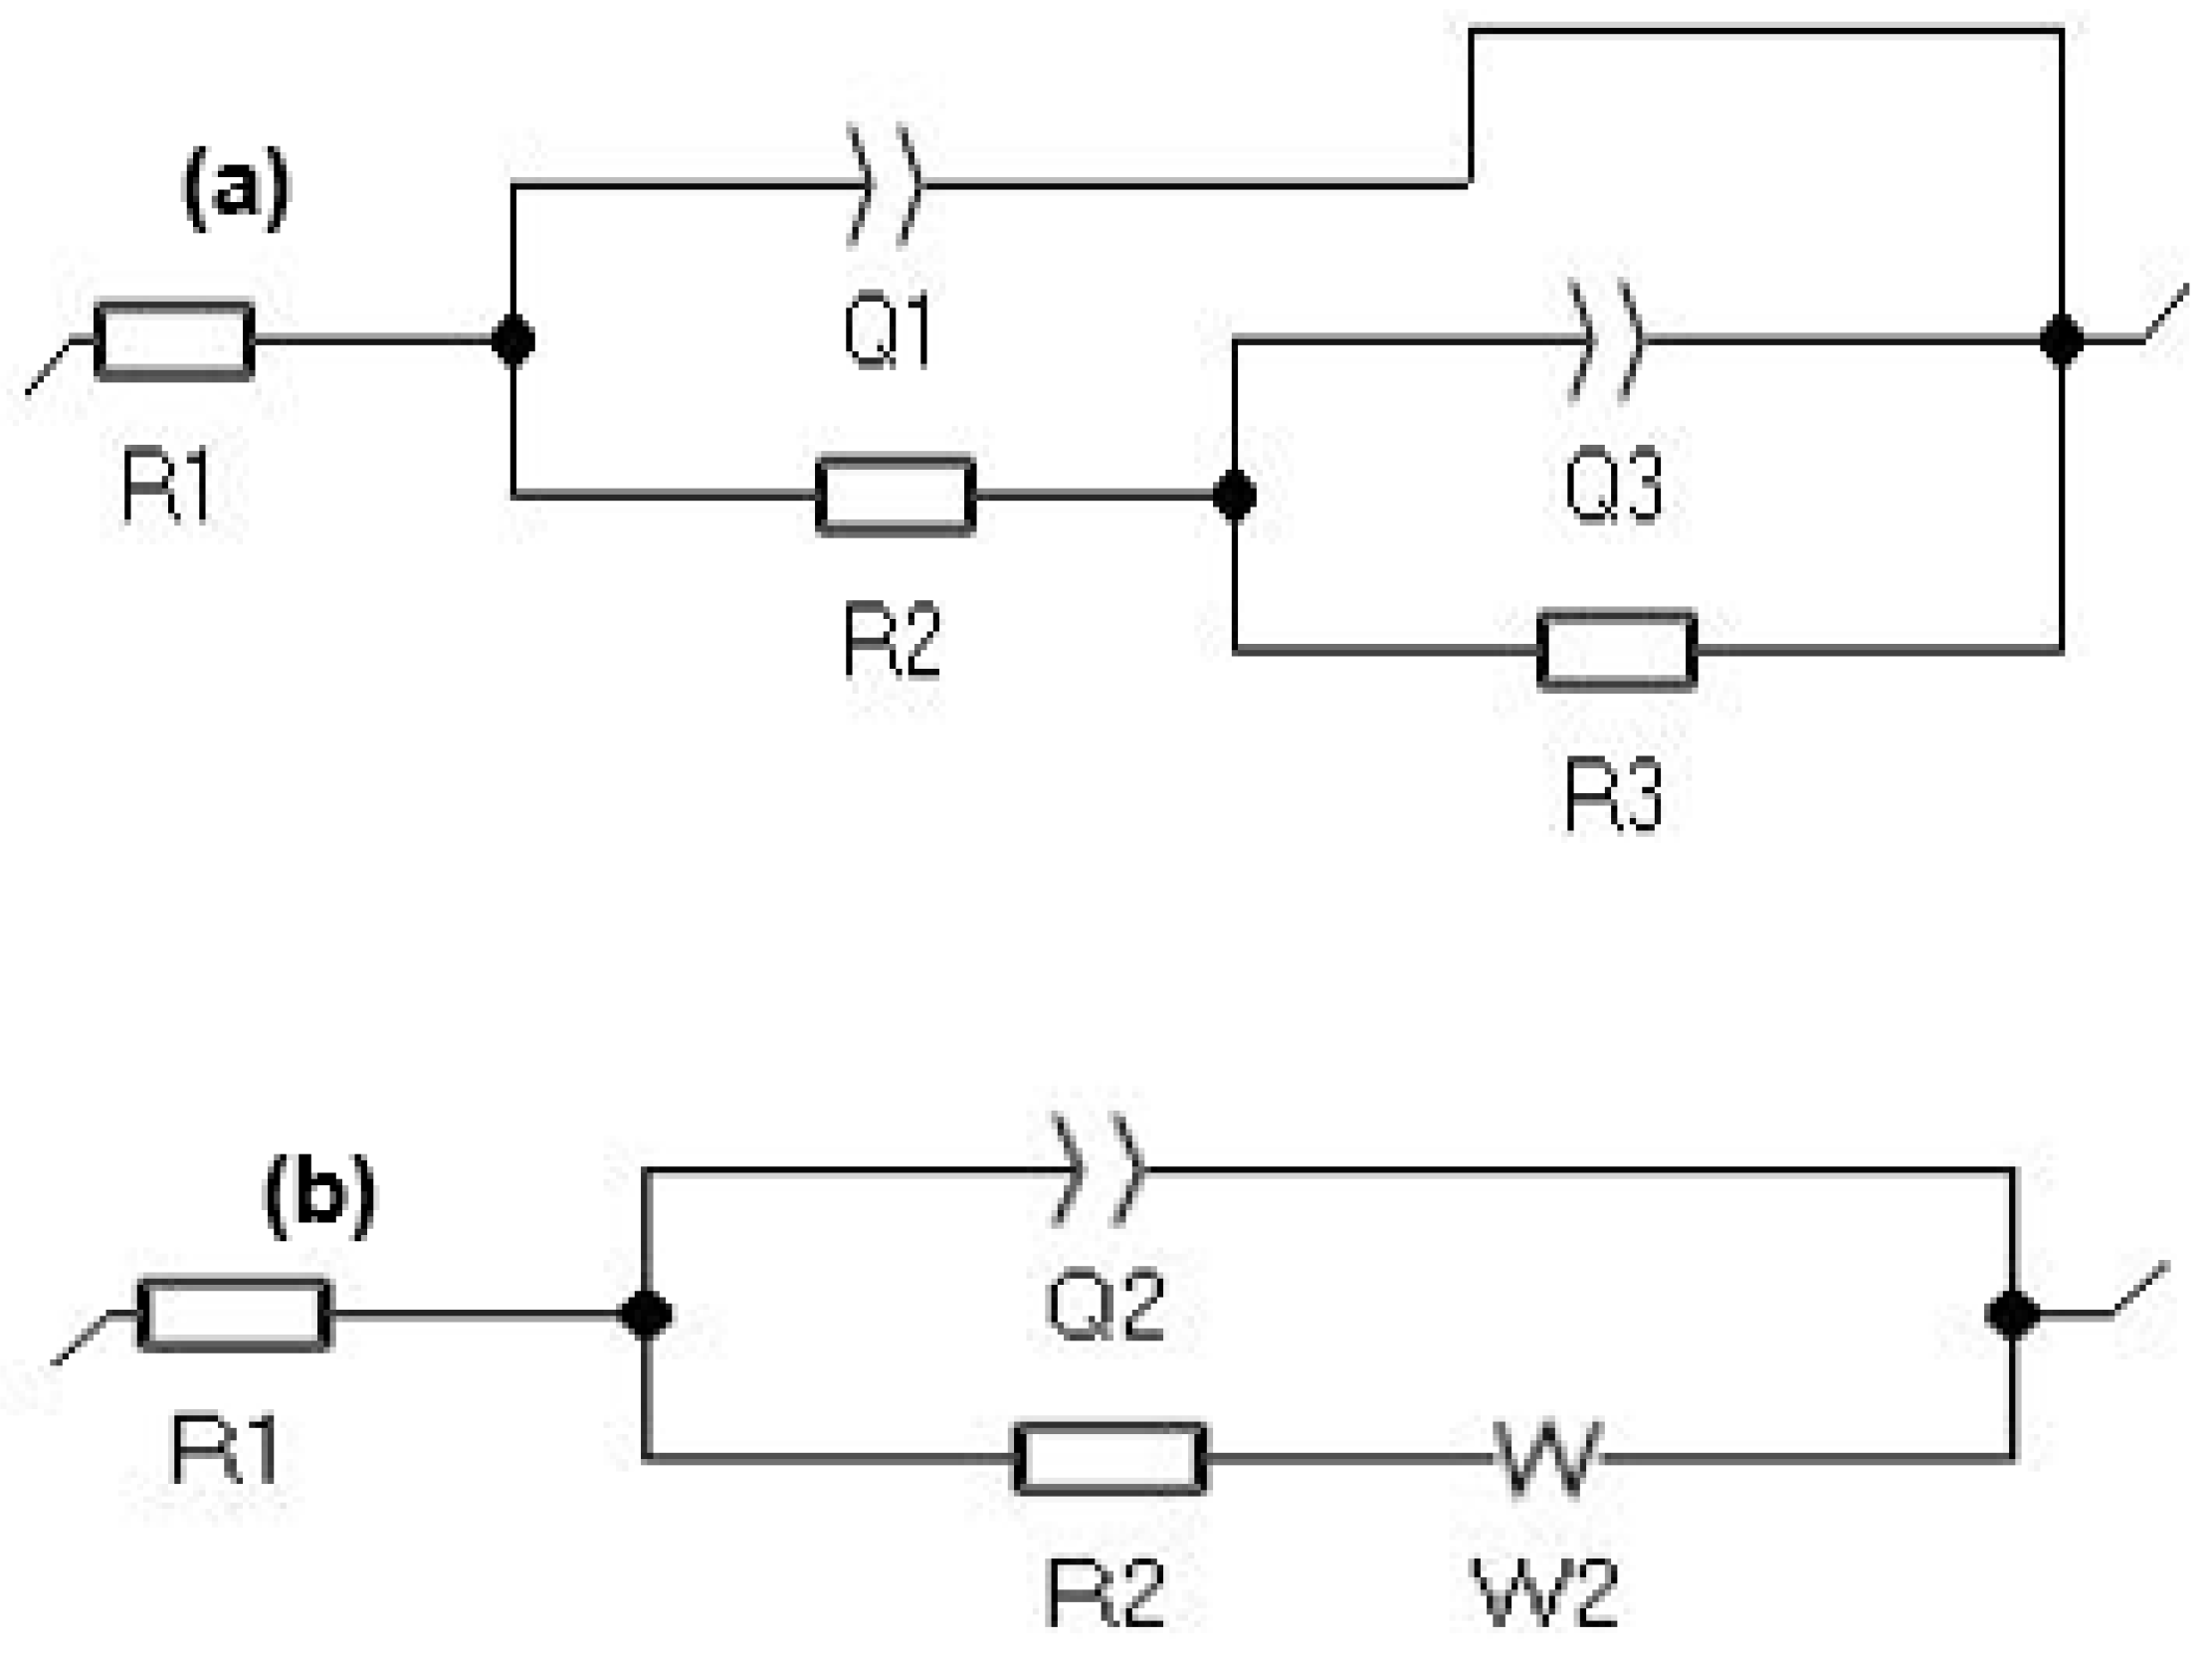
The Randles equivalent circuit model was used to fit the obtained EIS data. The Randles equivalent circuit models (Figure 7a,b) corresponding to the graphs show that the impedance was a contribution of three forms of resistance, namely the solution resistance, the electrode resistance due to the film composition of the nanomaterials, and charge-transfer resistance occurring at the electrolyte–electrode interface.
The Warburg impedance is due to solid-state ion diffusion during the electrochemical reaction. The Warburg element manifests itself in EIS spectra as a straight line with a slope of 45° in the low-frequency region. Different slopes of the straight-line part in the low-frequency region indicate that the electrodes have different Warburg impedances and solid-state ion diffusion behaviors.
The equivalent circuit model was obtained after fitting the data to the Randles model: R1 is the solution resistance, R2 is the thin layer resistance, R3 is the charge transfer resistance, W2 is the Warburg resistance and Q1, Q2 and Q3 are the constant phase elements. The Warburg impedance relates to solid-state ion diffusion during the electrochemical reaction in the solution. This favours photocatalytic activity by utilising the separated charges during the reaction and, consequently, reduces charge recombination. The slope of the Warburg transition line also indicates the reactivity of the nanoparticles. Furthermore, the charge transfer impedance was found to be 631.80, 498.50, 310.55, 173.65 and 157.16 Ω for WO3, Mn-WO3, SnS2, WO3/SnS2 and Mn-WO3/SnS2, respectively.
2.5. BET Analysis
The BET analysis revealed that the nitrogen adsorption isotherms obtained for the nanoparticles were Type IV isotherms, according to the IUPAC (International Union of Pure and Applied Chemistry) classification (indicated in Figure S6). A Type IV isotherm is typical of mesoporous materials (IUPAC definition: pore size 2–50 nm), suggesting that the nanomaterials consist of agglomerates. The Mn-WO3/SnS2 nanoparticles were found to have the highest BET surface area (77.14 m2/g) and pore volume, of 0.0641 cm3/g, compared to pristine materials (Table 1). This suggests that Mn-WO3/SnS2 would have improved photocatalytic activity due to the adsorption capacity provided by its large specific surface area during photocatalysis. The large pore volume would allow the efficient trapping of pollutants during adsorption for degradation to take place.
2.6. Surface Charge of Nanoparticles
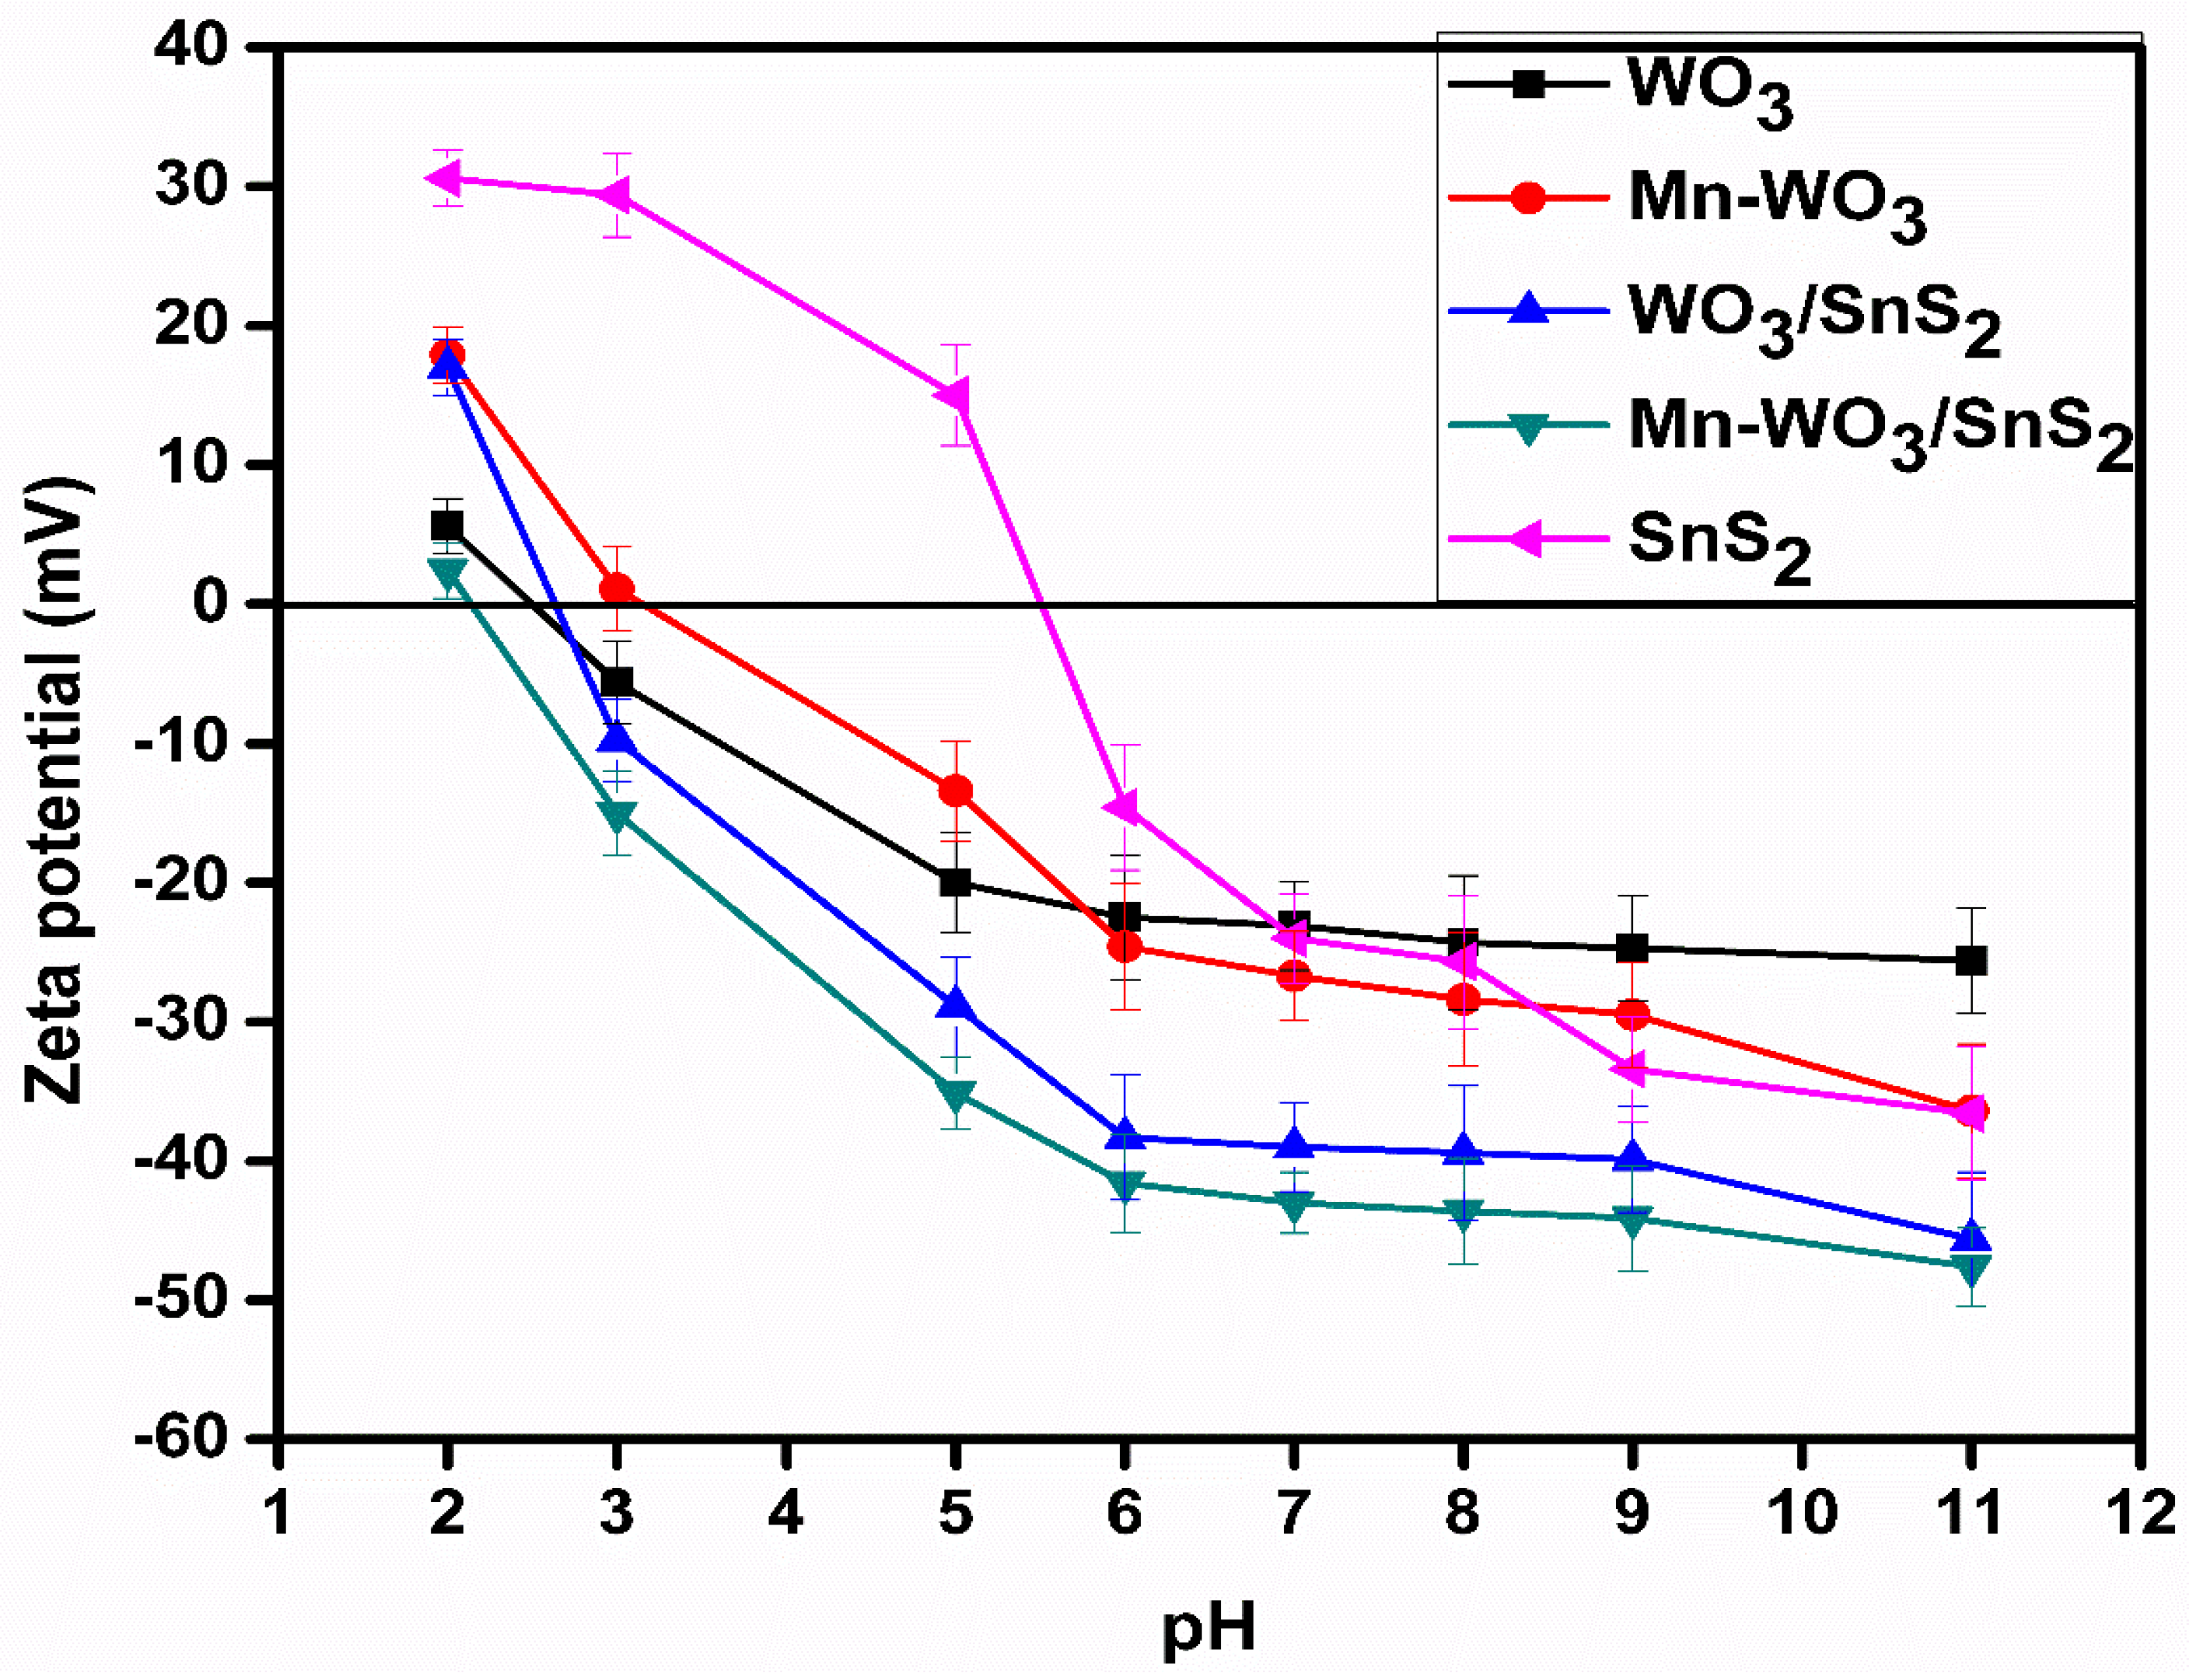
The stability of the nanomaterials in suspensions was studied using the electrophoretic light scattering technique. The zeta potentials of the nanomaterials are illustrated in Figure 8. showing a steady but gradual change in zeta potential from positive to negative as the pH increased from 2 to 11 for all the photocatalysts (Figure 8).
The point of zero charge (pzc) for pristine WO3 was observed at pHpzc 2.5, which corresponds to what is reported in the literature.
A slight shift of the pzc to higher pH was observed for Mn-WO3 (pHpzc = 3.2). The shift is due to the substitution of W6+ by Mn2+ metal ions, consequently changing the overall charge of the material. Therefore, species adsorbed onto the surface of the photocatalyst change the surface charge and shift the point of zero charge of the suspended nanoparticles.
The point of zero charge for pristine SnS2 was found to be at pH 5.5, as reported in literature. Furthermore, the heterojunction (WO3/SnS2) displayed a point of zero charge (2.7) at a lower pH than SnS2 but higher than WO3; this was attributed to synergistic effects from both counterparts (WO3 and SnS2) in the heterojunction.
Furthermore, introduction of Mn in the heterojunction (Mn-WO3/SnS2) shifted the point of zero charge to 2.1, much lower than for all the other photocatalysts.
2.7. Degradation of Chlorpyrifos
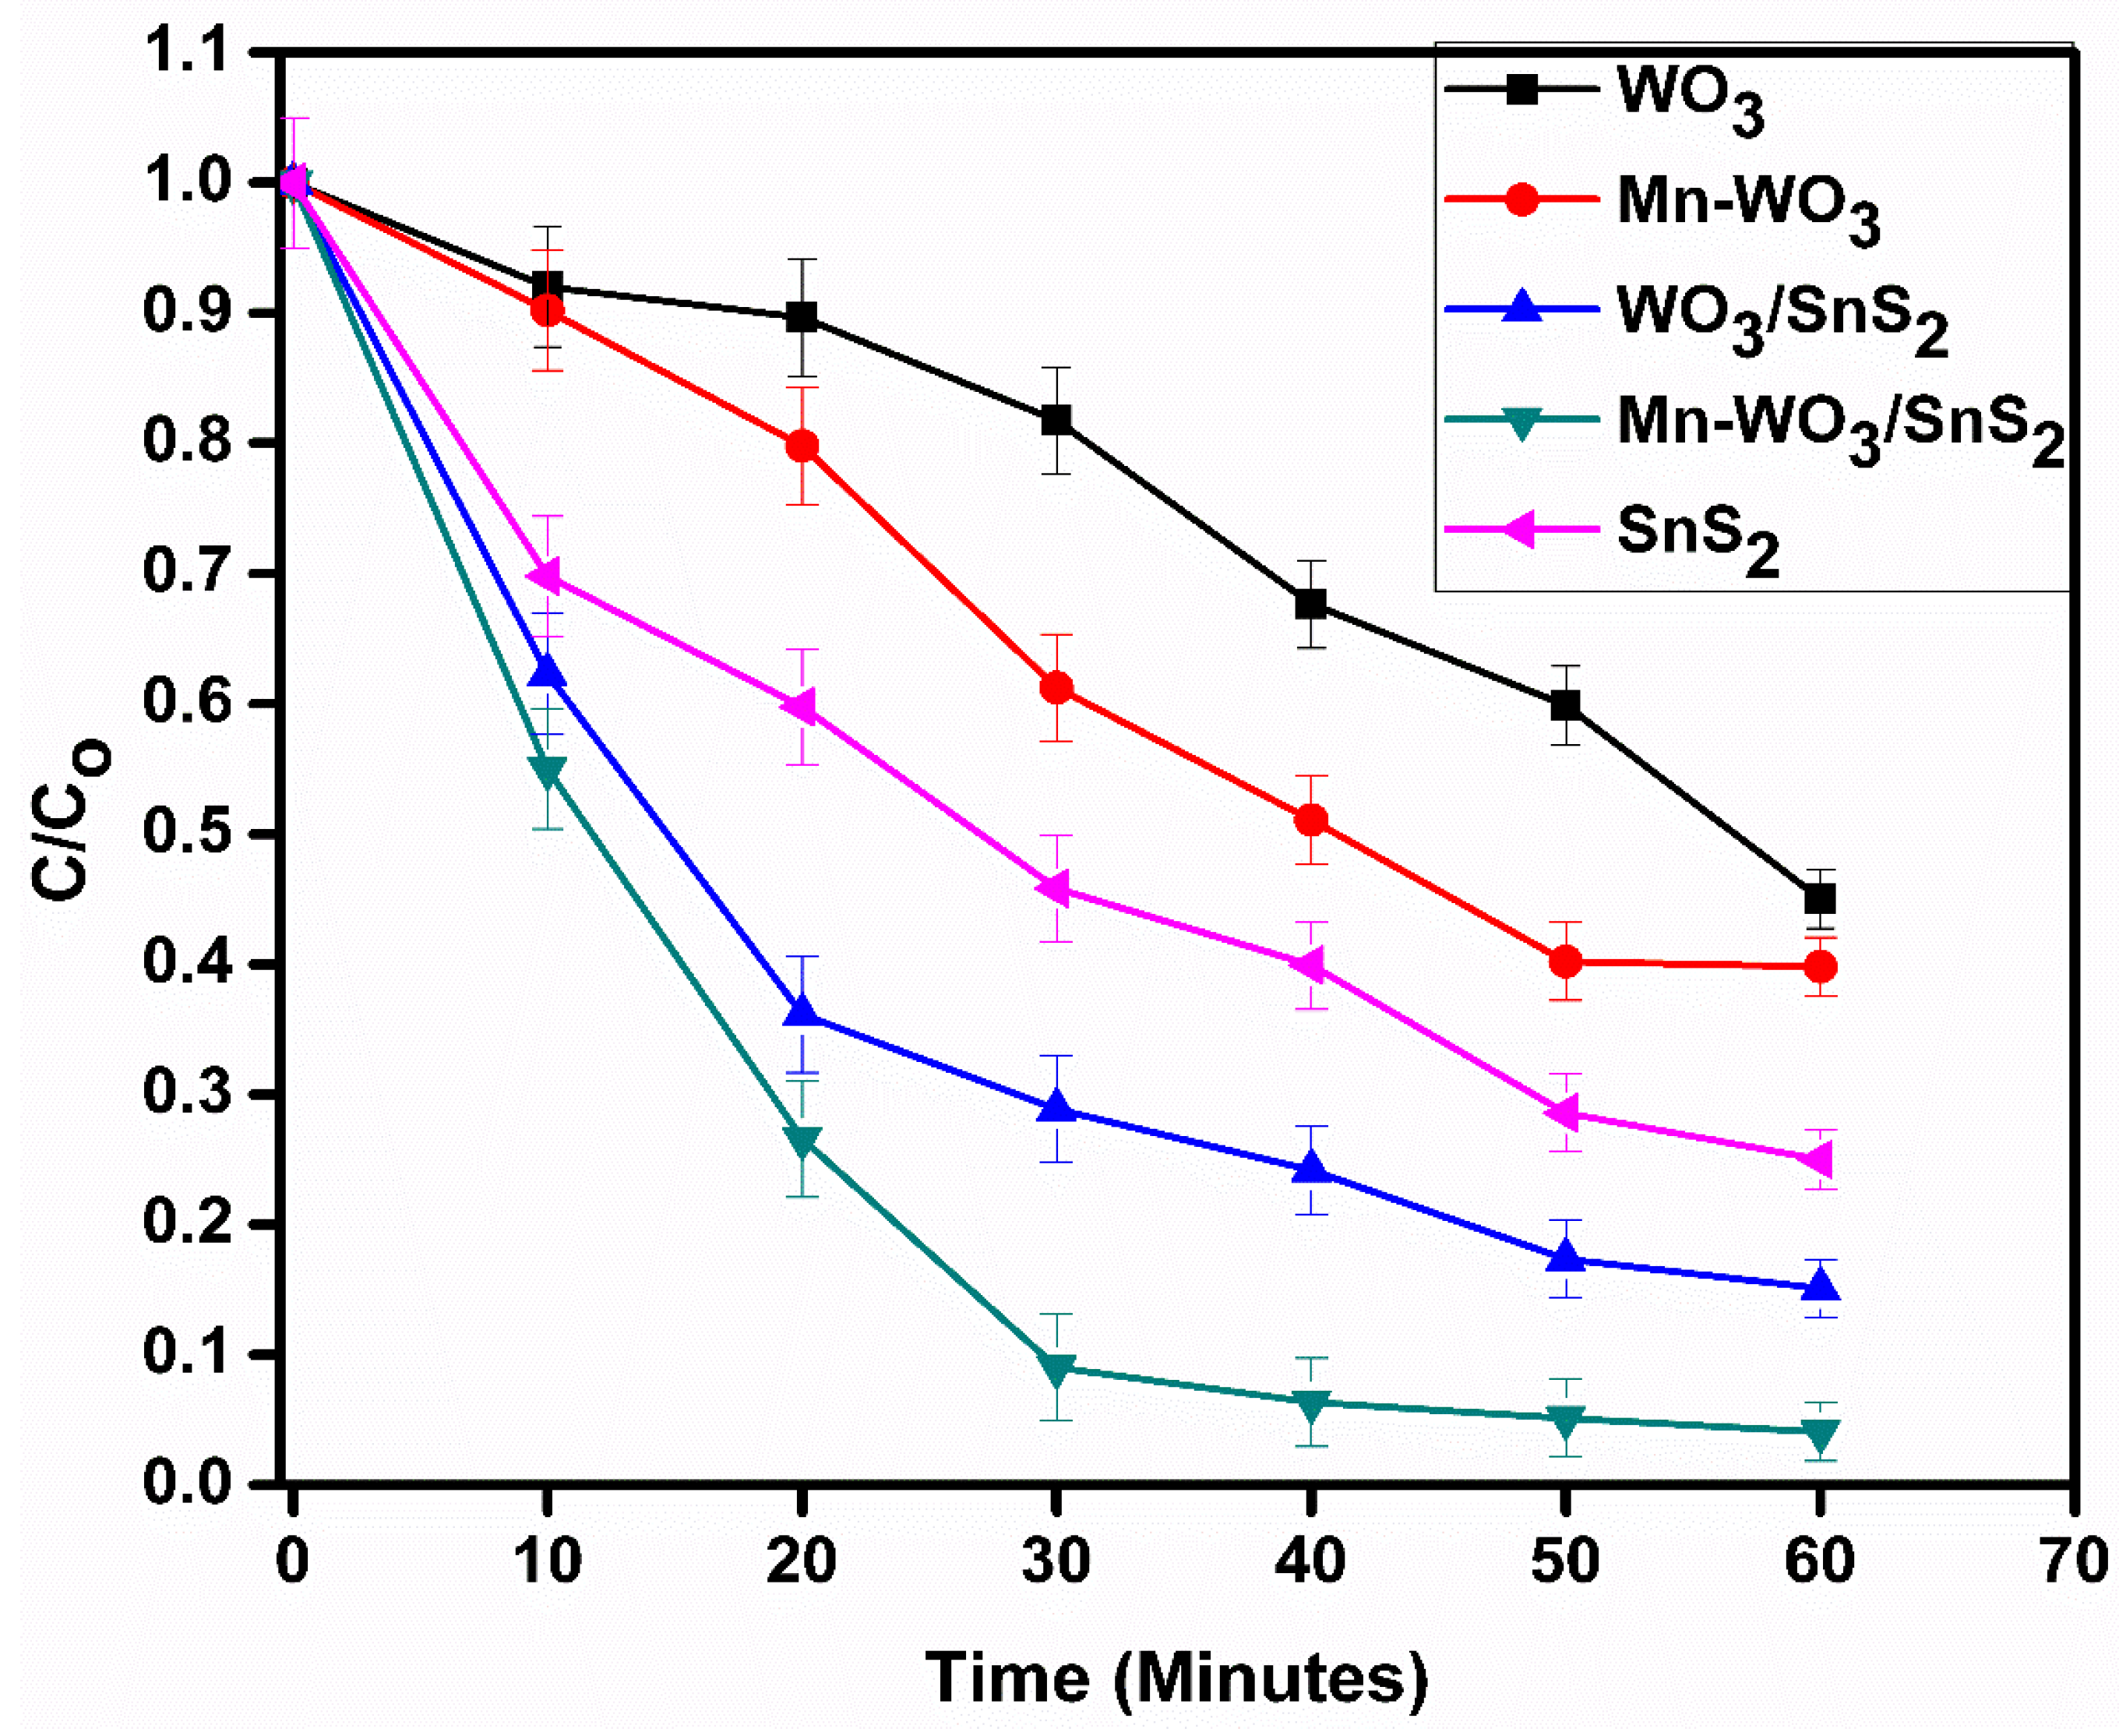
The photodegradation of chlorpyrifos using the synthesized nanoparticles is showed in Figure 9. The degradation profile for chlorpyrifos indicated an increase in removal by the nanoparticles from the WO3 to Mn-WO3/SnS2 photocatalysts. The Mn-WO3/SnS2 nanoparticles showed high removal of chlorpyrifos due to high charge separation and lower charge impedance. Therefore, Mn-WO3/SnS2 represented the best performing photocatalyst with up to 95.90% chlorpyrifos removal, calculated using Equation (10).
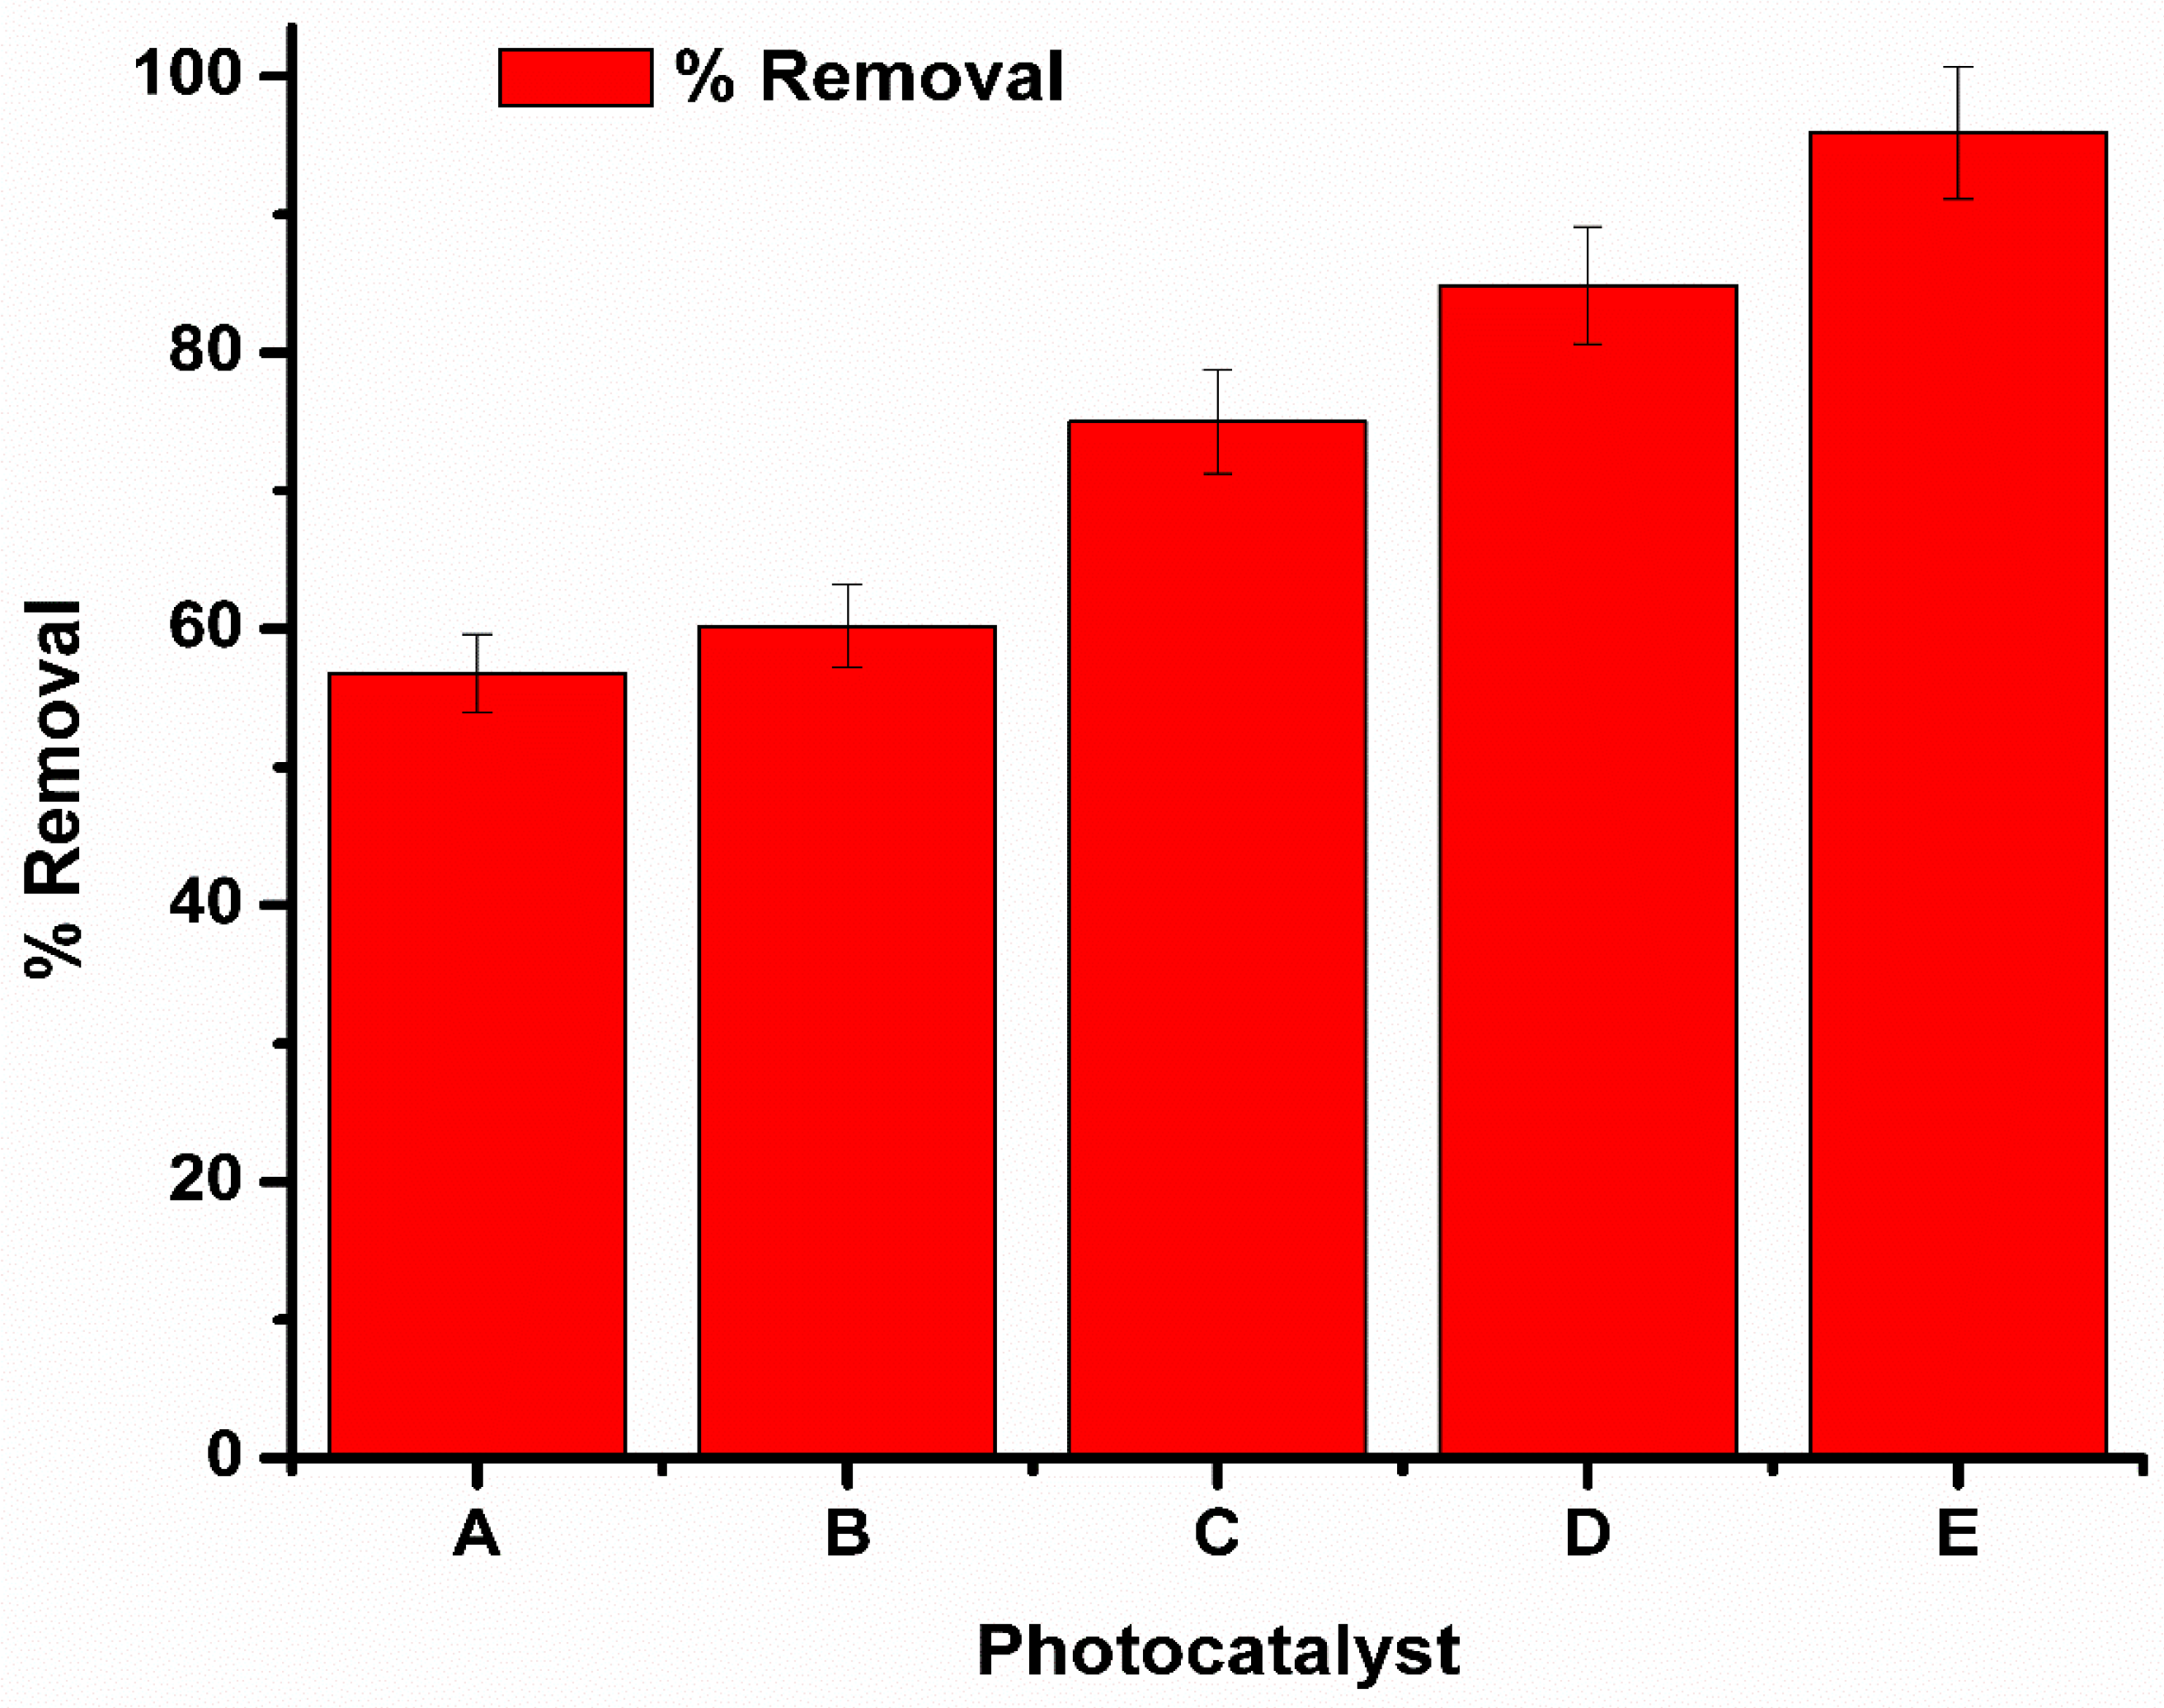
Figure 10 displays the percentage removal of chlorpyrifos in water within a period of 60 min. The removal efficiency for chlorpyrifos by using the nanoparticles resulted in 56.80%, 60.20%, 75.00%, 84.88% and 95.90% removal for WO3, Mn-WO3, SnS2, WO3/SnS2 and Mn-WO3/SnS2, respectively.
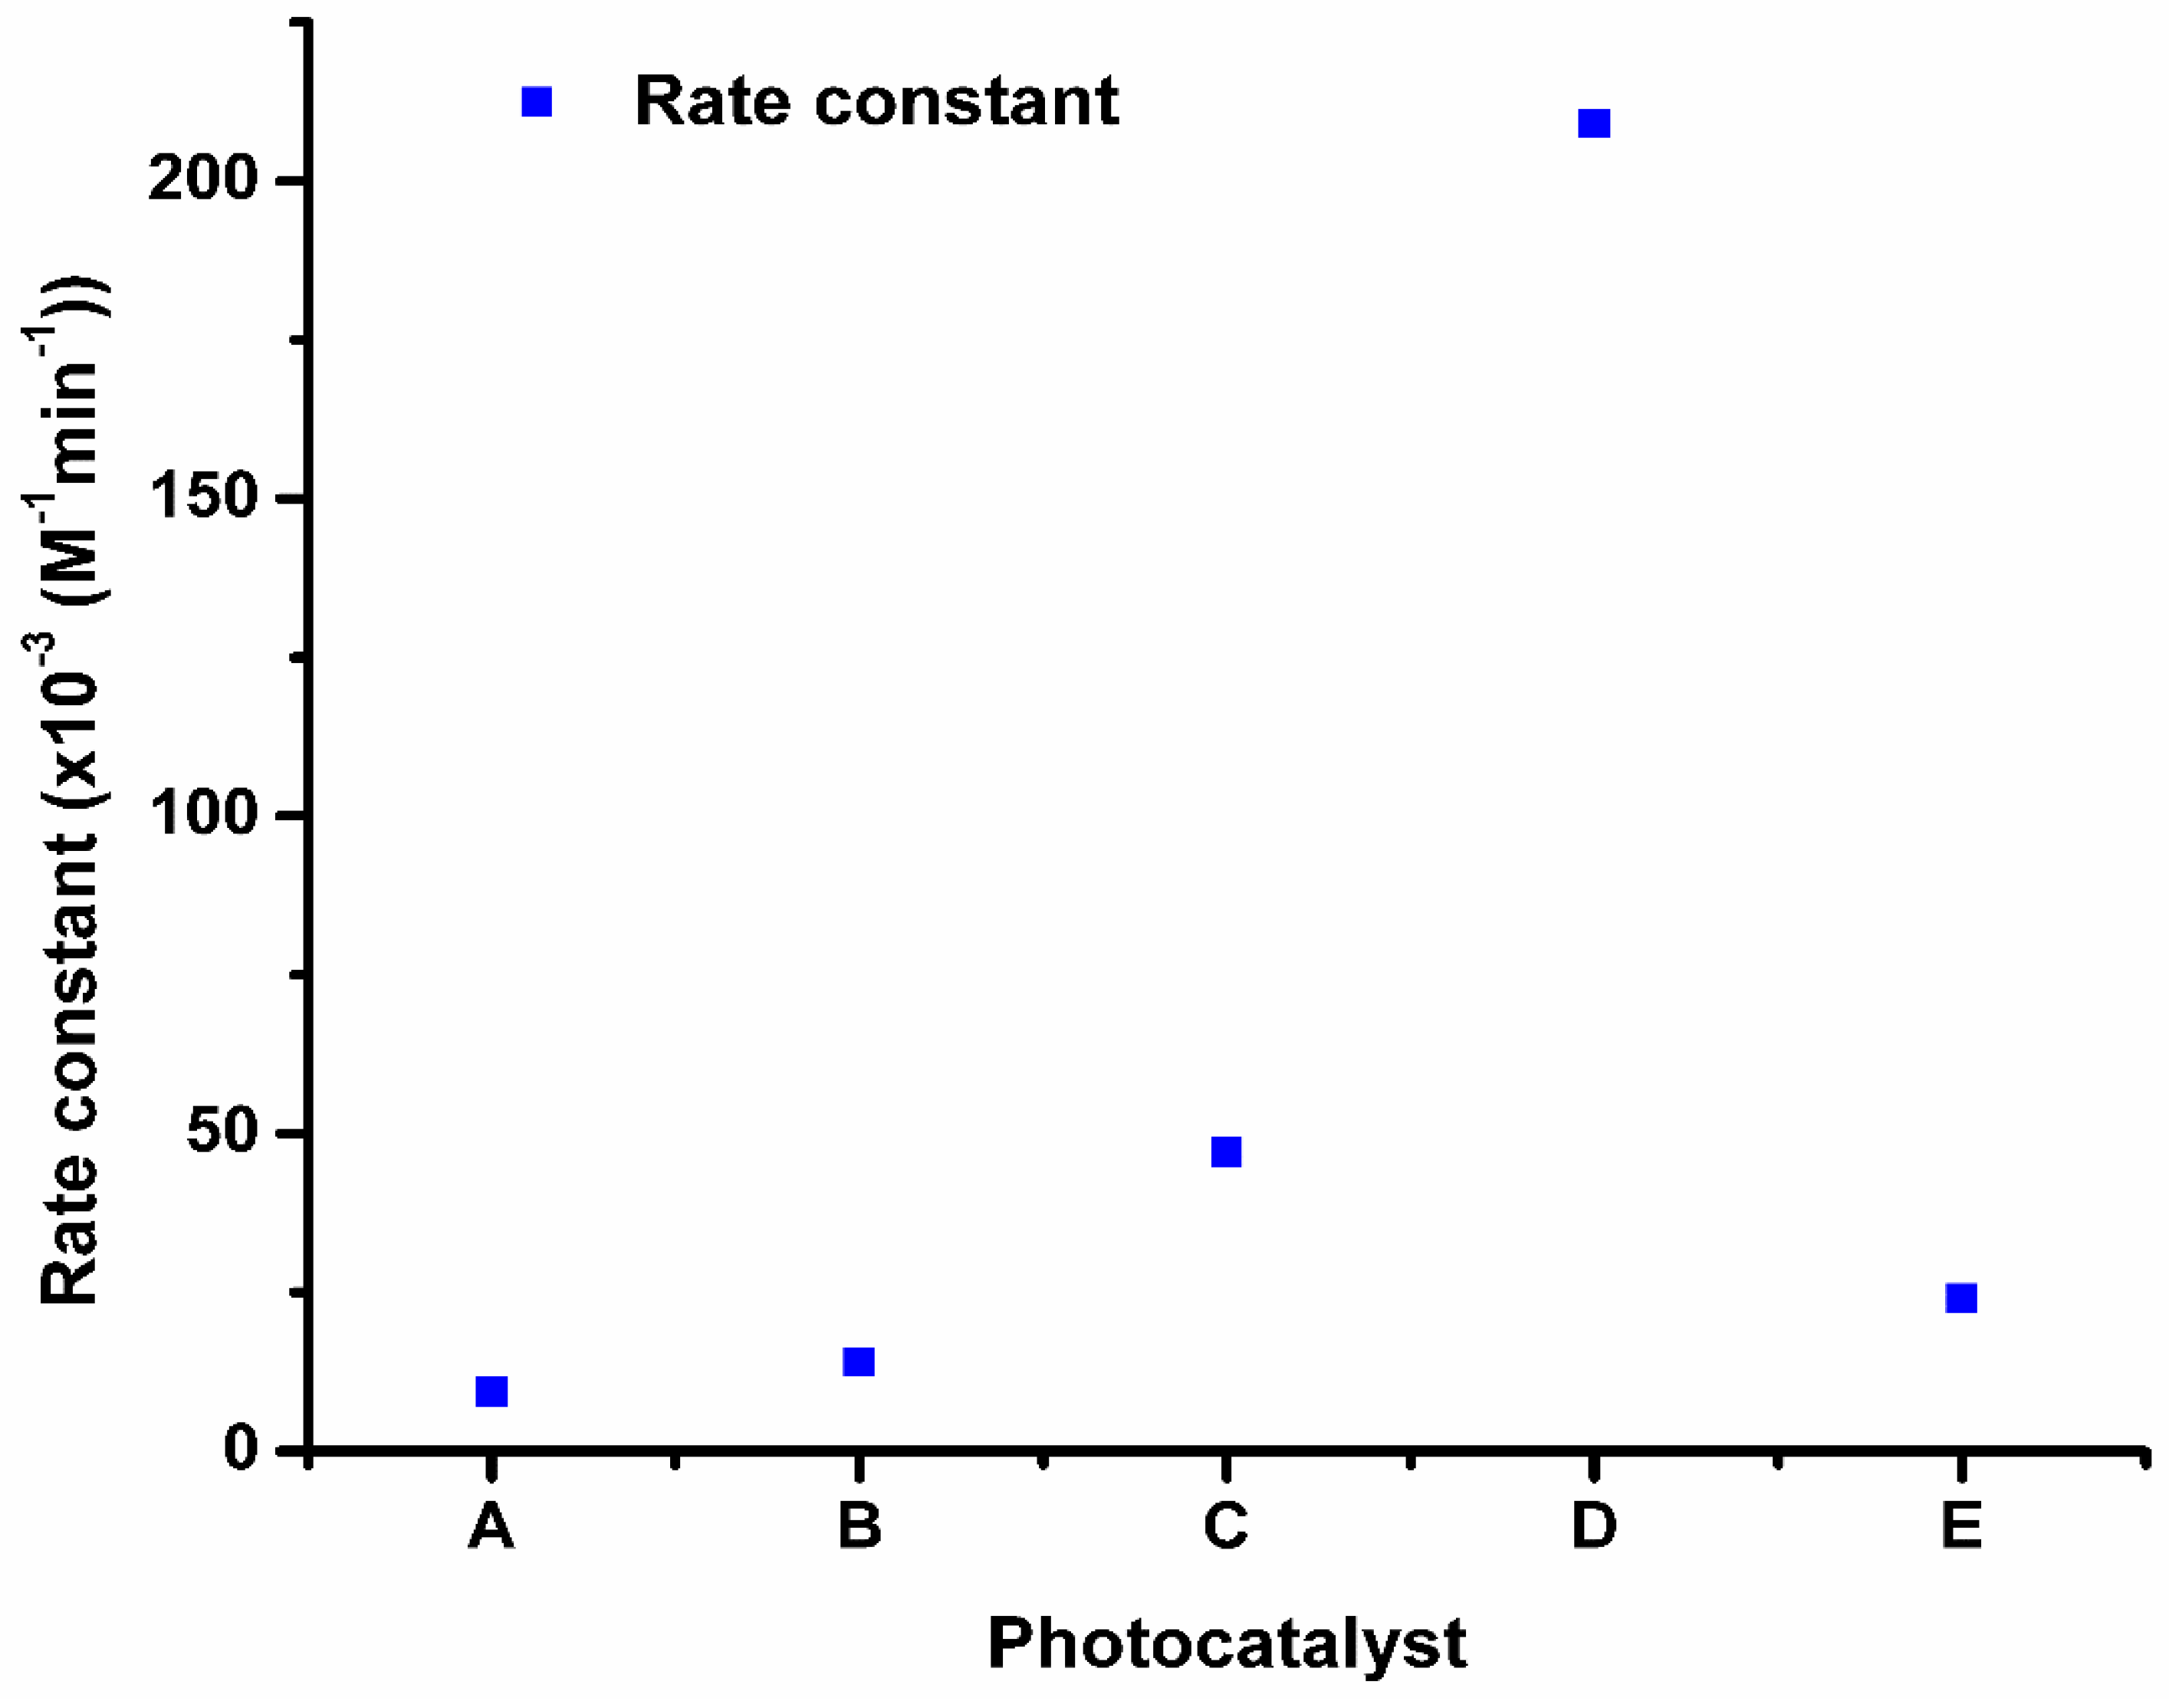
The reaction kinetics correspond to the percentage chlorpyrifos removal. The rate constants (K) of the reactions using the respective photocatalysts are presented (Figure 11), which were 9.3 × 10⁻³ M−1min−1 and 209 × 10−3 M−1min−1 for WO3 and Mn-WO3/SnS2, respectively.
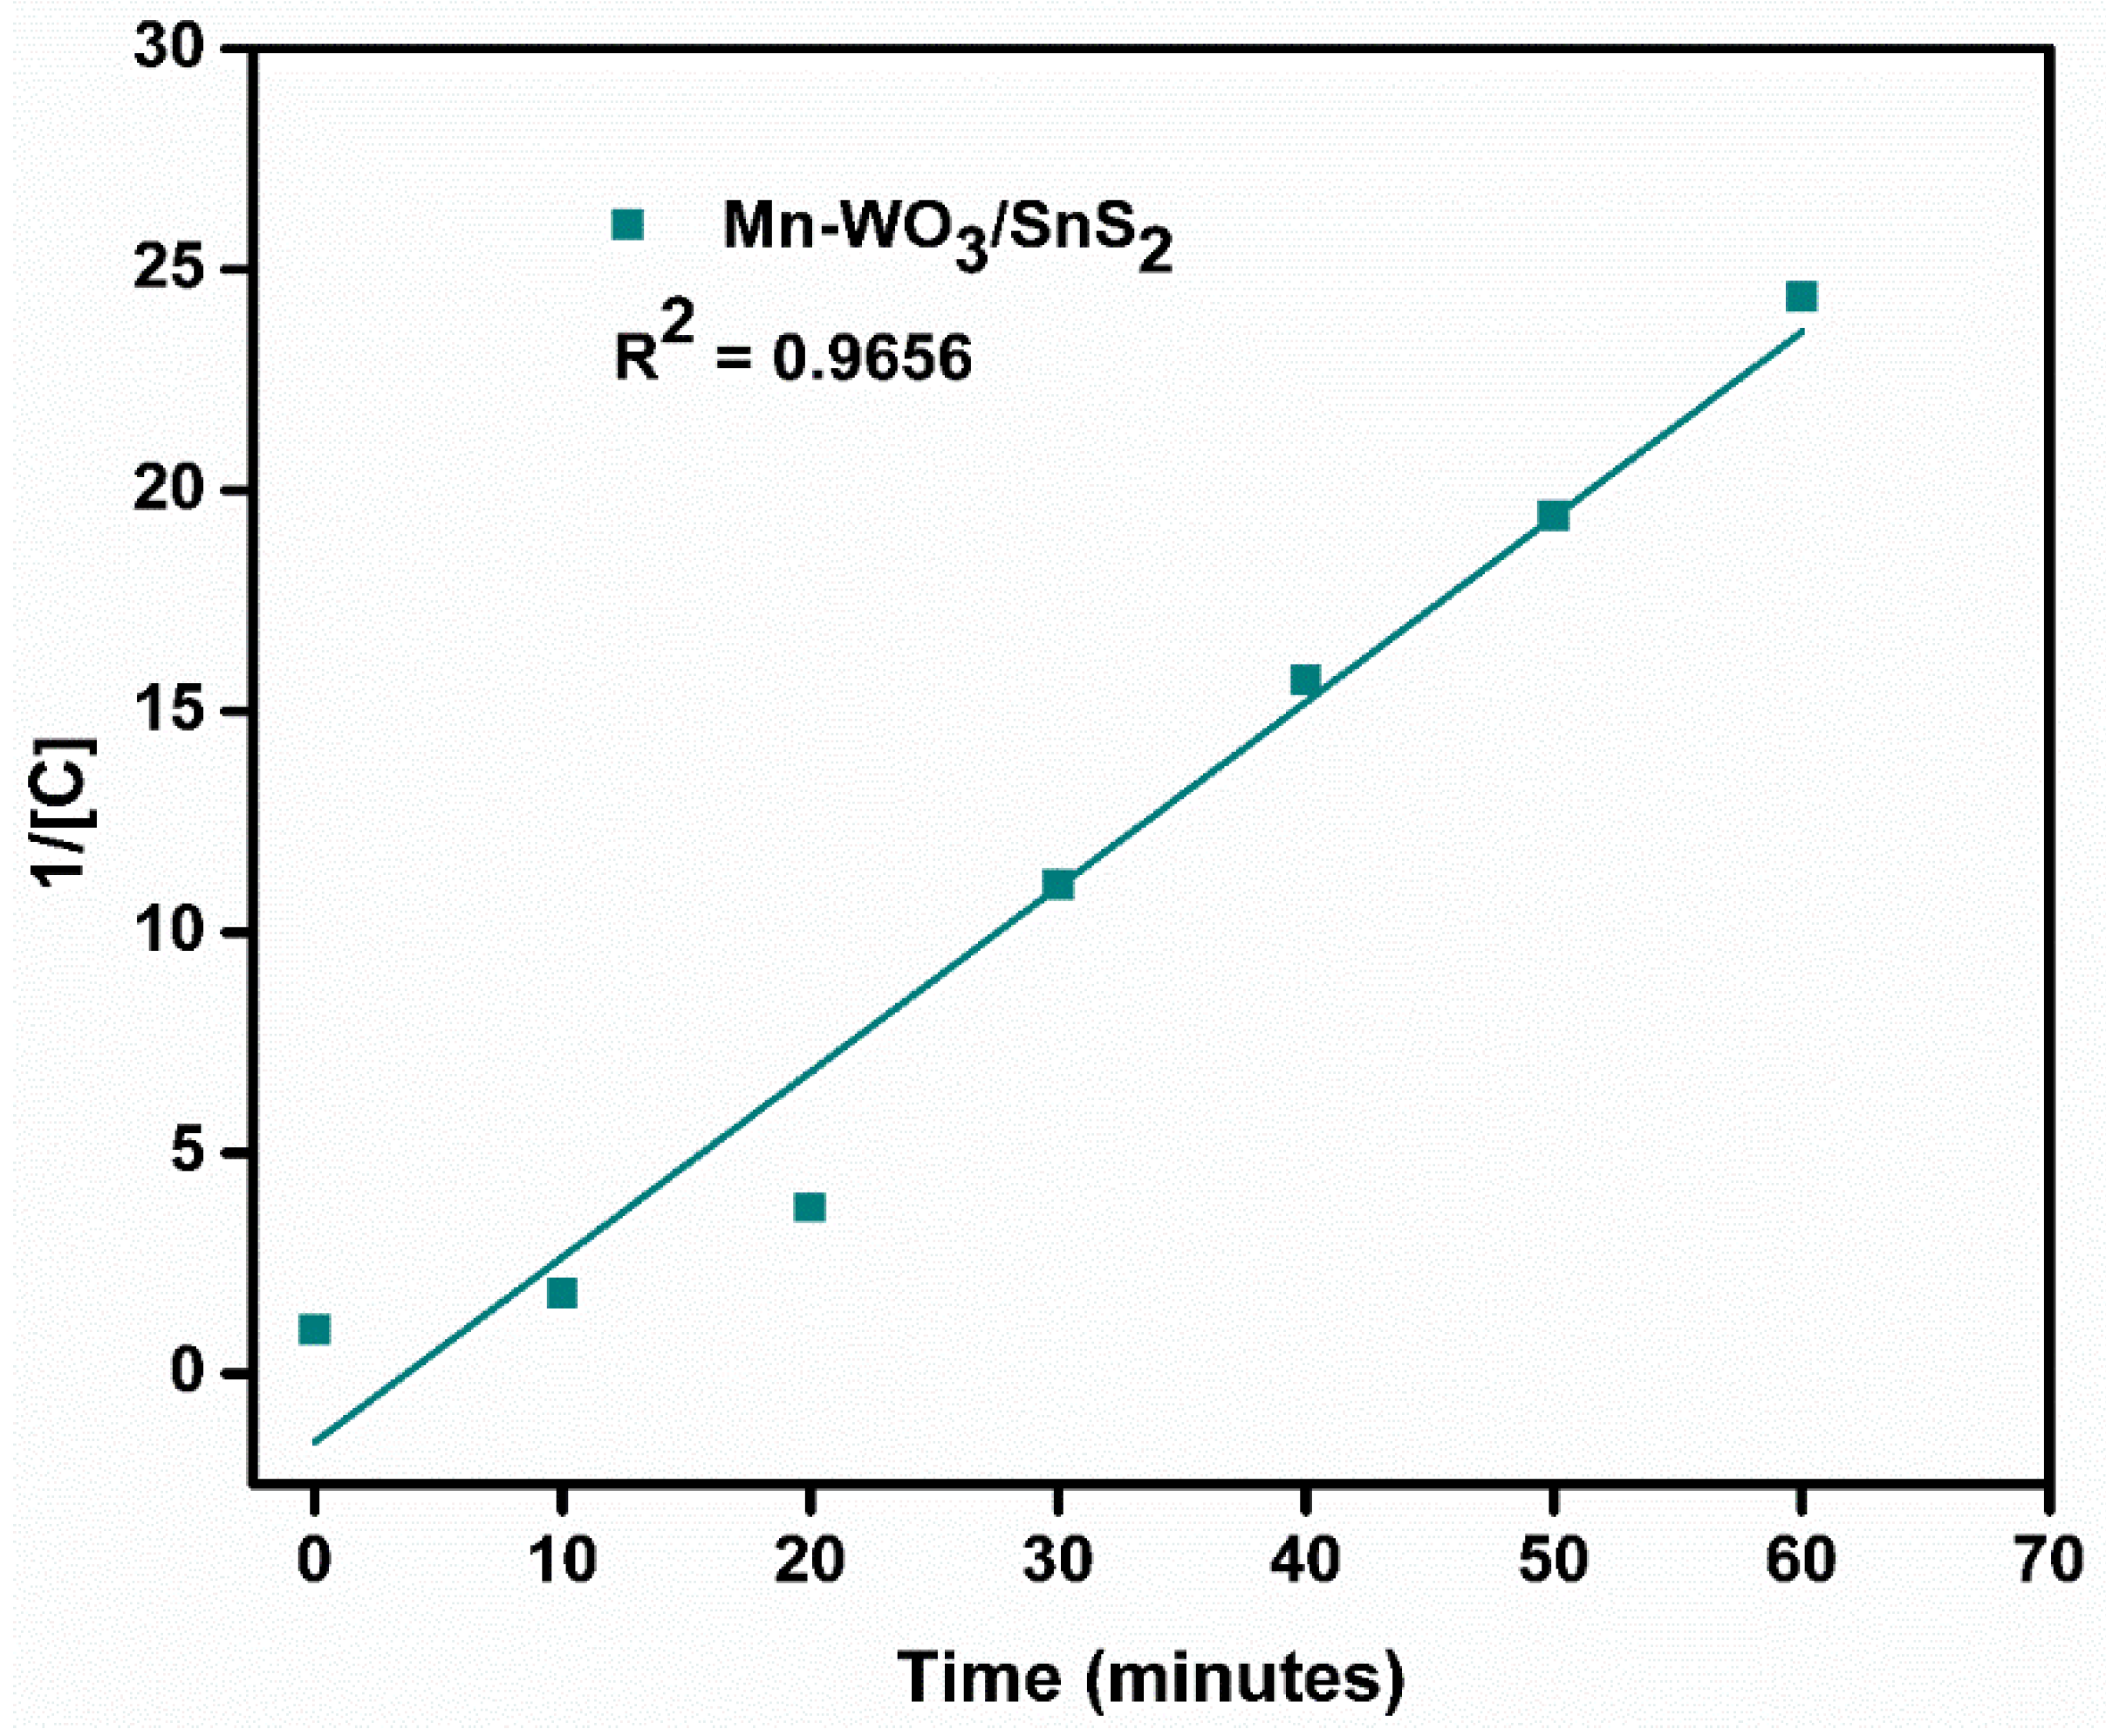
The photodegradation reaction was fitted to Equation (10) from which the rate constant k(M−1min−1) was calculated from the gradient of the plot of 1/[C] against time (t). The reaction kinetics leading to the determination of the rate constant followed a second order reaction pathway.
The rate constants were 9.3 × 10⁻³ M−1min−1, 14.3 × 10⁻³ M−1min−1, 25.0 × 10⁻³ M−1min−1, 47.4 × 10⁻³ M−1min−1 and 209.5 × 10⁻³ M−1min−1, corresponding to WO3, Mn-WO3, SnS2, WO3/SnS2 and Mn-WO3/SnS2, respectively (Figure 11).
The linear plot for the Mn-WO3/SnS2 nanoparticles kinetic studies is illustrated in Figure 12. The rate constant is 209.5 × 10⁻³ M−1min−1, and the R2 is 0.9656.
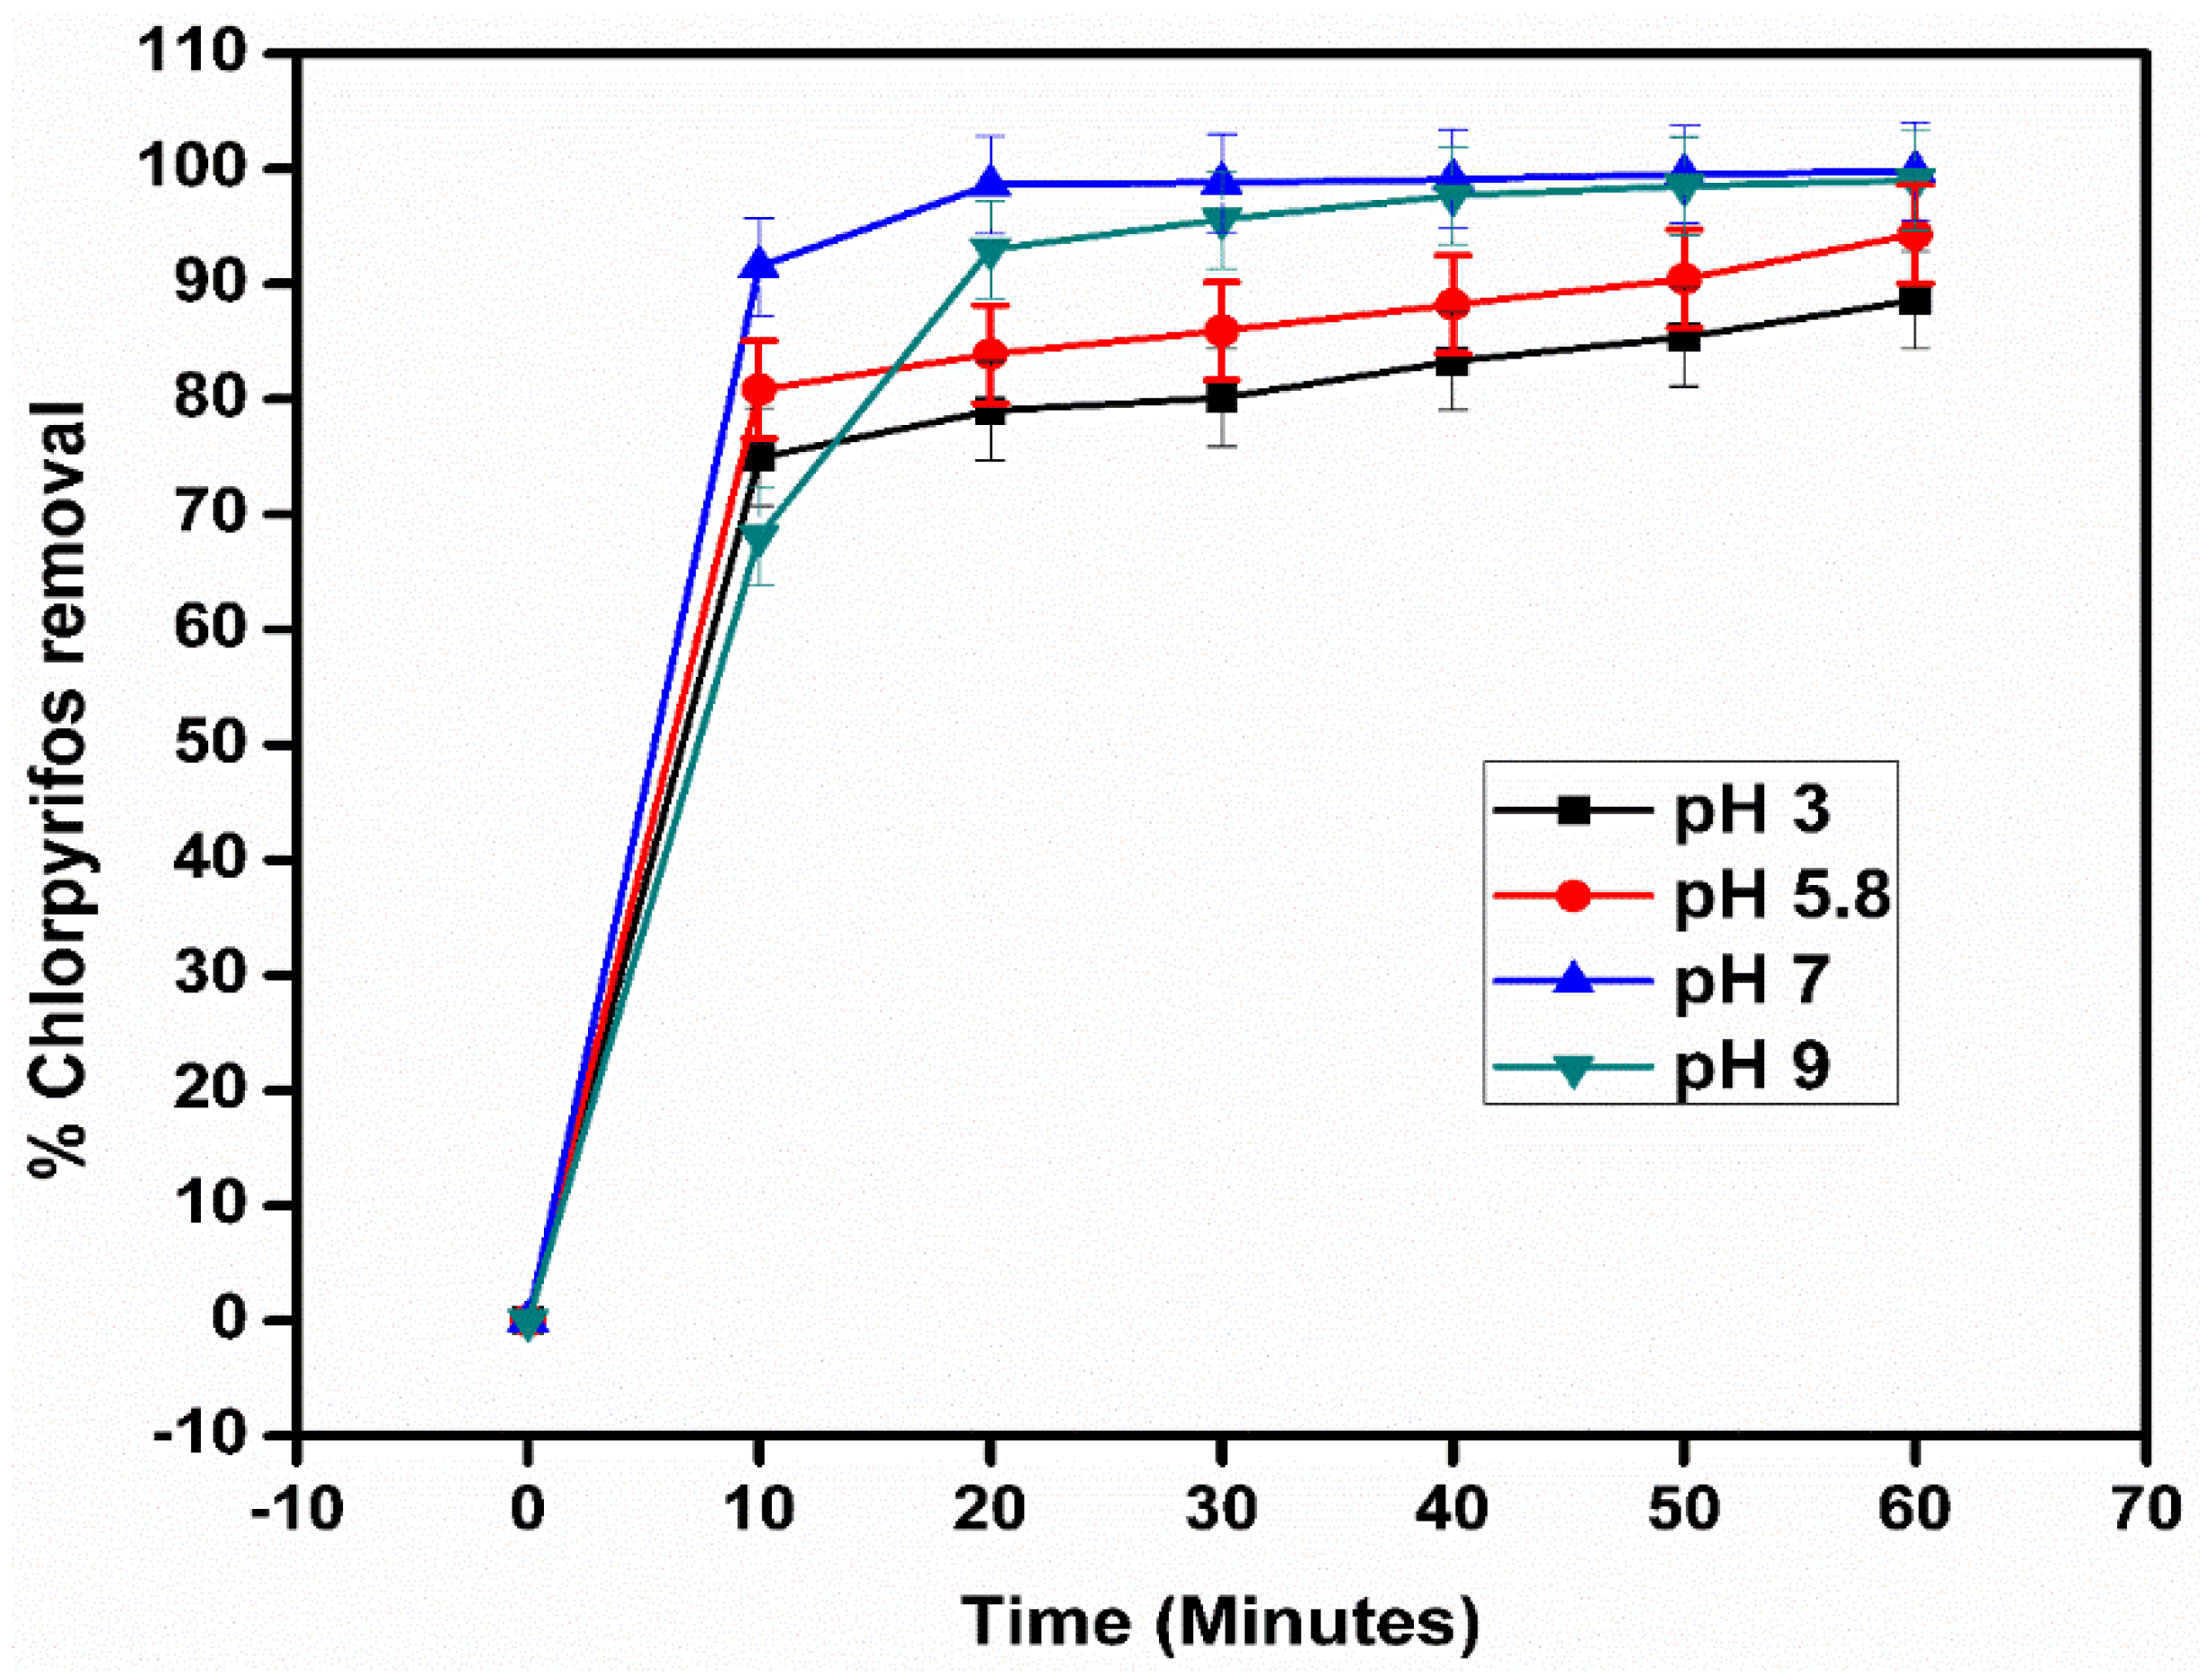
2.8. Effect of pH on the Photocatalytic Activity
The surface charge of the nanoparticles in a suspension is influenced by the pH of the solution. The photodegradation of chlorpyrifos using Mn-WO3/SnS2 nanoparticles increased with an increase in the pH of the initial solution, as illustrated in Figure 13. The point of zero charge for Mn-WO3/SnS2 is at pHpzc = 2.13 and above that is increasingly negative, as displayed by Equations (1) and (2).
M-OH + H+ = M-OH2+ (pH < pzc)
M-OH = M-O− + H+ (pH > pzc)
The increase in the removal was also caused by the increase in the level of deprotonation of the nanoparticles at high pH, which influences the negative charge on the surface of the photocatalyst, consequently leading to high chlorpyrifos adsorption. That was also favoured by the positive charge of chlorpyrifos in alkaline solutions from pH 5, as reported in literature. There is a transfer of holes from the inner part of the nanoparticles to the surface, whereby OH− ions scavenge photogenerated holes and therefore yield very oxidative species such as •OH radicals. The percentage removal of chlorpyrifos achieved in 60 min was 85.6%, 94.3%, 99.8% and 99.0% at pH 3, pH 5.8, pH 7 and pH 9, respectively (Figure 13). Therefore, pH 7 was the optimum pH for chlorpyrifos removal using Mn-WO3/SnS2 nanoparticles and was used in the next sections. Hou et al. [31] in 2018 also reported pH 7 for optimum chlorpyrifos removal [20].
The increase in the removal was due to the increased electrostatic attraction between the photocatalyst and the chlorpyrifos that occurs when the pH is increased [28]. This causes an easy surface attachment, which implies that holes can oxidize chlorpyrifos directly and creates hydroxyl and superoxide radicals for further oxidation. As pH increased, the surface charge of the nanoparticles also became more negative, which caused increased electrostatic attraction between the nanoparticles and chlorpyrifos.
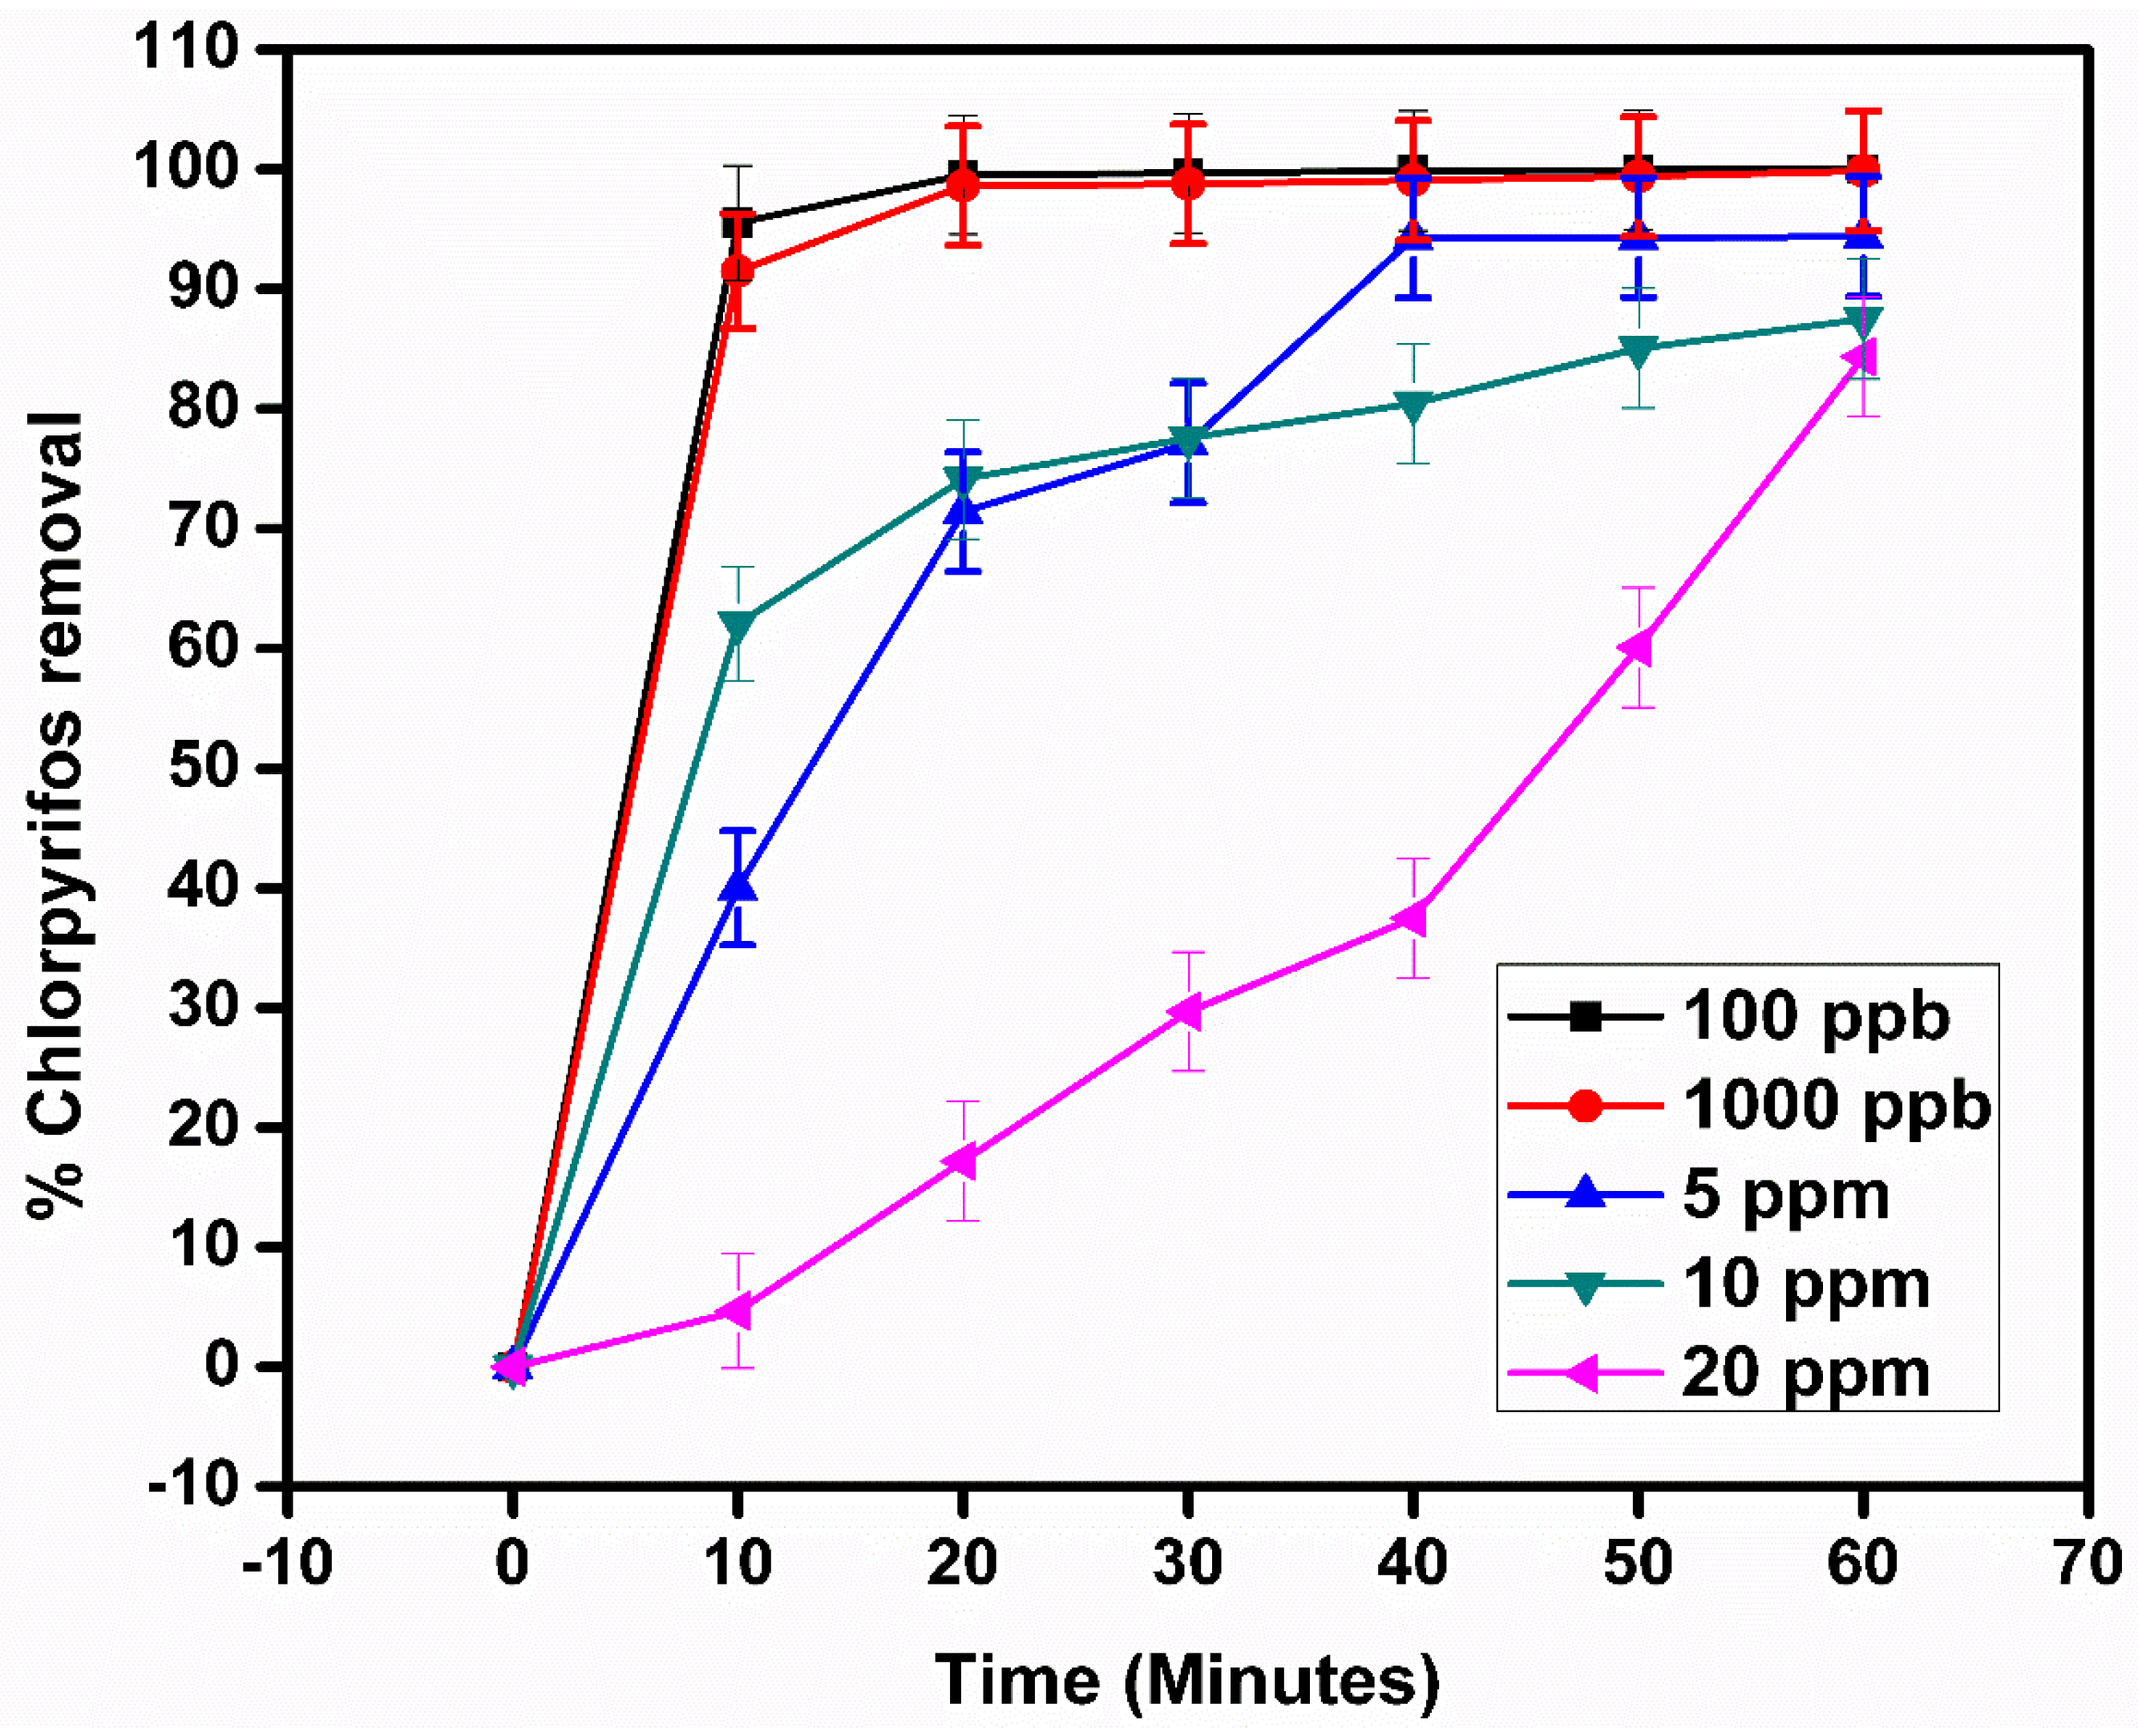
2.9. Effect of Initial Concentration
The effect of initial chlorpyrifos concentration on the photocatalytic removal was studied, and the results are shown in Figure 14. The highest removal of 99.99% was achieved at a 100 ppb chlorpyrifos concentration, followed by 99.95% at 1000 ppb, compared to 94.40%, 87.51% and 84.38% at 5 ppm, 10 ppm and 20 ppm, respectively. The concentration of 1000 ppb was chosen as the best, because it is the highest concentration for which a high percentage removal was achieved.
The decrease in the removal of chlorpyrifos was alluded to the opacity caused by the high chlorpyrifos concentration, which prevented the photocatalyst from utilising the irradiated light to produce reactive species for degradation. Again, the high concentration scatters the light, thereby inducing screening effects [28].
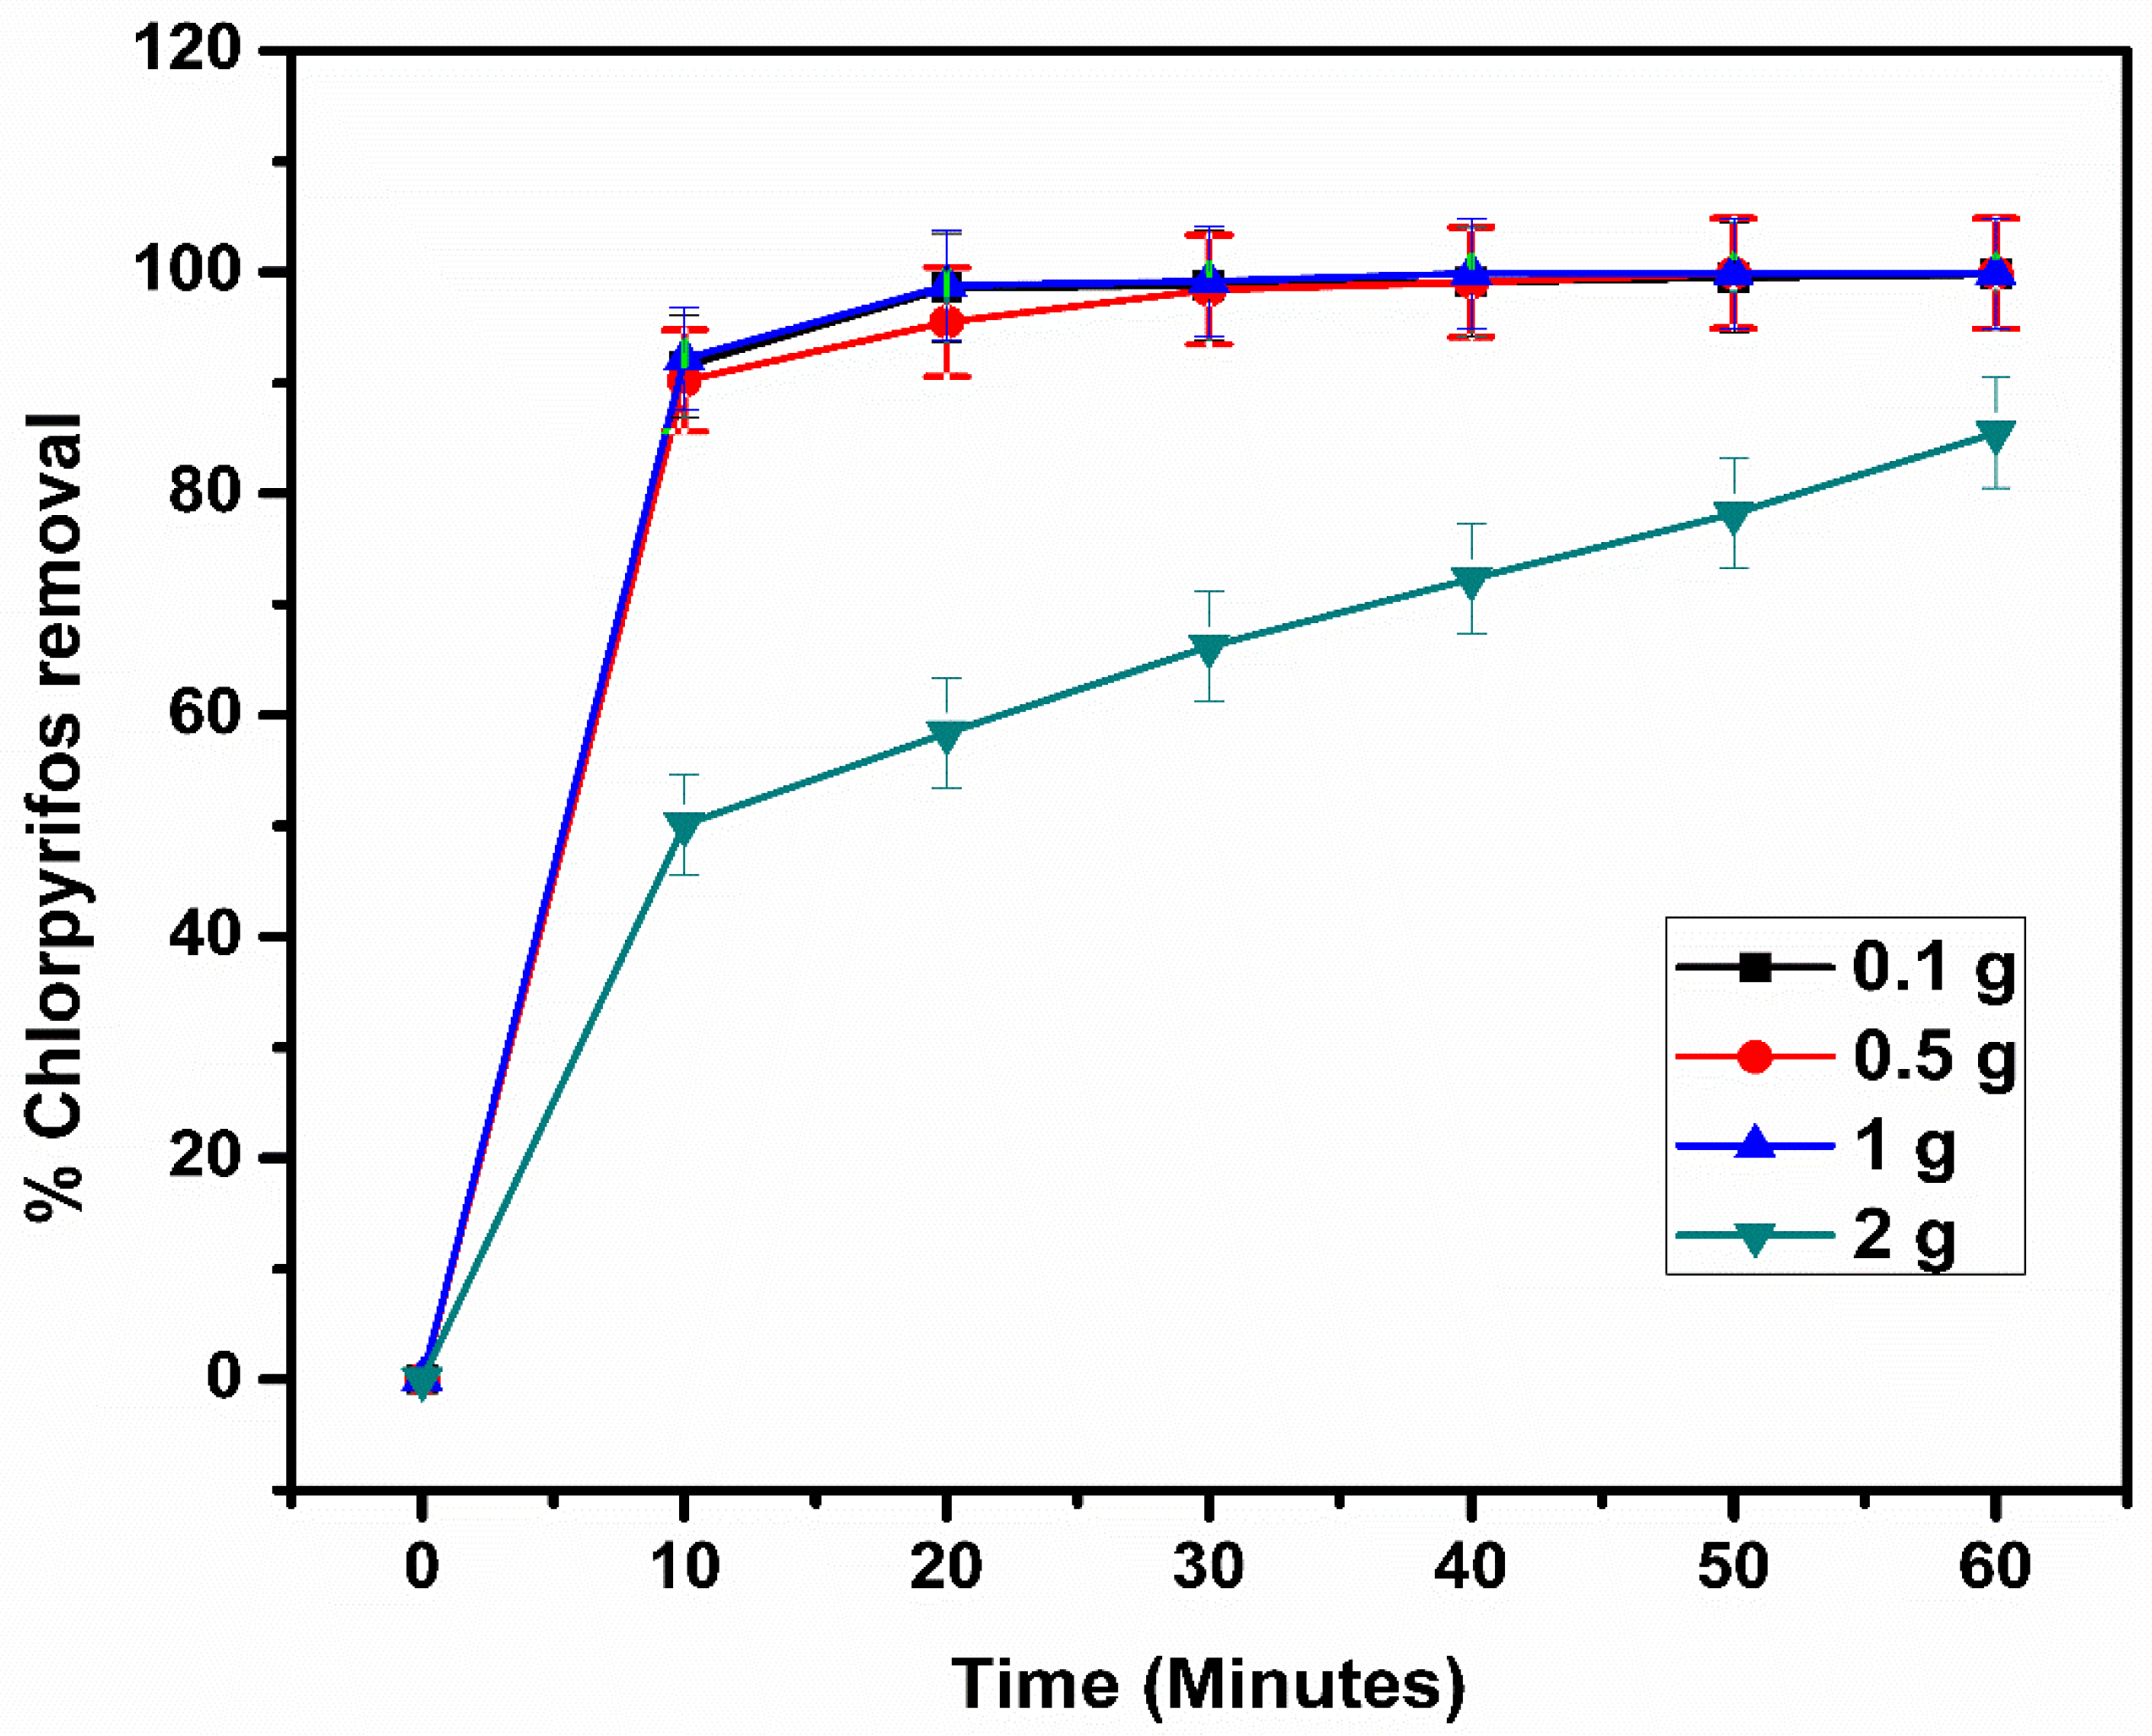
2.10. Effect of Initial Photocatalyst Loading
The initial photocatalyst loading’s effect on the photoactivity was studied, and the results are presented in Figure 15. The photoactivity of Mn-WO3/SnS2 increased when 0.5 g of photocatalyst was used, then further increased when the photocatalyst loading was 1 g. The increase is a result of increased reactive surfaces, which further increase the rate and amount of chlorpyrifos removal [28].
A high concentration of nanoparticles results in agglomeration, which further causes light scattering and screening effects, which reduce the specific activity of the photocatalyst. This further causes opacity, which prevents the further illumination of the photocatalyst.
Therefore, a decrease in chlorpyrifos removal was observed when 2 g of Mn-WO3/SnS2 was used, reaching up to 85%. This is compared to 0.1 g, 0.5 g and 1 g removing up to 99.95%, 99.98% and 99.99%, respectively. Thus, 1 g was the best performing, as it reached 98% removal within 30 min of reaction time.
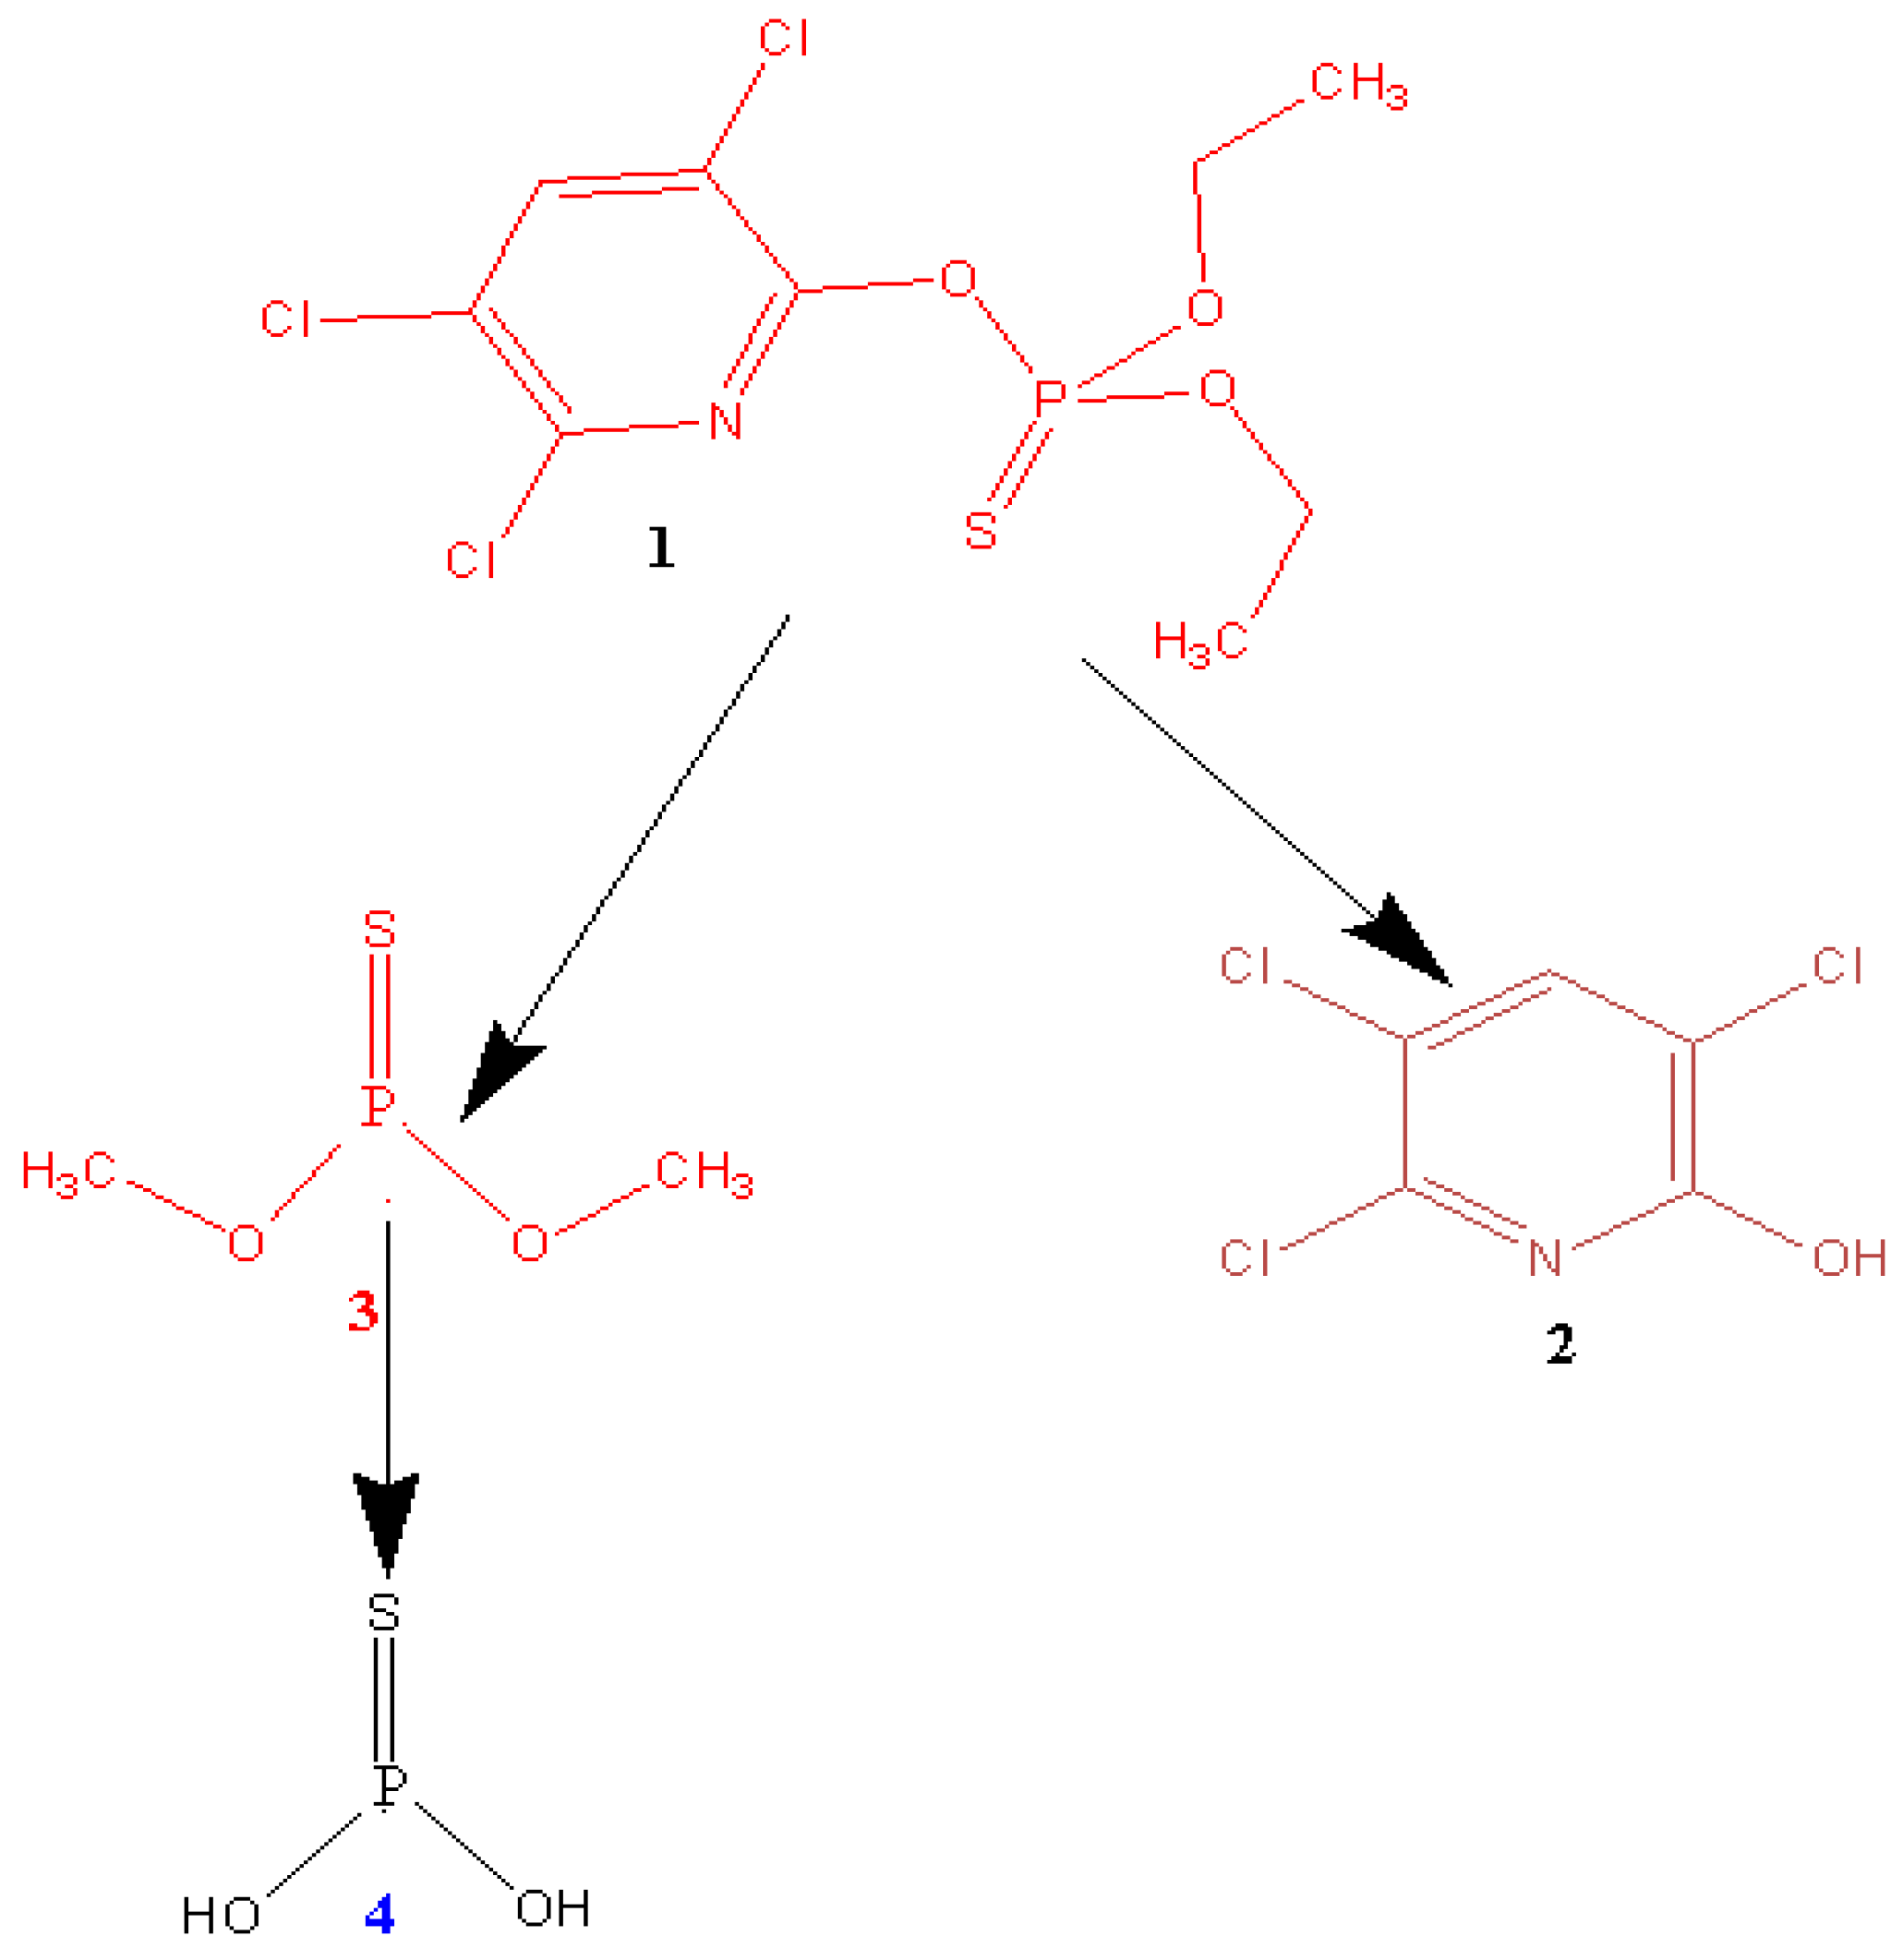
2.11. Mechanistic Pathway
The mechanistic and proposed degradation pathway was evaluated, and the results are shown in Figure 16. The products obtained were 3,5,6-trichloropyridin-2-ol (TCP) and O,O-dihydrogen phosphorothioite. Only the O,O-dihydrogen phosphorothioite compound and no other by-product was observed, which implies that there was a complete degradation of chlorpyrifos and TCP in the synthetic water (Figure S7).
3. Materials and Methods
3.1. Materials
Tungsten boride (WB) (≥97.0%), Tin(IV) chloride pentahydrate (SnCl4.5H2O, (98%)), manganese(II) chloride tetrahydrate (MnCl2•4H2O, (≥98%)), nitric acid (≥65%, Puriss), poly (vinylidene fluoride) (PVDF), N-methyl-2-pyrrolidone (NMP), silver paste, sodium sulphate (Na2SO4), silver/silver chloride (Ag/AgCl) electrode, sodium sulphide (Na2S), chlorpyrifos (PESTNATAL, 99.9%), methanol and formic acid were all supplied by Sigma-Aldrich (Pty) Ltd., Johannesburg, South Africa. The chemicals were used as received.
Synthesis of Nanomaterial
Pristine WO3 NPs were synthesised following the method developed by Xie et al. (2012) with slight modification [3]. Tungsten boride (4.12 mmol) was dissolved in 1 M HNO3 (56.0 mL) under constant stirring and then transferred into a 100.0 mL Teflon-lined stainless steel autoclave. The autoclave was then sealed and placed in an oven at 190 °C for 12 h with a heating rate of 16 °C per hour; thereafter, a yellow solution was obtained. The yellow solution was further centrifuged and washed with deionised water and dried at 100 °C for 12 h in an oven, resulting in a yellow solid product of WO3. The same procedure was followed to obtain Mn-WO3 via the one-pot synthesis of MnCl2•4H2O (10.00 mmol) with WB (4.12 mmol) in 56.0 mL of HNO3.
Pristine SnS2 NPs were synthesised by dissolving 2.73 mmol of SnCl4.5H2O in 40.0 mL of deionised water under continuous stirring at 60 °C for 10 min. Thereafter, Na2S (2.73 mmol) was added to the solution, and the mixture was then stirred for 10 min. The final mixture was then transferred into a 100.0 mL Teflon-lined stainless steel autoclave and heated at 180 °C for 12 h with a heating rate of 15 °C/h. The resultant solution was then centrifuged and washed with deionised water and dried at 100 °C for 12 h to obtain SnS2 nanoparticles.
The heterojunction WO3/SnS2 was synthesised stepwise using a hydrothermal method. The first step was adapted from the method for synthesising pristine WO3 and followed by the synthesis of SnS2 NPs on the surface of the dispersed WO3 NPs in 40.0 mL of deionised water. The SnS2 synthesis was adopted from the synthesis of pristine SnS2 NPs to obtain the heterojunction (WO3/SnS2).
Furthermore, the synthesis of the Mn-doped heterojunction WO3/SnS2 was carried out using hydrothermal treatment in a multistep method. Firstly, MnCl2•4H2O (10.0 mmol) and tungsten boride (4.12 mmol) were dissolved in 1 M HNO3 (56.0 mL) under constant stirring, and thereafter, the same procedure as in the synthesis of WO3 was followed to obtain a yellow solid product of Mn-WO3. Furthermore, Mn-WO3 (1.74 mmol) was dispersed in 40.0 mL of deionised water under continuous stirring and heating at 60 °C using a magnetic stirring hotplate. This was followed by the synthesis of SnS2 NPs on the surface of Mn-WO3 NPs adopted from the synthesis of pristine SnS2 nanomaterials to form Mn-doped WO3/SnS2 heterojunction composite nanoparticles.
3.2. Characterization Techniques
The synthesised nanoparticle phases were characterized using X-ray powder diffraction (XRD) (PANalytical X’Pert Pro-MPD Powder Diffractometer, Almelo, Netherlands) with CuKα radiation (0.1540 nm) and a monochromator beam in a 2θ scan range from 20°–80°. The instrument power settings used were 40 kV and 40 mA with a step size of 2θ (0.0080) and a scan step time of 87.63 s. The average crystallite size was calculated using the Debye–Scherrer equation, Equation (3):
where β is the full width at half maximum, λ is the X-ray wavelength (0.1541 nm) for CuKα, K = 0.89, and θ is the diffraction angle.
Raman spectroscopy (RamanMicro™ 200 PerkinElmer Inc., Waltham, MA, USA) with a single monochromator, a holographic notch filter and a cooled TCD, was used to detect and characterise the polymorphic forms of the NPs. The Raman spectra of the NPs were measured in a back-scattering geometry using an Ar-ion laser line (514.5 nm). Dark-field imaging was used with a power output of below 0.5 mW and an exposure time of 4.0 s. The morphological properties of the NPs were examined using high resolution transmission electron microscopy (HRTEM) (JOEL-TEM 2010) at an acceleration voltage of 200 kV. The ethanol-dispersed nanoparticles were deposited on a carbon-coated copper grid. Furthermore, selected area electron diffraction (SAED) images of the nanoparticles were captured and indexed using the CrysTBox software [29]. A field emission scanning electron microscope (FESEM) (TESCAN Vega TC instrument with VEGA 3 TESCAN software; TESCAN, Brno, Czech Republic) coupled with energy-dispersive X-ray (EDX) operated at 5.0 kV under a nitrogen gas atmosphere was used to further study the morphology and the elemental composition of the NPs. The optical properties were investigated using a UV-Vis spectrophotometer (Shimadzu UV-2450, Shimadzu Corporation, Kyoto, Japan) using diffuse reflectance spectroscopy (DRS) and BaSO4 as the reference material. The band gap (Eg) of the nanomaterials and a graph of (αhν) against photon energy (hν) was extrapolated following Equation (4):
where α is the absorption coefficient, hν is the energy of the incident photon, A is a constant, and Eg is the band gap energy.
αℎν = A(ℎν − Eg)n/2
The value of n depends on the semiconductor transition type, which is a direct transition when n equals 0.5 and an indirect transition when n equals 2. The valence band edge potential (EVB) and the conduction band edge potential (ECB) were calculated using Equations (5) and (6):
where ECB and EVB are the conduction and valance band edge potentials, respectively; χ is the electronegativity of the semiconductor (the geometric mean of the electronegativities of all the constituent atoms); Ee is the energy of free electrons on the hydrogen scale (4.5 eV); and Eg is the band gap energy of the semiconductor.
ECB = χ − Ee − 0.5Eg
EVB = ECB + Eg
The photoluminescence spectra of the nanomaterials were obtained using a PerkinElmer fluorescence spectrometer (Model LS 45, PerkinElmer Inc., Waltham, MA, USA). A 300 W xenon lamp was used as a light source. The spectra were obtained at an excitation wavelength of 319 nm. The excitation and emission wavelengths were set at 319 nm and 605 nm, respectively. Specific surface area and pore volumes were determined using the Brunauer–Emmett–Teller (BET) method. Nitrogen was used as the adsorbate, and the nitrogen adsorption isotherms of the samples were obtained at 77K using a Micromeritics ASAP 2020 adsorption analyser (Micromeritics Instrument Corporation, Norcross, Georgia, USA). The samples were degassed before the analysis at 100 °C for 10 h. The pore volume was calculated from the amount of nitrogen adsorbed at the relative pressure (P/Po) of 0.980.
3.3. Electrochemical Measurements
The electrochemical measurements were conducted using a potentiostat (Gamry Interface 1000 potentiostat, Gamry Instruments, Philadelphia, PA, USA) in a standard three-electrode system employing Ag/AgCl (3.0 M KCl) as the reference electrode and Pt wire as the counter electrode. The working electrodes were the prepared nanomaterial mixed with polyvinylidene fluoride (PVDF) as a binder in a 10:1 ratio respectively, dispersed in 1 mL of N-methylpyridinium (NMP) solution and ultrasonicated for 30 min to obtain a homogeneous mixture. The obtained homogeneous mixture was drop casted onto the fluorine-doped titanium oxide (FTO-glass) substrate forming a thin film. The prepared electrodes were heated at 80 °C for 12 h in air. A copper wire was thereafter attached using a silver paste for charge transfer to the potentiostat from the paste and dried in air for 24 h.
The prepared electrodes were then applied in a three-electrode system for electrochemical impedance spectroscopy (EIS) at a frequency range of 10 kHz to 0.1 Hz at an AC voltage of 10 mV rms and DC voltage of 0.45 V vs. Ag/AgCl. The current density of the working electrode was determined by running a linear sweep voltammetry scan at a scan rate of 50 mV/s. The flat-band potential (Vfb) values of the nanomaterials were obtained from Mott–Schottky plots (Equation (7)) at a frequency of 1000 Hz under the applied voltages of −2 to 2 V and a step voltage of 0.1 V.
where C is the interfacial capacitance, A is the surface area of the electrode, ND is the donor density, V is the applied potential, and Vfb represents the flat-band potential. The temperature with dielectric constant and permittivity of free space are represented as T, ε and ε0, respectively. The charge of the electron (e) is 1.602 × 10⁻¹⁹ C, and the Boltzmann constant (kB) is 8.617 × 10⁻⁵ eV·K−1. All the electrochemical measurements were conducted in 0.1 M sodium sulphate (Na2SO4) solution as the electrolyte, and the values for the electrode potentials were recorded with reference to Ag/AgCl. A 300 W xenon lamp was used as the light source.
3.4. Surface Charge
Surface charge measurements were obtained using electrophoretic light scattering (ELS) with a Zetasizer NanoZS (Malvern) instrument. Zeta potential measurements were obtained using electrophoretic light scattering (ELS) to understand the surface charge of the nanomaterials as a function of the pH of the solution. The nanomaterials were suspended at 30 mg/L in deionized (DI) water. The pH of the suspensions was adjusted to a pH range of 2–10 using 1M NaOH and 1M HCl.
3.5. Degradation of Chlorpyrifos
3.5.1. Chlorpyrifos Standard Preparations
A stock solution of Chlorpyrifos (0.01 g) was prepared in 1 L of deionized water, followed by a serial dilution to make 75, 50, 25, 12.5, 6.25, and 3.125 ppb solutions. The prepared solutions were thereafter transferred into 2 mL LC-MS vials, and 1 mL of deionized water was added. The working solution was maintained at pH 5.
3.5.2. Photocatalytic Degradation of Chlorpyrifos
The photocatalytic activity of the nanomaterials was tested through the photodegradation of chlorpyrifos in synthetic water samples under visible light irradiation (Photoreactor, Lelesil Innovative Systems). The volume of the working solution was kept at 500 mL of chlorpyrifos solution. Initially, the concentration of the chlorpyrifos solution was 1 ppm and a photocatalyst loading of 0.1 g was used at pH 5. The photodegradation reaction occurred under continued magnetic stirring for 90 min under regulated temperatures of 20–25 °C, subjected to a cooling jacket using ice cubes.
The photocatalyst suspension containing chlorpyrifos was kept in the dark for 30 min before irradiation to allow equilibration. The samples were collected from the batch reaction before and after irradiation at set time intervals (10 min, 10 mL aliquots), filtered through a 0.45 µm PTFE membrane filter and transferred into a 2 mL LC-MS sample vial for analysis.
Furthermore, the optimization of reaction conditions such as the pH, initial chlorpyrifos concentration and initial photocatalyst loading were carried out. Therefore, the pH of the chlorpyrifos solution was adjusted to 3, 5, 7 and 9; the initial concentration of the pesticide (chlorpyrifos), to 100 ppb, 1 ppm, 5 ppm, 10 ppm and 20 ppm; and the photocatalyst loading, to 0.1, 0.5, 1 and 2 g.
3.6. LC-MS Measurement
Samples were analyzed using a triple quad UHPLC-MS/MS 8030 (Shimadzu Corporation) to monitor the removal of chlorpyrifos. The LC-MS/MS was fitted with a Nexera UHPLC upgrade with the capability to obtain 500 multiple reaction monitoring readings per second. The oven was equipped with a RaptorTM ARC-18 column (Restek Corporation) with a 2.7 μm pore diameter and length of 100 mm × 2.1 mm, maintained at 40 °C. The mobile phase consisted of 0.1% formic acid in water/methanol (9:1%, v/v) at a flow rate of 0.200 mL/min with a 10 μL injection volume. The ion source was electrospray ionisation (ESI) and was operated in positive mode. Meanwhile, LC-MS/MS data for the degradation intermediates were obtained after the full scan mode was run for 12 min at flow rate of 0.3 mL/min.
The percentage removal of chlorpyrifos from the synthetic water samples was calculated using Equation (8) below:
where C0 is the initial concentration and C is the final concentration of chlorpyrifos. The degradation products were determined by analysing the samples for a period of 60 min. The degradation pathway was then deduced from the mass/ion ratio obtained from the MS spectrum. The reaction kinetics of chlorpyrifos degradation were studied, the results were fitted to a second order model fitted, and a plot based on the calculated (1/[C]) versus reaction time was obtained following Equation (7).
where k is the rate constant, t is time taken for the reaction, [C]t is the concentration of chlorpyrifos when time is equal to t, and [C]0 is the initial concentration of chlorpyrifos. The reaction rate is thus given by Equation (10):
4. Conclusions
The Mn-doped WO3/SnS2 photocatalyst was successfully synthesized, resulting in a highly crystalline structure. Rectangular rods and sheet-like shapes were observed in the composite, confirming that no shape distortion had occurred in the heterojunction photocatalyst. The composite comprises both hexagonal and monoclinic phases that correspond to SnS2 and WO3, respectively, as confirmed by XRD patterns and Raman spectra. As shown in the UV-Vis spectra of the composite, a shift in the band edge (absorption band edge) from the UV to the visible region (red shift) was observed in the Mn-doped WO3/SnS2 photocatalyst relative to that for the pristine photocatalysts. The surface area of the WO3 was improved by more than 10 times by intrinsic doping with the Mn2+ ion and the formation of the heterojunction with SnS2 to form the Mn-doped WO3/SnS2 photocatalyst. The Mn-doped composite was fully characterised using microscopic and spectroscopic techniques, which confirmed the synthesised composite to be Mn-WO3/SnS2. The Mn-doped WO3/SnS2 showed good electrochemical performance, ascribed to its high current density and lower interfacial charge transfer resistance, observed using electrochemical measurements (EIS), which correspond to high charge separation and a low photogenerated charge carrier recombination rate, observed using photoluminescence (PL) measurements. Chlorpyrifos has been applied extensively in agriculture, both in South Africa and other parts of the world, to fight against pests, therefore finding its way into water systems. Chlorpyrifos removal from synthetic water was investigated using Mn-WO3/SnS2 nanoparticles. The removal was due to the enhanced charge separation, high charge transfers and high electrostatic attraction between the nanoparticles and chlorpyrifos.
After the optimization of the reaction conditions, the chlorpyrifos removal achieved was 99.99% at pH 7 with 1 g of Mn-WO3/SnS2 and a 1000 ppb concentration.
The degradation pathway was also investigated, for which 3,5,6-trichloropyridin-2-ol and O,O-dihydrogen phosphorothioite were observed. Furthermore, after 60 min of the reaction, only O,O-dihydrogen phosphorothioite was detected. This implies that both chlorpyrifos and TCP were completely degraded. The results suggest that our material, Mn-WO3/SnS2, can completely degrade chlorpyrifos and its major degradation product.
Supplementary Materials
The following are available online at https://0-www-mdpi-com.brum.beds.ac.uk/2073-4344/10/6/699/s1, Table S1: Average crystallite sizes of nanomaterials; Figure S2: (a) FESEM image of pristine Mn-WO3, (b) TEM image of Mn-WO3, (c–e) elemental mapping, and (f) EDX spectrum of Mn-WO3 nanoparticles; Figure S3: (a) FESEM image of pristine SnS2, (b) TEM image of SnS2 (inset is the corresponding SAED image), (c,d) elemental mapping, and (e) EDX spectrum of SnS2 nanoparticles; Figure S4: Absorption spectra of WO3, SnS2, Mn-WO3, WO3/SnS2, and Mn-WO3/SnS2; Figure S5: EIS spectra showing the fitted spectra when obtaining the Randles circuit for (a) WO3 and Mn-WO3, and (b) SnS2, WO3/SnS2 and Mn-WO3/SnS2; Figure S6: (a–e) N2 adsorption-desorption isotherm of (a) WO3, (b) Mn-WO3, (c) Mn-WO3/SnS2, (d) WO3/SnS2, and (e) SnS2 (insets are pore volume graphs); Figure S7: Calibration curve of chlorpyrifos standards from 3.125 to 75 ppb; Figure S8: Mass spectra showing m/z ratios from 0 to 60 min; Figure S9: Fitted second order reaction kinetics graphs of the nanoparticles.
Author Contributions
Conceptualization, L.N.D., methodology, C.M.K.; validation, L.N.D., S.P.M. and C.M.K.; formal analysis, C.M.K.; investigation, C.M.K.; resources, L.N.D.; data curation, C.M.K.; writing—original draft preparation, C.M.K.; writing—review and editing, L.N.D., S.P.M.; supervision, L.N.D., S.P.M.; project administration, L.N.D.; funding acquisition, L.N.D. All authors have read and agree to the published version of the manuscript.
Funding
This research was funded by THUTHUKA NATIONAL RESEARCH FOUNDATION, grant number 15060-9119-027” and “The APC was funded by UNIVERSITY OF JOHANNESBURG-Accelerated Academic Mentorship Programme”.
Acknowledgments
The authors would like to extend their gratitude to the University of Johannesburg, Faculty of Science, National Research Foundation (NRF) (TTK 15060-9119-027), TESP Eskom and the Centre for Nanomaterials Science Research, University of Johannesburg.
Conflicts of Interest
The authors declare no conflict of interest.
References
- Dong, P.; Hou, G.; Xi, X.; Shao, R.; Dong, F. WO3-based photocatalysts: Morphology control, activity enhancement and multifunctional applications. J. Environ. Sci. Nano 2017, 4, 539–557. [Google Scholar] [CrossRef]
- Marschall, R. Semiconductor composites: Strategies for enhancing charge carrier separation to improve photocatalytic activity. Adv. Funct. Mater. 2014, 24, 2421–2440. [Google Scholar] [CrossRef]
- Xie, Y.P.; Liu, G.; Yin, L.; Cheng, H.M. Crystal facet-dependent photocatalytic oxidation and reduction reactivity of monoclinic WO3 for solar energy conversion. J. Mater. Chem. 2012, 22, 6746. [Google Scholar] [CrossRef]
- Mahlalela, L.C.; Ngila, J.C.; Dlamini, L.N. Characterization and stability of TiO2 nanoparticles in industrial dye stuff effluent. J. Dispers. Sci. Technol. 2017, 38, 584–593. [Google Scholar] [CrossRef]
- Batzill, M. Fundamental aspects of surface engineering of transition metal oxide photocatalysts. Int. J. Energy Environ. Sci. 2011, 4, 3275. [Google Scholar] [CrossRef]
- Harshulkhan, S.M.; Velraj, K.J.G. Structural and optical properties of Mg doped tungsten oxide prepared by microwave irradiation method. J. Mater. Sci. Mater. Electron. 2017, 28, 11794–11799. [Google Scholar] [CrossRef]
- Parthibavarman, M.K.M.; Prabhakaran, A.K.S. One-step microwave synthesis of pure and Mn doped WO3 nanoparticles and its structural, optical and electrochemical properties. J. Mater. Sci. Mater. Electron. 2017, 28, 6635–6642. [Google Scholar]
- Lu, M.W.; Wang, Q.F.; Miao, J.; Huang, Y. Synthesis and electrochemical performances of cotton ball-like SnS2 compound as anode material for lithium ion batteries. J. Mater. Sci. Technol. 2016, 31, 281–285. [Google Scholar]
- Yamamoto, T.; Teramachi, A.; Orita, A.; Kurimoto, A.; Motoi, T.; Tanaka, T. Generation of strong acid sites on yttrium-doped tetragonal ZrO2-supported tungsten oxides: Effects of dopant amounts on acidity, crystalline phase, kinds of tungsten species, and their dispersion. J. Phys. Chem. C 2016, 120, 19705–19713. [Google Scholar] [CrossRef]
- Chae, S.Y.; Lee, C.S.; Jung, H.; Min, B.K.; Kim, J.H.; Hwang, Y.J. Insight into charge separation in WO3/BiVO4 heterojunction for solar water splitting. ACS Appl. Mater. Interfaces 2017, 9, 19780–19790. [Google Scholar] [CrossRef]
- Velanganni, S.; Pravinraj, S.; Immanuel, P.; Thiruneelakandan, R. Nanostructure CdS/ZnO heterojunction configuration for photocatalytic degradation of Methylene blue. Physics B 2018, 534, 56–62. [Google Scholar] [CrossRef]
- Afuyoni, M.; Nashed, G.; Mohammed, I. TiO2 doped with SnO2 and studing its structural and electrical properties. Energy Procedia 2011, 6, 11–20. [Google Scholar] [CrossRef] [Green Version]
- Shaposhnik, D.; Pavelko, R.; Llobet, E.; Gispert-guirado, F.; Vilanova, X. Hydrogen sensors on the basis of SnO2-TiO2 systems. Procedia Eng. 2011, 25, 1133–1136. [Google Scholar] [CrossRef] [Green Version]
- Tang, S.J.; Moniz, S.J.A.; Shevlin, S.A.; Martin, D.J.; Guo, Z.X.; Tang, J. Visible-light driven heterojunction photocatalysts for water splitting—A critical review. Energy Environ. Sci. 2015, 8, 731–759. [Google Scholar]
- Simelane, S.; Ngila, J.C.; Dlamini, L.N. The effect of humic acid on the stability and aggregation kinetics of WO3 nanoparticles. Part Sci. Technol. 2017, 35, 632–642. [Google Scholar] [CrossRef]
- Georgaki, I.V.I.; Kenanakis, D.V.G.; Katsarakis, N. Synthesis of WO3 catalytic powders: Evaluation of photocatalytic activity under NUV/visible light irradiation and alkaline reaction pH. J. Sol-Gel Sci. Technol. 2015, 76, 120–128. [Google Scholar]
- Székely, I.; Kovács, G.; Baia, L.; Danciu, V.; Pap, Z. Synthesis of shape-tailored WO3 micro-/nanocrystals and the photocatalytic activity of WO3/TiO2 composites. Materials 2016, 9, 258. [Google Scholar] [CrossRef] [PubMed] [Green Version]
- Joshi, U.A.; Darwent, J.R.; Yiu, H.H.P.; Rosseinsky, M.J. The effect of platinum on the performance of WO3 nanocrystal photocatalysts for the oxidation of Methyl Orange and iso-propanol. J. Chem. Technol. Biotechnol. 2011, 86, 1018–1023. [Google Scholar] [CrossRef]
- Cai, J.; Wu, X.; Li, S.; Zheng, F. Synthesis of TiO2@WO3/Au nanocomposite hollow spheres with controllable size and high visible-light-driven photocatalytic activity. ACS Sustain. Chem. Eng. 2016, 4, 1581–1590. [Google Scholar] [CrossRef]
- Dalvie, M.A.; Sosan, M.B.; Africa, A.; Cairncross, E.; London, L. Environmental monitoring of pesticide residues from farms at a neighbouring primary and pre-school in the Western Cape in South Africa. Sci. Total Environ. 2014, 466–467, 1078–1084. [Google Scholar] [CrossRef]
- Glynnis, R.; Perry, M.; Lee, M.M.; Hoffman, E.; Delport, S.; Dalvie, M.A. Farm residence and reproductive health among boys in rural South Africa. Environ. Int. 2012, 47, 73–79. [Google Scholar]
- Gao, J.; Naughton, S.X.; Beck, W.D.; Hernandez, C.M.; Wu, G.; Wei, Z.; Yang, X.; Bartlett, M.G.; Terry, A.V., Jr. Chlorpyrifos and chlorpyrifos oxon impair the transport of membrane bound organelles in rat cortical axons. Neurotoxicology 2017, 62, 111–123. [Google Scholar] [CrossRef]
- Michael, J.; Madimetja, J.V.; Wepener, V. Prioritizing agricultural pesticides used in South Africa based on their environmental mobility and potential human health effects. Environ. Int. 2014, 62, 31–40. [Google Scholar]
- Ismail, M.; Khan, H.M.; Sayed, M.; Cooper, W.J. Advanced oxidation for the treatment of chlorpyrifos in aqueous solution. Chemosphere 2013, 93, 645–651. [Google Scholar] [CrossRef] [PubMed]
- Silvia, M.D. Highly selective sample preparation and gas chromatographic—Mass spectrometric analysis of chlorpyrifos, diazinon and their major metabolites in sludge and sludge-fertilized agricultural soils. J. Chromatogr. A 2006, 1132, 21–27. [Google Scholar]
- Sharma, B.; Saxena, S.; Datta, A.; Arora, S. Spectrophotometric analysis of degradation of chlorpyrifos pesticide by indigenous microorganisms isolated from affected soil. Int. J. Curr. Microb. Appl. Sci. 2016, 5, 742–749. [Google Scholar] [CrossRef]
- Chen, S.; Liu, C.; Peng, C.; Liu, H.; Hu, M.; Zhong, G. Biodegradation of Chlorpyrifos and Its Hydrolysis Product 3,5,6-Trichloro-2-Pyridinol by a New Fungal Strain Cladosporium cladosporioides Hu-01. PLoS ONE 2012, 7, 1–12. [Google Scholar] [CrossRef] [Green Version]
- Fadaei, A.; Kargar, M. Photocatalytic degradation of chlorpyrifos in water using titanium dioxide and zinc oxide. Fres. Environ. Bull. 2013, 22, 2442–2447. [Google Scholar]
- Ma, C.; Xu, J.; Alvarado, J.; Qu, B.; Somerville, J.; Lee, J.Y.; Meng, Y.S. Investigating the energy storage mechanism of SnS2-rGO composite anode for advanced Na-ion batteries. Chem. Mater. 2015, 27, 5633–5640. [Google Scholar] [CrossRef]
- Klinger, M. More features, more tools, more CrysTBox. J. Appl. Crystallogr. 2017, 50, 1–9. [Google Scholar] [CrossRef]
- Hou, J.; Zhang, F.; Wang, P.; Wang, C.; Chen, J.; Xu, Y.; You, G.; Zhou, Q.; Li, Z. Enhanced anaerobic biological treatment of chlorpyrifos in farmland drainage with zero valent iron. J. Chem. Eng. 2018, 336, 352–360. [Google Scholar] [CrossRef]
Figure 1.
XRD patterns of (a) WO3, (b) Mn-WO3, (c) WO3/SnS2, (d) Mn-WO3/SnS2 and (e) SnS2.

Figure 2.
Raman spectra of (a) WO3, (b) Mn-WO3, (c) WO3/SnS2, (d) Mn-WO3/SnS2 and (e) SnS2.

Figure 3.
FESEM images (inset is the corresponding energy-dispersive X-ray (EDX) spectrum) of (a) pristine WO3, (b) WO3/SnS2 and (c) Mn-WO3/SnS2, and TEM images (inset is the corresponding selected area electron diffraction (SAED) image) of (d) WO3, (e) WO3/SnS2 and (f) Mn-WO3/SnS2.
Figure 3.
FESEM images (inset is the corresponding energy-dispersive X-ray (EDX) spectrum) of (a) pristine WO3, (b) WO3/SnS2 and (c) Mn-WO3/SnS2, and TEM images (inset is the corresponding selected area electron diffraction (SAED) image) of (d) WO3, (e) WO3/SnS2 and (f) Mn-WO3/SnS2.

Figure 4.
Tauc plots indicating the band gaps of (a) WO3, (b) Mn-WO3, (c) SnS2, (d) WO3/SnS2 and (e) Mn-WO3/SnS2.
Figure 4.
Tauc plots indicating the band gaps of (a) WO3, (b) Mn-WO3, (c) SnS2, (d) WO3/SnS2 and (e) Mn-WO3/SnS2.

Figure 5.
Diagram of the band gap, valence band and conduction band edge positions vs. the NHE of the (a) WO3, (b) SnS2, (c) Mn-WO3, (d) WO3/SnS2 and (e) Mn-WO3/SnS2 photocatalysts.
Figure 5.
Diagram of the band gap, valence band and conduction band edge positions vs. the NHE of the (a) WO3, (b) SnS2, (c) Mn-WO3, (d) WO3/SnS2 and (e) Mn-WO3/SnS2 photocatalysts.

Figure 6.
(a) Electrochemical impedance spectra (Nyquist plot), (b) photoluminescence spectra, (c) linear sweep voltammetry, and (d) Mott–Schottky plot of (a) WO3, (b) Mn-WO3, (c) SnS2, (d) WO3/SnS2 and (e) Mn-WO3/SnS2.
Figure 6.
(a) Electrochemical impedance spectra (Nyquist plot), (b) photoluminescence spectra, (c) linear sweep voltammetry, and (d) Mott–Schottky plot of (a) WO3, (b) Mn-WO3, (c) SnS2, (d) WO3/SnS2 and (e) Mn-WO3/SnS2.

Figure 7.
Randles equivalent circuit models corresponding to (a) WO3 and Mn-WO3, and (b) SnS2, WO3/SnS2 and Mn-WO3/SnS2.
Figure 7.
Randles equivalent circuit models corresponding to (a) WO3 and Mn-WO3, and (b) SnS2, WO3/SnS2 and Mn-WO3/SnS2.

Figure 8.
Surface charge of the nanoparticles.

Figure 9.
Degradation of chlorpyrifos (1000 ppb) using different photocatalysts at pH = 5 and 0.1 g of photocatalyst.
Figure 9.
Degradation of chlorpyrifos (1000 ppb) using different photocatalysts at pH = 5 and 0.1 g of photocatalyst.

Figure 10.
Percentage removal for chlorpyrifos (1000 ppb) using 0.1 g of (A) WO3, (B) Mn-WO3, (C) SnS2, (D) WO3/SnS2 and (E) Mn-WO3/SnS2.
Figure 10.
Percentage removal for chlorpyrifos (1000 ppb) using 0.1 g of (A) WO3, (B) Mn-WO3, (C) SnS2, (D) WO3/SnS2 and (E) Mn-WO3/SnS2.

Figure 11.
Rate constants of (A) WO3, (B) Mn-WO3, (C) WO3/SnS2, (D) Mn-WO3/SnS2 and (E) SnS2.

Figure 12.
Photodegradation kinetics for chlorpyrifos using Mn-WO3/SnS2.

Figure 13.
Degradation of 1000 ppb chlorpyrifos using 0.1 g of Mn-WO3/SnS2 at different pH values.

Figure 14.
Effect of the initial concentration on the removal of chlorpyrifos (1000 ppb) at pH 7 using 0.1 g of Mn-WO3/SnS2.
Figure 14.
Effect of the initial concentration on the removal of chlorpyrifos (1000 ppb) at pH 7 using 0.1 g of Mn-WO3/SnS2.

Figure 15.
Effect of the initial photocatalyst loading on the photodegradation of chlorpyrifos.

Figure 16.
Proposed degradation pathway for chlorpyrifos.


Table 1.
The specific surface area and pore volume of NPs.
| Material | SBET (m2/g) | Pore Volume (cm3/g) |
|---|---|---|
| WO3 | 6.01 | 0.0276 |
| Mn-WO3 | 4.41 | 0.0294 |
| WO3/SnS2 | 44.36 | 0.0514 |
| Mn-WO3/SnS2 | 77.14 | 0.0641 |
| Pristine SnS2 | 99.72 | 0.0748 |
© 2020 by the authors. Licensee MDPI, Basel, Switzerland. This article is an open access article distributed under the terms and conditions of the Creative Commons Attribution (CC BY) license (http://creativecommons.org/licenses/by/4.0/).
Share and Cite
MDPI and ACS Style
Kgoetlana, C.M.; Malinga, S.P.; Dlamini, L.N. Photocatalytic Degradation of Chlorpyrifos with Mn-WO3/SnS2 Heterostructure. Catalysts 2020, 10, 699. https://0-doi-org.brum.beds.ac.uk/10.3390/catal10060699
AMA Style
Kgoetlana CM, Malinga SP, Dlamini LN. Photocatalytic Degradation of Chlorpyrifos with Mn-WO3/SnS2 Heterostructure. Catalysts. 2020; 10(6):699. https://0-doi-org.brum.beds.ac.uk/10.3390/catal10060699
Chicago/Turabian StyleKgoetlana, Charlie M., Soraya P. Malinga, and Langelihle N. Dlamini. 2020. "Photocatalytic Degradation of Chlorpyrifos with Mn-WO3/SnS2 Heterostructure" Catalysts 10, no. 6: 699. https://0-doi-org.brum.beds.ac.uk/10.3390/catal10060699
Note that from the first issue of 2016, this journal uses article numbers instead of page numbers. See further details here.