Characterization of Electrode Performance in Enzymatic Biofuel Cells Using Cyclic Voltammetry and Electrochemical Impedance Spectroscopy


Department of Chemical Engineering and Materials Science, Yuan Ze University, 135 Yuan Tung Road Chung Li, Taoyuan 32003, Taiwan
*
Author to whom correspondence should be addressed.
Catalysts 2020, 10(7), 782; https://0-doi-org.brum.beds.ac.uk/10.3390/catal10070782
Submission received: 20 June 2020
/
Revised: 8 July 2020
/
Accepted: 9 July 2020
/
Published: 13 July 2020
(This article belongs to the Special Issue Biocatalytic Process Optimization)
Abstract
:The main objective of this study was to examine the quantitative performance of the electrochemical redox reaction of glucose by glucosidase and oxygen with laccase in a phosphate buffer solution at pH 7.0. The characterization of electrode performance was performed by using electrochemical analysis such as cyclic voltammetry (CV) and electrochemical impedance spectroscopy (EIS). The use of such electrochemical analysis (CV and EIS) enables a better understanding of the redox process, the charge transfer resistance, and, hence, the potential mass transfer among the electrode materials in phosphorus buffer solution. The experimental results show that the maximum power densities of the bioanode and the biocathode electrodes were 800 µA/cm2 and 600 µA/cm2, respectively. Both the bioanode and biocathode show high internal resistance. The occurrence of peak-separation shows an excellent mass-transfer mechanism and better chemical reactivity in the electrode.
1. Introduction
Since the invention of fossil fuels, from which energy is generated by the burning method, they have caused some severe impacts on the environment. The world needs a lot of energy for daily activities to be continued, which results in a high dependency on fossil fuels and, due to the scarcity of this natural resource, the destruction of the environment and other global warning effects [1]. An alternative source of energy is needed because of the demand for energy with an increasing consumption rate, a decrease in the supply of natural fossil fuels, and the challenges of the destruction of the ecosphere and ecology [1,2]. From the fuel cell or electrochemical industry is a high demand for researching a clean and safe energy source that is environmentally attainable and efficient in terms of use and production output. Fuel cells of all categories (biofuel cells) are one of the electrochemical systems that generate energy and store it for future applications, including batteries [3].
The study of the chemical reaction and electrical conductivity is called electrochemistry. It further includes the dynamics of chemical reactions, which are due to the electrical conductivity across a medium and, in turn, the generation of current or energy from the chemical reactions. This study uses two basic electrochemical principles, which are electrochemical impedance spectroscopy (EIS) and Cyclic Voltammetry (CV) [4]. EIS is a useful tool in electrochemistry that is used in the characterization of enzymatic biofuel cells. It analyzes the maximum power production, which is limited by the high resistance of the enzymatic biofuel cells. The combination of carbon nanotubes (CNTs) with enzymes (glucose oxidase and laccase) as the electrode produces the maximum power output. Likewise, CV was used on a carbon paper electrode in an aqueous solution containing phosphate buffer solution with glucose dissolved in it as a supporting electrolyte [5].
EIS is used in electrochemical analysis for the characterization of an electrode, presently, by the charge transfer and resistances of the solution and electrode materials. EIS analysis follows a steady-state principle, as the changes in the current of the electrode in the biofuel cell are transmitted in signals of small magnitude. Moreover, EIS has some merits over other electrochemical techniques because it can measure the impedance of the biofuel cell system without causing distress to the overall operation; that is why it is called a non-intrusive or non-destructive technique. The EIS technique is currently used in many electrochemistry applications, such as for studying corrosion [6] and in biofuel cell systems [7]. Meanwhile, voltammetry or CV is also a useful tool in electrochemistry. It examines the redox-reaction mechanism (oxidation and reduction) of the electrode. It scans the potential (voltage) by sweeping the electrode from a lower potential to a higher potential. By doing this, an equilibrium is a retort, and the potential voltage and current output of the electrode are observed.
The classification of a fuel cell is generally based on the conventional mechanism; as such, biofuel cells belong to a group of traditional fuel cells that involve the use of biological enzyme catalysts that generate current from a biochemical reaction in the form of a redox reaction. Since biological enzymes have many applications in fuel cell systems, this and other characteristics make them famous for use in vast quantities for the production of energy in some portable devices, and also, they are very compatible with the ecosphere and sustainable [8]. Biofuel cells are also integrated in biological-implantable devices since they can work as micro-reactors, used for life support purposes, used in fields of biomedicine, or used in particular environmental operations to ease pollution and global warming’s effects since they are environmentally friendly [9]. Biological or enzymatic biofuel cells are as valuable as other energy systems such as batteries in many ways and forms. The use of metal catalysts is somewhat costly compared to that of enzymatic catalysts used in biofuel cells, which are cheaper, provide fast redox reaction conditions, and are renewable. This results in a good economic benefit over traditional fuel cells [10]. The biological enzyme catalyst in the biofuel cells provides energy via a redox-chemical reaction, which allows the operation of these cells in different fields [11]. This study is aimed at characterizing the electrode performance in enzymatic biofuel cells using the CV technique and EIS technique.
2. Results and Discussion
2.1. Effect of Scan Rate
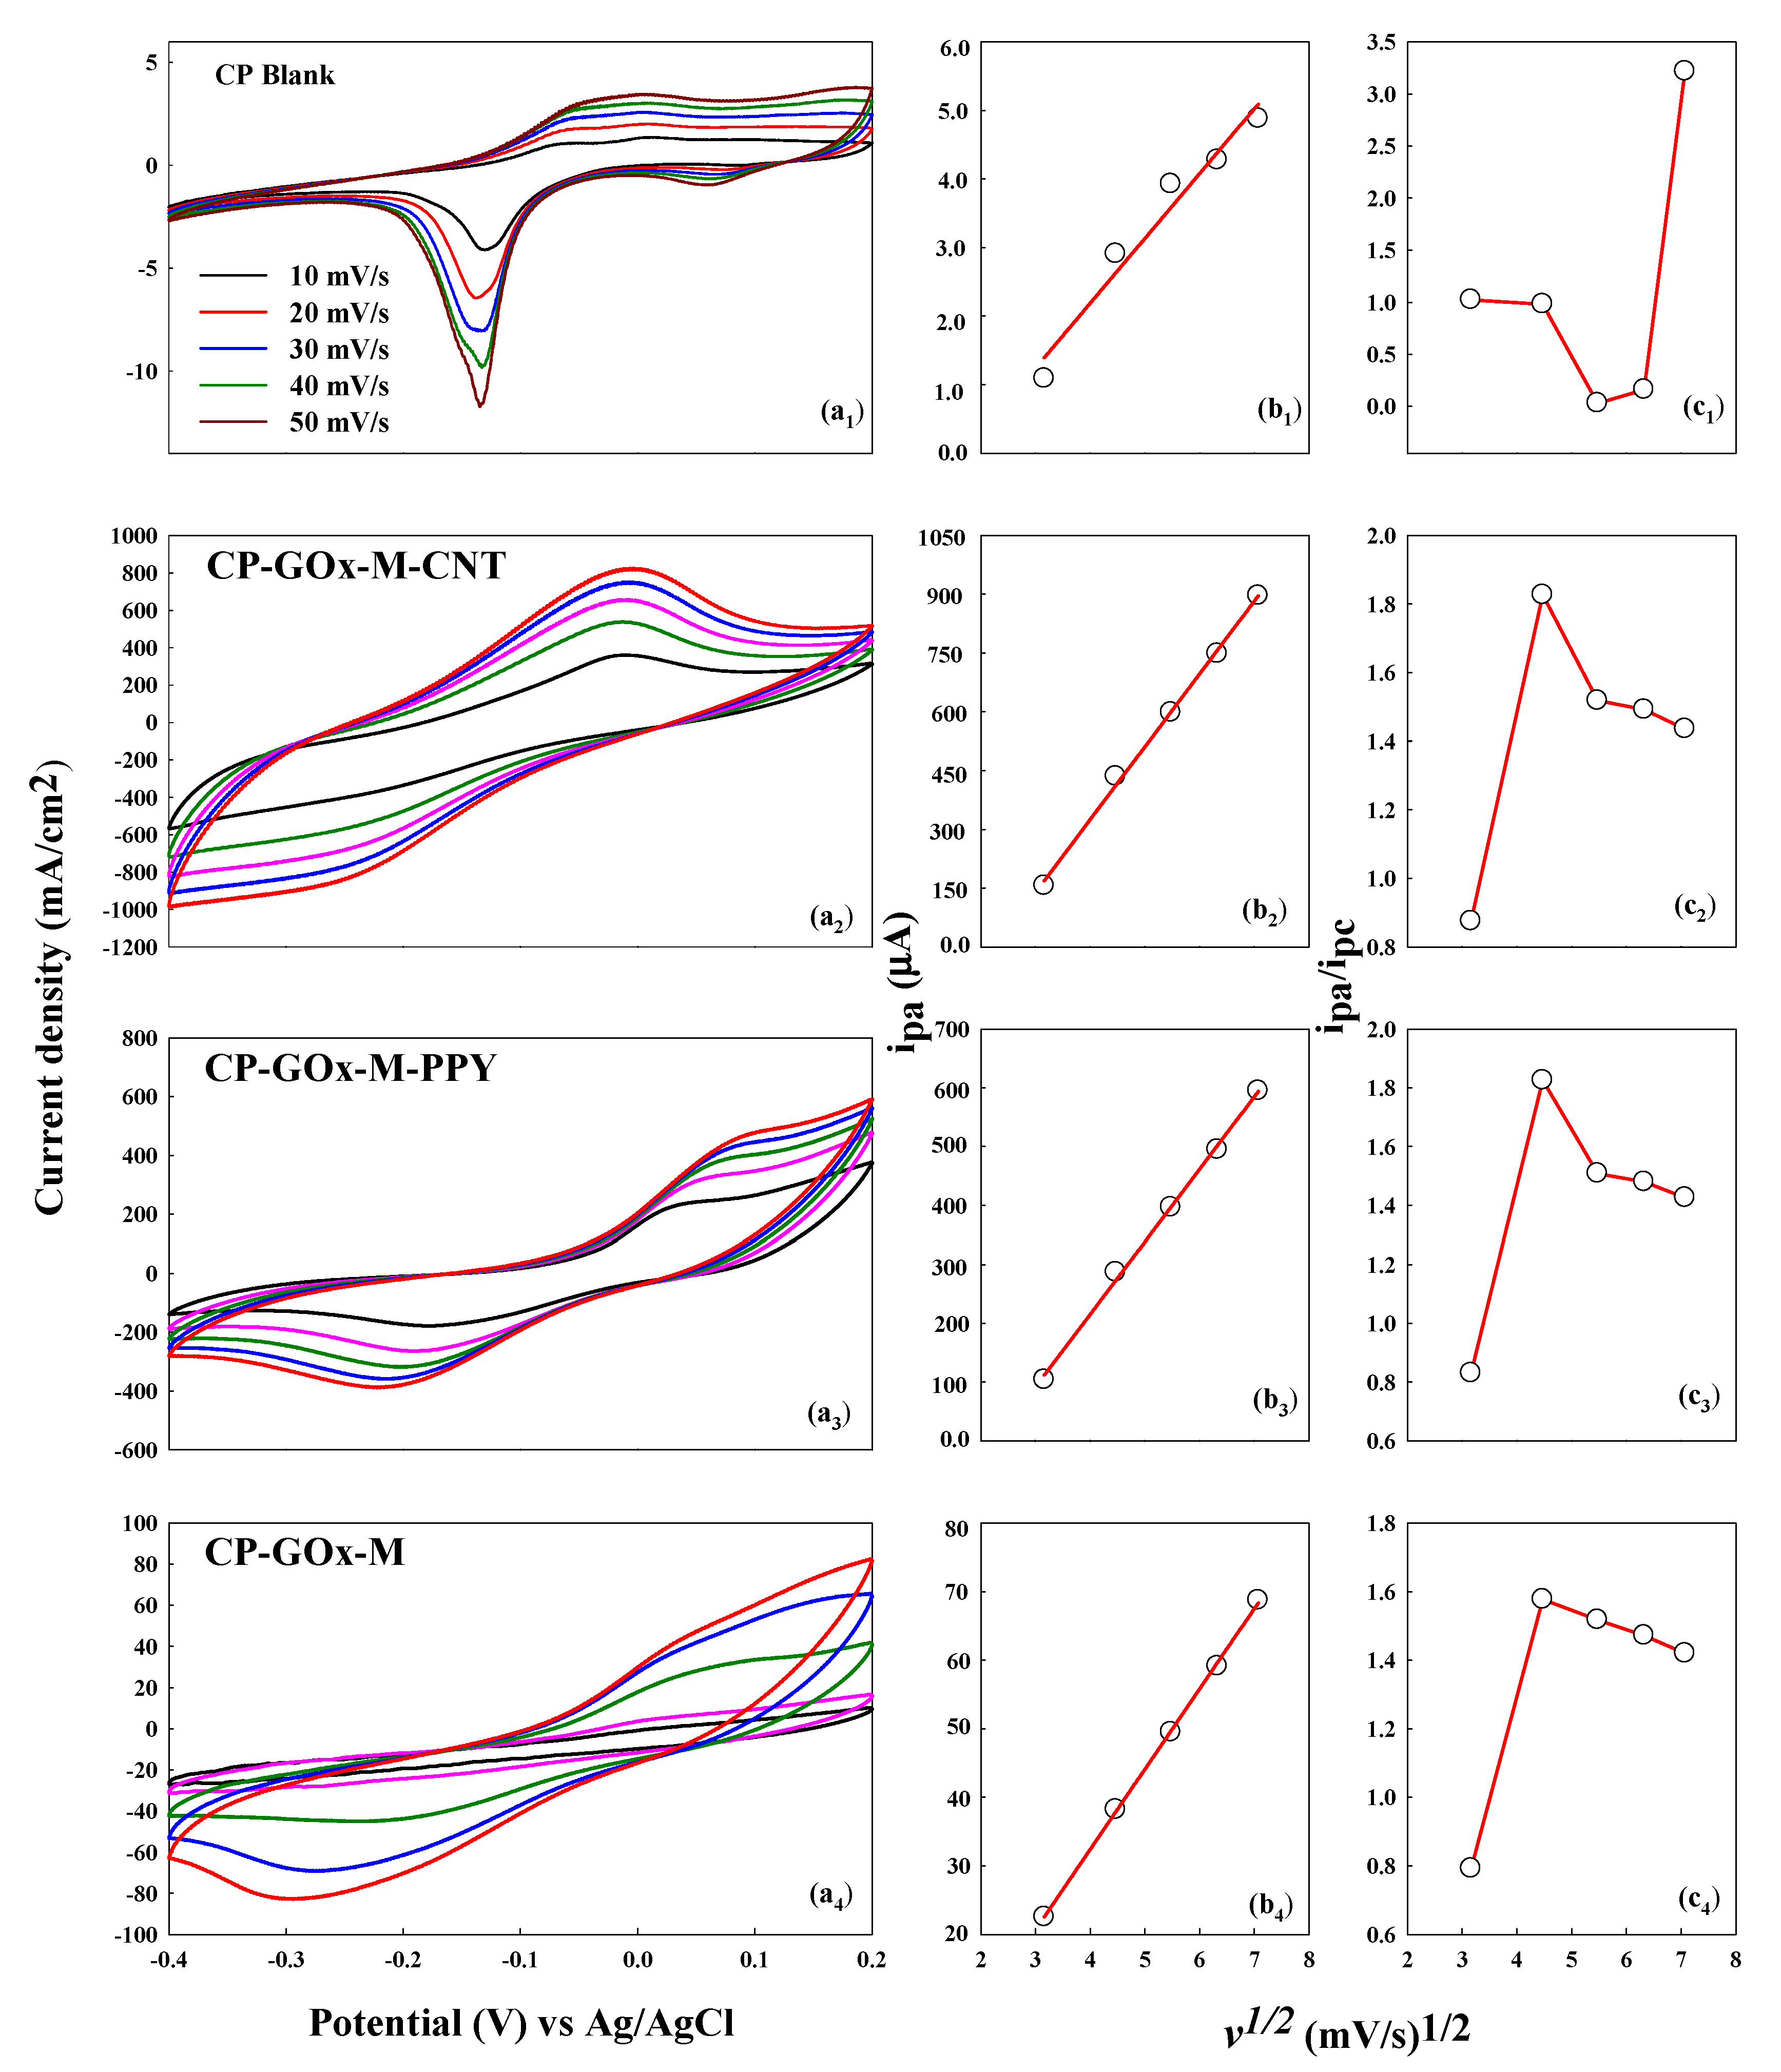
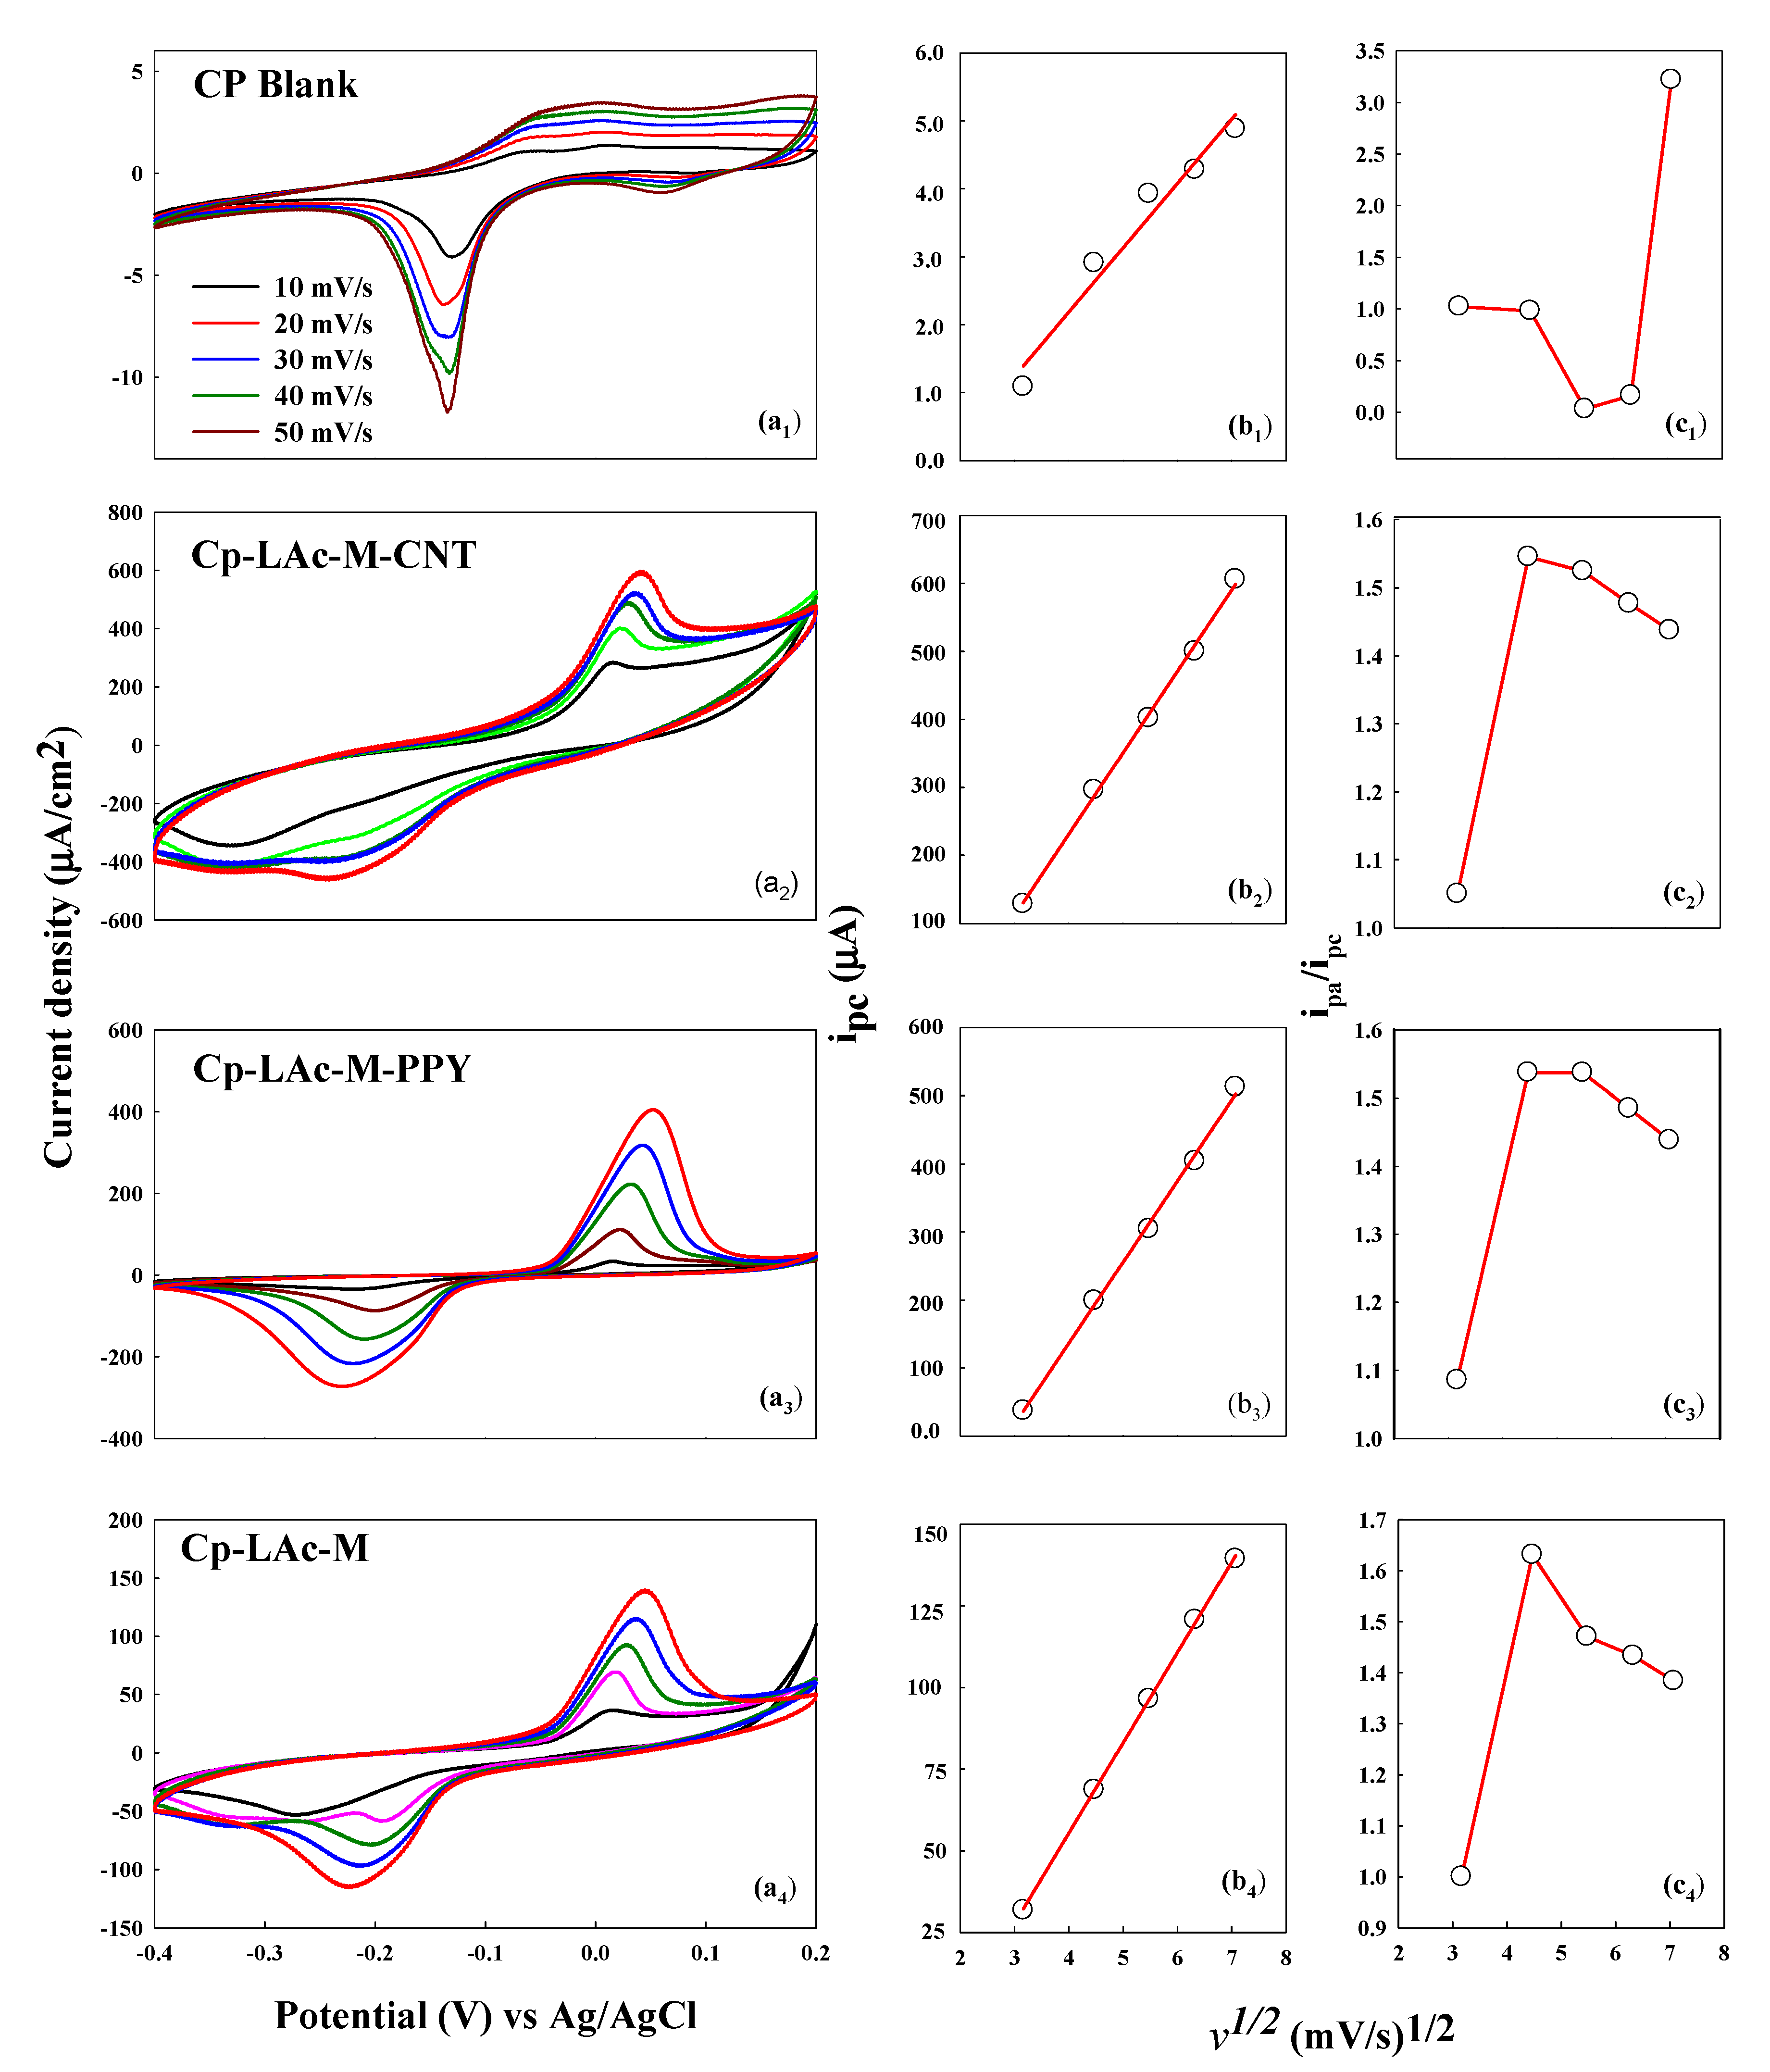
Both the bioanodic and biocathodic current peaks increase with an increasing scan rate, as illustrated in Figure 1 and Figure 2, respectively. The bioanodic current peak tends toward a less positive voltage potential, while the biocathodic current peak tends toward a more positive voltage potential. Generally, the current (ipa) is proportional to the square of the scan rate (Figure 1b and Figure 2b). The current peak separations between the bioanodic and biocathodic current peak potentials at a scan rate of 50 mV/s are higher than those at 59 mV/s, which is one of the primary indications of a quasi-reversible system according to previous work [12].
Generally, a current/peak ratio ipa/ipc of approximate unity reflects immovability of both the bioanode and biocathode catalytic enzyme on the surface area of the electrode. Any oxidation or reduction reactions are actually slow, which was practically demonstrated for both electrodes during the CV. The effect of the scan rates on the oxidation and reduction of GOx and LAc in the presence of glucose and PBS was highlighted. The peak current ratios ipa/ipc increase as the scan rate increases for the black electrode. For both the GOx and LAc electrodes, the peak ratio increases at a scan rate of 20 mV/s and decreases evenly at the scan rate 30–50 mV/s (Figure 1c and Figure 2c). This indicates that a chemical reaction occurred between the GOx and its combinations (carbon nanotubes (CNT), M, and polypyrrole (PPY)), as occurred for LAc, too. These observed phenomena were studied extensively in previous work [12,13,14]. According to Figure 1 and Figure 2, the cyclic voltammograms show the shifting of the anodic and cathodic peak potentials with an increasing trend, which indicates efficient mass transfer between the electrodes, and the oxidation and reduction of the enzyme were best achieved with the CNT combination since it has good electrical conductivity.
The determination of the oxidation current peak from the scan rate with its square root is detailed in Figure 1b and Figure 2b. The intercept is reported as starting from the origin of the voltage potential in the CV analysis. The oxidation current peak is represented in a linear plot. The current is proportional to the square root of the scan rate, as described in Figure 1 and Figure 2. The roles of ferricyanide on the bioanode and 2,2-azino-bis (3-ethylbenzothiazoline-6-sulphonic acid (ABTS) on the biocathode can be limited by mass transport. As established from the slope of the oxidation current in proportion to v1/2 and the postulation of the reversibility of the ferricyanide redox reaction, the diffusion coefficient (D) of the bioanode and the biocathode (electrodes) were deduced using the transmuted Randles–Sevcik equation. For the blank electrode in Figure 1b1, D = 2, where slope = 0.1891 cm2/V s−1, C = 0.1 mol/dm3, and A = 1 cm2; therefore, D = 2 = 7.02 × 10⁻⁶ cm2/s. The other combinations of bioanode and biocathode were calculated and are listed in Table 1.
Figure 1 shows that an increase in the scan rate increases the mass transfer for the GOx bioanode with different combinations of mediators (GOx-M-CNT, GOx-M-PPY, and GOx-M). The shapes of the peaks increase at high currents and reduce uniformly at low currents, which indicates excellent oxidation and reduction, respectively, and the best electrode that showed better mass transfer and reversibility was GOx-M-CNT, followed by GOx-M-PPY.
From the results, it can be concluded that GOx-M-CNT and LAc-M-CNT are the best electrodes, whose diffusion coefficients are better in the CNT combination for both GOx (9.2 × 10⁻⁶ cm2/s) and LAc (9.0 × 10⁻⁶ cm2/s), as shown in Table 1 [12]. Moreover, the blank carbon paper electrode shows little material diffusion or low conductivity because there were no essential supporting materials such CNT and mediators to aid this effect and, hence, a low diffusion coefficient (7.02 × 10⁻⁶ cm2/s) resulted, as shown in Table 1.
It was determined, after this calculation, that the peak current is proportional to the diffusion coefficient (ip α D) in the Randles–Sevcik equation. If the peak current is high, the diffusion rate is large. Therefore, in the additional analysis, the best-modified electrode is the one that has a better current peak coefficient. Not only do the concentration of the electrolyte, diffusion, or electro-active species affect the current peak, but also, the scan rate plays a more significant role in the determination of ip. In this redox reaction, the current is defined as the charge over time or, generally, the electrons passing per time. For a fast scan rate, which is directly proportional to the electrons caught per time, a higher voltage scan rate will lead to a higher ip,, and the total electrons passing remains intact [15]. The electron transfer in this reaction is calculated using the Randles–Sevcik equation. All the calculations give results under 1. Consequently, to simplify the calculations, the electrons transferred are used and equal to 1 (n = 1) in this study. The number of electrons reassigned in the redox occurrence is typically 1 [16].
The case of the biocathode (Figure 2) exposed to different scan rates with different combinations (LAc-M-CNT, LAc-M-PPY, and LAc-M) was studied. It shows an increase in the peak current, but what is unique in both combinations is the arrangement of the endpoint of the peaks (from −0.4 to 0.2 potential vs. Ag/AgCl) at the same point for both cases; this could be due to the limited diffusion of the electrode, since LAc is not a natural reducer of oxygen. Nevertheless, the best electrode was LAc-M-CNT (9.0 × 10⁻⁶ cm2/s), followed by LAc-M-PPY (8.9 × 10⁻⁶ cm2/s) (Table 1), since these two electrodes give an excellent mass transfer. This phenomenon was observed by Barriere [17].
As illustrated in Figure 1 and Figure 2, respectively, the pattern of the current dimension in both the forward and backward scans (−0.4 to 0.2 V vs. Ag/AgCl) of both the bioanode and biocathode shows a good separation pattern. This effect is due to the presence of carbon materials or substances, which have good capacitance, as mentioned by researchers [18]. For the bioanode, the current density for Cp-GOx-M-CNT was significantly high compared to that for other combinations. Likewise, the same goes for Cp-LAc-M-CNT from the biocathode perspective. Nevertheless, the ipa/ipc ratio of Cp-GOx-M-CNT is close to unity; Cp-GOX-M-CNT is characterized as possessing a quasi-reversible character as indicated by the appearance of the peak-to-peak voltage potential, ΔEp > 59/n mV. From the analytical point of view, the current density for different scan rates (10–50 mV) shows a quasi-reversible process for Cp-GOx-M-CNT, Cp-GOx-M-PPY, Cp-LAc-M-CNT, Cp-LAc-M-PPY, and Cp-LAc-M, as shown in Figure 1 and Figure 2. The elevation of the ΔEp resulted from an increase in the scan rate from 10 to 50 mV/s, respectively. With the assumption that the number of electrons transferred (n) is 1, the bioanodic and biocathodic current peaks relative to the scan rate are a function of the linear plot (ip with υ1/2). Kinetically, the electron transfer is not sufficiently fast to produce sufficient concentrations of the reacting species and products as determined to be essential by the Nernst equation [19]. An increase in the scan rate from 30 mV/s leads to an increase in the current density or capacitance that is faster or that is more than the faradaic current. If the capacitance current decreases the faradaic current, then the identification of the highest current peak is minimal. An additional increase in the scan rate at 50 mV/s causes the faradaic-current to overlap with the capacitance current. Generally, Cp-GOx-M-CNT for the bioanode electrode and Cp-LAc-M-CNT for the biocathode electrode did possess a quasi-reversible mechanism, which shows the even influence of the electron transfer and mass transfer rates.
2.2. Kinetic and Electrical Characteristics of Bioanode and Biocathode Electrodes
The estimation of the average various electron transfer ratio constant (k°) is performed by using the Nicholson method, using Equation (1).
where ψ stands for the kinetic factor gain according to Nicholson [18,20,21]. Since a tangible measurement is not performed, the transfer value is taken to be 0.5. Moreover, for simplicity, the determination of the coefficient of ψ is established and deduced from a pattern relation between ψ and ΔEp, which was done by using Equation (2) with the representation of the curve range of ΔEp.
These assumption-based constant factors are estimated from a non-linear regression-fitting, as a = −0.54050, b = 0.00140, and c = −0.01700. Using graphing, plotting ψ against υ1/2 will lead to the deduction of the kinetic factor K0, which is determined from the slope of the plot. A greater value of K0 means less time for the attainment of equilibrium related to a lower k° value. As illustrated in Figure 3, Cp-GOx-M-CNT has a larger K0 value, which means it can achieve equilibrium faster than all the other combinations. It can also be seen that the diffusion coefficient also plays a vital role in the electrode kinetics.
2.3. Effect of Immobilization on the Hydrophobic Electrode
To demonstrate the enzymatic performance of the electrode, primarily, a blank carbon paper electrode was analyzed and then surveyed with enzyme immobilized electrodes. The consequences are equated and conveyed in the subsequent CV curve. If the peak current of oxidation or reduction does not appear, it indicates that there is no redox reaction process on the electrode.
2.3.1. Bioanode
Due to the behavior of the hydrophobic anode electrode’s performance with the covalent-bonding immobilization method, the CV scan was carried out in five random prepared samples (Figure 4). It was found that the GOx modified carbon nanotube (CNT) and M (red) combination has a high oxidation and reduction peak compared to the others. On the other hand, GOx modified with a mediator and polypyrrole (blue) gives a higher oxidation peak than GOx with M (pink), GOx (green), and blank (black).
2.3.2. Biocathode
The equivalent amendment of the bioanode electrode was also equipped for the biocathode in the presence of oxygen (Figure 5). The highest value of the oxidation peak current was attributed to LAc modified CNT and M (red). The presence of mediators (ABTS) produced a very remarkable result here, as shown by LAc modified M and PPY (blue), and LAc only yielded a good result, which is surprising. A blank electrode gave the smallest cathodic peak with the carbon nanotube (black).
2.3.3. Effect of Immobilization on the Hydrophilic Electrode
The covalent-bonding method was proposed to be employed for hydrophilic provision to produce a superior enzyme-support collaboration compared to the hydrophobic electrode. Owing to the hydrophilic carbon paper having no PTFE (polytetrafluoroethylene) coating treatment on the surface, this support is calculatingly engaged for better performance of the enzymatic biofuel cell. The comparable modification for a hydrophobic electrode was designed and examined with half-cell analysis by exhaustive CV.
Bioanode
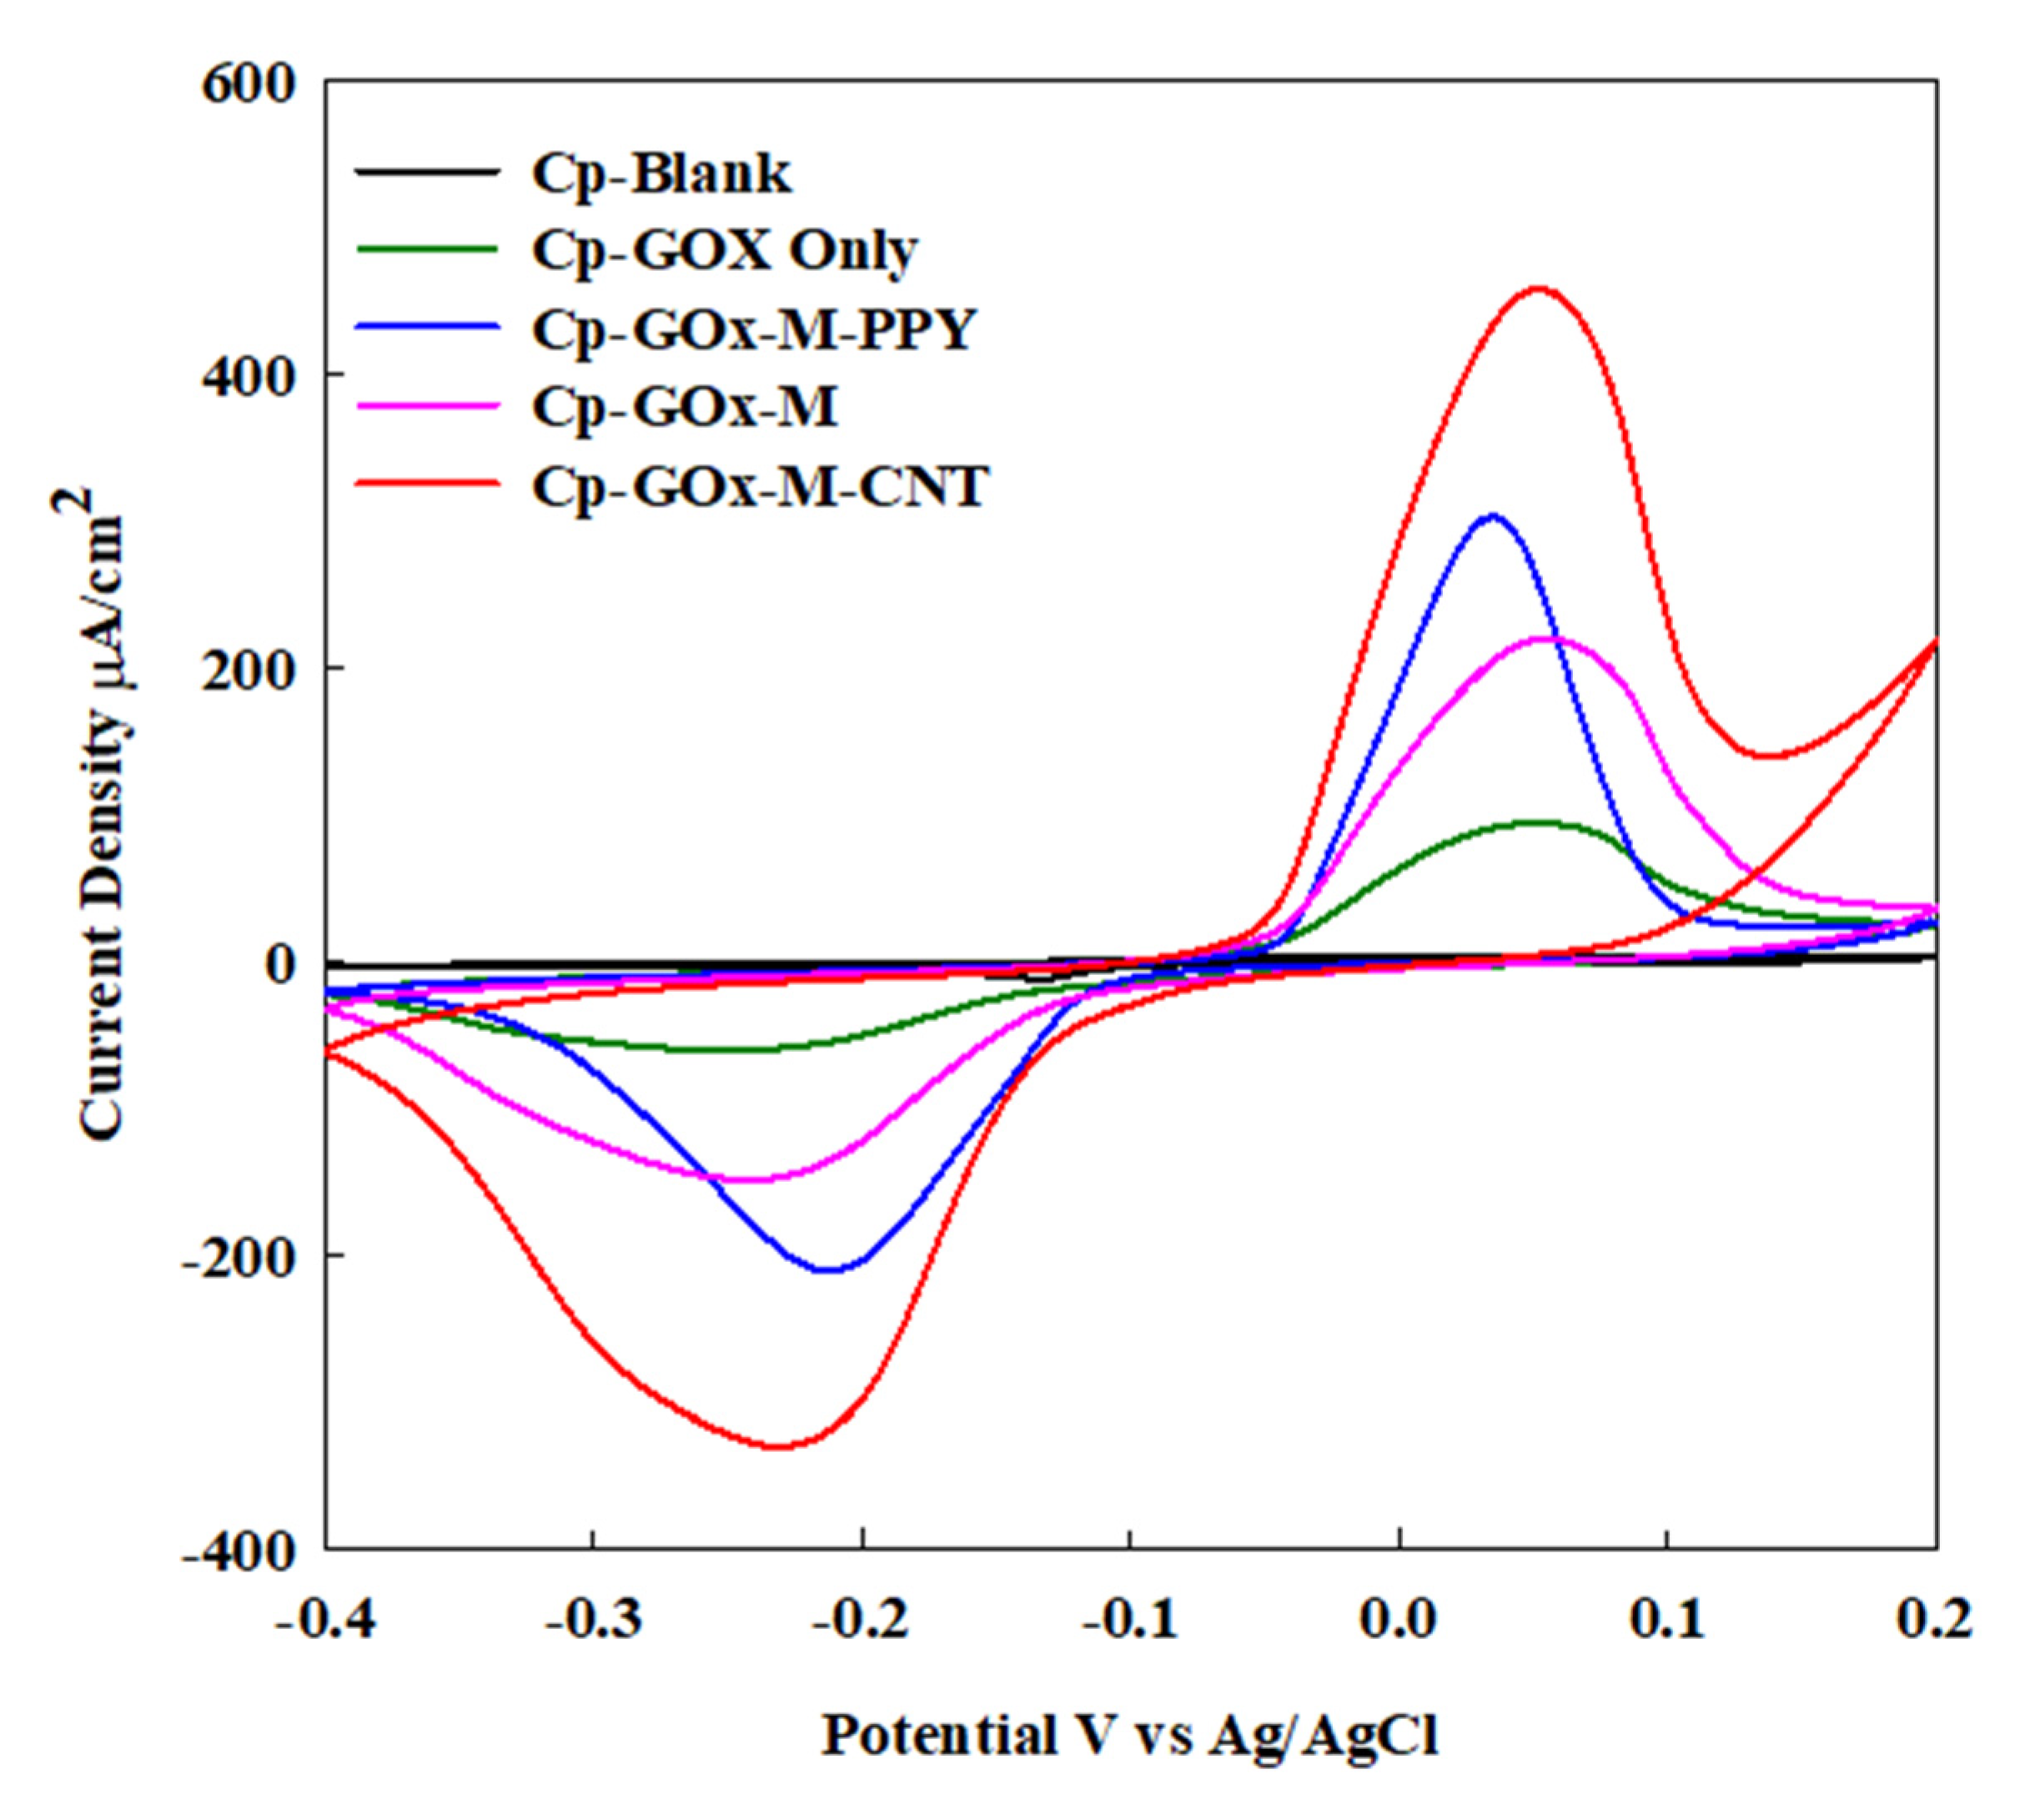
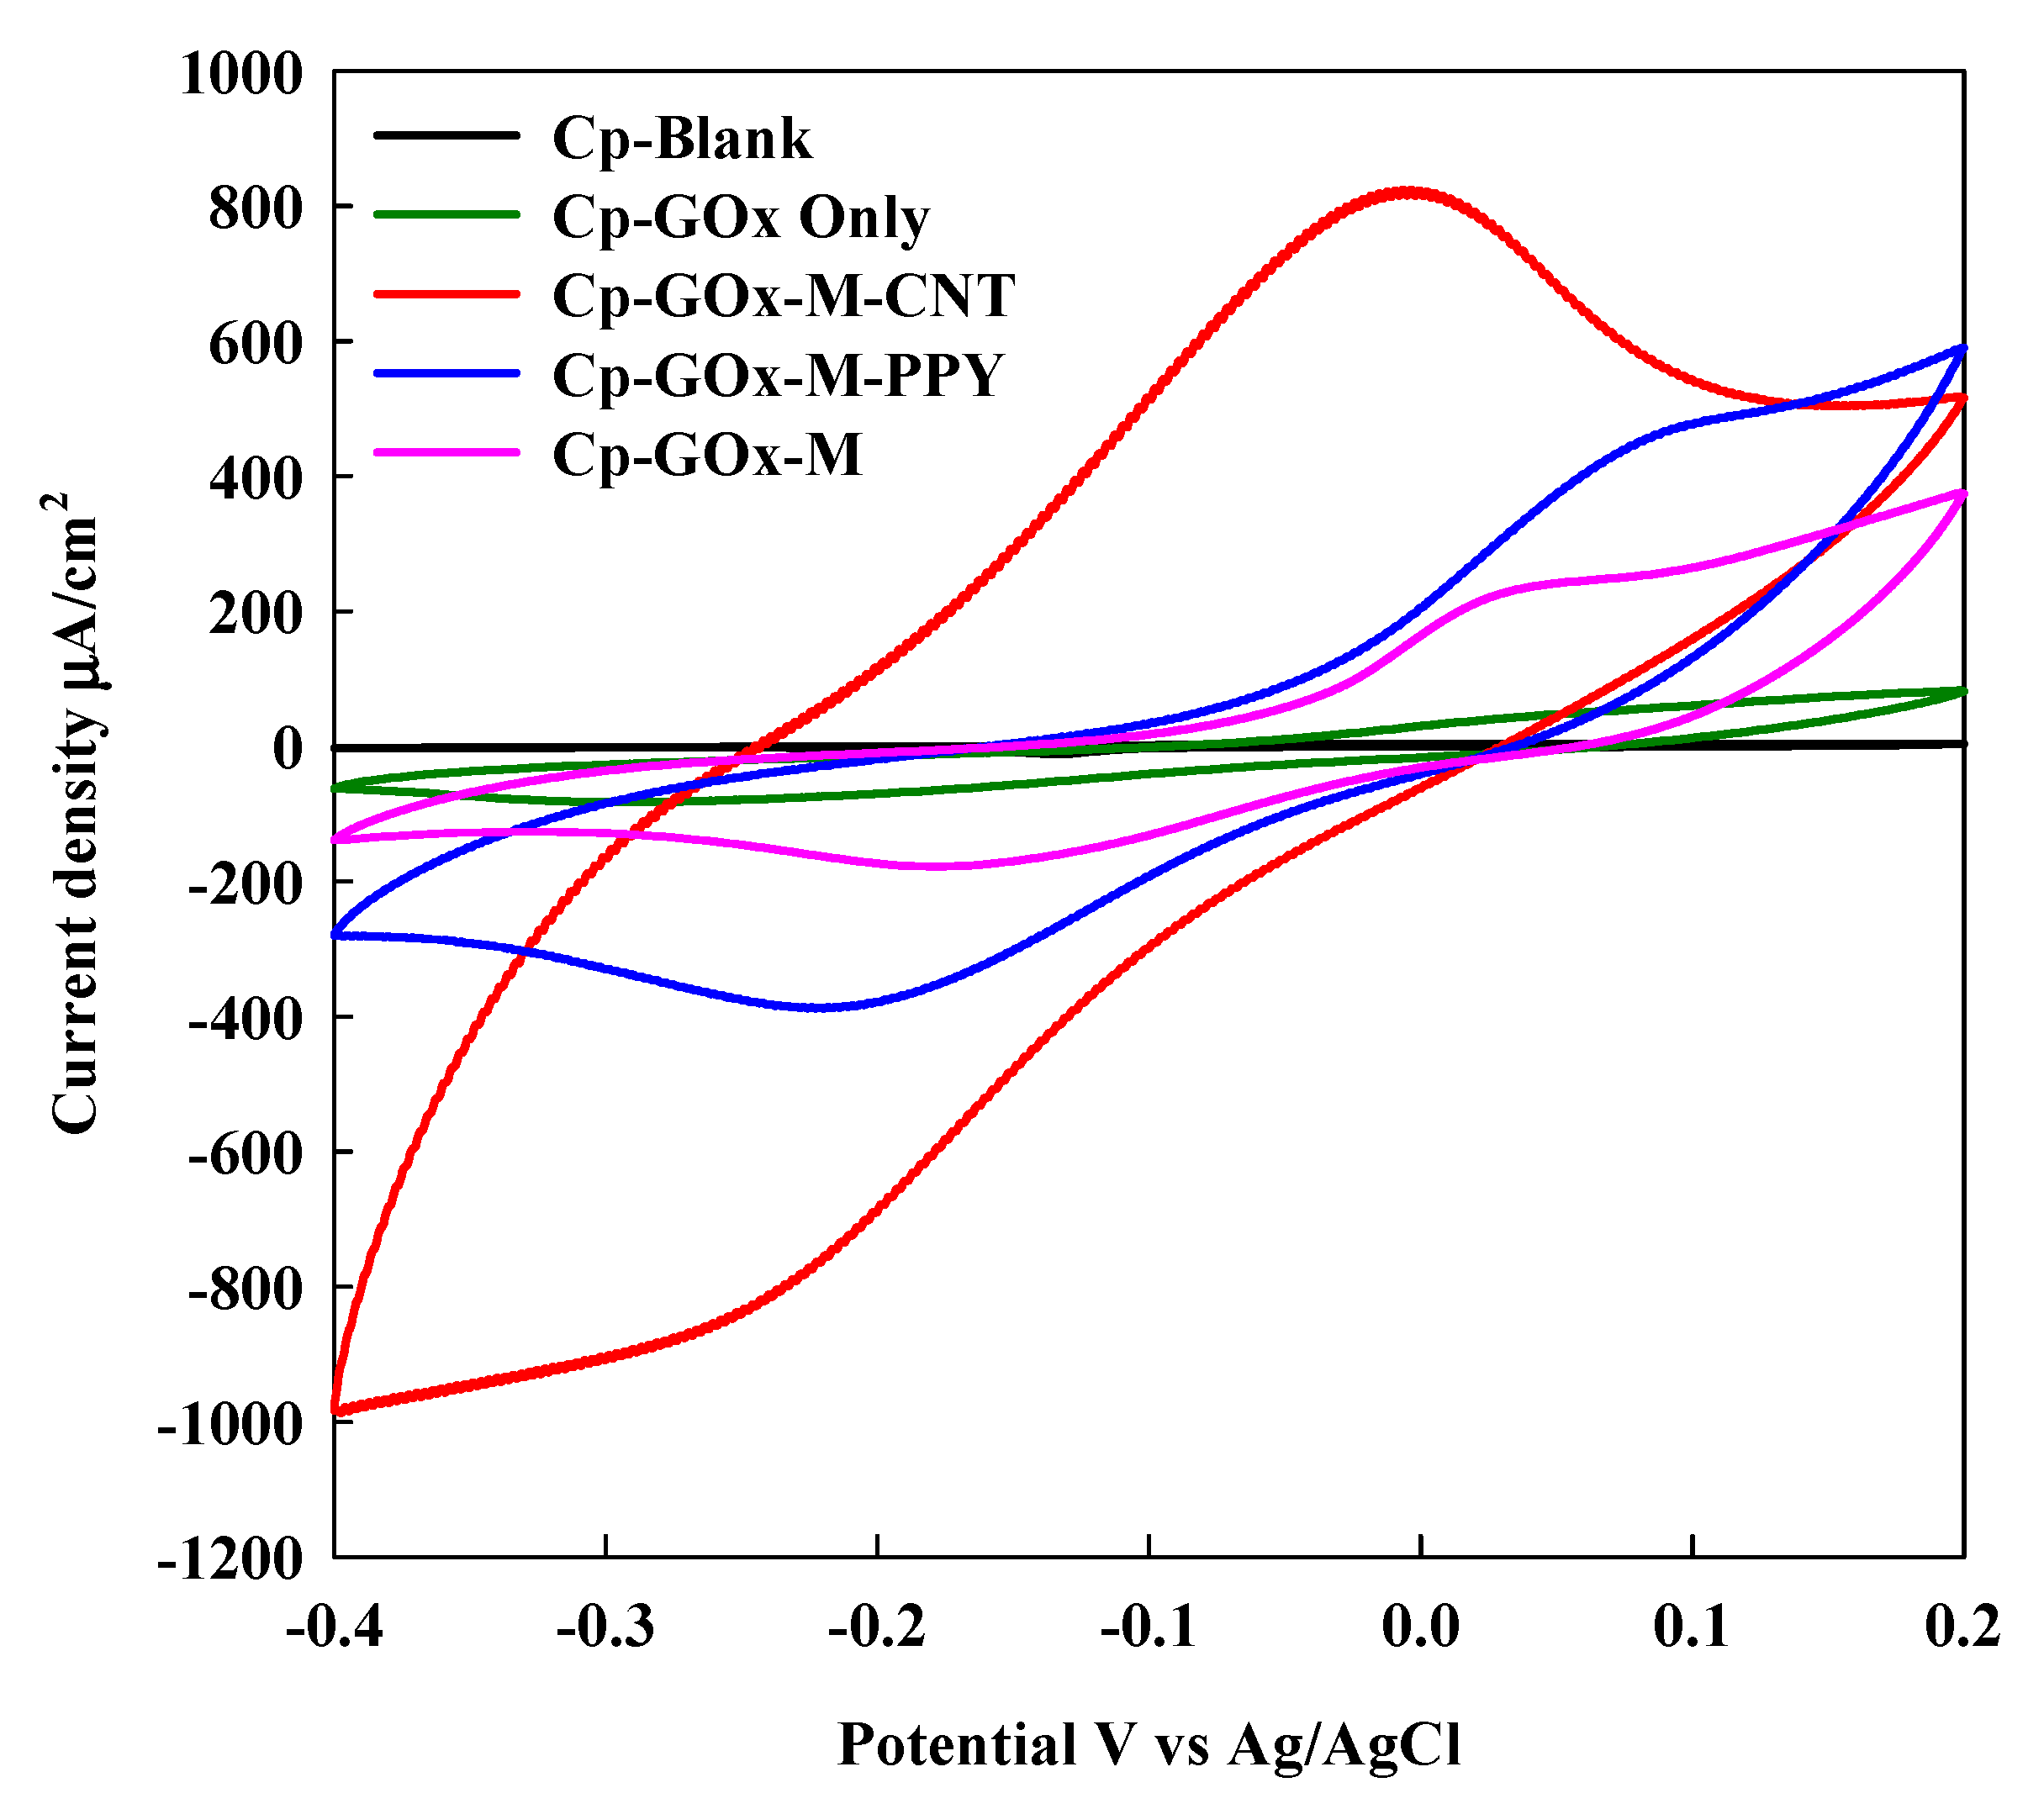
Voltammograms of the hydrophilic bioanode electrodes are given in Figure 6. The electrode modified with CP-GOx-M-CNT (red) has a meaningfully broader potential range than the others. It likewise produced the best peak in current density. On the other hand, the second biggest ip was from an electrode modified with CP-GOx-M-PPy (blue).
Although the CP-GOx-M remained in the third place, this performance indicates that the GOx-M-CNT modification can improve the performance of the electrode better than GOx-M-PPy using the covalent bonding immobilization method. The electrode with the presence of GOx performed poorly. This finding demonstrated that the enzyme generating current with the help of a substrate such as a CNT can produce high current density. The smallest peak was observed for the blank electrode. Moreover, the benefits of CNTs have been reported in previous work [22,23,24].
Biocathode
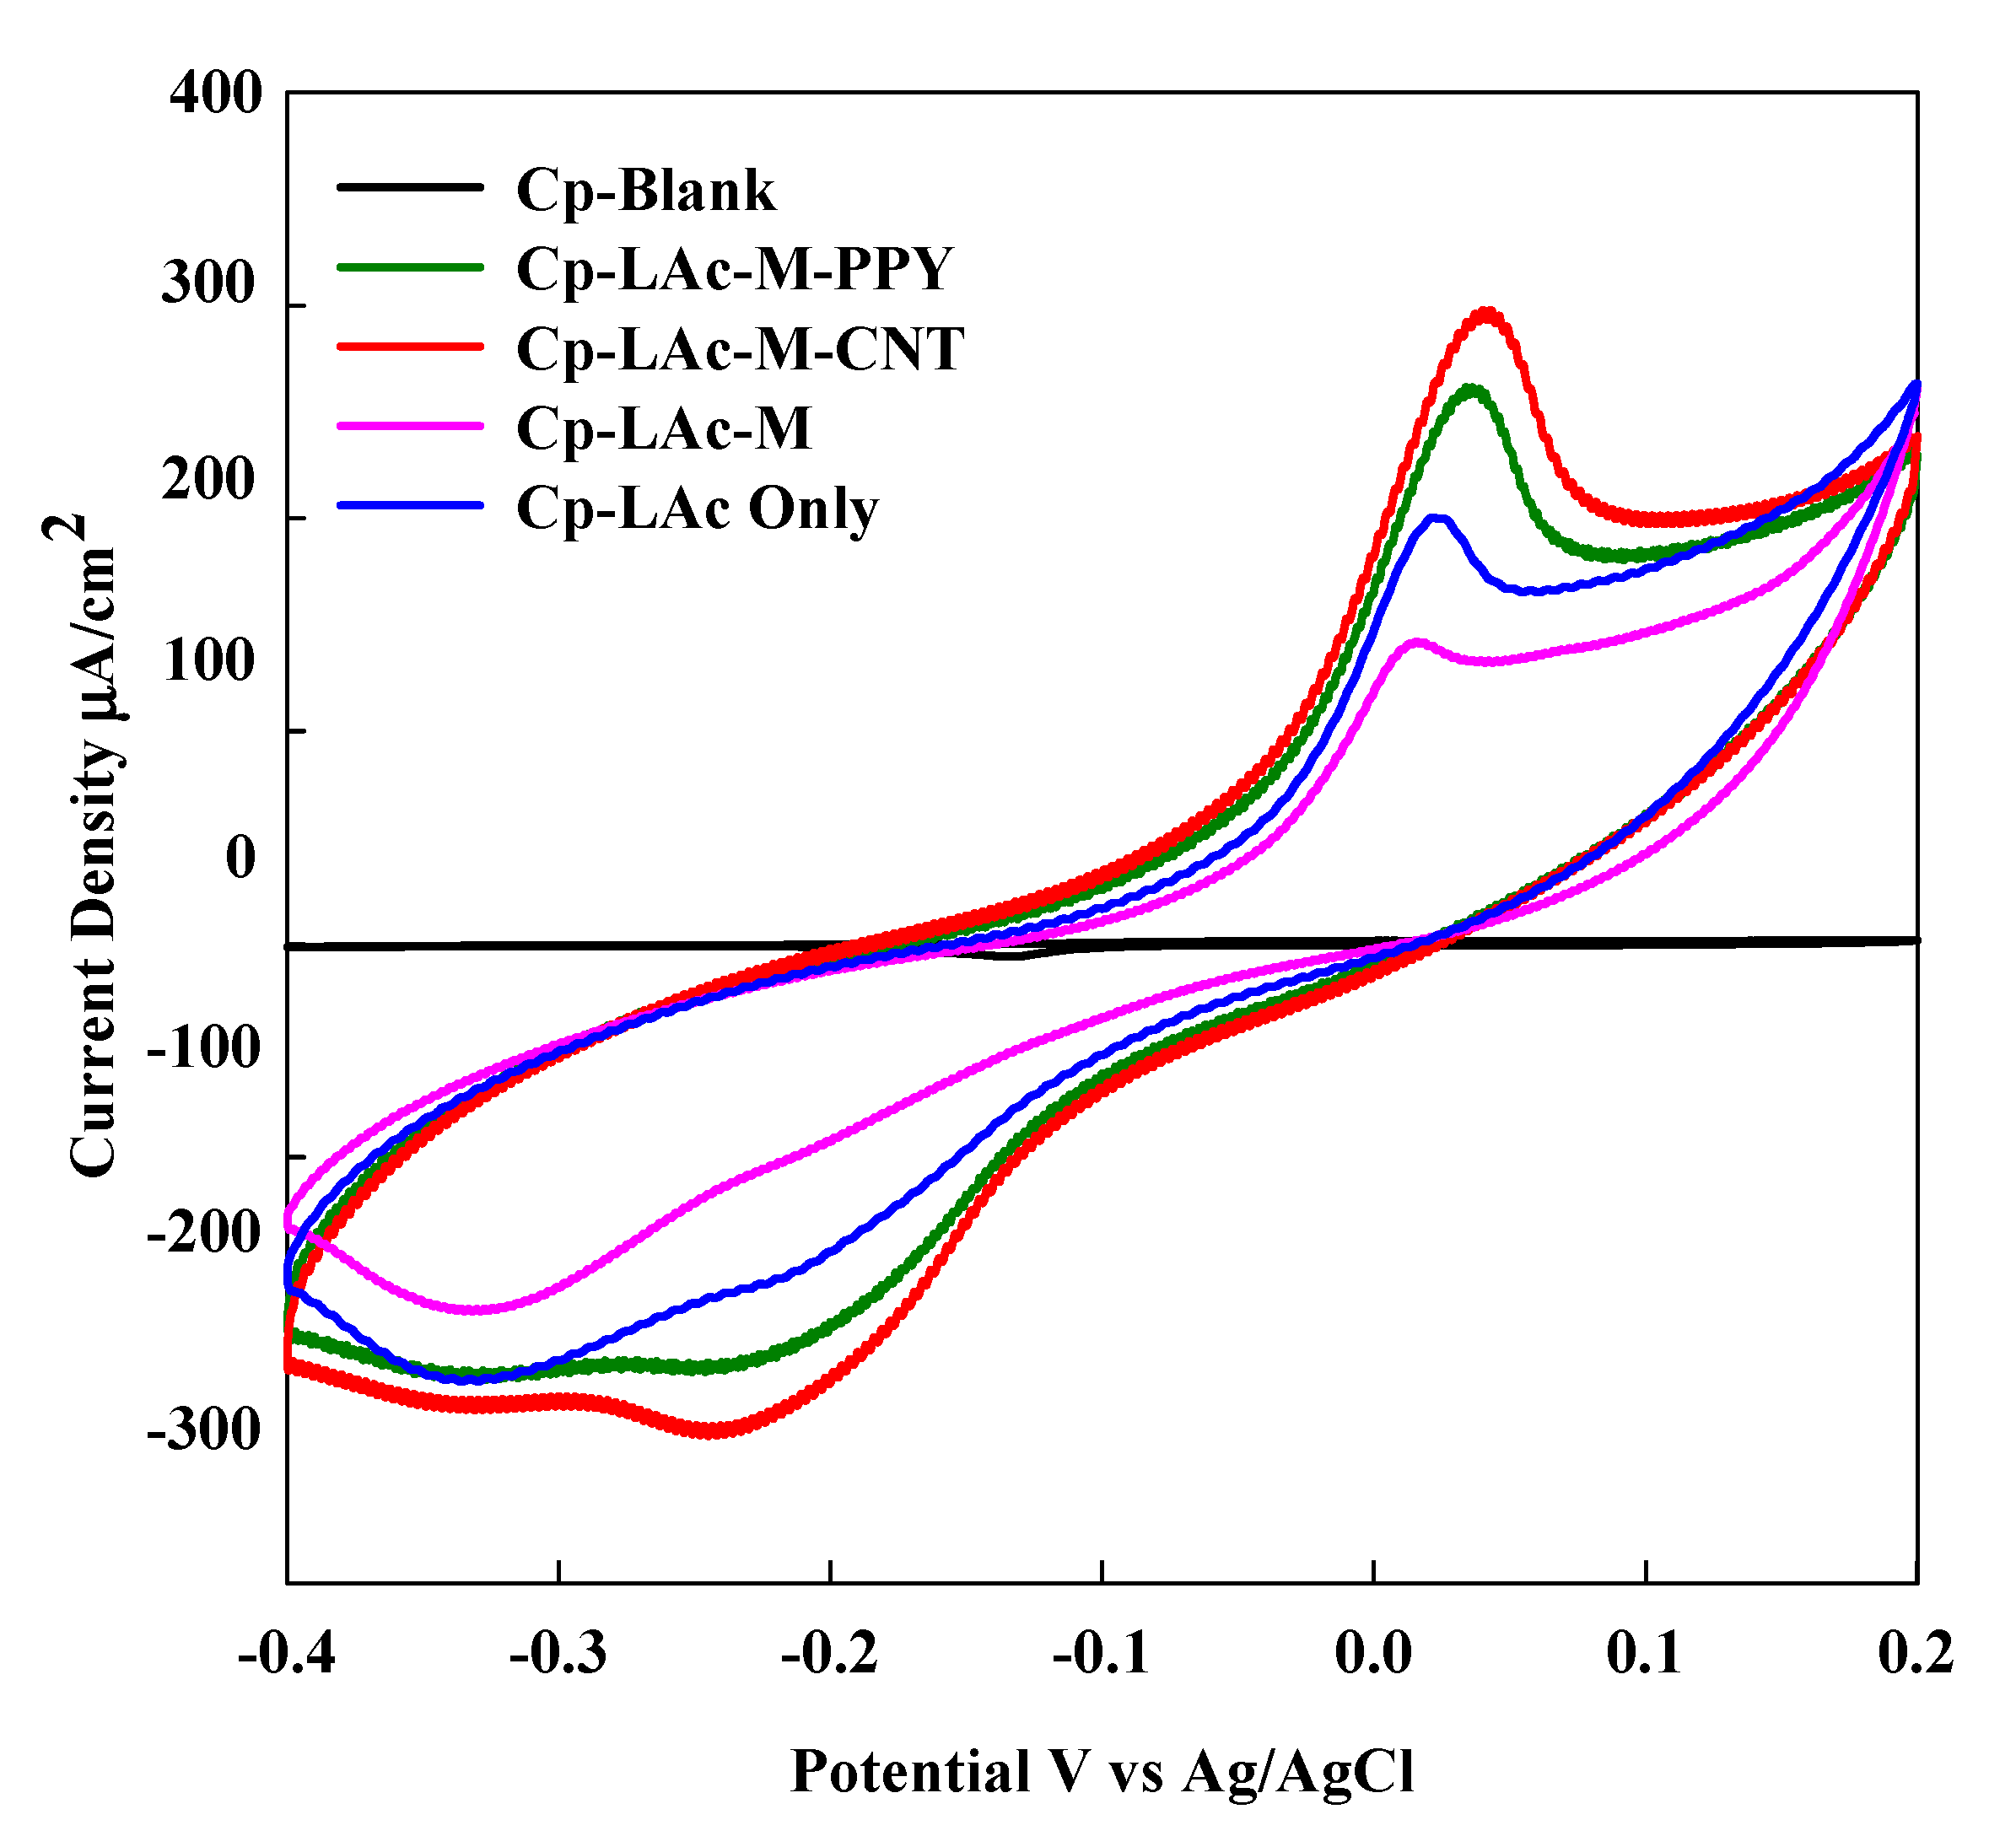
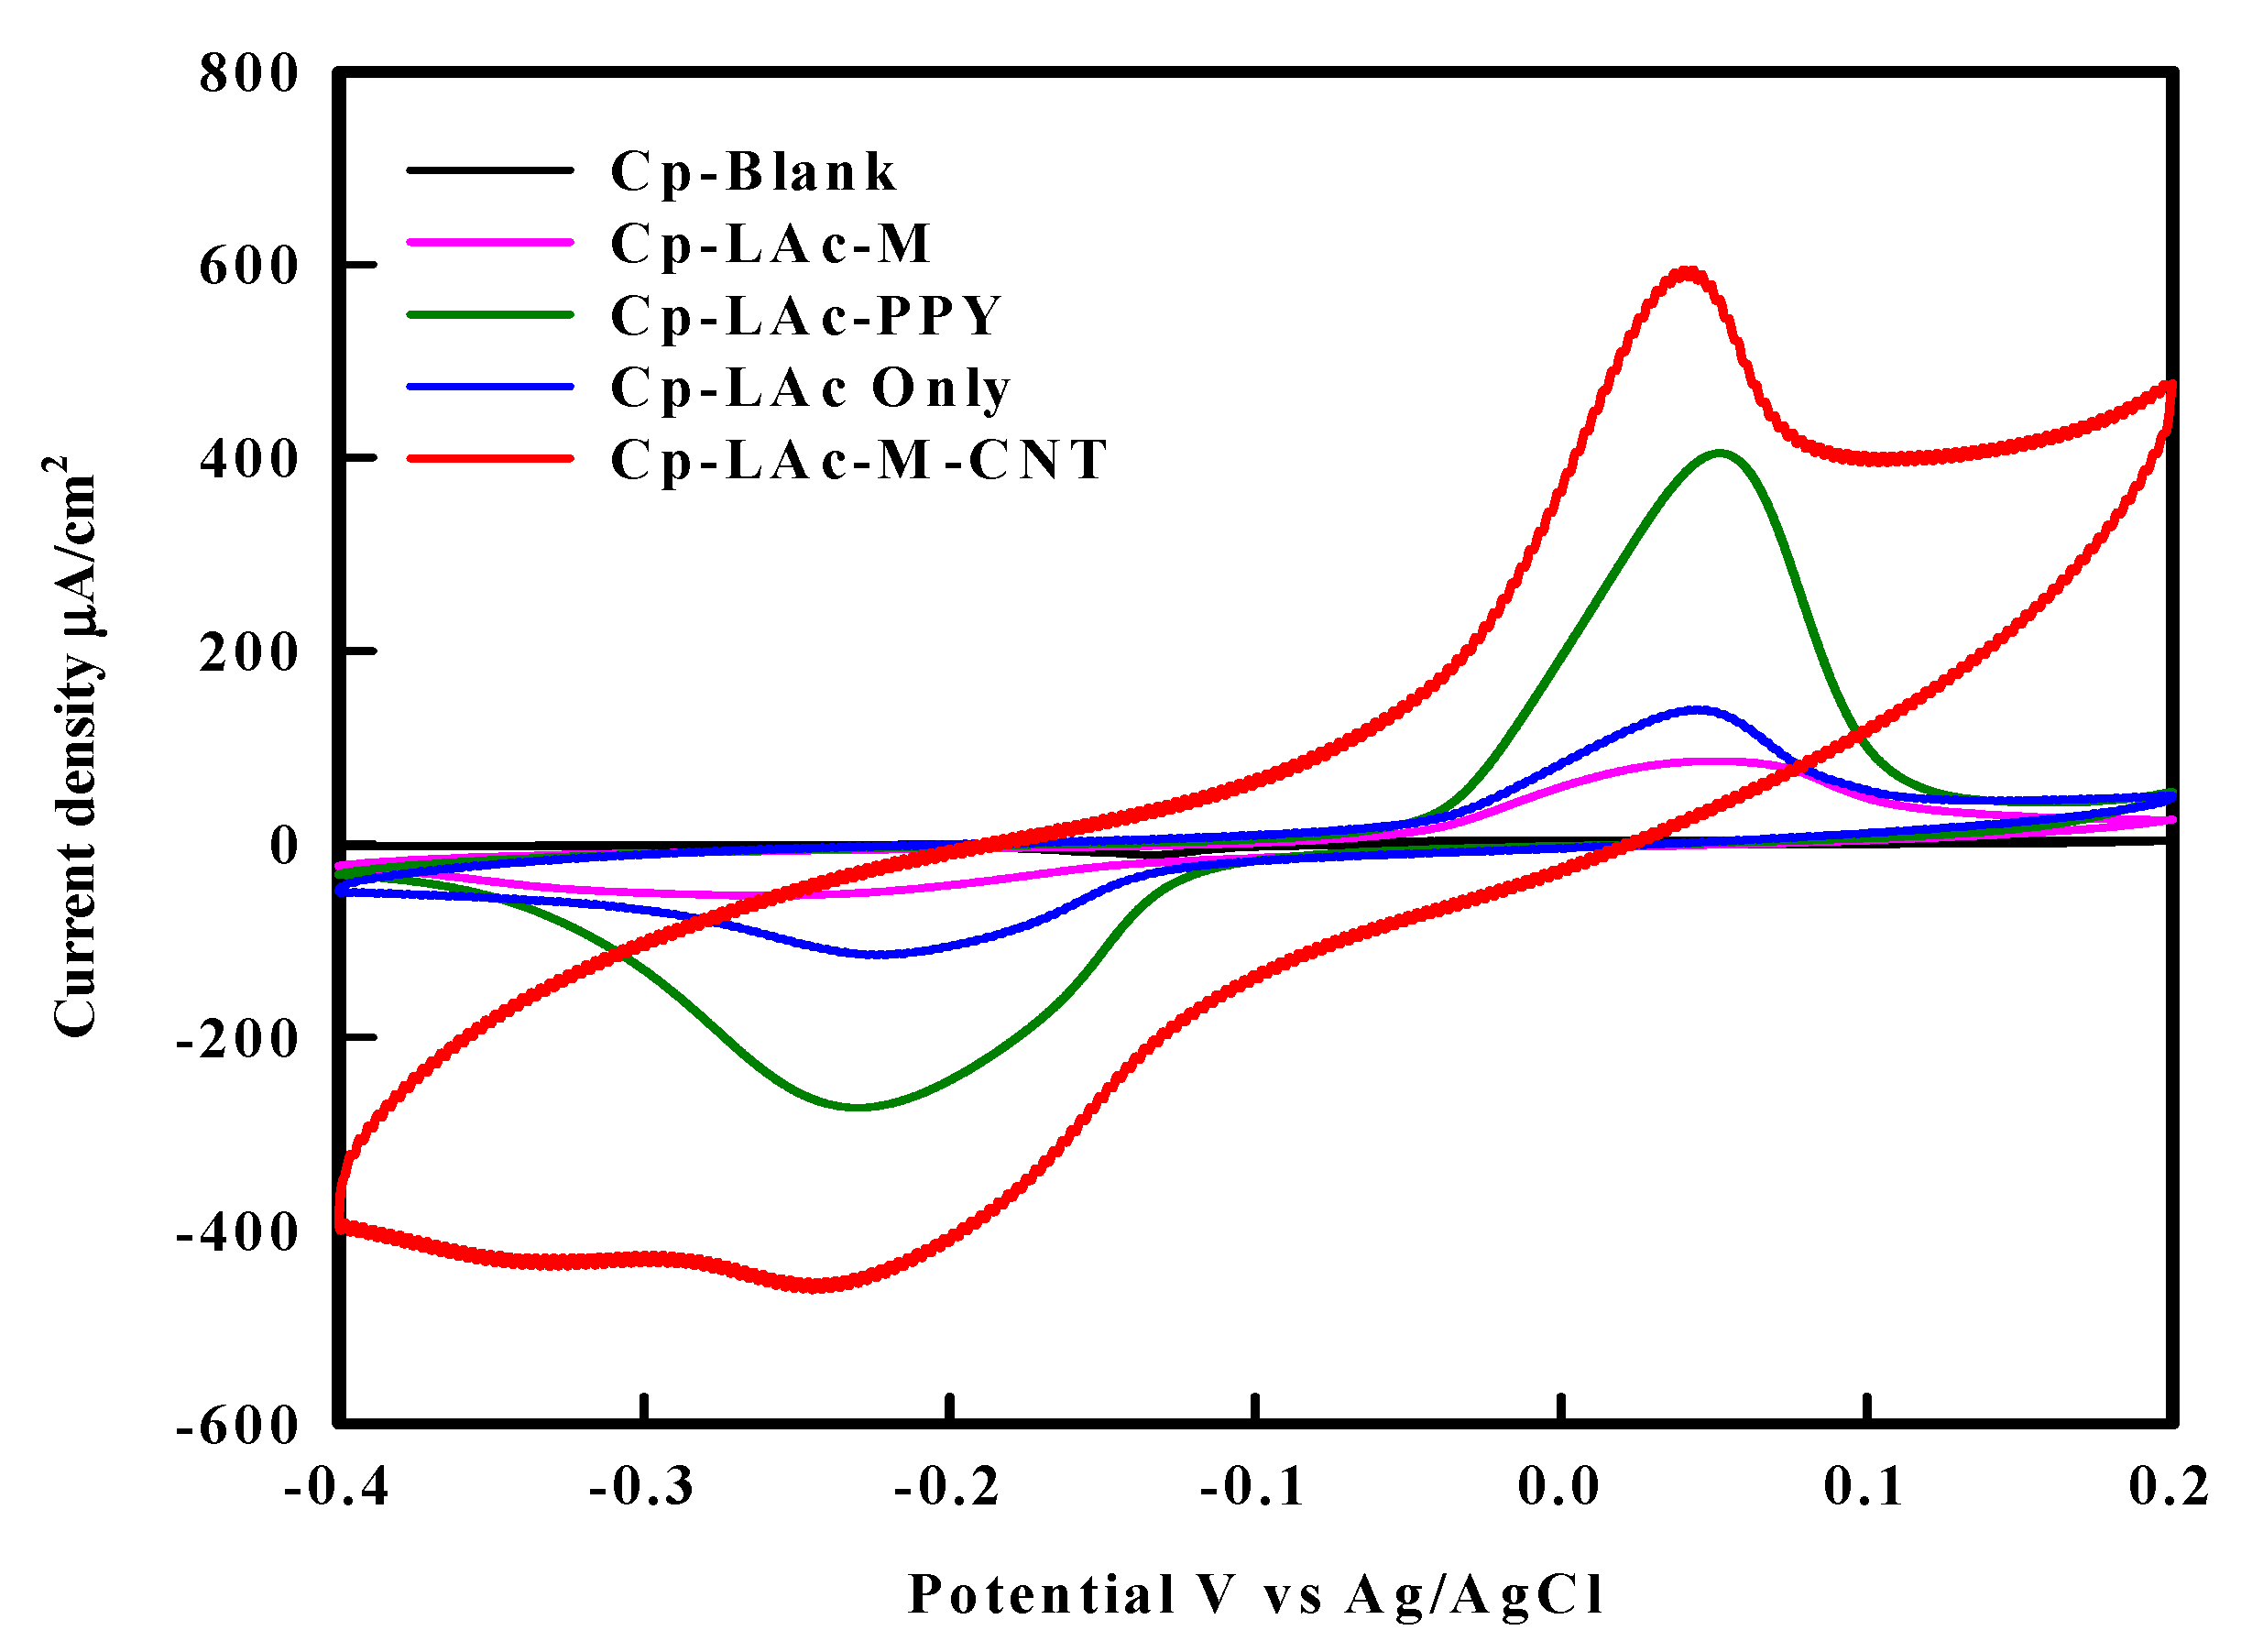
According to the voltammograms of the hydrophilic biocathodes (Figure 7), the highest reduction peak current was attained by the electrode coated with LAc-M-CNT (red). The performance of the LAc-M-PPY electrode was excellent, too (green). On the other hand, depending on the irreversibility of the electrode, the most durable electrode was LAc-M. This finding demonstrates that the M and CNT combination not only successfully increases the reversibility of the electrode but increases the diffusion rate of the electron transfer. Most importantly, according to the above analysis, the peaks rise evenly, which shows efficient mass transfer among the modified electrodes.
2.4. Characterization of the Electrode Using Electrochemical Impedance Spectroscopy
2.4.1. Bioanode Impedance
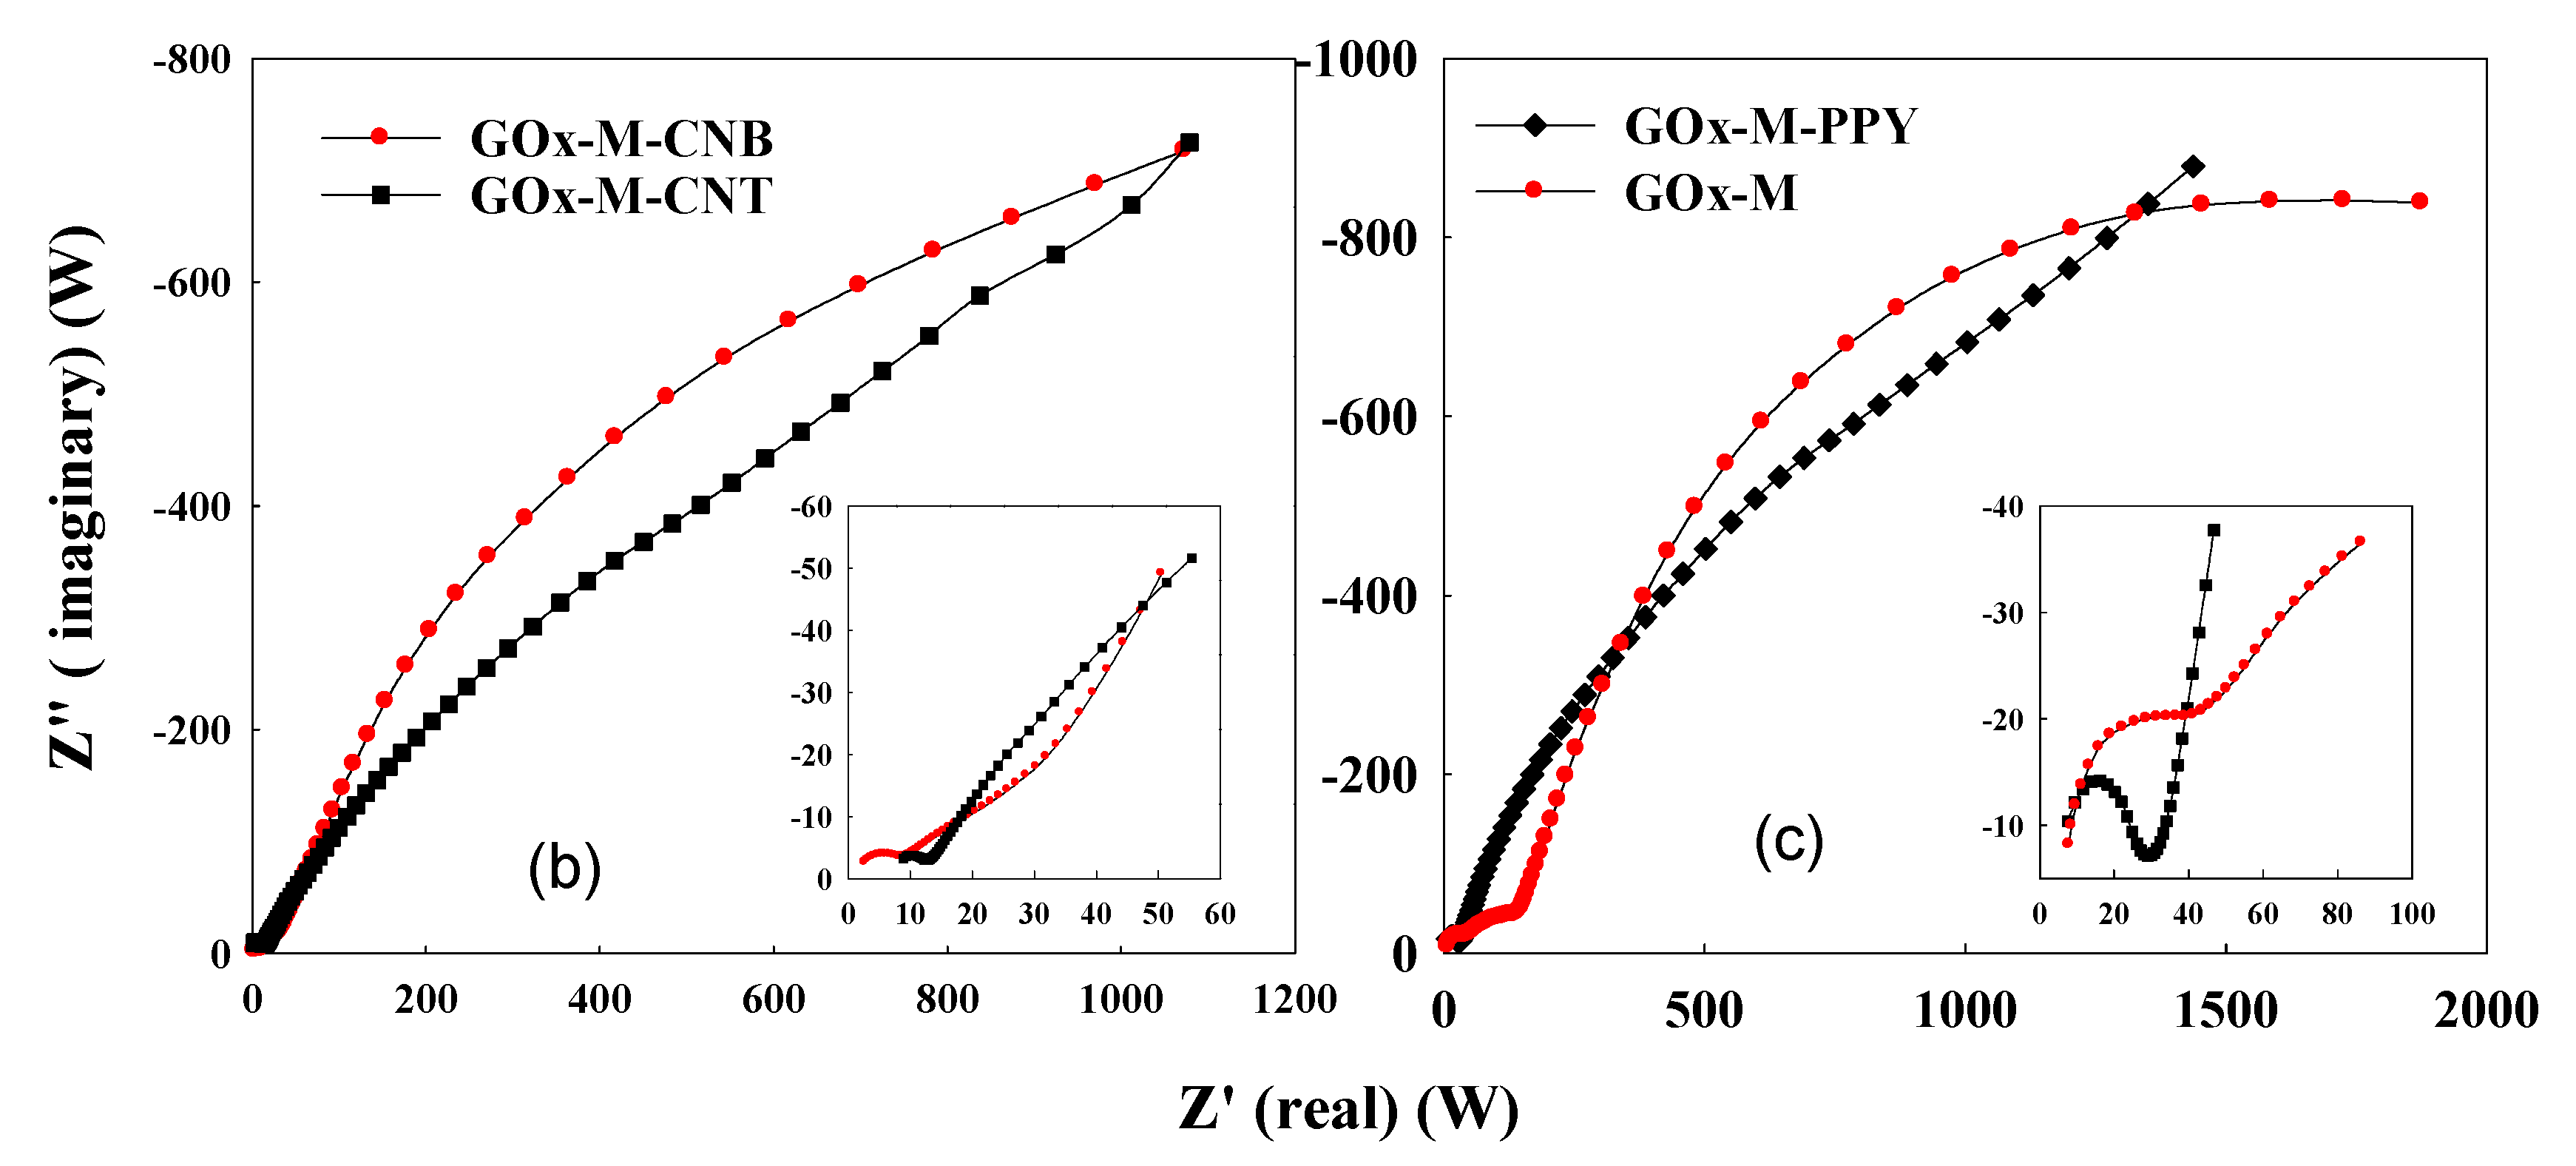
Enzymatic biofuel cells have an excellent anodic internal resistance, which plays a significant role in their polarity of resistance. The mechanism of oxidation occurring at the bioanodic electrode surface causes the anodic charge-transfer resistance to decrease significantly. This effect shows the catalytic process and contrivance of the bioanode in terms of electron transfer, as illustrated in previous studies [25,26]. In this work, GOx was immobilized with different conductive materials (CNT, carbon nanoball (CNB), and PPY), and each was analyzed using EIS. Figure 8 shows that GOx-M-CNT has higher charge resistance, which indicates better oxidation and stability than GOx-M-CNB. The best charge resistance is observed for GOx-M-CNT (1.05 × 10⁻⁹ Ω), as shown in Table 2.
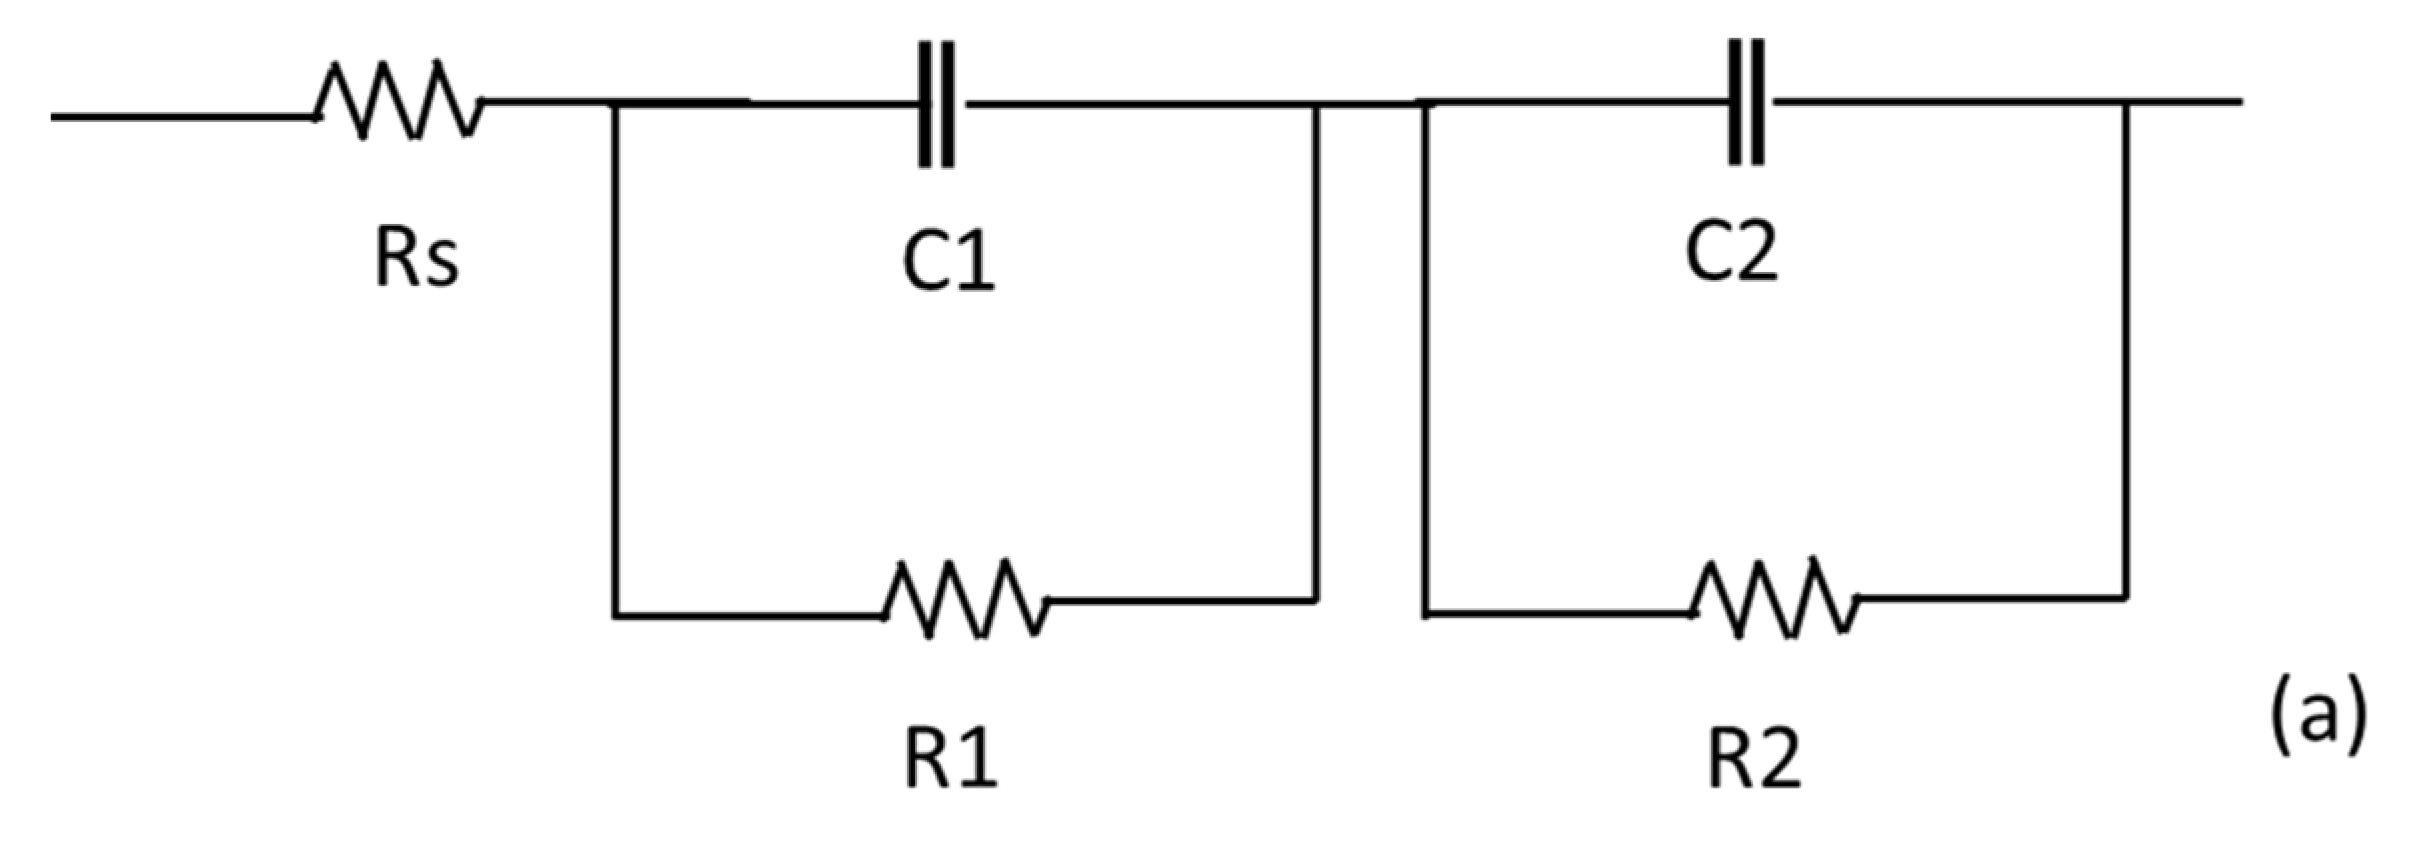
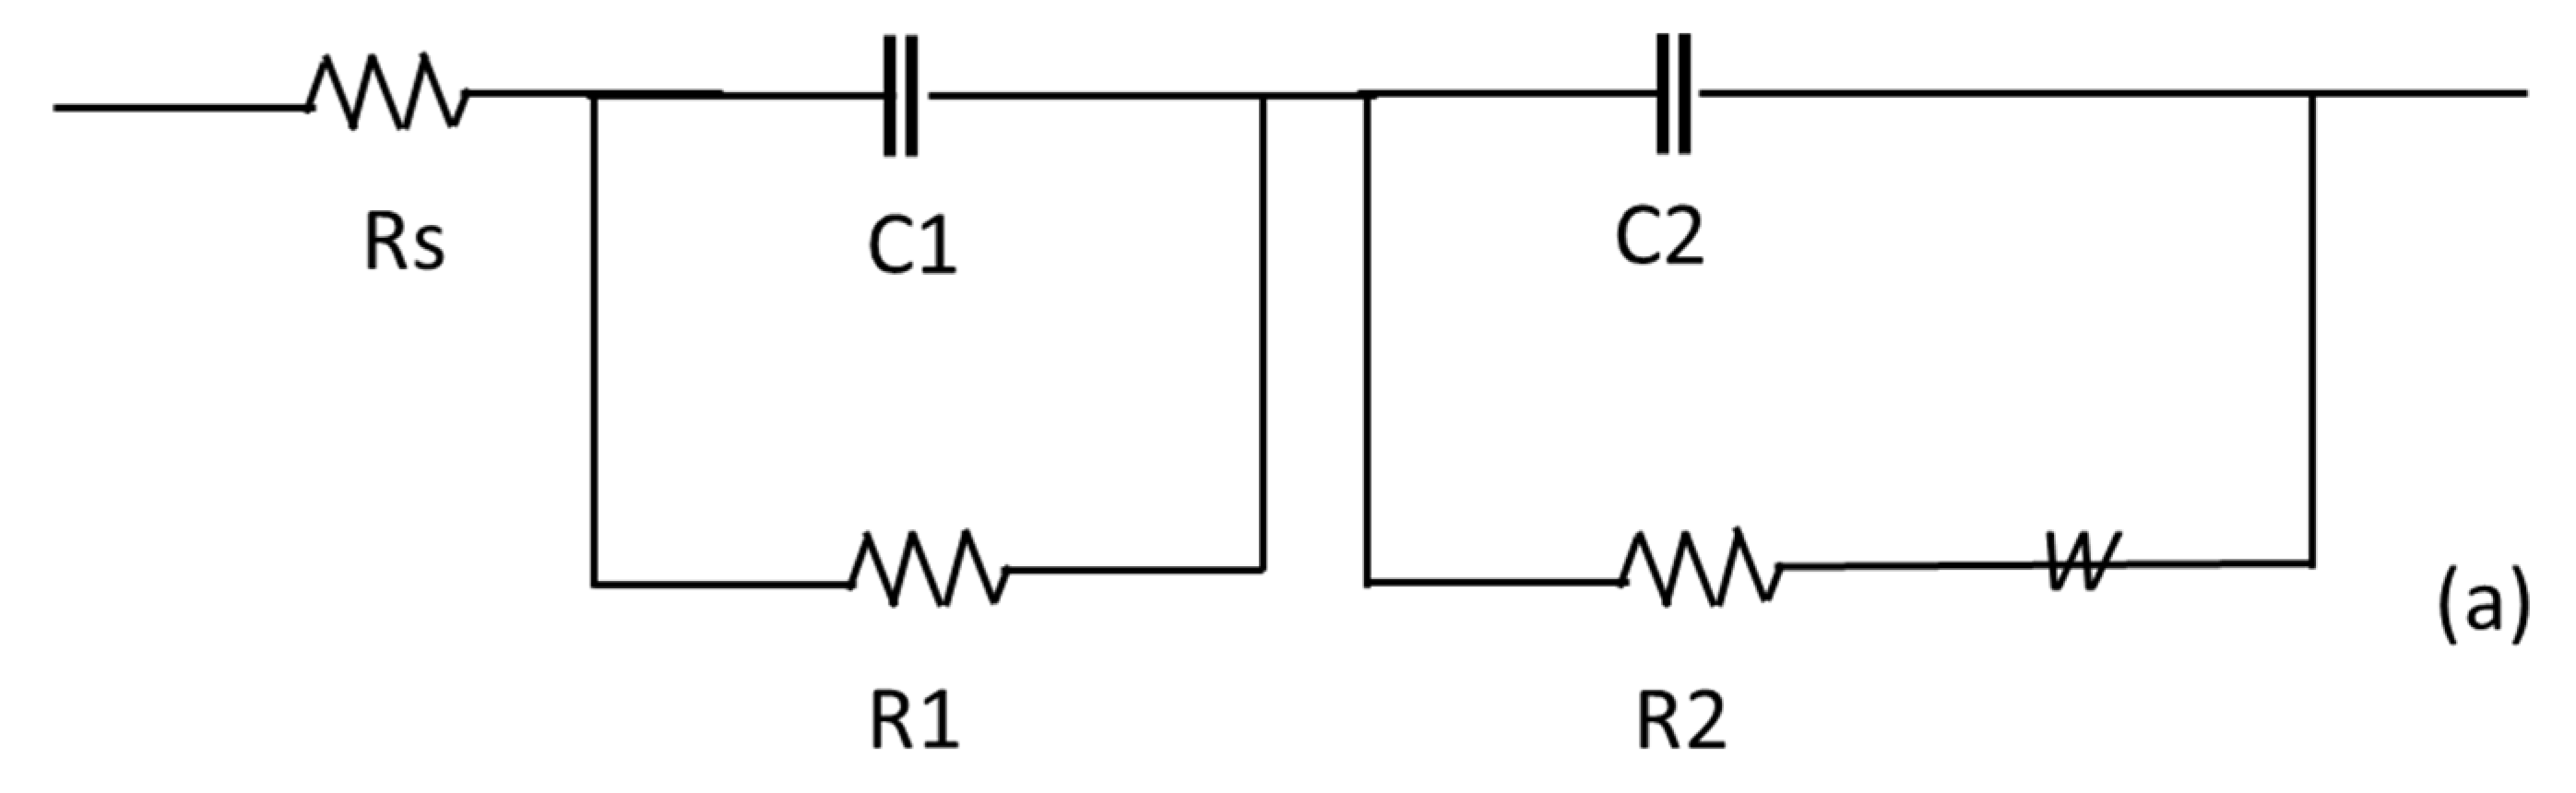
The circuit characterization of the enzymatic electrode surface shows two distinct layers, which involve the inner and the outer layers, respectively (Figure 8). This type of circuit diagram generally represents a permeable bioelectrode surface, which indicates several holes on the surface of the electrode. The conducting layers are pointed at these holes. Additionally, the immobilized layers are arranged around each other. It is noticeable that there is no semicircle distance curve, which means there is an efficient mass transfer, and for the bioanode impedance, the Warburg impedance data are absent. Warburg (W) is not present in the equivalent circuit. The outer layer is considered as the measurement electrode layer. R1 signifies the electron-transfer resistance of the electrode surface; other factor constants such as R2 and C2 are located on the inner-layer surface of the electrode, and their effects do not change. The capacitance of the outer surface of the electrode is taken to be C1 (Table 2). The desirability is due to the positively charged surface and the negatively charged electrode surface, which permit a redox chemical reaction. Negatively charged redox molecules are attracted to the positively charged electrode surface. Meanwhile, electrostatic movement, diffusional effects, and redox concentration affect the surface of the electrode, as these conditions increase the electron movements near the electrode surface, and the electron-transfer resistance is reduced. Table 2 shows that GOx-M-CNT demonstrated a lower charge transfer resistance. This finding is due to the increase in surface area. The charge transfer resistance decreases in the order of GOx-M-CNT > GOx-M-CNB > GOx-M (Table 2). This phenomenon of layer-by-layer covered electrode surfaces is also observed in studies that have employed this Nyquist plot type [7,27,28,29].
However, the kinetic rate of the enzymatic reaction according to the characterization of the redox-oxidation formation rate is representative of the enzymatic biofuel cell (EBFC). The bio-anodic charge-transfer resistance measurements show that this effect is well established in the literature [26,30]. The electrochemical deposition of the bioanode electrode increases the impact on the surface area of the bioanode electrode and hence reduces the charge transfer resistance. The effect of the enzymes on the surface of the electrode catalyzes the oxidation of glucose and also decreases the charge transfer resistance.
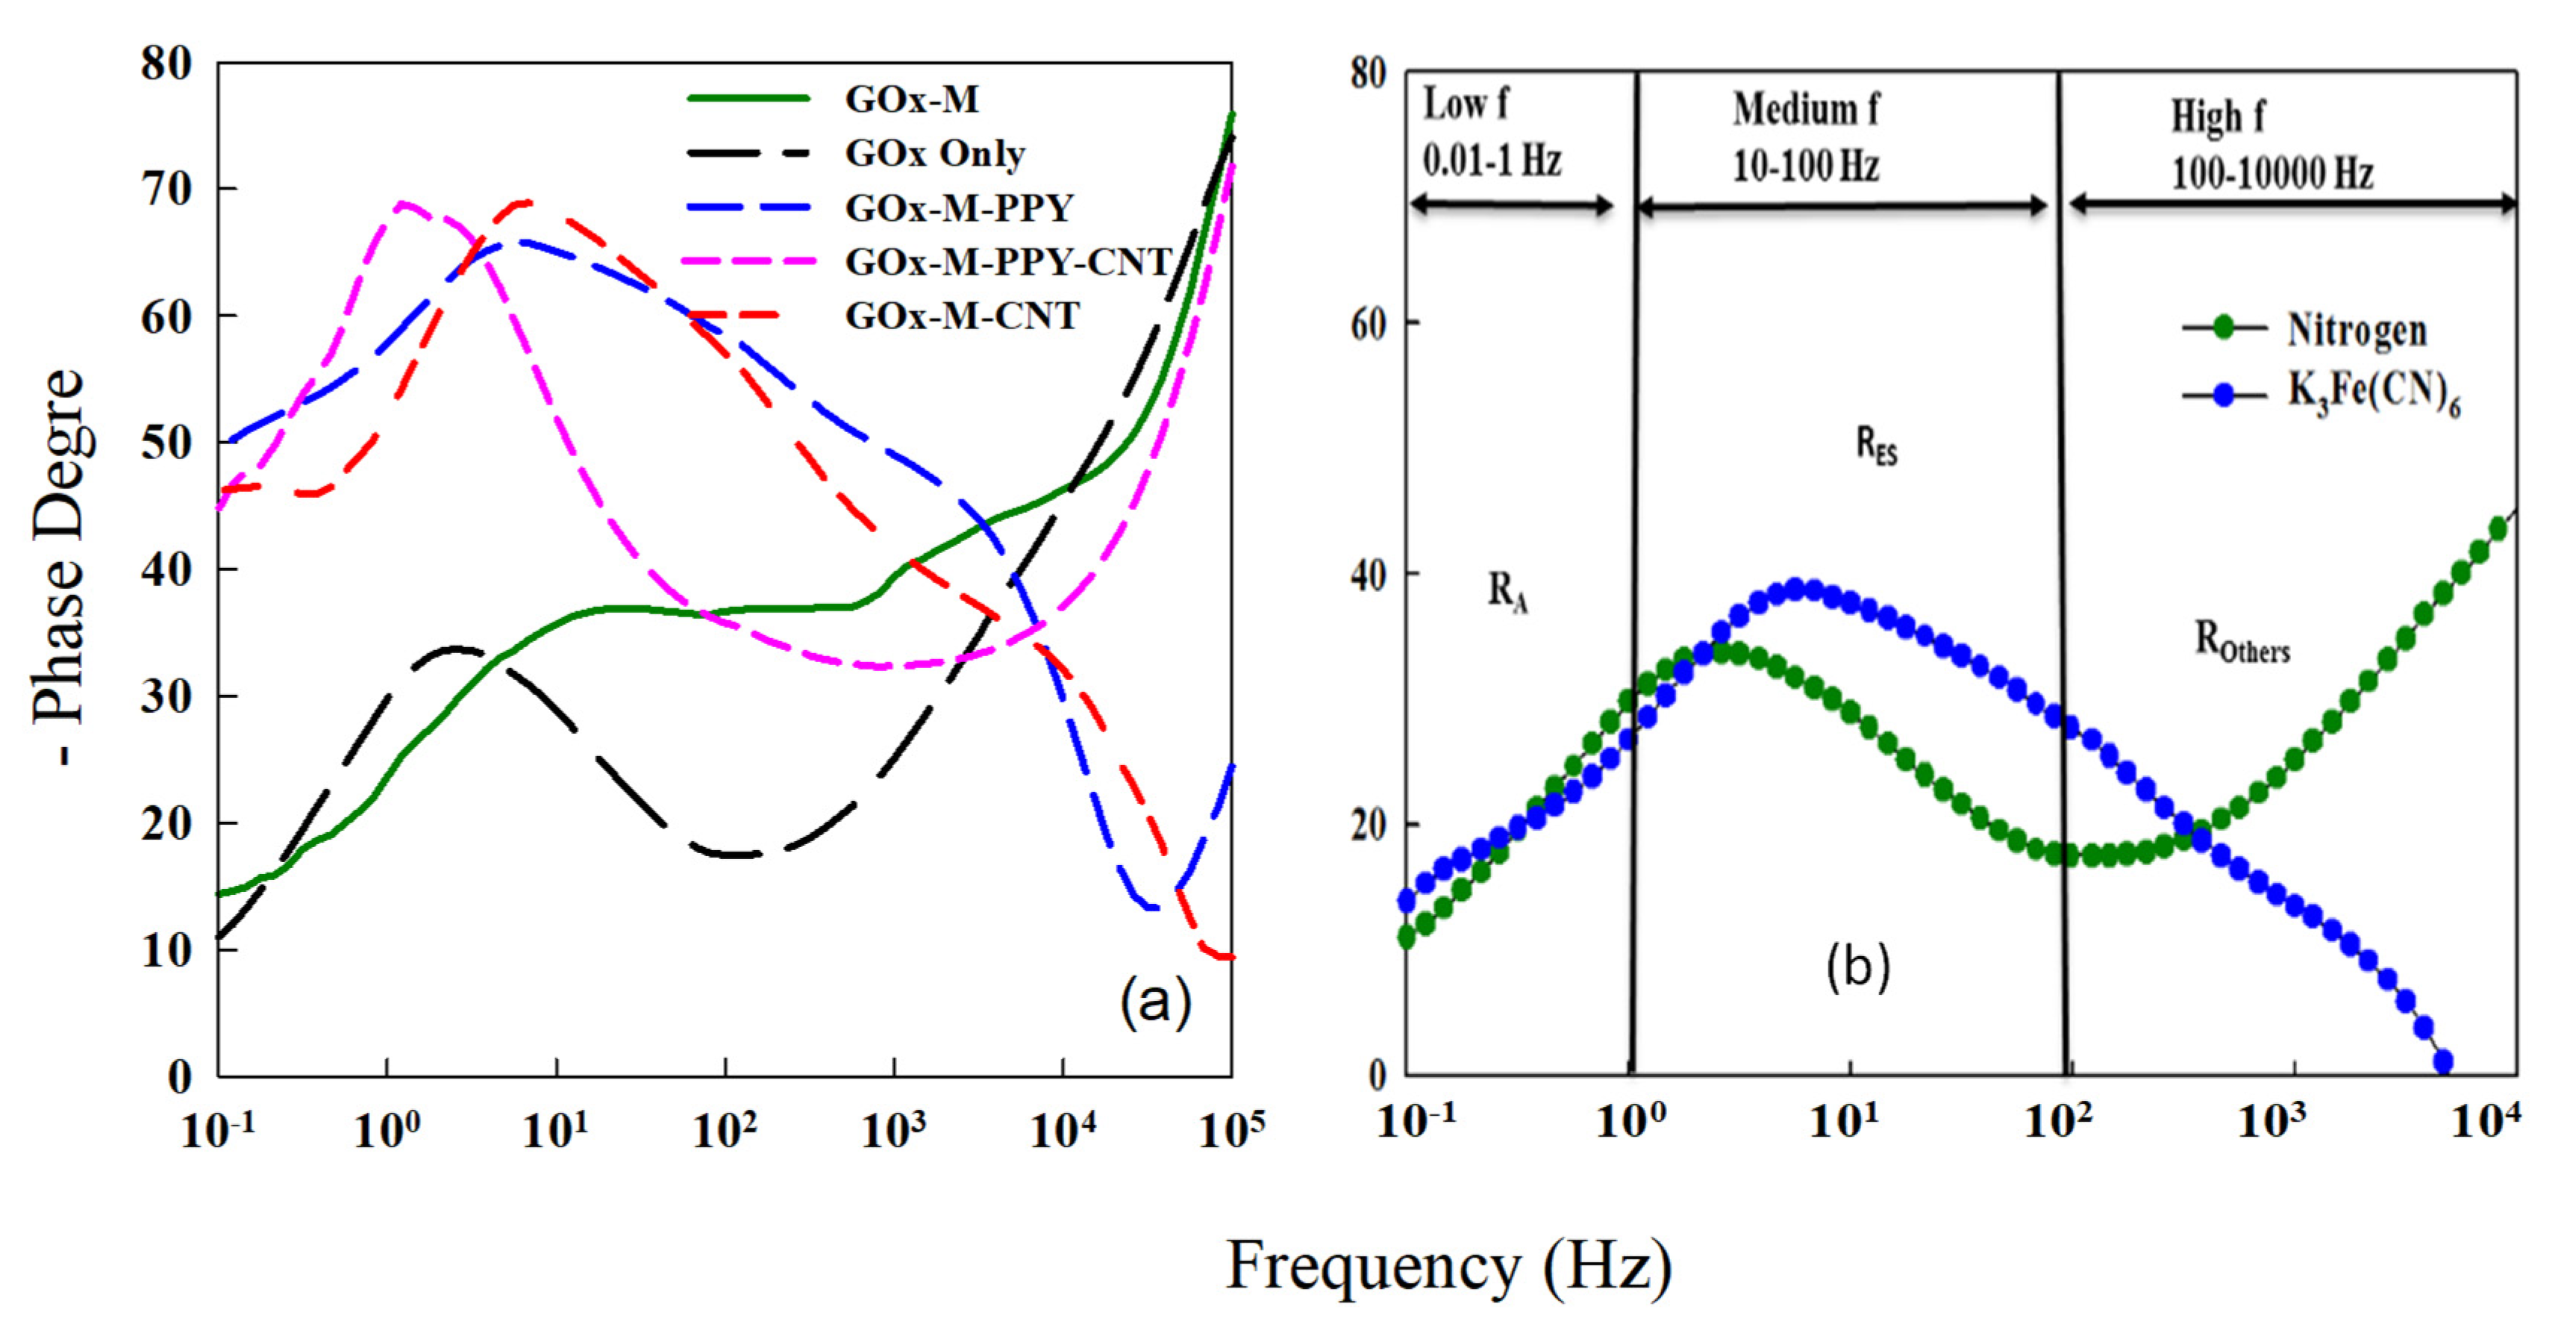
Effects of Bioanode Mediators
Some enzymes can perform well with some inorganic mediators. In this case, the mediator selected for the bioanode was K3Fe(CN)6, as it serves as the electron-transfer agent or intermediate between the biological enzyme (GOx) and the bioanode electrode. Interestingly, few enzymes and microorganisms (bacteria) help in terms of the electron-transfer mechanism in bioanode systems. The analysis of mediators in biofuel cells can be done using EIS, through which interpretations can be shown from low to high frequencies [31]. It can be observed that the Bode phase angle plot in the frequency region is attributed to the charge-transfer resistance (RES) of the K3Fe(CN)6. Usually, the concentration of mediators in the bio-anolyte is deficient, and thus, they confer low charge-transfer resistance, but the mediators offer excellent redox-electron transfer (Figure 9b). Generally, RA denotes the charge-transfer resistance for the bioanode, while Rother is the charge-transfer resistance of some metal-salts that are dissolved in the electrolyte (PBS).
The developed biochemical mediators help the bio-anolyte by decreasing the charge-transfer impedance for the enzymatic redox-oxidation and, kinetically, improve the rate of electron transfer between the bio-enzyme and the bioanode electrode. It is observed that the magnitude of the frequencies reduced in the lower region. This finding is due to the modification of the electrode with both a CNT and CNB. This effect can be extrapolated as the charge-transfer resistance impedance of the redox-oxidation substance (substrate) (RA) (Figure 9a). CNT has a better charge transfer resistance than CNB. With this evidence, one can say that the presence of mediators, either organic or inorganic in a redox-chemical reaction, aids the reaction in terms of speed. Some experts have reported that the reaction with mediators is 10–20 times faster than with most electrochemical redox-oxidation, which involves some rate-limiting-step on the bioanode [25,26,31,32,33].
Effect of Assembling Agents
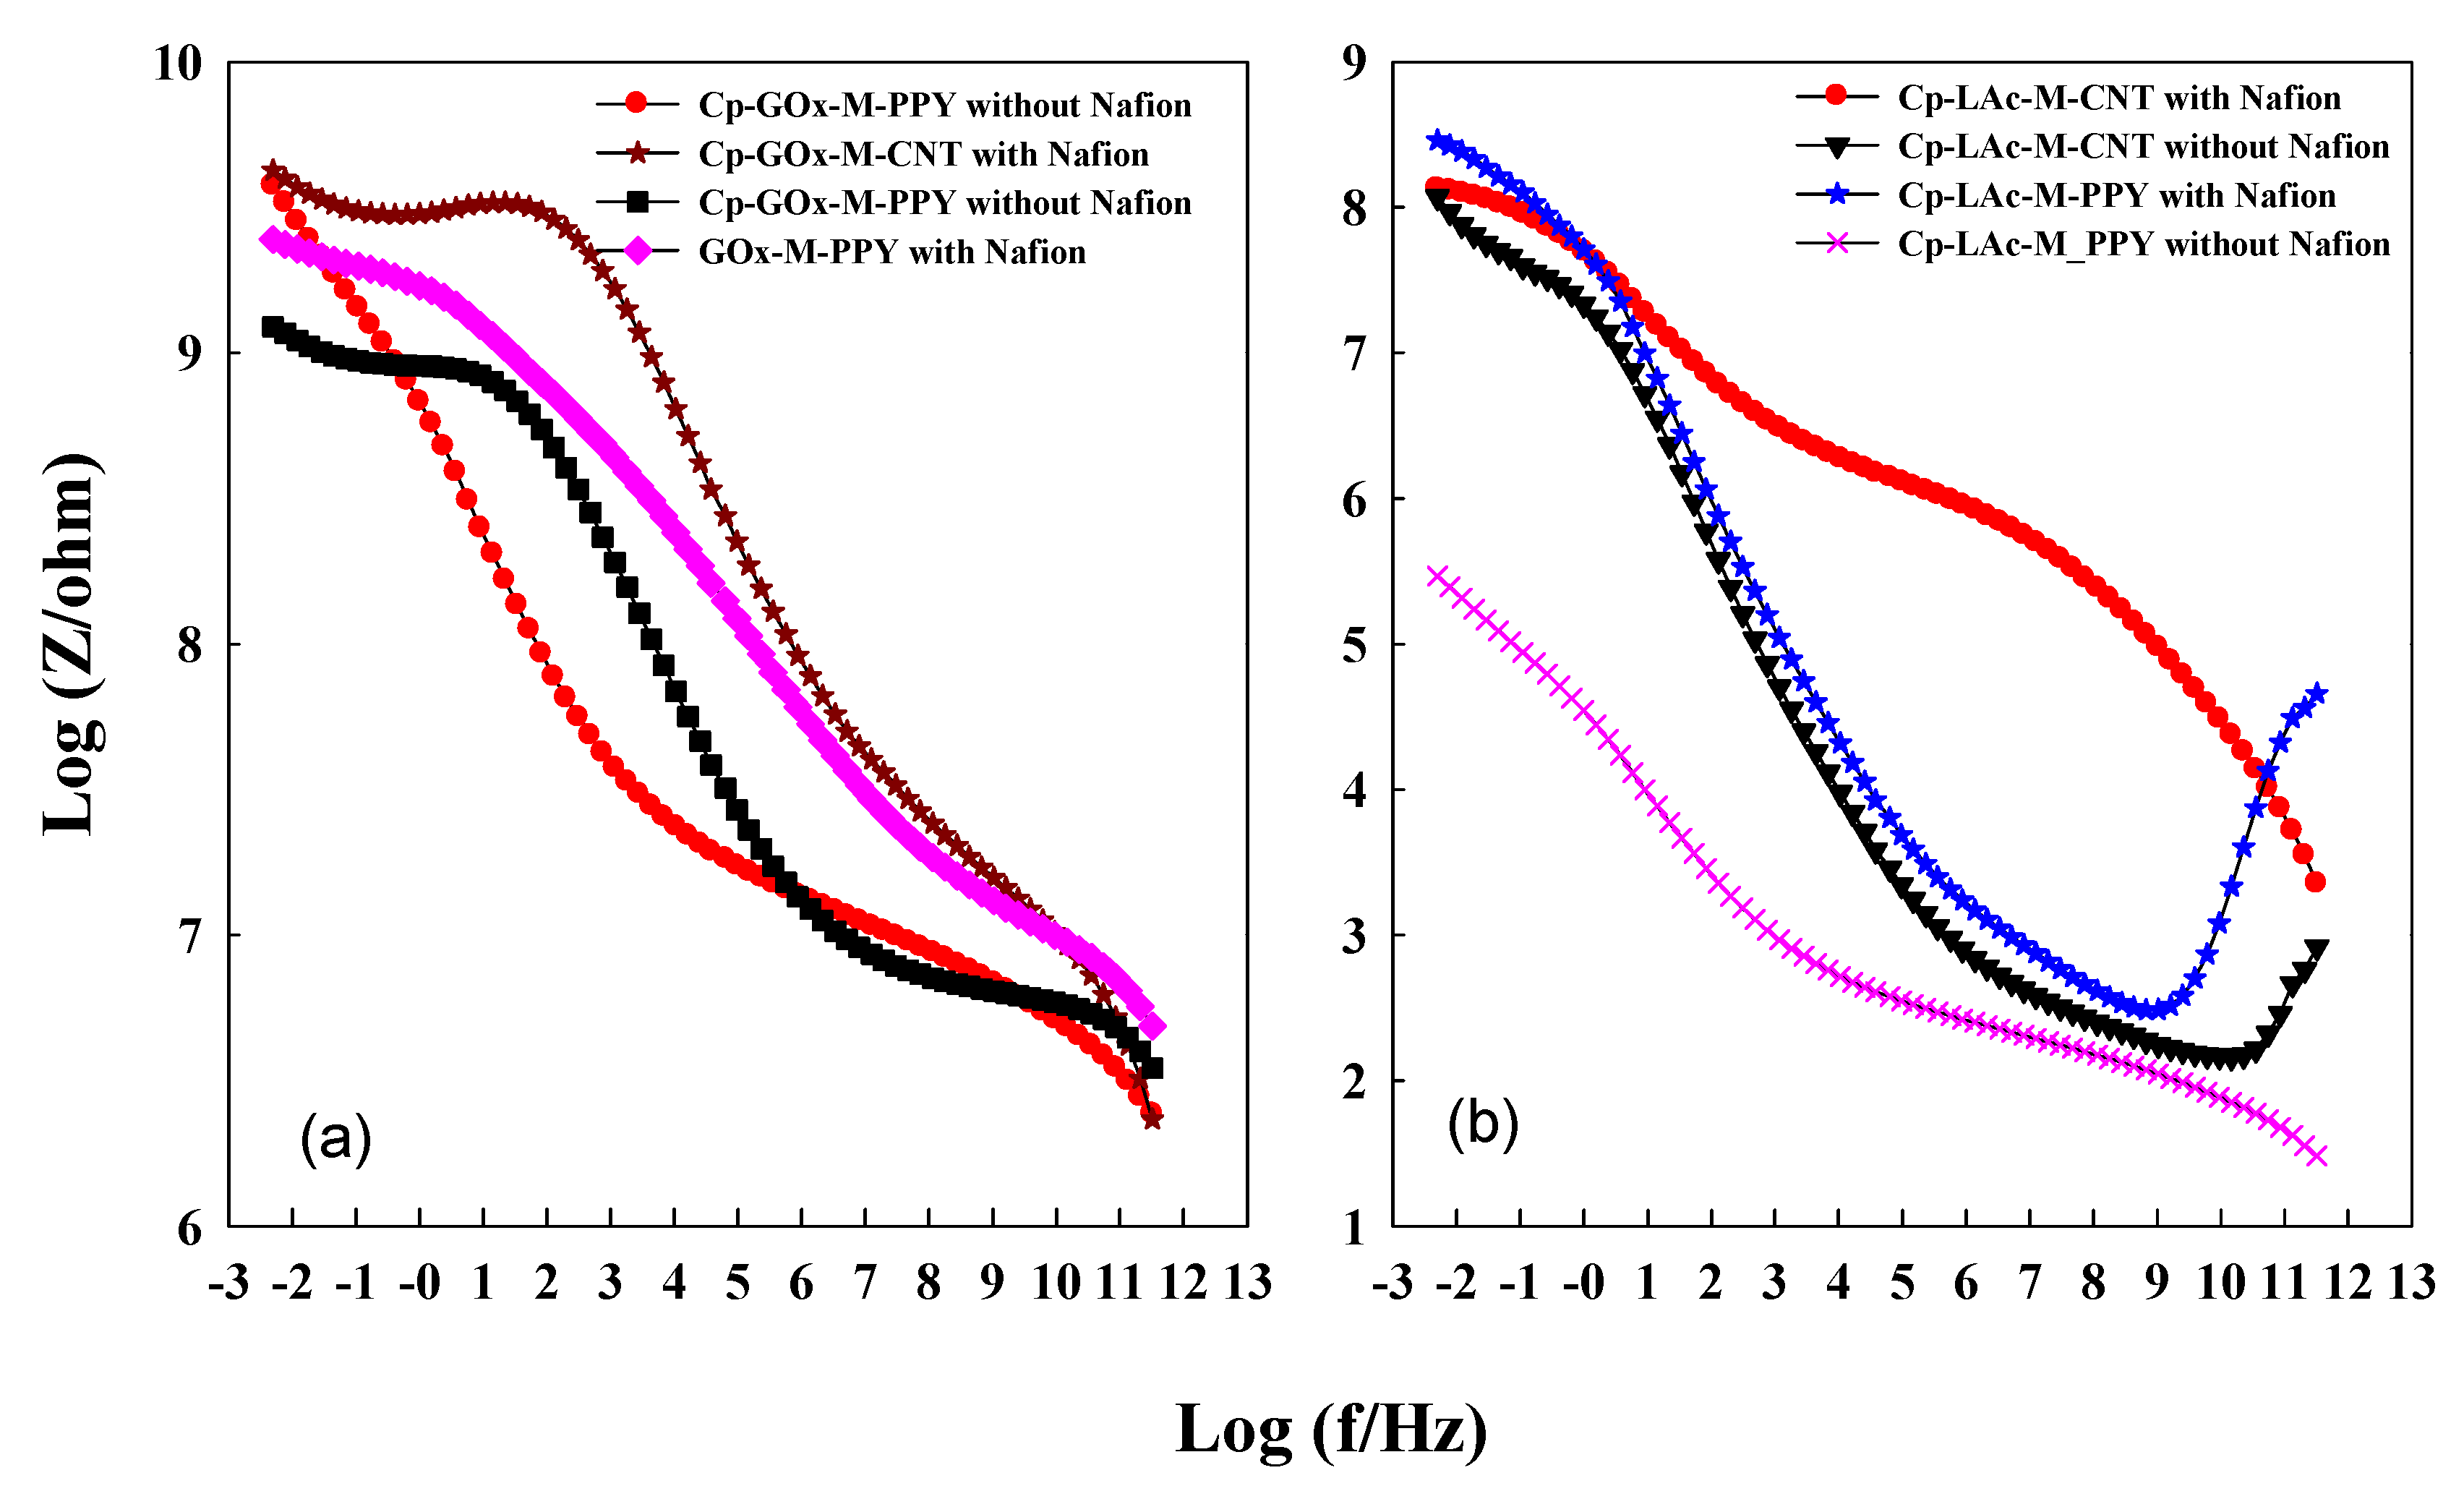
Nafion solution was used to allow the ion exchange between the bioanode and biocathode solution. Therefore, to verify the effect of the Nafion, we examined the fuel cell with Nafion and without Nafion solution as an assembling agent, and the results show that the EBFC with Nafion solution shows a high-power output than that without Nafion solution, this reflected on the EIS responds on the EBFC, as shown in Figure 10. The Bode plot shows that the impedance of the biocathode and bioanode with Nafion solution is higher than that without the Nafion solution. The impedance of the bioanode and biocathode with and without Nafion solution decreases over time owing to the surge in the porosity of the surface layers. This effect was also studied in previous work [26,31].
2.4.2. Characterization of the Biocathode
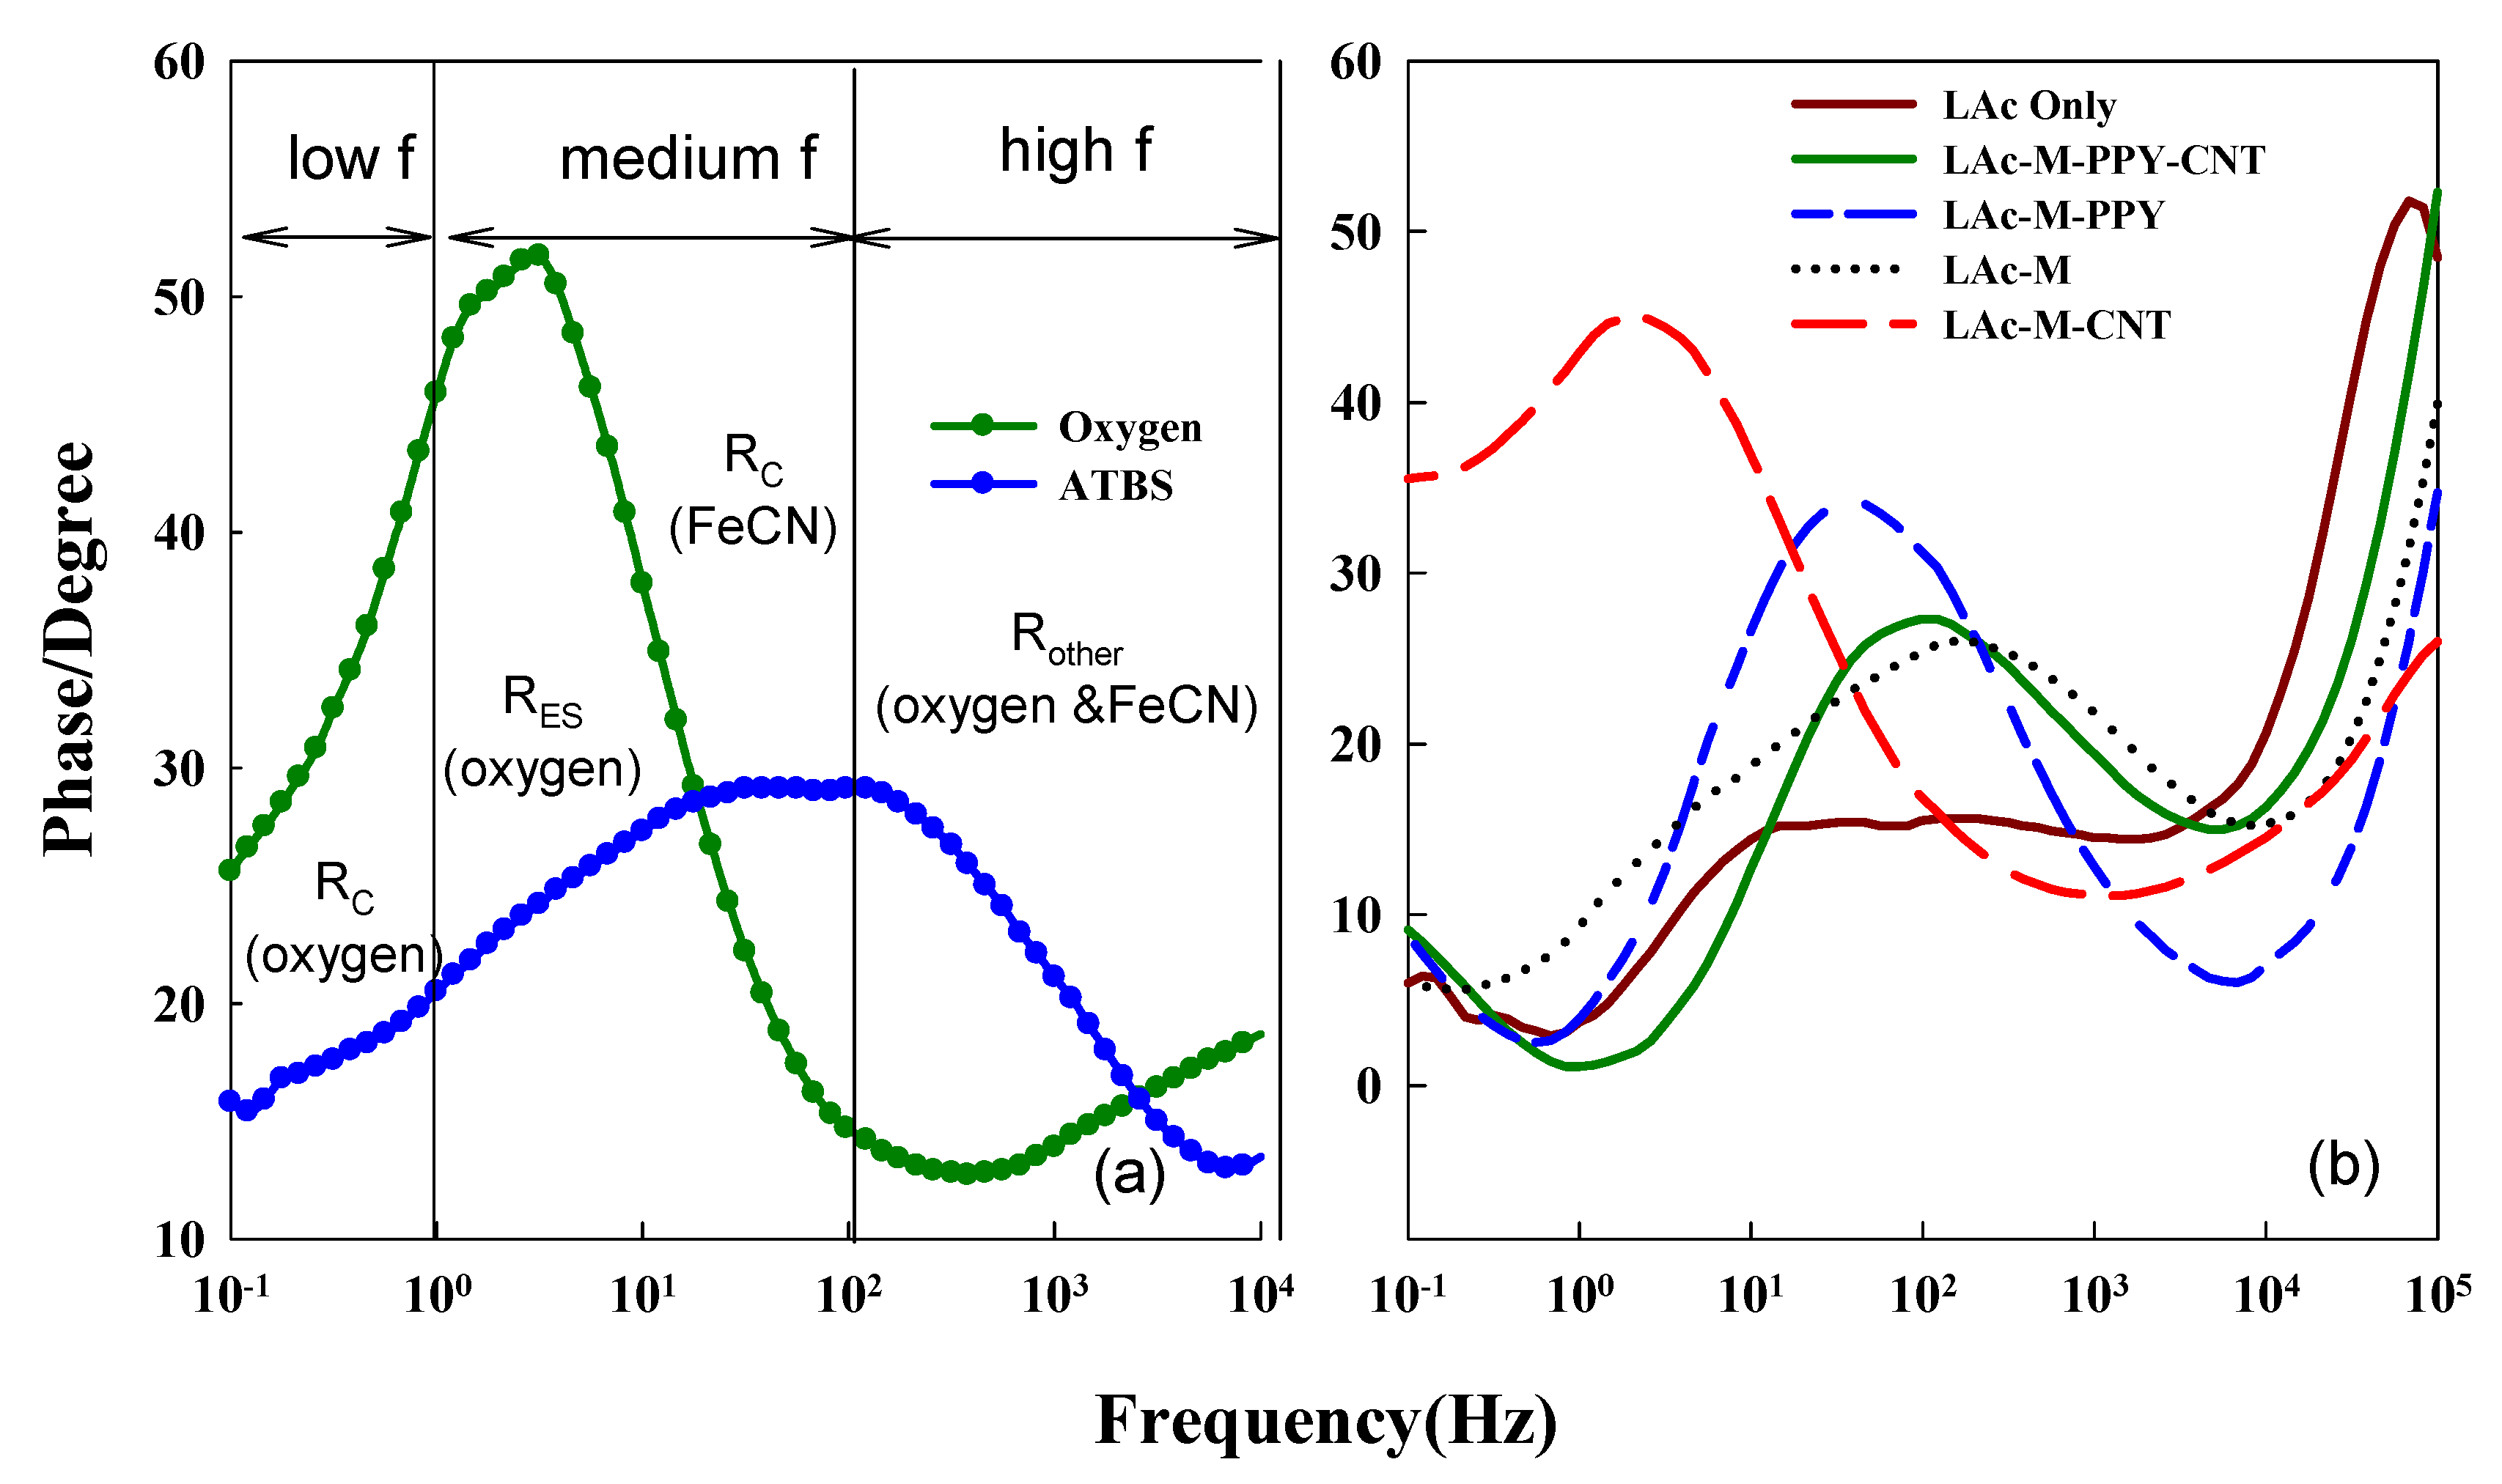
The oxygen-reduction at the biocathode by the LAc enzyme is a less known focal limiting issue in the enactment of EBFC, even though there has been much enhancement in the development of a well-organized catalyst [34,35]. In this biocathode system, both the charge transfer resistance and the mass oxygen transfer are the primary limiting determinants for the enactment of EBFC. For the bioanode, the maximum current is reached because of the maximum biochemical conversion rate [36,37]. However, it is different in the biocathode because the main limiting factors are the poor mass transfer and bad solubility of oxygen. Figure 11a shows the Bode plot for the ABTS cathode mediator, which contains a maximum of two factors or constants, which are related to the metallic salt present in the electrolyte at higher frequencies and ABTS reduction at medium frequencies. Meanwhile, as shown in the Bode plot, the oxygen biocathode contains three factor that are related to the oxygen reduction at lower frequencies. According to Ramasamy et al. [26], there is a substantial time constant in the medium frequency region, which is linked to the metal salts in the electrolytes and interrelated with the charge-transfer impedance of the mediator, in this case, ABTS. This can also be observed for the biocathode, with different combinations of the LAc enzyme with the various mediators, and it is observed that the LAc-M-CNT combination shows a more suitable impedance than the others.
Effect of Biocathode Material Type
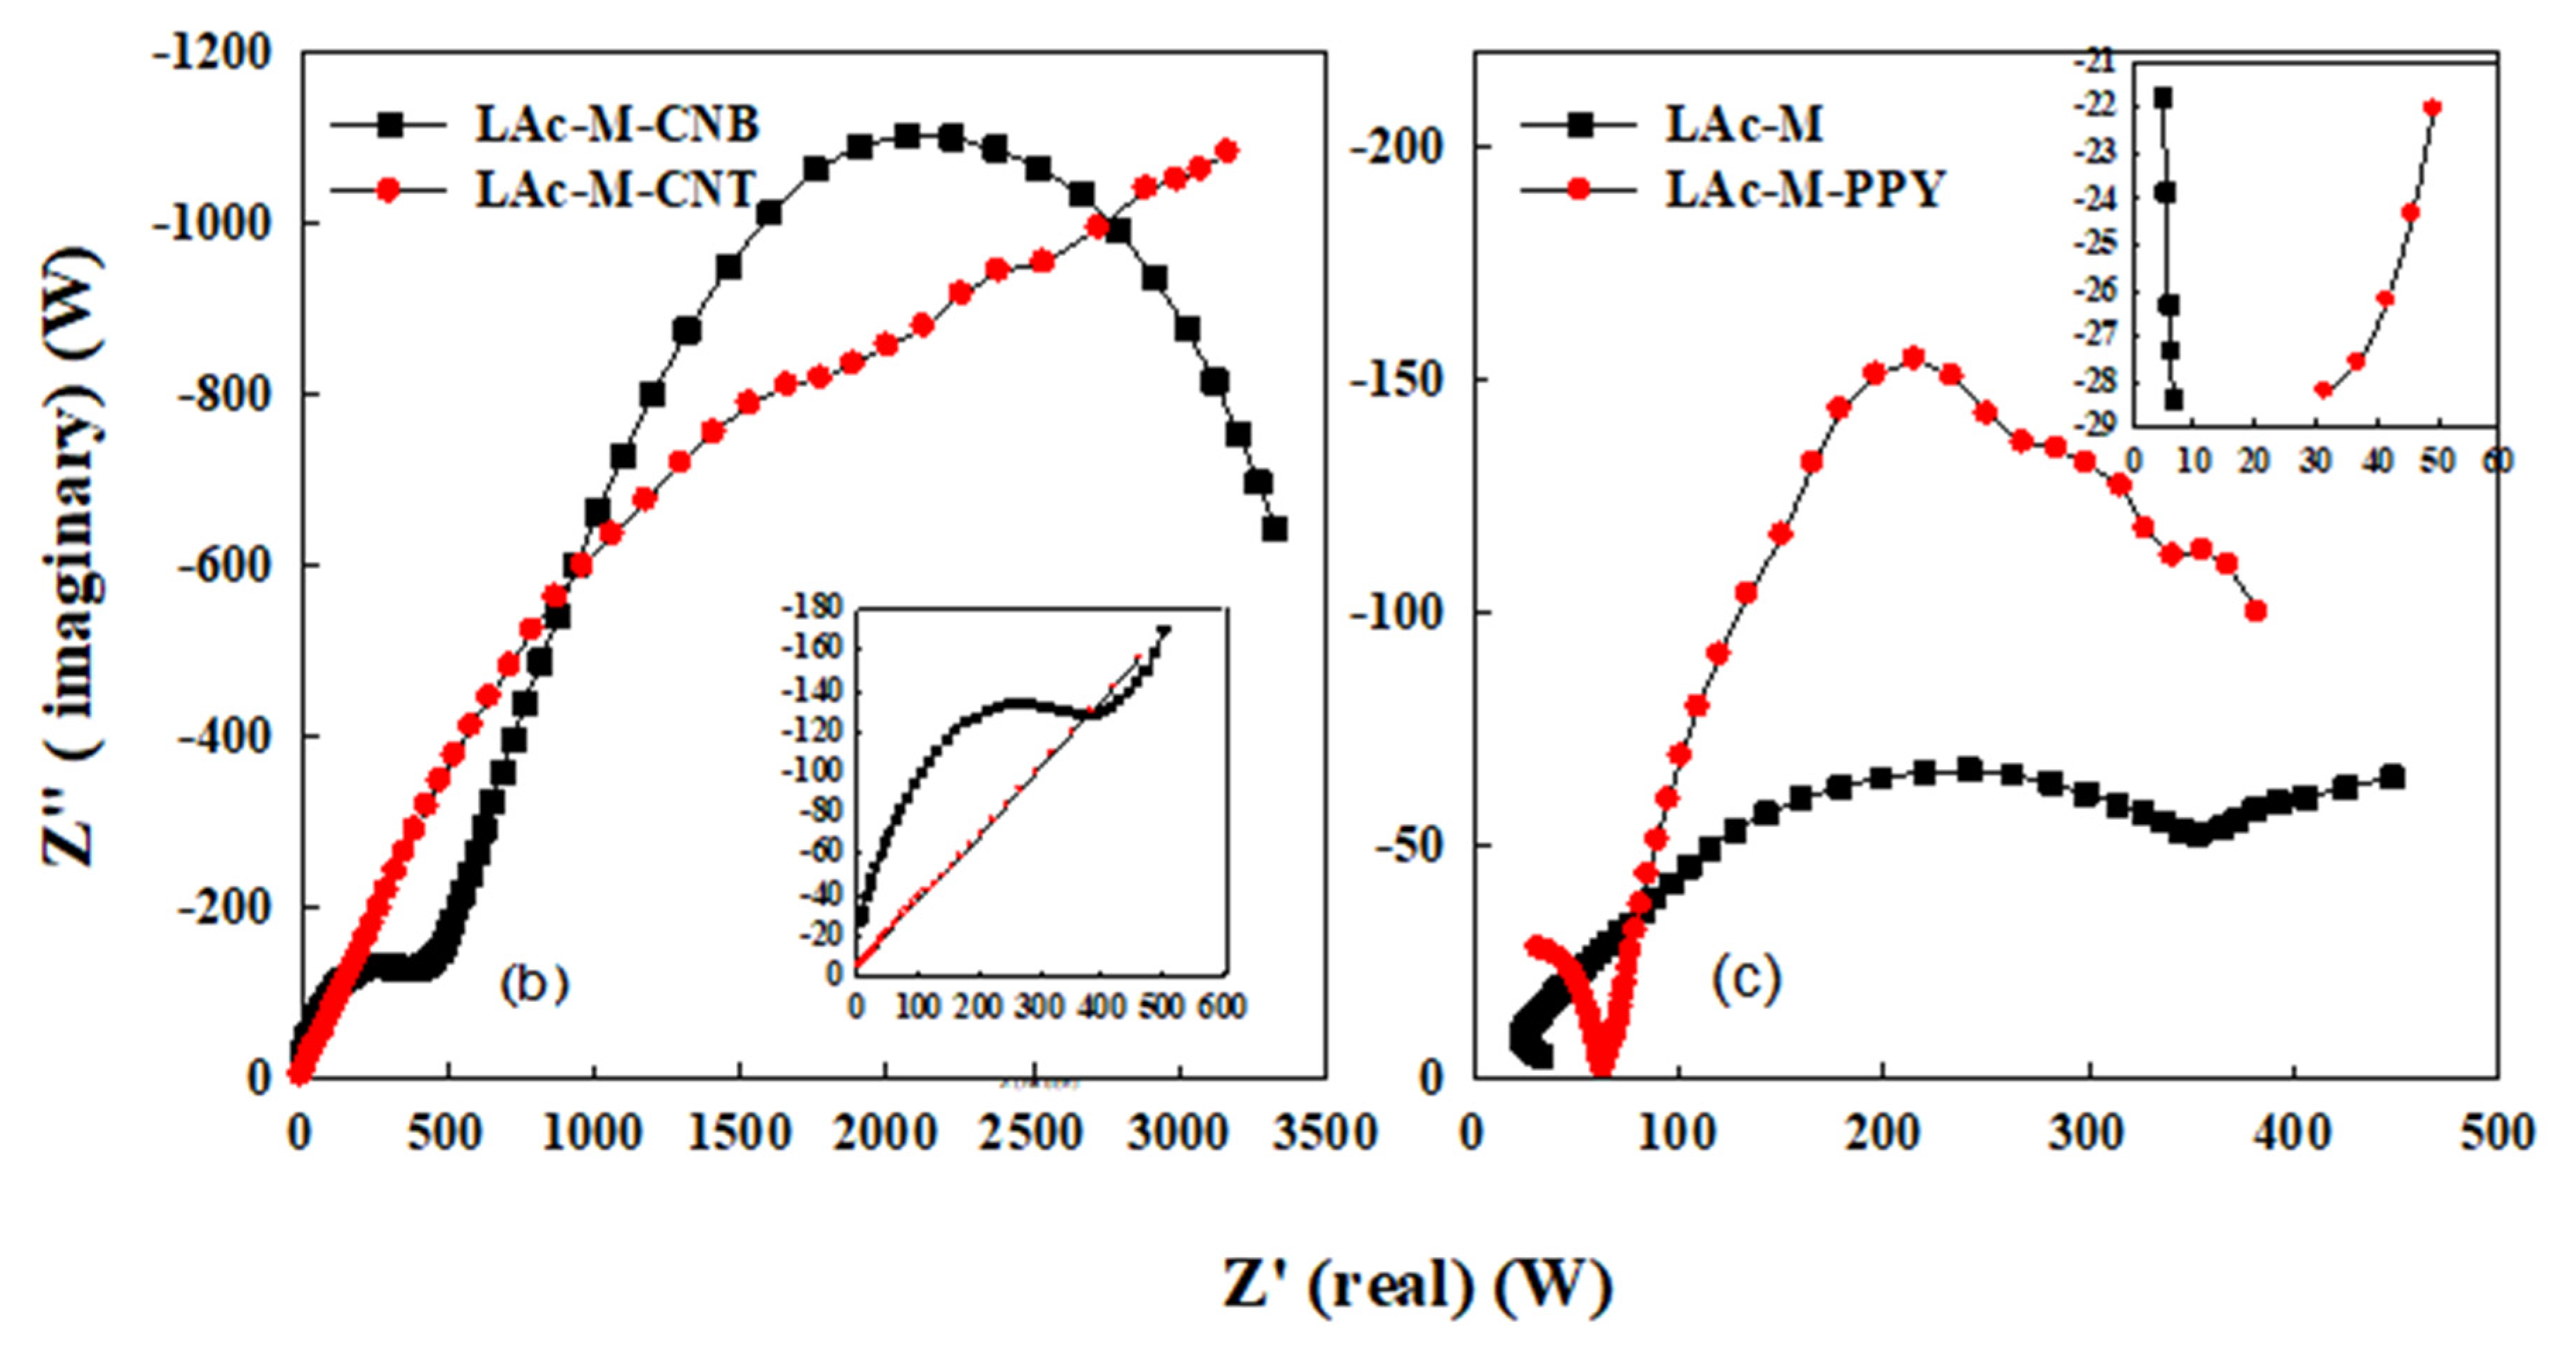
The type of biocathode substance is of considerable significance regarding steadiness. Martin et al. mentioned the importance of electrochemical viability for improving the EBFC, predominantly in the case of air-based biocathode EBFCs [38]. As shown in Figure 12, the carbon paper electrode was modified with ABTS mediator. CP with CNT shows a higher charge resistance than all the other combinations. Therefore, it can be concluded that the LAc-M-CNT biocathode has the best catalytic performance concerning oxygen-reduction chemical redox reactions.
As shown in Figure 12, there is one invisible semicircle and a linear domain, and this linear domain represents the mass-transfer resistance (W), which is formed by redox migration toward the electrode surface. Similar to the bioanode, the equivalent circuit of the biocathode shows an outer and inner layer. The presence of Warburg impedance indicates that there is a low mass transfer from the biocathode because it is still a challenge for the O2 to be reduced by LAc enzyme, as explained by scholars [8,11]. In this experiment, a condition occurred in which the redox experimentation on the electrode surface strengthened the interface. Among biological enzymes, LAc is the best at reducing kinetically slow oxygen. As shown in Table 3, LAc-M-CNT shows an excellent charge transfer resistance (1.45 × 10⁻⁶ Ω). The resistance of the solution also plays a vital role in the mass transfer process, which depends on the pH and other assembling agents.
3. Experimentation
3.1. Chemicals
Phosphate buffer solution (PBS), carbon nanotubes (CNTs), polypyrrole (PPY), 2,2-azino-bis (3-ethylbenzothiazoline-6-sulphonic acid) (ABTS), potassium ferrocyanide (III) K3Fe(CN6), glucosidase (GOx), and laccase (Lac) were purchased from Sigma-Aldrich (St. Louis, MO, USA). Glucose, N-(3-dimethylaminopropyl)-N’-ethylcarbodimide, and N-hydroxysuccinimide were purchased from Fisher Chemical (London, UK).
3.2. Electrolyte Solution
In the PBS (pH 7, 0.2 M) preparation, monosodium phosphate (0.477 mol) and disodium sulfate (0.523 mol) were dissolved in distilled water. The pH of the mixture was measured using a pH meter (JENWAY 3510, Barloworld Scientific Ltd., Dunmow, Essex, UK), and adjusted by using sulfuric acid or sodium hydroxide to attain a neutral pH. Furthermore, water was added to increase the volume of the phosphate buffer to 1 L, at pH 7. Generally, PBS was used as the stock solution (1 M). Later, the stock solution was diluted to form other buffer quantities with the required concentrations such as 0.4, 0.5, or 0.1 M. This research purposely used Sorensen’s phosphate buffer solution (pKa = 7.2, pH 5.8–8.0, 0.1 M), which consists of NaH2PO4 and Na2SO4. Citrate buffer solution (CBS, pH 5) was prepared by forming two stock solutions, which included 100 mL of citric acid (0.1 M) and sodium citrate (0.1 M), respectively.
3.3. Preparation of Enzyme Solution and Immobilization Technique
Before enzyme preparation, the carbon nanotube was treated with acid to induce the COOH groups on the sidewalls of the CNT and then to immobilize enzyme by covalent bonding. In the making of the enzyme solution, the most vital aspect was to verify the enzyme concentration by checking the concentration of the enzyme on the package because an enzyme with the same CAS number (i.e., GOx) may be extracted at different levels.
3.3.1. Oxidation of CNT with HNO3/H2SO4
The CNT was obtained from Conyuan Bio-Chemical Technology Co. of Taiwan (denoted as T2040, Taoyuan, Taiwan). It underwent an oxidation reaction to activate the acidic groups on the side walls. The mode of oxidation was impregnation with sulfuric acid and nitric acid in a ratio of 3:1, respectively. The solution underwent reflux at 90 °C for 24 h in a round flask, which was connected to a condenser. Later, the oxidized CNT was washed using deionized water until the pH was 7 in solution. The oxidized CNT was oven-dried at 104 °C under vacuum conditions for 24 h. Finally, the oxidized CNT was analyzed using FTIR and XRD to observe the acidic groups (COOH) on the sidewalls of the carbon nanotube.
3.3.2. Preparation of Bioanode and Biocathode Enzyme Solutions
The preparation of the bioanode or biocathode enzyme solution was performed according to the following steps. Firstly, GOx and Lac were immobilized on the surface of the CNT by direct covalent bonding. Secondly, 30 mM N-ethyl-N’-(3-dimethylaminopropyl) carbodiimide and 90 mM N-hydroxysuccinimide were mixed in PBS (pH 7.0, 50 mM). The solution was pipetted onto the nanocomposite surface of the CNT. After 1 h, the CNT on the carbon paper surface was dried using nitrogen gas. Then, a PBS solution (pH 7.0, 50 mM) containing 4 mg/mL of GOx (or Lac) was dropped on the surface and allowed to react for 4 h [39]; 16 mg of ABTS (or K3Fe(CN)63−) was also dissolved in PBS (pH 7.0, 50 mM), and 30 mL of each mediator was dropped on the respective electrode and then dried for 1 h. ABTS and K3Fe(CN)63−, as the mediators (M), were used with Lac and GOx, respectively.
3.3.3. Cyclic Voltammetry
The CV apparatus used was a CH 600 electrochemical analyzer (Bio-analytical systems, Virginia, NV, USA), coupled to an Acer computer (Hsinchu, Taiwan). A three electrode cell was used in the voltammetry experiment with modified carbon paper electrodes (1 cm × 1 cm) as working electrodes, a platinum wire as an auxiliary electrode, and a Ag/AgCl electrode (3M KCl) as a reference electrode (Bio-analytical systems, USA). The working electrode was modified with the different combinations of bioanode enzyme, biocathode enzyme, potassium ferrocyanide (mediator), and CNT for each set of experiments. The experiments were carried out at 37 °C.
Electrochemical analysis using CV was utilized to determine the diffusion coefficients of different combinations of mediators with the electrode enzyme. In order to produce good results, some steps were followed. For example, each scan of CV analysis from an initial potential to the final potential was considered as a segment. Therefore, two segments made one complete cyclic curve. EIS experiments were run using a CH600 electrochemical analyzer and were analyzed using the Zview software from Scribner Associate Inc (Version 2016, Scribner Associates, Budapest, Hungary).
3.3.4. Randles–Sevcik Equation
In CV, the Randles–Sevcik equation is used to describe the effect of the scan rate on the peak current ip. The significant parameters of cyclic voltammograms are the enormities of the anodic peak current (ipa) and cathodic peak current (ipc), the anodic peak potential (Epa), and the cathodic peak potential (Epc). The peak current for a reversible system is described by the Randles–Sevcik equation for the forward sweep of the first cycle:
Electrochemical irreversibility is caused by the slow electron exchange of the redox species with the working electrode. In this case, the equation will be:
where ip is the peak current (A), n is the electron transfer, A is the electrode area (cm2), D is the diffusion coefficient (cm2/s), C is the concentration (moles/cm3), v is the scan rate (V/s), and α is the transfer coefficient.
In a reversible redox reaction, increases in ip with the scan rate are related to the concentration of a solution. The concept of concentration is essential in the study of the electrochemistry of electrodes. For fast chemical redox reactions, ipa and ipc should be indistinguishable [40]. According to the Randles–Sevcik equation, the current peak ip is related to the square root of the scan rate v1/2. The electro-active substances are also directly related to the square root of the scan rate. The electro-active materials are essential in the determination of the concentration and diffusion coefficient D. A plot of the current peak (ip) with v1/2 gives a linear regression, which shows the presence of a redox reaction mechanism. Hence, the Randles–Sevcik equation validates the diffusional mechanisms, which are a free adsorption process. Thus, the chemical reaction should have fast kinetics, and the concentrations of species or substances and the area of an electrode should be provided. If the redox chemical reaction is reversible, then multiple evaluations could be applicable over a broad potential range. The ratio of the forward to backward reactions of the redox reaction is interpreted as current peaks ipa/ipc. The separation of the peak is denoted as , whose values are provided by the sweeping potentials of the electrode. Mostly reflecting a reversible chemical or electrochemical scheme, the value of ipa/ipc is known to be unity. However, the peak separation must be in concordance with Equation (5), while the potential difference between peaks and half-wave potentials must agree with Equation (6). The redox process is not reversible if these circumstances are not in accord with Equations (5) and (6). Hence, the electron-transfer mechanism is more complicated in some experiments [41]
4. Conclusions
This study has established the use of GOx/LAc modified electrodes as bioanodes and biocathodes for biofuel cells. The CNT-based electrodes gave high catalytic currents for the O2 reduction process in redox mediators with astonishing operative constancy. High sensitivity and stability, together with straightforward preparation, make GOx/LAc electrodes a promising candidate for constructing simple electrochemical biofuel cells or sensors for oxygen. The cyclic voltammograms show that hydrophilic carbon paper electrodes produce excellent electrode performance compared to a hydrophobic carbon paper electrode. The best hydrophilic electrode was Cp-GOx-M-CNT, with a current density of 800 µA/cm2, for the hydrophilic bioanode and Cp-LAc-M-CNT, with a current density of 600 µA/cm2, for the hydrophilic biocathode. Moreover, the best-performing hydrophobic electrode was Cp-GOx-M-CNT, with a current density of 500 µA/cm2, for the hydrophobic bioanode and Cp-LAc-M-CNT, with a current density of 300 µA/cm2, for the hydrophobic biocathode. The experimental approaches of CV and EIS, which were conducted in this study, deliver prospects for qualitative and quantitative representation, even under physiologically significant conditions. EIS analysis shows that the internal resistance of the solution sometimes affects the interaction of the enzymes and the mediators in terms of electron transfer.
Finally, the well-designed GOx/LAc-based electrodes are very suitable for their possible applications, while this construction of enzyme electrodes will provide ideas for the improvement of a novel group of biofuel cells and will be valuable for the expansion of bio-reactors, bio-sensors, and micro-reactors.
Author Contributions
Writing—original draft preparation, A.A.B.; writing—review and editing, H.S.W.; supervision, H.S.W. All authors have read and agreed to the published version of the manuscript.
Funding
We thank the Ministry of Science and Technology of Taiwan for financially supporting this study under grant number MOST 107-2218-E-155-001.
Conflicts of Interest
The authors do not have any conflicts of interest to declare.
Abbreviations
| ABTS | 2,2-azino-bis (3-ethylbenzothiazoline-6-sulphonic acid) |
| C1 | internal capacitance |
| C2 | internal capacitance |
| CNB | carbon nanoball |
| CNT | carbon nanotube |
| CV | cyclic voltammetry |
| Cp | carbon paper |
| EBFC | enzymatic biofuel cell |
| FTIR | Fourier transform infrared spectroscopy |
| GOx | glucose oxidase |
| LAc | laccase |
| M | mediator |
| PBS | phosphate buffer solution |
| PPY | polypyrrole |
| R1 | internal resistance |
| R2 | internal resistance |
| RA | charge-transfer resistance for the bioanode |
| Rother | charge-transfer resistance of metal-salts |
| Rs | resistance of the solution |
| XRD | X-ray diffractometer |
| W | Warburg impedance |
References
- Mahlambi, M.M.; Ngila, C.J.; Mamba, B.B. Recent developments in environmental photocatalytic degradation of organic pollutants: The case of titanium dioxide nanoparticles;a review. J. Nanomater. 2015, 2015, 790173. [Google Scholar] [CrossRef] [Green Version]
- Calabrese Barton, S.; Gallaway, J.; Atanassov, P. Enzymatic Biofuel Cells for Implantable and Microscale Devices. Chem. Rev. 2004, 104, 4867–4886. [Google Scholar] [CrossRef] [PubMed]
- Liu, C.; Alwarappan, S.; Chen, Z.; Kong, X.; Li, C.-Z. Membraneless enzymatic biofuel cells based on graphene nanosheets. Biosens. Bioelectron. 2010, 25, 1829–1833. [Google Scholar] [CrossRef] [PubMed]
- Munauwarah, R.; Bojang, A.A.; Wu, H.S. Characterization of enzyme immobilized carbon electrode using covalent-entrapment with polypyrrole. J. Chin. Inst. Eng. 2018, 41, 710–719. [Google Scholar] [CrossRef]
- Dai, D.J.; Chan, D.S.; Wu, H.S. Modified carbon nanoball on electrode surface using plasma in enzyme-based biofuel cells. Energy Procedia 2012, 14, 1804–1810. [Google Scholar] [CrossRef] [Green Version]
- Tozar, A.; Karahan, İ.H. Structural and corrosion protection properties of electrochemically deposited nano-sized Zn–Ni alloy coatings. Appl. Surf. Sci. 2014, 318, 15–23. [Google Scholar] [CrossRef]
- Wagner, N.; Schnurnberger, W.; Müller, B.; Lang, M. Electrochemical impedance spectra of solid-oxide fuel cells and polymer membrane fuel cells. Electrochim. Acta 1998, 43, 3785–3793. [Google Scholar] [CrossRef]
- Xu, S.; Minteer, S.D. Enzymatic Biofuel Cell for Oxidation of Glucose to CO2. ACS Catal. 2012, 2, 91–94. [Google Scholar] [CrossRef]
- Zebda, A.; Gondran, C.; Le Goff, A.; Holzinger, M.; Cinquin, P.; Cosnier, S. Mediatorless high-power glucose biofuel cells based on compressed carbon nanotube-enzyme electrodes. Nat. Commun. 2011, 2, 370. [Google Scholar] [CrossRef] [Green Version]
- Kim, J.; Jia, H.; Wang, P. Challenges in biocatalysis for enzyme-based biofuel cells. Biotechnol. Adv. 2006, 24, 296–308. [Google Scholar] [CrossRef]
- Rasmussen, M.; Abdellaoui, S.; Minteer, S.D. Enzymatic biofuel cells: 30 years of critical advancements. Biosens. Bioelectron. 2016, 76, 91–102. [Google Scholar] [CrossRef] [PubMed] [Green Version]
- Kasa, T.; Solomon, T. Cyclic voltammetric and electrochemical simulation studies on the electro-oxidation of catechol in the presence of 4, 4-bipyridine. Am. J. Phys. Chem. 2016, 5, 45–55. [Google Scholar] [CrossRef]
- Klis, M.; Maicka, E.; Michota, A.; Bukowska, J.; Sek, S.; Rogalski, J.; Bilewicz, R. Electroreduction of laccase covalently bound to organothiol monolayers on gold electrodes. Electrochim. Acta 2007, 52, 5591–5598. [Google Scholar] [CrossRef]
- Kjeang, E.; Djilali, N.; Sinton, D. Microfluidic fuel cells: A review. J. Power Sources 2009, 186, 353–369. [Google Scholar] [CrossRef]
- Zanello, P. Inorganic Electrochemistry: Theory, Practice and Applications; Royal Society of Chemistry: London, UK, 2003. [Google Scholar]
- Skoog, D.A.; Holler, F.J.; Crouch, S.R. Instrumental Analysis; Brooks/Cole, Cengage Learning Belmont: Belmont, CA, USA, 2007; Volume 47. [Google Scholar]
- Barrière, F.; Kavanagh, P.; Leech, D. A laccase–glucose oxidase biofuel cell prototype operating in a physiological buffer. Electrochim. Acta 2006, 51, 5187–5192. [Google Scholar] [CrossRef]
- Lavagnini, I.; Antiochia, R.; Magno, F. An Extended Method for the Practical Evaluation of the Standard Rate Constant from Cyclic Voltammetric Data. Electroanalysis 2004, 16, 505–506. [Google Scholar] [CrossRef]
- Ajeel, M.A.; Taeib Aroua, M.K.; Ashri Wan Daud, W.M. Reactivity of carbon black diamond electrode during the electro-oxidation of Remazol Brilliant Blue R. RSC Adv. 2016, 6, 3690–3699. [Google Scholar] [CrossRef]
- Laurent, N.; Haddoub, R.; Flitsch, S.L. Enzyme catalysis on solid surfaces. Trends Biotechnol. 2008, 26, 328–337. [Google Scholar] [CrossRef]
- Abreu, C.M.; Izquierdo, M.; Keddam, M.; Nóvoa, X.R.; Takenouti, H. Electrochemical behaviour of zinc-rich epoxy paints in 3% NaCl solution. Electrochim. Acta 1996, 41, 2405–2415. [Google Scholar] [CrossRef]
- Gao, Y.; Kyratzis, I. Covalent Immobilization of Proteins on Carbon Nanotubes Using the Cross-Linker 1-Ethyl-3-(3-dimethylaminopropyl)carbodiimide—A Critical Assessment. Bioconjugate Chem. 2008, 19, 1945–1950. [Google Scholar] [CrossRef] [Green Version]
- Wang, S.G.; Zhang, Q.; Wang, R.; Yoon, S.F.; Ahn, J.; Yang, D.J.; Tian, J.Z.; Li, J.Q.; Zhou, Q. Multi-walled carbon nanotubes for the immobilization of enzyme in glucose biosensors. Electrochem. Commun. 2003, 5, 800–803. [Google Scholar] [CrossRef]
- Mubarak, N.M.; Wong, J.R.; Tan, K.W.; Sahu, J.N.; Abdullah, E.C.; Jayakumar, N.S.; Ganesan, P. Immobilization of cellulase enzyme on functionalized multiwall carbon nanotubes. J. Mol. Catal. B Enzym. 2014, 107, 124–131. [Google Scholar] [CrossRef]
- Kashyap, D.; Dwivedi, P.K.; Pandey, J.K.; Kim, Y.H.; Kim, G.M.; Sharma, A.; Goel, S. Application of electrochemical impedance spectroscopy in bio-fuel cell characterization: A review. Int. J. Hydrog. Energy 2014, 39, 20159–20170. [Google Scholar] [CrossRef]
- Ramasamy, R.P.; Ren, Z.; Mench, M.M.; Regan, J.M. Impact of initial biofilm growth on the anode impedance of microbial fuel cells. Biotechnol. Bioeng. 2008, 101, 101–108. [Google Scholar] [CrossRef] [PubMed]
- Lee, J.A.; Hwang, S.; Kwak, J.; Park, S.I.; Lee, S.S.; Lee, K.-C. An electrochemical impedance biosensor with aptamer-modified pyrolyzed carbon electrode for label-free protein detection. Sens. Actuators B Chem. 2008, 129, 372–379. [Google Scholar] [CrossRef]
- Sharma, V.; Tanwar, V.K.; Mishra, S.K.; Biradar, A.M. Electrochemical impedance immunosensor for the detection of cardiac biomarker Myogobin (Mb) in aqueous solution. Thin Solid Film. 2010, 519, 1167–1170. [Google Scholar] [CrossRef]
- Uygun, Z.O.; Sezgintürk, M.K. A novel, ultra sensible biosensor built by layer-by-layer covalent attachment of a receptor for diagnosis of tumor growth. Anal. Chim. Acta 2011, 706, 343–348. [Google Scholar] [CrossRef]
- Kondaveeti, S.; Lee, S.-H.; Park, H.-D.; Min, B. Bacterial communities in a bioelectrochemical denitrification system: The effects of supplemental electron acceptors. Water Res. 2014, 51, 25–36. [Google Scholar] [CrossRef]
- Ramaraja, P.; Ramasamy, N.S. Electrochemical Impedance Spectroscopy for Microbial Fuel Cell Characterization. J. Microb. Biochem. Technol. 2013. [Google Scholar] [CrossRef] [Green Version]
- Reuillard, B.; Le Goff, A.; Agnes, C.; Holzinger, M.; Zebda, A.; Gondran, C.; Elouarzaki, K.; Cosnier, S. High power enzymatic biofuel cell based on naphthoquinone-mediated oxidation of glucose by glucose oxidase in a carbon nanotube 3D matrix. Phys. Chem. Chem. Phys. 2013, 15, 4892–4896. [Google Scholar] [CrossRef]
- Kang, Z.; Jiao, K.; Yu, C.; Dong, J.; Peng, R.; Hu, Z.; Jiao, S. Direct electrochemistry and bioelectrocatalysis of glucose oxidase in CS/CNC film and its application in glucose biosensing and biofuel cells. RSC Adv. 2017, 7, 4572–4579. [Google Scholar] [CrossRef] [Green Version]
- Yunpu, W.; Leilei, D.A.I.; Liangliang, F.A.N.; Shaoqi, S.; Yuhuan, L.I.U.; Roger, R. Review of microwave-assisted lignin conversion for renewable fuels and chemicals. J. Anal. Appl. Pyrolysis 2016, 119, 104–113. [Google Scholar] [CrossRef]
- Hamelers, H.V.M.; Ter Heijne, A.; Sleutels, T.H.J.A.; Jeremiasse, A.W.; Strik, D.P.B.T.B.; Buisman, C.J.N. New applications and performance of bioelectrochemical systems. Appl. Microbiol. Biotechnol. 2010, 85, 1673–1685. [Google Scholar] [CrossRef] [PubMed]
- Freguia, S.; Tsujimura, S.; Kano, K. Electron transfer pathways in microbial oxygen biocathodes. Electrochim. Acta 2010, 55, 813–818. [Google Scholar] [CrossRef]
- Ter Heijne, A.; Strik, D.P.B.T.B.; Hamelers, H.V.M.; Buisman, C.J.N. Cathode Potential and Mass Transfer Determine Performance of Oxygen Reducing Biocathodes in Microbial Fuel Cells. Environ. Sci. Technol. 2010, 44, 7151–7156. [Google Scholar] [CrossRef] [PubMed]
- Martin, E.; Tartakovsky, B.; Savadogo, O. Cathode materials evaluation in microbial fuel cells: A comparison of carbon, Mn2O3, Fe2O3 and platinum materials. Electrochim. Acta 2011, 58, 58–66. [Google Scholar] [CrossRef] [Green Version]
- Amatore, C.; Da Mota, N.; Lemmer, C.; Pebay, C.; Sella, C.; Thouin, L. Theory and Experiments of Transport at Channel Microband Electrodes under Laminar Flows. 2. Electrochemical Regimes at Double Microband Assemblies under Steady State. Anal. Chem. 2008, 80, 9483–9490. [Google Scholar] [CrossRef] [Green Version]
- Dutta, S.; Wu, K.C.W. Enzymatic breakdown of biomass: Enzyme active sites, immobilization, and biofuel production. Green Chem. 2014, 16, 4615–4626. [Google Scholar] [CrossRef]
- Hauch, A.; Georg, A. Diffusion in the electrolyte and charge-transfer reaction at the platinum electrode in dye-sensitized solar cells. Electrochim. Acta 2001, 46, 3457–3466. [Google Scholar] [CrossRef]
Figure 1.
(a1–a4) Cyclic voltammogram for the blank electrode and bioanode electrode with different combinations at different scan rates, 10–50 mV/s, (b1–b4) ipa in proportion to the square root of the scan rates, and (c1–c4) ratio of ipa:ipc to the square root of the scan rates.
Figure 1.
(a1–a4) Cyclic voltammogram for the blank electrode and bioanode electrode with different combinations at different scan rates, 10–50 mV/s, (b1–b4) ipa in proportion to the square root of the scan rates, and (c1–c4) ratio of ipa:ipc to the square root of the scan rates.

Figure 2.
(a1–a4) Cyclic voltammogram for the blank electrode and biocathode electrode with different combinations at different scan rates 10–50 mV/s, (b1–b4) ipa in proportionality to the square root of the scan rates, and (c1–c4) ratio of ipa:ipc to the square root of the scan rates.
Figure 2.
(a1–a4) Cyclic voltammogram for the blank electrode and biocathode electrode with different combinations at different scan rates 10–50 mV/s, (b1–b4) ipa in proportionality to the square root of the scan rates, and (c1–c4) ratio of ipa:ipc to the square root of the scan rates.

Figure 3.
Plot of ψ vs. υ1/2 for (a1) carbon paper, (b1–d1) bioanode electrode, and (b2–d2) biocathode electrode at a scan rate of 10–50 mυ/s.
Figure 3.
Plot of ψ vs. υ1/2 for (a1) carbon paper, (b1–d1) bioanode electrode, and (b2–d2) biocathode electrode at a scan rate of 10–50 mυ/s.

Figure 4.
Voltammograms of hydrophobic bioanode electrodes under 0.1 M PBS, pH 7, 37 °C, and N2 saturation.
Figure 4.
Voltammograms of hydrophobic bioanode electrodes under 0.1 M PBS, pH 7, 37 °C, and N2 saturation.

Figure 5.
Voltammograms of the hydrophobic biocathode electrodes under 0.1 M PBS, pH 7, 37 °C, and O2 saturation.
Figure 5.
Voltammograms of the hydrophobic biocathode electrodes under 0.1 M PBS, pH 7, 37 °C, and O2 saturation.

Figure 6.
Voltammograms of hydrophilic bioanode electrodes under 0.1 M PBS, pH 7, 37 °C, and N2 saturation.
Figure 6.
Voltammograms of hydrophilic bioanode electrodes under 0.1 M PBS, pH 7, 37 °C, and N2 saturation.

Figure 7.
Voltammograms of the hydrophilic biocathode electrode under 0.1 M PBS, pH 7, 37 °C, and O2 saturation.
Figure 7.
Voltammograms of the hydrophilic biocathode electrode under 0.1 M PBS, pH 7, 37 °C, and O2 saturation.

Figure 8.
(a) Representation of Randle circuit and Nyquist plot for (b) GOx-M-CNB and GOx-M-CNT, and (c) GOx-M-PPY and GOx-M bioanode impedance of enzymatic biofuel cell (EBFC).
Figure 8.
(a) Representation of Randle circuit and Nyquist plot for (b) GOx-M-CNB and GOx-M-CNT, and (c) GOx-M-PPY and GOx-M bioanode impedance of enzymatic biofuel cell (EBFC).


Figure 9.
Bode phase angle plot of (a) GOx enzyme with different combinations of mediators, (b) the bioanode for potassium ferrocyanide and nitrogen.
Figure 9.
Bode phase angle plot of (a) GOx enzyme with different combinations of mediators, (b) the bioanode for potassium ferrocyanide and nitrogen.

Figure 10.
Bode plot of (a) bioanode impedance and (b) biocathode impedance for EBFC with and without Nafion solution.
Figure 10.
Bode plot of (a) bioanode impedance and (b) biocathode impedance for EBFC with and without Nafion solution.

Figure 11.
Bode plot of (a) biocathode with 2,2-azino-bis (3-ethylbenzothiazoline-6-sulphonic acid (ABTS) and oxygen-based EBFC; (b) Bode phase angle plot of LAc with different electrodes.
Figure 11.
Bode plot of (a) biocathode with 2,2-azino-bis (3-ethylbenzothiazoline-6-sulphonic acid (ABTS) and oxygen-based EBFC; (b) Bode phase angle plot of LAc with different electrodes.

Figure 12.
(a) Representation of Randle circuit and Nyquist plot for (b) LAc-M-CNB and LAc-M-CNT and (c) LAc-M-PPY and LAc-M biocathode impedance for EBFC.
Figure 12.
(a) Representation of Randle circuit and Nyquist plot for (b) LAc-M-CNB and LAc-M-CNT and (c) LAc-M-PPY and LAc-M biocathode impedance for EBFC.


Table 1.
Calculation of bioanode and biocathode voltammograms.
| Electrode | Epa (V) | Epc (V) | ipa (A) | ipc (A) | Slope cm/v s−1 | D (cm2/s) |
|---|---|---|---|---|---|---|
| Blank | 0.005 | −0.147 | 7.17 × 10⁻⁶ | −3.141 × 10⁻⁶ | 0.1891 | 7.02 × 10⁻⁶ |
| GOx-M-CNT | 0.082 | −0.256 | 5.798 × 10⁻⁴ | −3.174 x10⁻⁴ | 0.2479 | 9.2 × 10⁻⁶ |
| GOx-M-PPY | 0.073 | 0.255 | 5.740 × 10⁻⁴ | −3.145 × 10⁻⁴ | 0.2464 | 9.3 × 10⁻⁶ |
| GOx-M | 0.064 | −0.194 | 5.644 × 10⁻⁴ | −3.579 × 10⁻⁴ | 0.2342 | 8.8 × 10⁻⁶ |
| LAc-M-CNT | 0.044 | −0.233 | 2.171 × 10⁻⁴ | −1.519 x10⁻⁴ | 0.2395 | 9.0 × 10⁻⁶ |
| LAc-M-PPY | 0.049 | 0.234 | 2.434 × 10⁻⁴ | −1.793 × 10⁻⁴ | 0.2384 | 8.9 × 10⁻⁶ |
| LAc-M | 0.054 | −0.203 | 2.563 × 10⁻⁴ | −1.889 × 10⁻⁴ | 0.2314 | 8.7 × 10⁻⁶ |
Table 2.
Impedance data for the bioanode.
| Electrode | Rs (Ω) | R1 (Ω) | R2 (Ω) | C1 (Ω) | C2 (Ω) |
|---|---|---|---|---|---|
| GOx-M-CNT | 1.7 | 0.002 | 1.05 × 10⁻⁹ | 1.84 × 10⁻⁷ | 2.94 × 10⁻⁶ |
| GOx-M-CNB | 1.7 | 0.001 | 1.05 × 10⁻⁶ | 1.99 × 10⁻⁶ | 2.88 × 10⁻⁵ |
| GOx-M-PPY | 1.9 | 0.010 | 1.06 × 10⁻⁷ | 2.85 × 10⁻³ | 2.76 × 10⁻⁴ |
| GOx-M | 1.10 | 0.10 | 1.00 × 10⁻⁴ | 2.77 × 10⁻⁴ | 2.66 × 10⁻⁴ |
Table 3.
Impedance data for the biocathode.
| Electrode | Rs (Ω) | R1 (Ω) | R2 (Ω) | C1 (Ω) | C2 (Ω) | W (Ω) |
|---|---|---|---|---|---|---|
| LAc-M-CNT | 1.7 | 2.3 × 10⁻⁷ | 1.45 × 10⁻⁶ | 1.0 × 10⁻⁷ | 2.22 × 10⁻⁶ | 0.5 |
| LAc-M-CNB | 1.7 | 2.4 × 10⁻⁸ | 1.55 × 10⁻⁵ | 1.20 × 10⁻⁵ | 2.45 × 10⁻⁴ | 0.03 |
| LAc-M-PPY | 1.20 | 2.54 × 10⁻⁶ | 1.63 × 10⁻⁴ | 1.36 × 10⁻⁶ | 2.66 × 10⁻³ | 0.034 |
| LAc-M | 1.22 | 2.60 × 10⁻⁹ | 1.74 × 10⁻³ | 1.40 × 10⁻⁶ | 2.88 × 10⁻² | 0.004 |
© 2020 by the authors. Licensee MDPI, Basel, Switzerland. This article is an open access article distributed under the terms and conditions of the Creative Commons Attribution (CC BY) license (http://creativecommons.org/licenses/by/4.0/).
Share and Cite
MDPI and ACS Style
Bojang, A.A.; Wu, H.S. Characterization of Electrode Performance in Enzymatic Biofuel Cells Using Cyclic Voltammetry and Electrochemical Impedance Spectroscopy. Catalysts 2020, 10, 782. https://0-doi-org.brum.beds.ac.uk/10.3390/catal10070782
AMA Style
Bojang AA, Wu HS. Characterization of Electrode Performance in Enzymatic Biofuel Cells Using Cyclic Voltammetry and Electrochemical Impedance Spectroscopy. Catalysts. 2020; 10(7):782. https://0-doi-org.brum.beds.ac.uk/10.3390/catal10070782
Chicago/Turabian StyleBojang, Adama A., and Ho Shing Wu. 2020. "Characterization of Electrode Performance in Enzymatic Biofuel Cells Using Cyclic Voltammetry and Electrochemical Impedance Spectroscopy" Catalysts 10, no. 7: 782. https://0-doi-org.brum.beds.ac.uk/10.3390/catal10070782
Note that from the first issue of 2016, this journal uses article numbers instead of page numbers. See further details here.