Article

Effect of Calcination Time on the Physicochemical Properties and Photocatalytic Performance of Carbon and Nitrogen Co-Doped TiO2 Nanoparticles

1
Environmental Nano Science (ENS) research group, Department of Chemistry, UWC, Bellville 7535, South Africa
2
Research Center for Advanced Surface Processing and Analysis by Vacuum Technologies (ReCAST), National Institute for Research and development in Optoelectronics INOE 2000, Magurele, 077125 Bucharest, Romania
3
Electron Microscope Unit, Department of Physics and Astronomy, University of the Western Cape, Bellville 7535, South Africa
4
Department of Physics, College of Science, Sultan Qaboos University, P.O. Box 36, 123 Al-Khoud, Muscat 123, Oman
5
Nanotechnology Research Center, Sultan Qaboos University, P.O. Box 33, Al-Khoud, Muscat 123, Oman
6
Physical Materials Science and Composite Materials Centre, National Research Tomsk Polytechnic University, Lenin Avenue 43, 634050 Tomsk, Russia
7
Department of Chemistry and Biochemistry, University of Hull, Hull HU6 7RX, UK
8
CHOSE, Electronic Engineering Department University of Rome Tor Vergata, Via del Politecnico 1, 00133 Rome, Italy
9
LASE, National University of Science and Technology “MISiS”, Leninsky Ave. 6, Moscow 119049, Russia
10
Petroleum and Chemical Engineering Department, Sultan Qaboos University, P.O. Box 33, Al-Khoud, Muscat 123, Oman
11
Department of Marine Science and Fisheries, Sultan Qaboos University, P.O. Box 34, Al-Khoud, Muscat 123, Oman
12
Center of Excellence in Marine Biotechnology, Sultan Qaboos University, P.O. Box 50, Al-Khoud, Muscat 123, Oman
*
Authors to whom correspondence should be addressed.
Submission received: 19 May 2020 / Revised: 4 July 2020 / Accepted: 10 July 2020 / Published: 28 July 2020
(This article belongs to the Section Nanostructured Catalysts)

Abstract

:
The application of highly active nano catalysts in advanced oxidation processes (AOPs) improves the production of non-selective hydroxyl radicals and co-oxidants for complete remediation of polluted water. This study focused on the synthesis and characterisation of a highly active visible light C–N-co-doped TiO2 nano catalyst that we prepared via the sol-gel method and pyrolysed at 350 °C for 105 min in an inert atmosphere to prevent combustion of carbon moieties. Then we prolonged the pyrolysis holding time to 120 and 135 min and studied the effect of these changes on the crystal structure, particle size and morphology, electronic properties and photocatalytic performance. The physico-chemical characterisation proved that alteration of pyrolysis holding time allows control of the amount of carbon in the TiO2 catalyst causing variations in the band gap, particle size and morphology and induced changes in electronic properties. The C–N–TiO2 nano composites were active under both visible and UV light. Their improved activity was ascribed to a low electron–hole pair recombination rate that enhanced the generation of OH· and related oxidants for total deactivation of O.II dye. This study shows that subtle differences in catalyst preparation conditions affect its physico-chemical properties and catalytic efficiency under solar and UV light.

Graphical Abstract

1. Introduction

The accumulation of persistent organic pollutants (POPs) in water sources demonstrates the failure of conventional treatment methods for complete removal of these xenotoxins [1]. Direct oxidation of POPs in water could be an alternative remediation route to remove these pollutants. Advanced oxidation processes (AOPs), such as O3/UV, H2O2/UV, O3/UV/H2O2, UV/catalysts, etc., have been considered as effective oxidative methods in producing non-selective hydroxyl radical and persulfate oxidants for degrading such pollutants [2,3,4,5,6]. The efficiency of AOPs varies according to the amount of OH· generated.
Recently, the use of semiconductor photo catalysts in AOPs has been shown to be an active method to improve the yield of OH· in water treatment processes [7,8,9]. Titanium dioxide (TiO2) that is often found in anatase, brookite or rutile forms is a less costly, stable photo catalyst and has commonly been utilised in powder form for photo catalytic removal of organic pollutants from water and wastewater [10,11]. Its large band gap of 3.2 eV that is mostly active only under UV light has become a limitation for solar systems. The tuning of TiO2 absorption band from the UV range to visible region has been the subject of diverse research investigations [12,13,14].
From this point of view, the structural manipulation of semi-conductor composites has gained serious attention in photo catalysis. The valence band (VB) of TiO2 consists of 2p orbitals of oxygen while the 3d orbitals of titanium govern the conducting band (CB) [15]. Hence, the modification of the TiO2 band structure entails that the electron–hole pairs generated on both VB and CB absorb visible or UV light, while the band edge on top of the VB and below the CB should not be excessively altered which might compromise TiO2 photo activity [16].
The doping process using metal loading [17] or by incorporation of non-metals, such as C and N, has been used as a common principle to diminish the TiO2 band gap to the visible range and to reduce the electron–hole recombination [18,19,20]. Alternatively, the band gap tuning relates to using more visible light but reducing electron recombination could be more effective for UV light application. Yu and co-workers [21] established a practical method for instantaneous doping of carbon and nitrogen in TiO2 by annealing titanium carbonitride in air at temperatures between 400 and 700 °C and time ranging from 3 to 12 h. The results of their study showed that the synthesised C–N–TiO2 annealed at 400 °C for 8 h was highly photo catalytically active under visible light which further reduced the recombination rate of electron hole pairs. It could be noticed that their route for conversion of Ti2CN to powder C–N–TiO2 nano catalyst by an annealing process is time and energy consuming and suggests that more advanced methods leading to the synthesis of photo catalysts in a short period of time at milder conditions is of interest.
A similar study was carried out by Li et al. [22] who employed a one-step microwave (MW) irradiation technique for the incorporation of carbon and nitrogen atoms into TiO2 lattice and the prepared C–N–TiO2 catalyst was simultaneously deposited onto common brick ((C, N)-TiO2/brick). The outcomes showed that the porous surface of (C, N)-TiO2/brick considerably improved the surface area of the sample that resulted in a longer lifetime for photo-produced electron–hole pairs, and consequently enhanced the photocatalytic properties of the composites. However, the effect of calcination holding time in the air on the properties of the prepared (C, N)-TiO2/brick was not mentioned in their study, recalling that calcination combusts the carbon whereas pyrolysis causes controlled degradation.
The manufacturing of C–N–TiO2 nano composites was also conducted by a few authors using different methods [23,24]. Even though these studies sustained that the methods for engineering of C–N–TiO2 catalysts were cost effective, efficient and environmental benign, parameters such as calcination holding time on the physical and chemical properties were not fully investigated. On the contrary, introduction of substituents in the TiO2 framework often results in a decrease or an explained increase of its band gap [13,15].
Hence, the alteration of the TiO2 absorption energy band and reduction of electron–hole pairs’ recombination are still on-going research fields as a full comprehension of the interaction between dopants or impurities and the TiO2 lattice is still challenging and difficult to control systematically. Furthermore, the physico-chemical properties and the reactivity of photo catalysts such as TiO2 may depend on the synthesis method [10]. The sol-gel method has been found practical due to its operational ease and low cost [19,20].
Other authors claimed that the crystal structure, band gap, size distribution, surface area, porosity and surface hydroxyl density may impact upon the activity of TiO2 [11] but in most of these studies the impact of annealing holding time on the aforementioned properties have not been elucidated. Therefore, a critical investigation of the impact of calcination holding time on the physico-chemical properties of the sol-gel synthesised TiO2 based catalysts is still an open research field aiming at understanding the limitations of TiO2 efficacy.
Herein, we synthesised a C–N–TiO2 nano catalyst by a simple and rapid sol-gel method using polyacrilonitrile (PAN) and TiCl4 as precursors followed by pyrolysis in N2. The impact of annealing using pyrolysis holding time to control crystal structure, shape, size was examined. Furthermore, the influence of pyrolysis holding time on the activity of the nanostructured C–N–TiO2 was evaluated for the degradation of orange II sodium salt dye under UV light. Overall, the aim of this study was to engineer a stable and active C–N–TiO2 photo catalyst by sol-gel protocols for future incorporation in solar and UV based advanced oxidation processes (AOPs) to boost the total removal of persistent organic pollutants under UV light.

2. Results

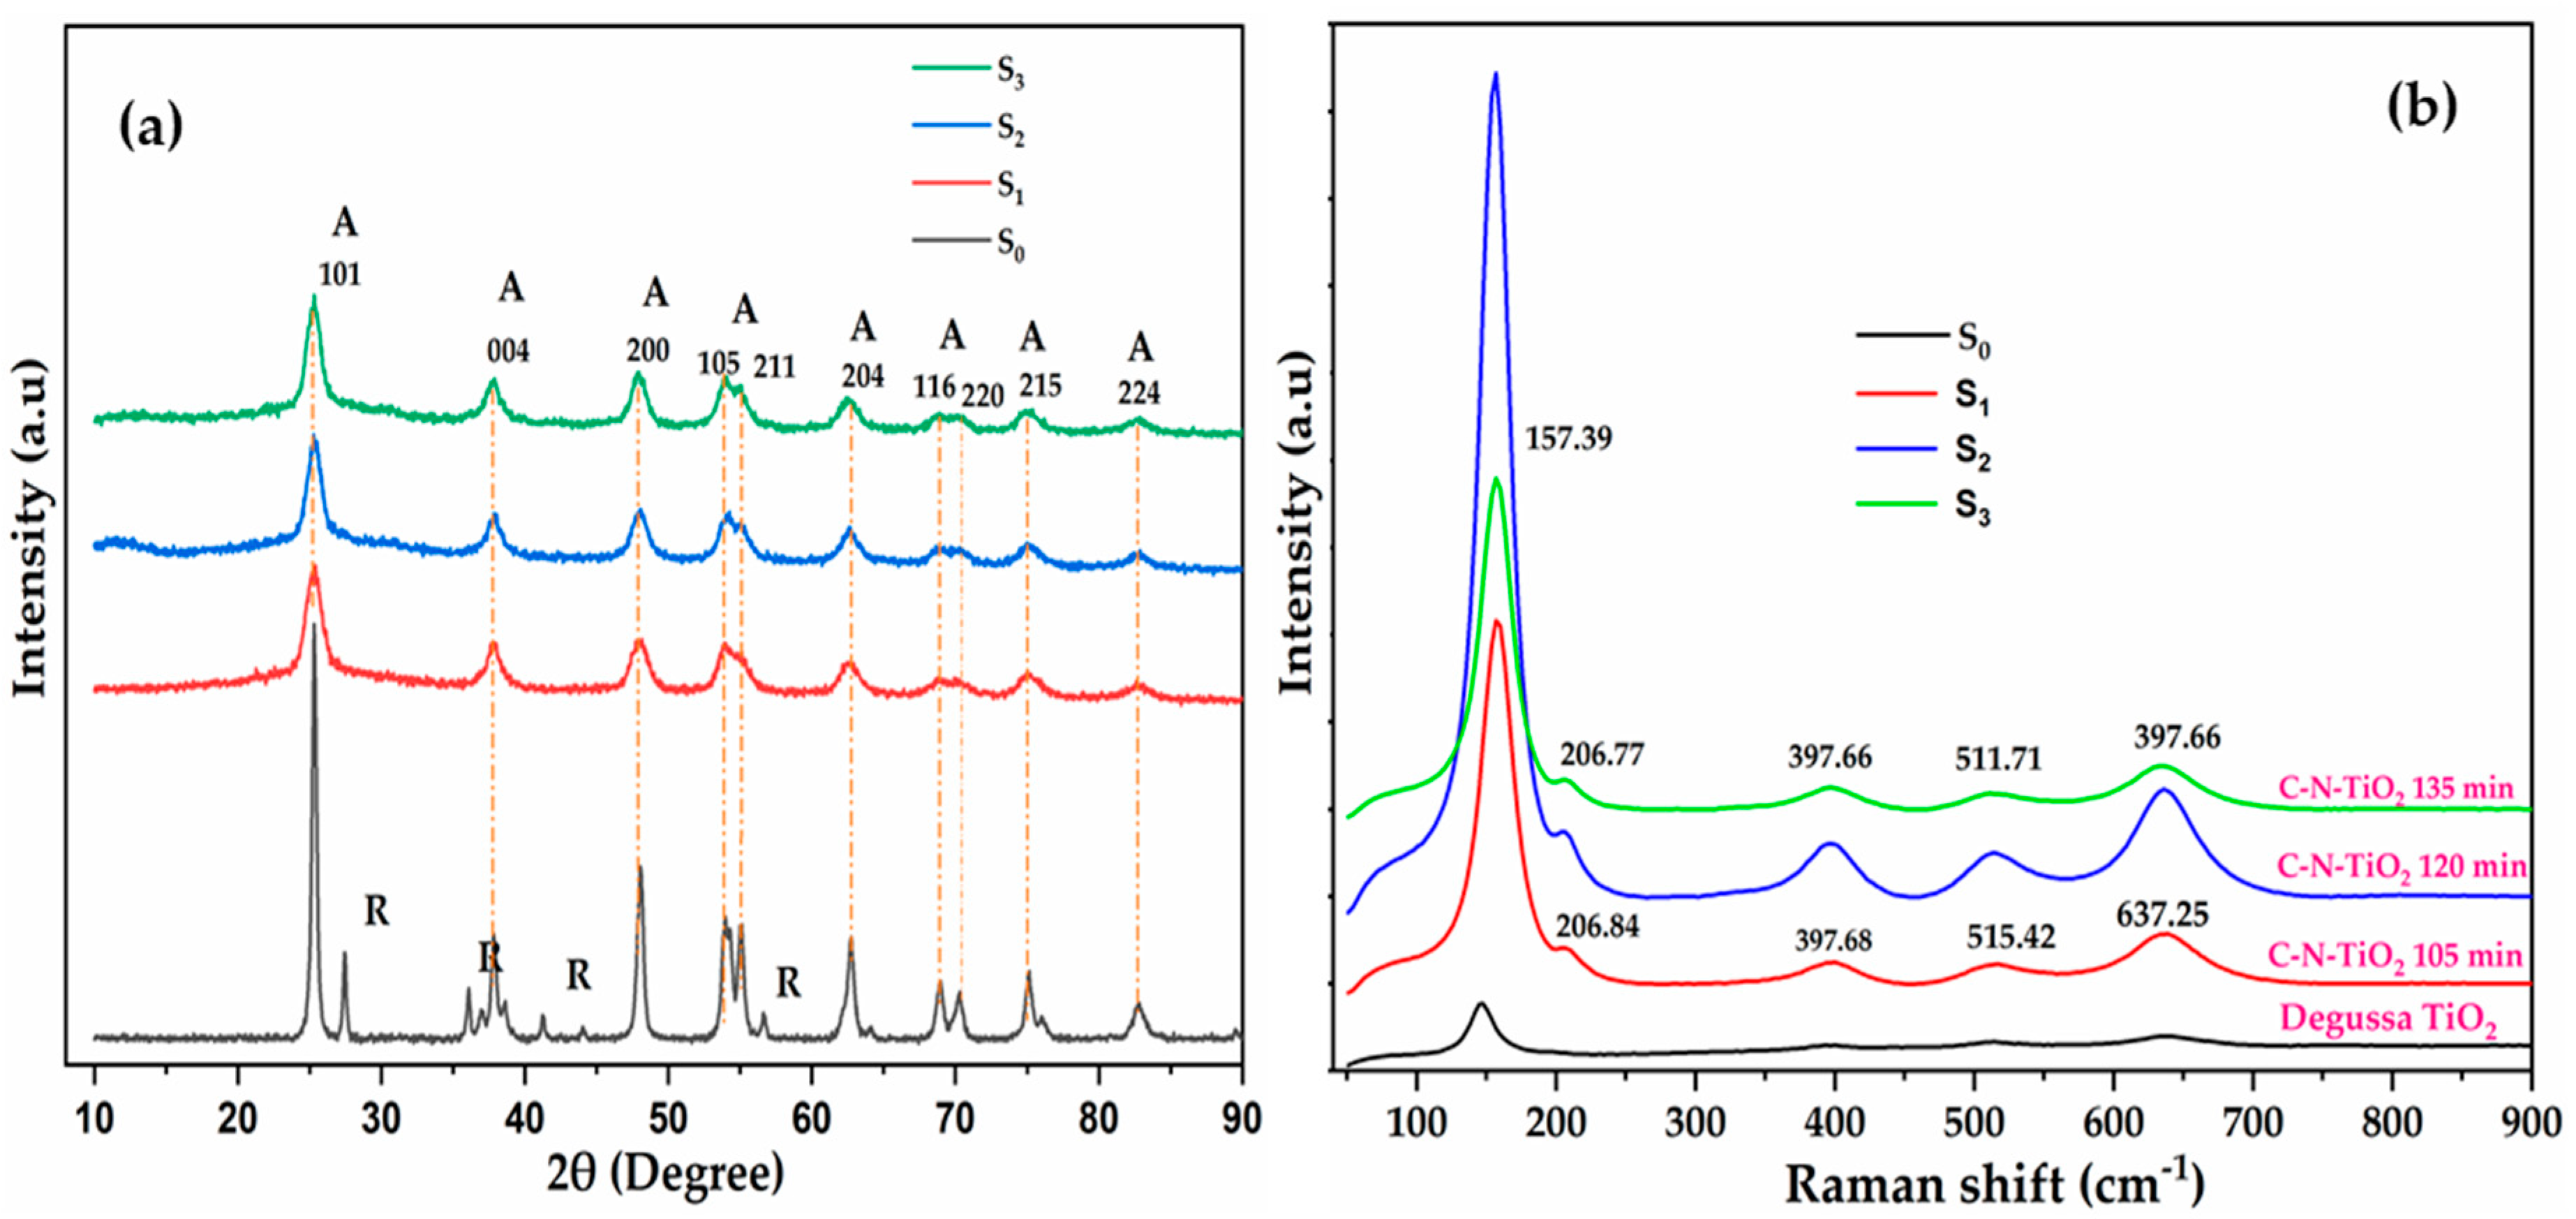
2.1. X-Ray Diffraction and Raman Spectroscopy Analysis of the Synthesized Catalysts

The XRD analysis and Raman spectroscopy were used to determine the phase composition, particle size and the crystallinity of TiO2 and C–N–TiO2 co-doped nano particles and the results of this analysis are presented in Figure 1a,b.
Figure 1a shows that pure Degussa TiO2 consisted of both anatase (JCPDS, No. 00-021-1272) and rutile phases (JCPDS, No. 00-021-1276) with the anatase phase being predominant as indicated by its peak intensities. The pure mineral anatase phase was characterised by the following diffraction peaks 2θ = 25.28° (101), 36.9° (103), 37.8° (004), 48° (200), 53.89° (105), 55.06° (211), 62.69° (204), 68.76° (116), 70.31° (220), 75.03° (215), and 82.66° (224) which correspond to the body-centred tetragonal lattice structure of the pure mineral anatase phase. Raman spectra in Figure 1b show the dominant TiO2 peak at 157.39 cm−1, while minor peaks depicted at 206.77, 397.68, 515.42 and 637.25 cm−1 supplement/confirm the anatase phase highlighted in Figure 1a.
The rutile phase was characterised by the presence of diffraction peaks at 2θ = 27.44°, 36.08°, 41.2°, and 55.8° and 71.29 as from (JCPDS) No. 00-021-1276 corresponding to the tetragonal lattice parameters of the rutile phase. The comparison with the powder X-ray diffraction (PXRD) patterns and the Raman peak of the Degussa catalyst shows that the catalysts synthesised here only contained the anatase phase, although it is difficult to be absolutely certain, due to the broadness of the diffraction peaks. However, it was reported that the formation of the anatase phase occurs, in general, at temperatures below 400 °C [25].
This meant that the synthesis procedure using the sol-gel protocol followed by pyrolysis resulted mostly in the anatase phase formation which was deemed advantageous for photo catalytic applications due to the small crystalline size, well-crystalline anatase phase and probably constricted band gap [12,26]. The size of TiO2 Degussa and C–N–TiO2 nano crystals were estimated using the Scherrer Equation (1) [27], and the results are presented in Table 1.
d = K × λ B ( 2 θ ) × cos θ
where d is the nano crystal size; K ≈ 0.94 is a dimensionless shape factor; λ ≈ 0.15406 nm is the CuKα diffraction wavelength, B (2θ) is the line broadening at half the maximum intensity (FWHM), expressed in radians (after subtracting the instrumental line broadening); and θ is the Bragg angle in degrees.
The data presented in Table 1 indicate that the size of the nano-photo catalysts estimated by the Scherrer equation is significantly smaller than the particle size of TiO2 Degussa (S0 sample). The result indicates that the production route for co-doped nano TiO2 using the sol-gel/pyrolysis procedure promoted the formation of small crystalline domains [12]. The Scherrer equation evaluated the particles size of the three samples (S1, S2 and S3), not to be too dissimilar (numbers). The XRD results show no peaks characteristic of graphite indicating that, if carbon residues are present, they are in and amorphous form.

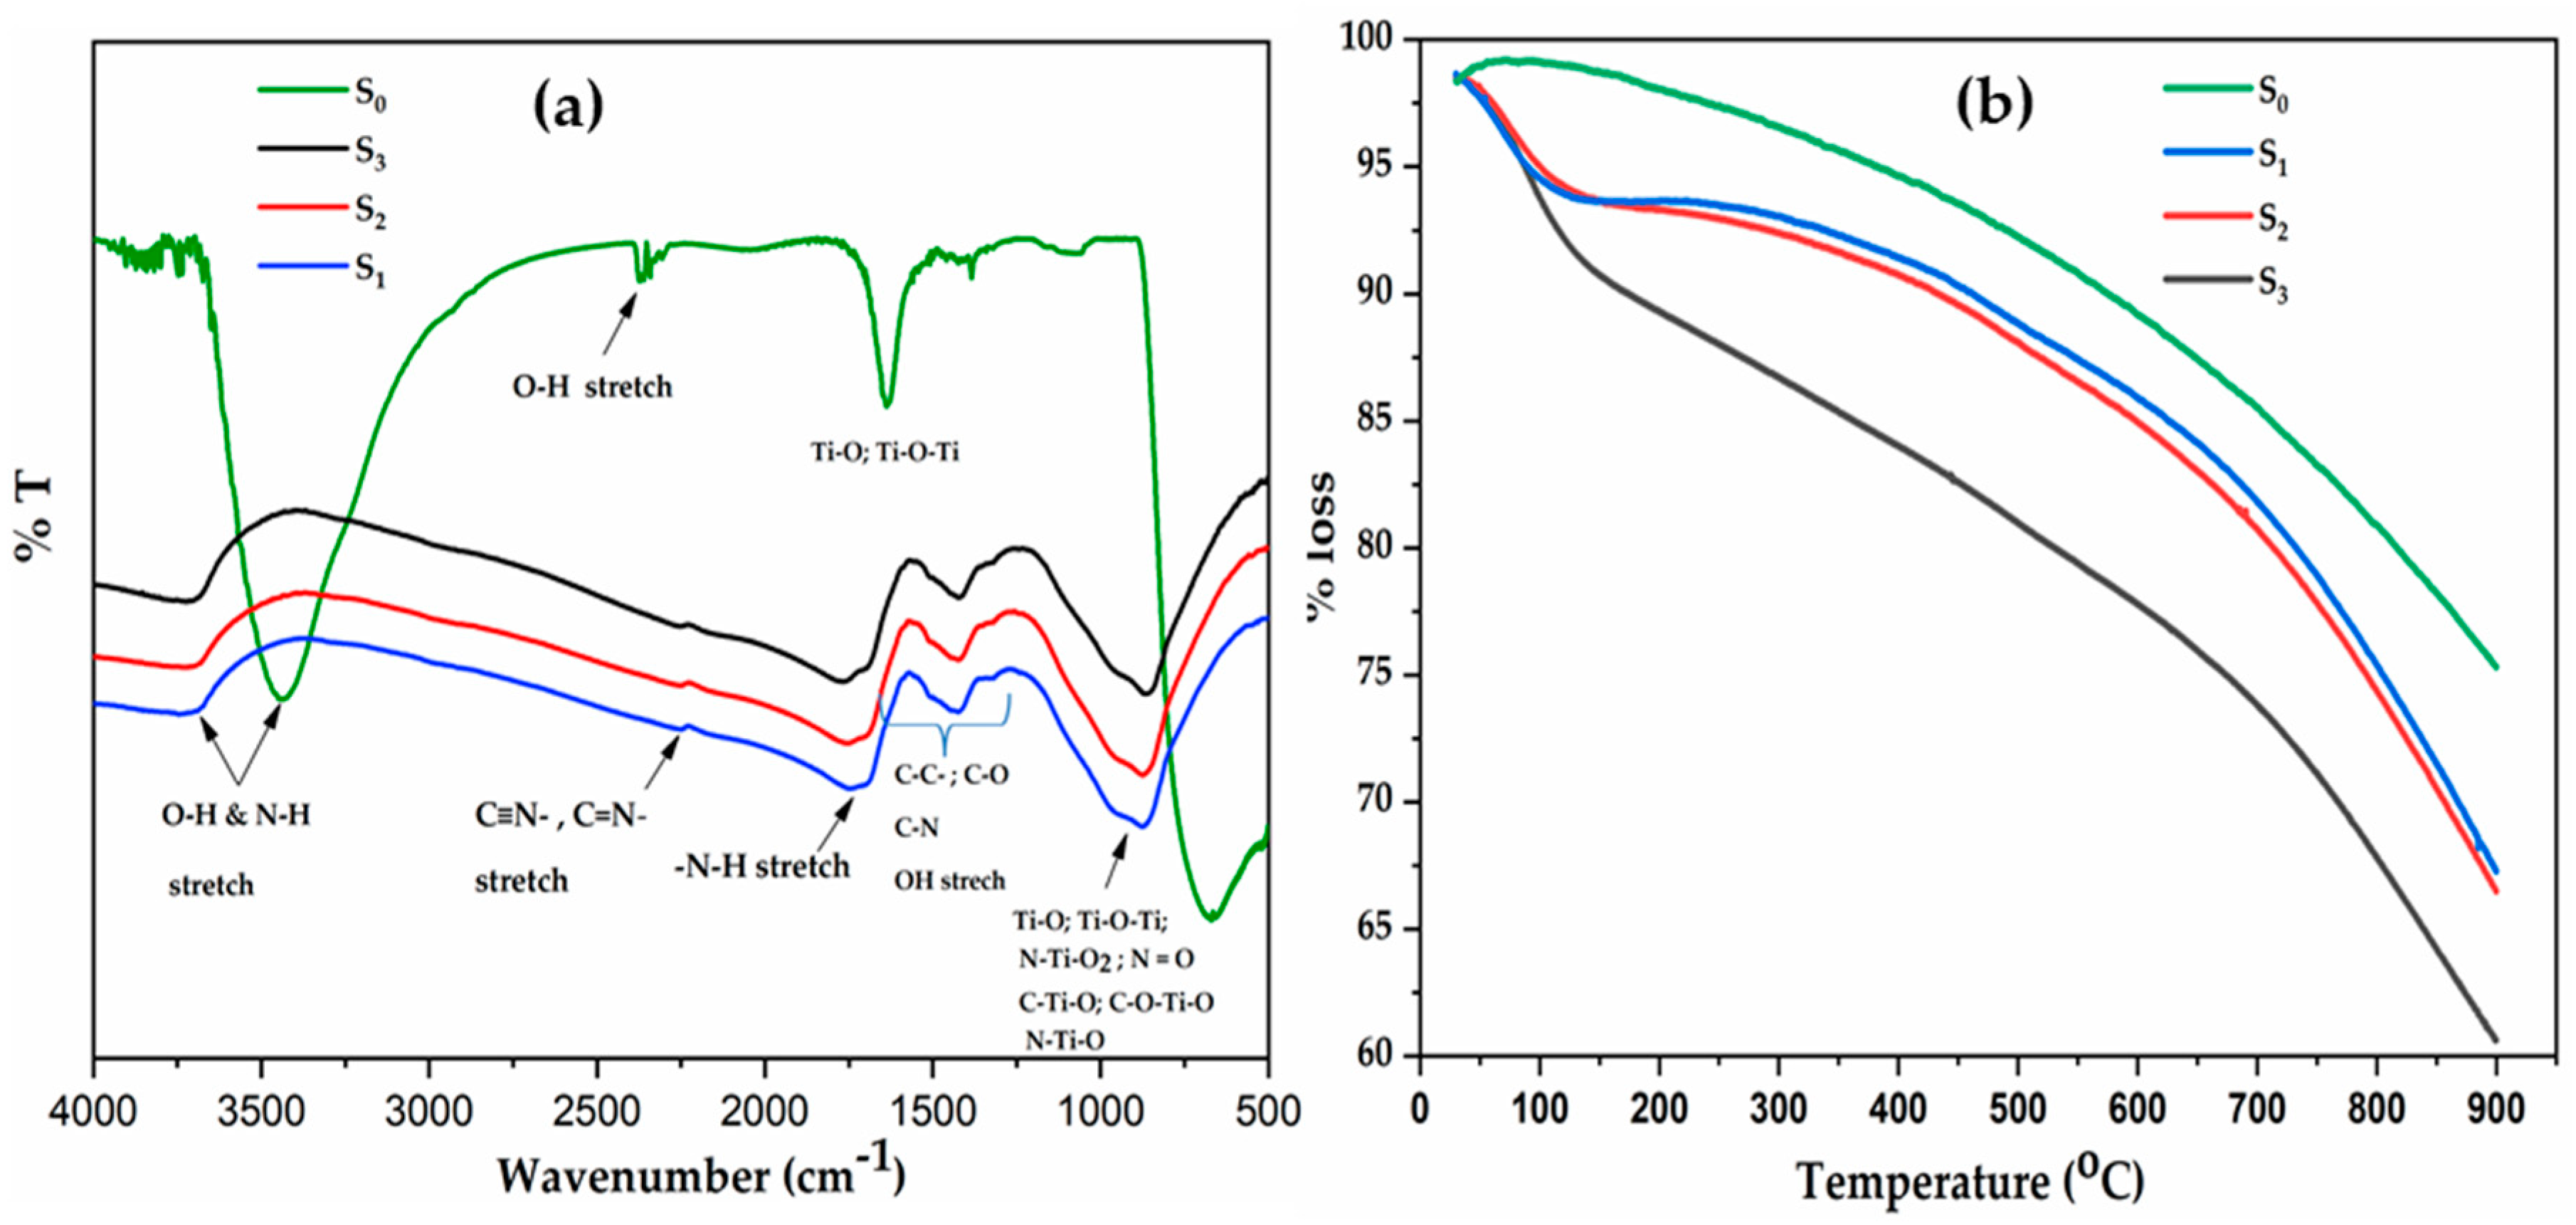
2.2. Fourier Transform Spectroscopy of the Catalysts

Fourier transforms spectroscopy (FTIR) analysis was further used to elucidate the functional groups present in the synthesised C–N–TiO2 catalyst pyrolised at 350 °C for different holding times and the spectra are shown in Figure 2a.
Three different absorption bands in all samples were present and are summarised and presented in Table 2. The OH/N–H stretching were identified in 3800–3600 cm−1 region for all catalysts [26,27] as shown in Table 2 as well as peaks relating to N–H; C–C, C–O, C–N and probably C=N, C=O, N=O, OH stretch, etc., that appeared in from 1000–1800 cm−1 and 1800–1200 cm−1 for all catalysts [26,28] which could be ascribed to the decomposition of Polyacrylonitrile (PAN) and NH4NO3 during pyrolysis at 350 °C [29,30].
Finally, Ti–O, C–Ti–O, O–Ti–O, N–TiO2, Ti–O–Ti and N=O stretching are evident in the 1200–500 cm−1 range in all samples demonstrates the bonding of Ti, O and N in C–N–TiO2 catalyst [31]. This is also evident from the intensity of FTIR spectra peaks in the same range (1200–700 cm−1) that shifted toward lower wavenumbers as pyrolysis time was increased. The aforementioned functional groups demonstrate the presence of C and N associated with the TiO2 semiconductor. The unsaturated functional groups, such as C=O and N=O, resulted from random combinations of unstable C and N impurities deposited upon nano-TiO2 during the pyrolysis process.
The pyrolysis process might have further induced the formation of various evaporated gases such as CO, NO, etc. Furthermore, in Table 2, C–Ti bonds were also present at the holding times of 120 and 135 min. However, due to the instability of C–Ti, N–Ti, etc., C and N might have evaporated during extended holding times of pyrolysis and caused the band gap to revert closer to that of Degussa TiO2 (see Figure 2).

2.3. Thermal Gravimetric Analysis of the Synthesised Catalysts

The TGA outcomes presented in Figure 2b show the mass loss of C–N–TiO2 nano catalysts over time during pyrolysis in N2. The results indicate that the loss of some volatile components in the synthesised catalysts occurred between 100 and 130 °C. These trends supplement the gas evaporation claimed in the FTIR discussion. With reference to TiO2 Degussa, about 8.7% of the mass of the C–N–TiO2 (105 min) was lost between 130 °C and 700 °C, compared to 10% and 14.65% mass loss recorded for C–N–TiO2 (120 min) and C–N–TiO2 (135 min), respectively. The increase of the pyrolysis time during the catalyst preparation resulted in an increased loss of volatile components forming part of the catalyst mass loss.
The high mass loss was ascribed mostly to loss of carbonaceous species from PAN degradation and shows that a large amount of C content in the product was related to the PAN precursor (Table 3). Thus, the catalyst mass loss experienced in this study was probably due to PAN decomposition that occurred between 130 and 700 °C. Indeed, the carbonisation of PAN in N2 gas, certainly led to the cyclisation reaction whereby the nitrile groups appearing at 2261 cm−1 were converted to C=N bonds that were evidenced by the FTIR along with C=C and C–N stretching between 1200 and 1800 cm−1 as supported by Sánchez-Soto et al. [32] and Darányi Mári et al. [33].
Therefore, the detected C–N, C=N and C=C bonds resulted from chain conjugation whereby C=C bonds were formed during the tautomerisation of the cyclised product [34]. Likewise, the C=O stretching from DMF solvent trapped in polymer certainly evaporated early on during pyrolysis of C–N–TiO2 at 350 °C, recalling that the boiling point of DMF is estimated to be around 153 °C according to Darányi et al. [33], as a clear weight loss was evident below 130 °C.

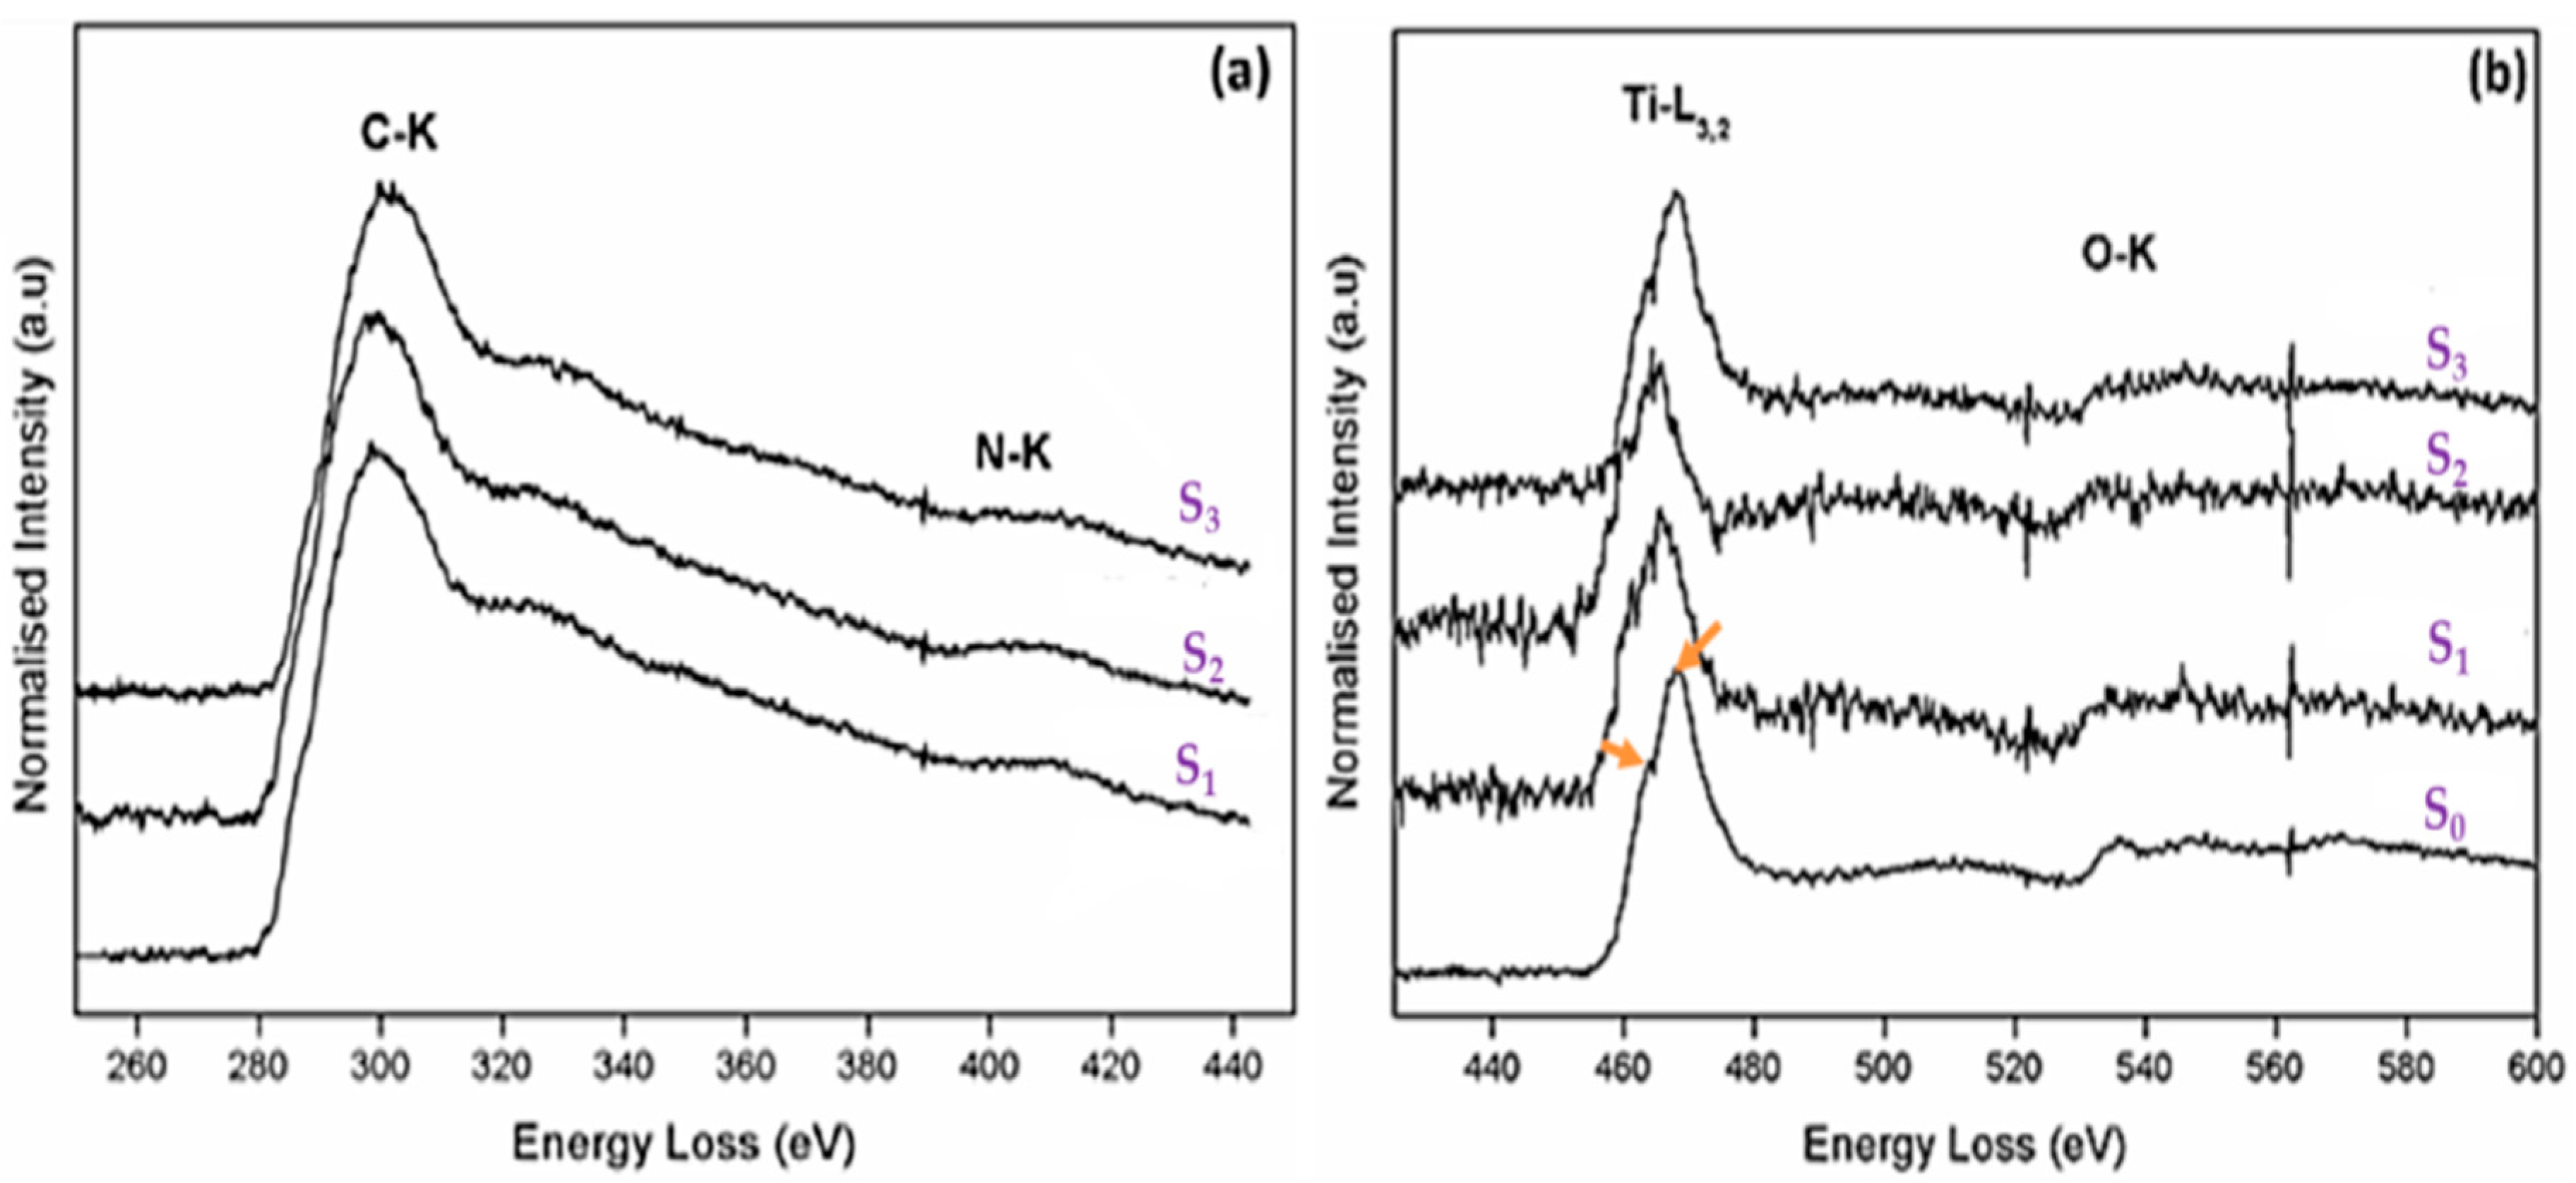
2.4. Electron Energy Loss Spectroscopy

The presence of bonding between C, N and Ti in the synthesised catalysts was investigated by electron energy-loss spectroscopy (EELS) plotted in Figure 3.
Figure 3a confirms the presence of both carbon (K edge onset detected at 284 eV) and nitrogen (K edge at 404 eV) present in all three doped specimens. Figure 3b shows the titanium L3,2 line profile of the doped specimens against that of the undoped Degussa TiO2. From the Degussa line profile, the common crystal field splitting from the predominantly rutile crystal structure is indicated by the arrows between 460 and 480 eV.
The hump on the lower eV side is the L3 peak, which originates from electron transitions from the inner 2p3/2 orbitals to empty 3d orbitals of the Ti metal. The L2 edge, on the higher eV side, originates from 2p1/2 → 3d electron transitions. In the case of Ti oxides, the near-edge structures found in the L3,2 edges mainly reflect the covalent bonding states resulting from direct and/or indirect interactions between O and Ti atoms. As such, a study of this edge structure, i.e., its change in crystal field splitting and or shifting of peak position, can give an idea of the introduction of foreign atoms into the TiO2 lattice, i.e., doping.
From Figure 3b, it can be seen that with an increase in synthesis time, there is a slight shift in the Ti L3,2 line shape position compared to that of the undoped Degussa TiO2. This was further confirmed by the splitting of the L3,2 peak located between 460 and 480 eV with TiO2 Degussa into individual L3 and L2 humps at 462 eV in Figure 3b that were indiscernible in the case of the S1 or S2 samples, but well present at 470 eV in the S3 sample.

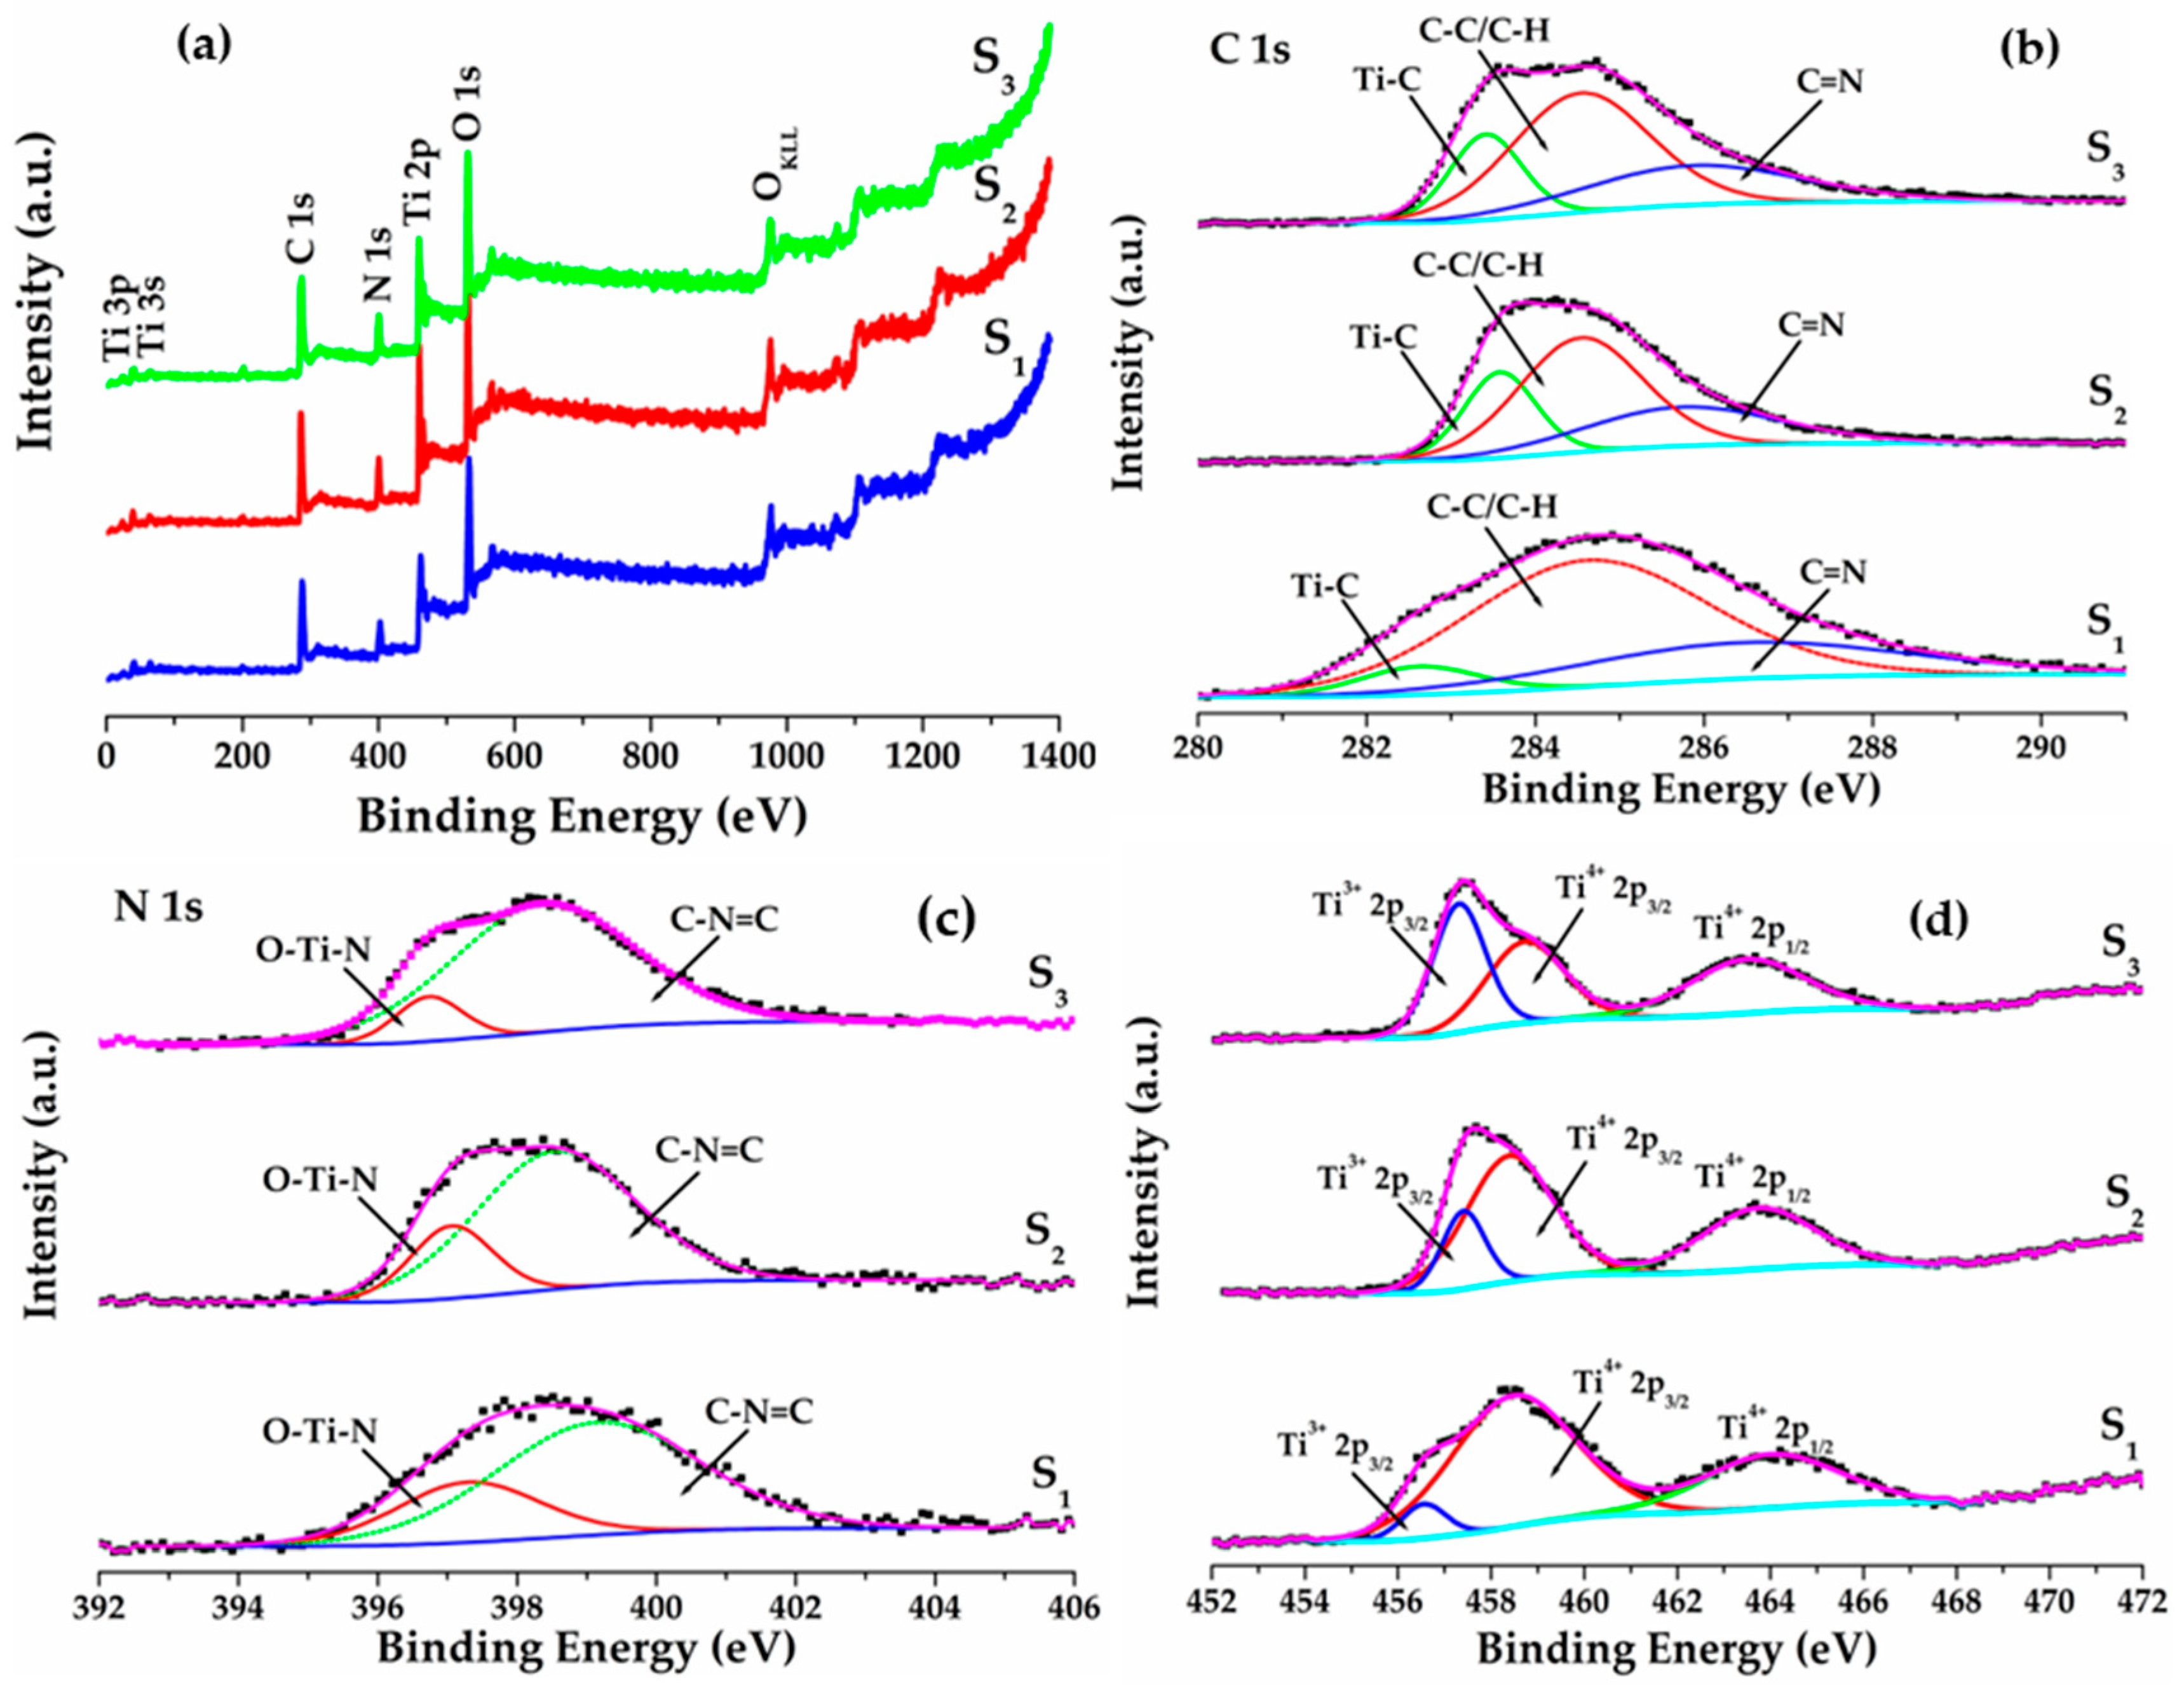
2.5. XPS Analysis of C–N–TiO2 Catalysts

Besides EELS, XPS analysis was carried out to verify the surface composition and chemical states of C–N–TiO2 nano materials calcined at 350 °C for 105 min (S1), 120 min (S2) or 135 min (S3). The XPS survey spectra in Figure 4a shows that Ti 3p, Ti 3s, C 1s, N 1s, Ti 2p, O 1s and O KLL were obtained from each of the calcined C–N–TiO2 catalysts. High-resolution XPS spectra in Figure 4b shows C 1s peaks for three catalysts were 282.6 eV for S1, 283.2 eV for S2 and 283 eV for S3 and corresponded to Ti–C in C–N–TiO2 catalysts. The carbon atom was substituted for the oxygen atom in the lattice of TiO2 to form Ti–C [35,36] in which the surface amount of Ti–C was increased substantially by increasing pyrolysis time from; 9.7% for S1 to 42.0% for S2 and 48.3% for S3, respectively. This may be due to the diffusion of carbon from the bulk to the surface when increasing the pyrolysis holding time. The binding energy at 284.6 eV attributed to C–C/C–H mainly derived from the decomposition of PAN shown in Figure 3b and NH4NO3 as well as from so-called adventitious carbon [37]. The peaks at 286.4 eV for S1, 286.3 eV for S2 and 286.5 eV for S3 could be assigned to the C=N functional groups obtained from the decomposition of PAN and NH4NO3 [38]. The deconvolution of N 1s peak resulted in two distinct peaks as shown in Figure 4c. The peak centred at 397.3 eV for S1, 397.1 eV for S2 and 396.7 eV for S3 could be from N atoms in O–Ti–N linkages [39]. The other peak at 399.1 eV for S1, 398.5 eV for S2 and 398.3 eV for S3 were from C=N–C as in pyridine N [39].
The high-resolution spectra in Figure 4d demonstrated Ti 2p peaks for C–N–TiO2 catalysts calcined at different temperatures. The peaks at 458.3 eV and 464.1 eV for S1 could be assigned as Ti 2p3/2 and Ti 2p1/2 with a spin orbit splitting of 5.8 eV which was in good agreement with the binding energy separation value of stoichiometric TiO2 [40,41]. The Ti 2p peaks for catalysts S2 and S3 exhibited the binding energies shift toward lower values as Ti 2p3/2 at 457.7 eV and Ti 2p1/2 at 463.7 eV and Ti 2p3/2 at 457.4 eV and Ti 2p1/2 at 463.5 eV with a spin orbit splitting of 6 eV and 6.1 eV, respectively. The reduction in Ti 2p binding energies toward lower values when increasing the pyrolysis holding time was due to increase in formation of Ti–C (confirmed by Ti–C component in C 1s high resolution) and reduction of Ti4+ to Ti3+ by accepting electrons and partial replacement of O2− with N3− to form Ti-N bonds [41].

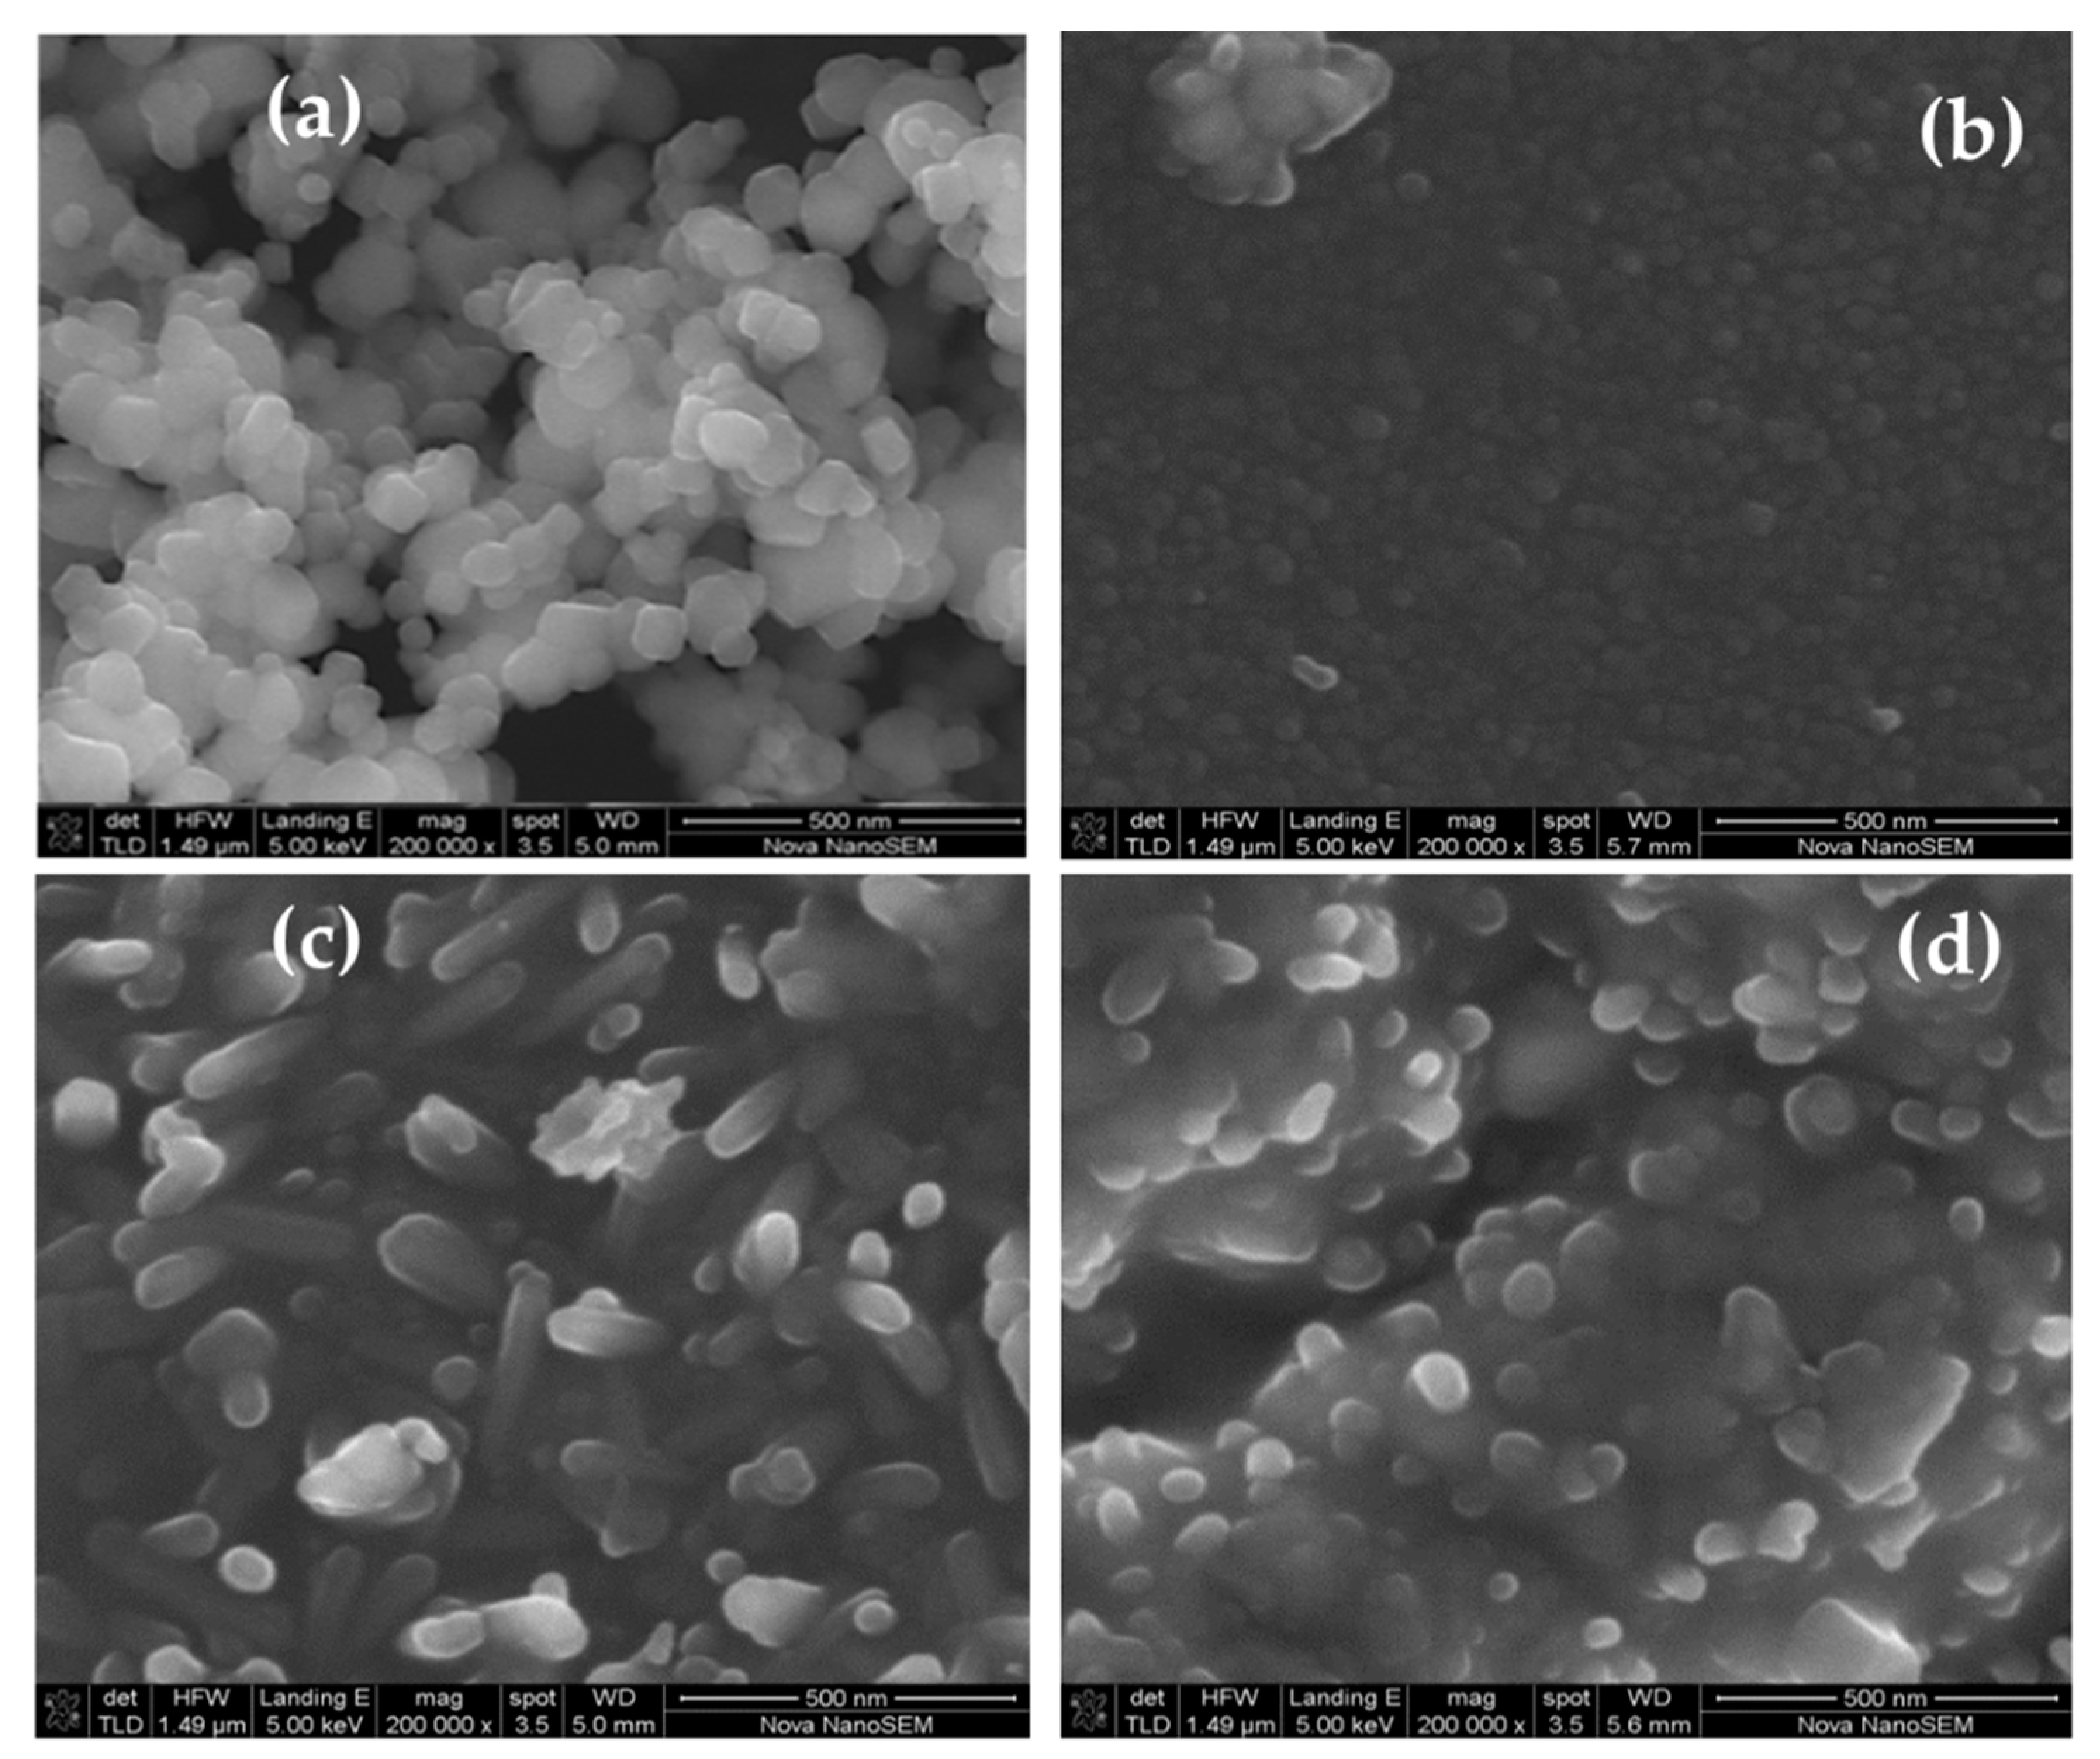
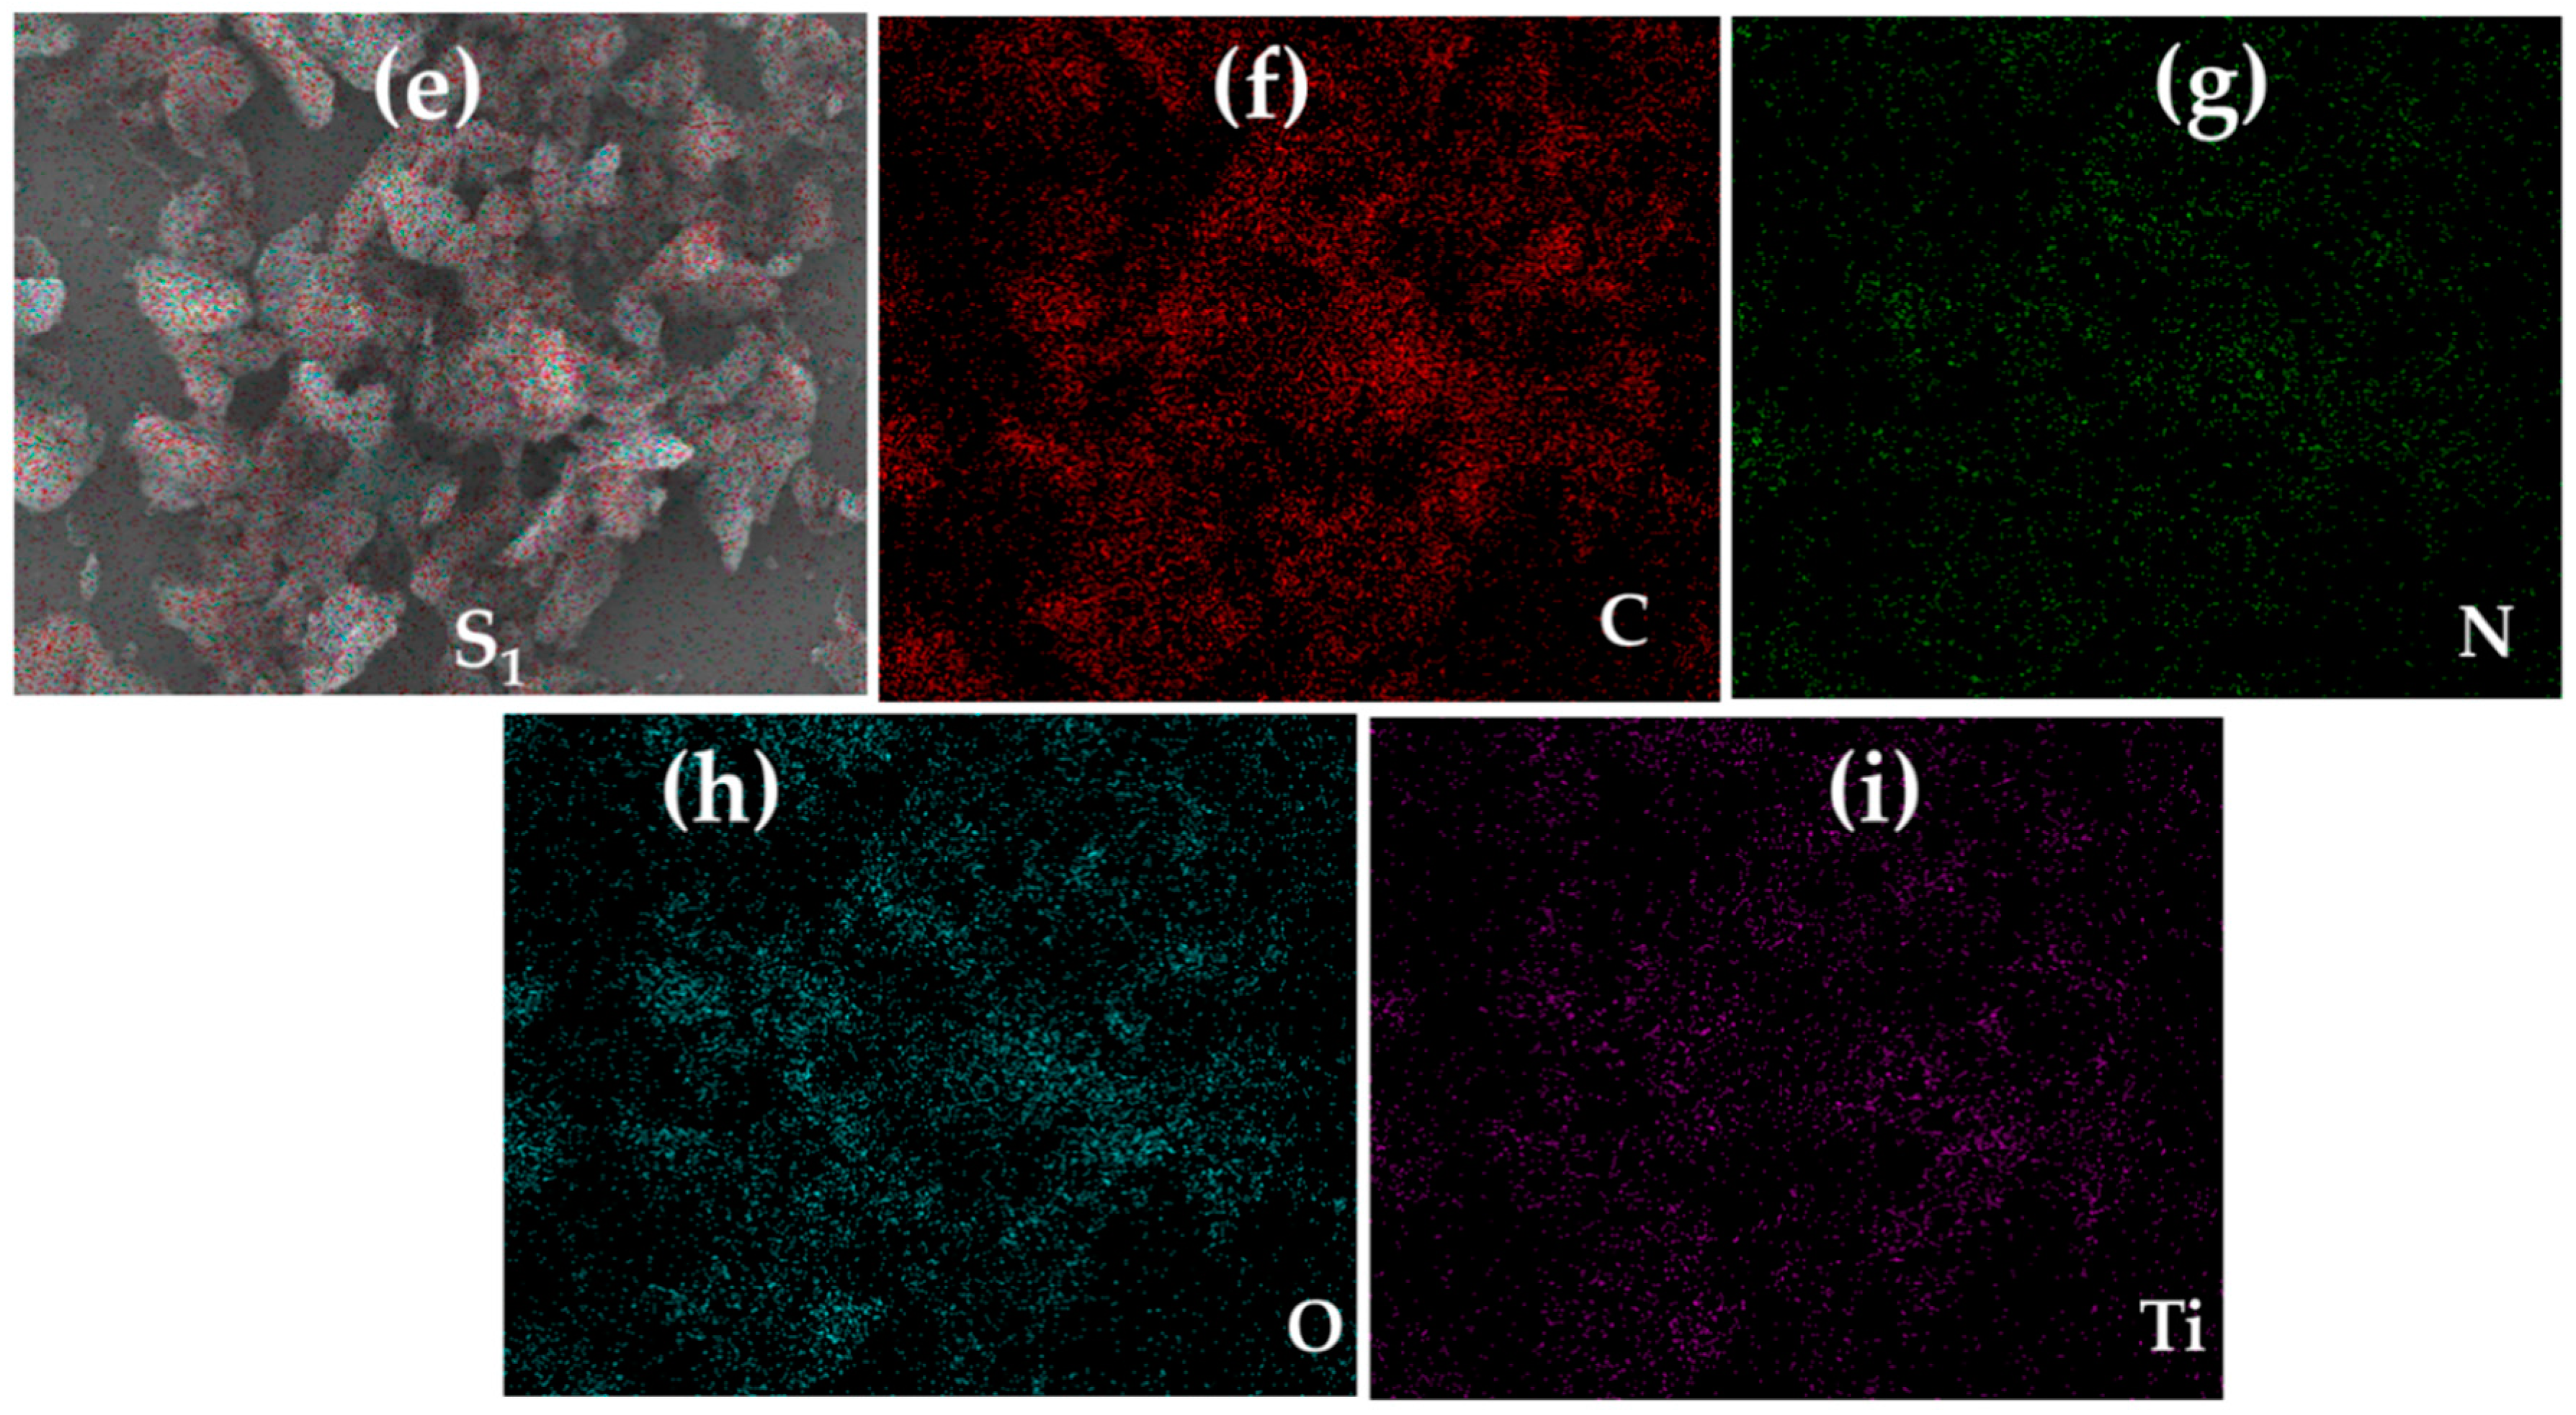
2.6. Scanning Electron Microscopy and Energy-Dispersive Spectroscopy of C–N–TiO2 Pyrolysed at Different Holding Times

Figure 5 presents SEM micrographs of pure TiO2 compared with the co-doped C–N–TiO2 nano composites synthesised by the sol-gel method and calcined at 350 °C at 50 °C/min for 105, 120 or 135 min holding time.
The SEM photograph in Figure 5a is for Degussa P25 showing individual 21 nm spherical crystallites. The SEM image of C–N–TiO2 pyrolysed for different holding times, presents an agglomerated morphological aspect showing residual PAN whereas fine powder particles were observed for pure TiO2 Degussa in Figure 5a. Figure 4b shows the formation of small spherical and cubic granular-shaped C–N–TiO2 nano crystallites pyrolysed for 105 min which were well distributed in a carbon matrix as shown by TGA and XPS and had a size of 5.5 nm compared to the randomly dispersed longitudinal spindle-and rod shaped crystals (6.3 nm), in Figure 5c and condensed agglomerated forms (6.4 nm), in Figure 5d when pyrolysis time was increased to 120 or 135 min, respectively. The SEM also showed that the TiO2 crystal sizes were larger than determined by the Scherrer equation indicating poly crystalline agglomerates of TiO2 with well-developed particulate structures of sizes between 5 and 40 nm determined using ImageJ software and set in a matrix of carbon residues derived from the PAN precursor [42,43]. The EDS mapping micrographs in Figure 5e demonstrate that C, N, O and Ti were all present and well dispersed in the synthesised C–N–TiO2 nano composites.
Similar morphological changes were noticed by Tijani et al. [20] and Cheng et al. [19] during the synthesis of C–TiO2 and N–TiO2 nano catalysts by different methods. These authors reported that isolated C and N dopants in their substitutional bonding forms C–O–Ti–O and N–Ti–O in forbidden bands of TiO2 lattice became unstable when increasing pyrolysis time.
During pyrolysis in N2 the PAN used as carbon source in this study degraded and its partially pyrolysed carbon residues are still very much evident as the matrix around each TiO2 crystal, as was observed in elemental EDS mapping shown in Figure 5e and HRTEM in Figure 6. At longer times, less of the carbon residue remained compared to TiO2 Degussa that showed no mass loss around 130 °C, as shown by TGA with about 8, 10 or 14% mass loss noted for S1, S2 and S3, respectively. Thus, when increasing pyrolysis holding time at 350 °C from 105 to 120 or 135 min, PAN decomposes into C and N in the TiO2 matrix. This resulted in random recombination with O giving off toxic gases such as NO, NO2, CO, CN as supported by FTIR and a total mass loss of 6% by TGA analysis. The NH4NO3 dosed during sol-gel preparation contributed as N source (NH4+) while nitrates could have evaporated as NO2 and related gases.
Thus, by increasing the pyrolysis time, we reduced the amount of PAN residues due to the diffusion of incorporated C and N probably to the surface of the semiconductor photo catalyst. Consequently, an analysis of the relative concentrations of C, N and other elements in the catalysts was assessed to compliment the claims discussed in FTIR, TGA and SEM analysis.

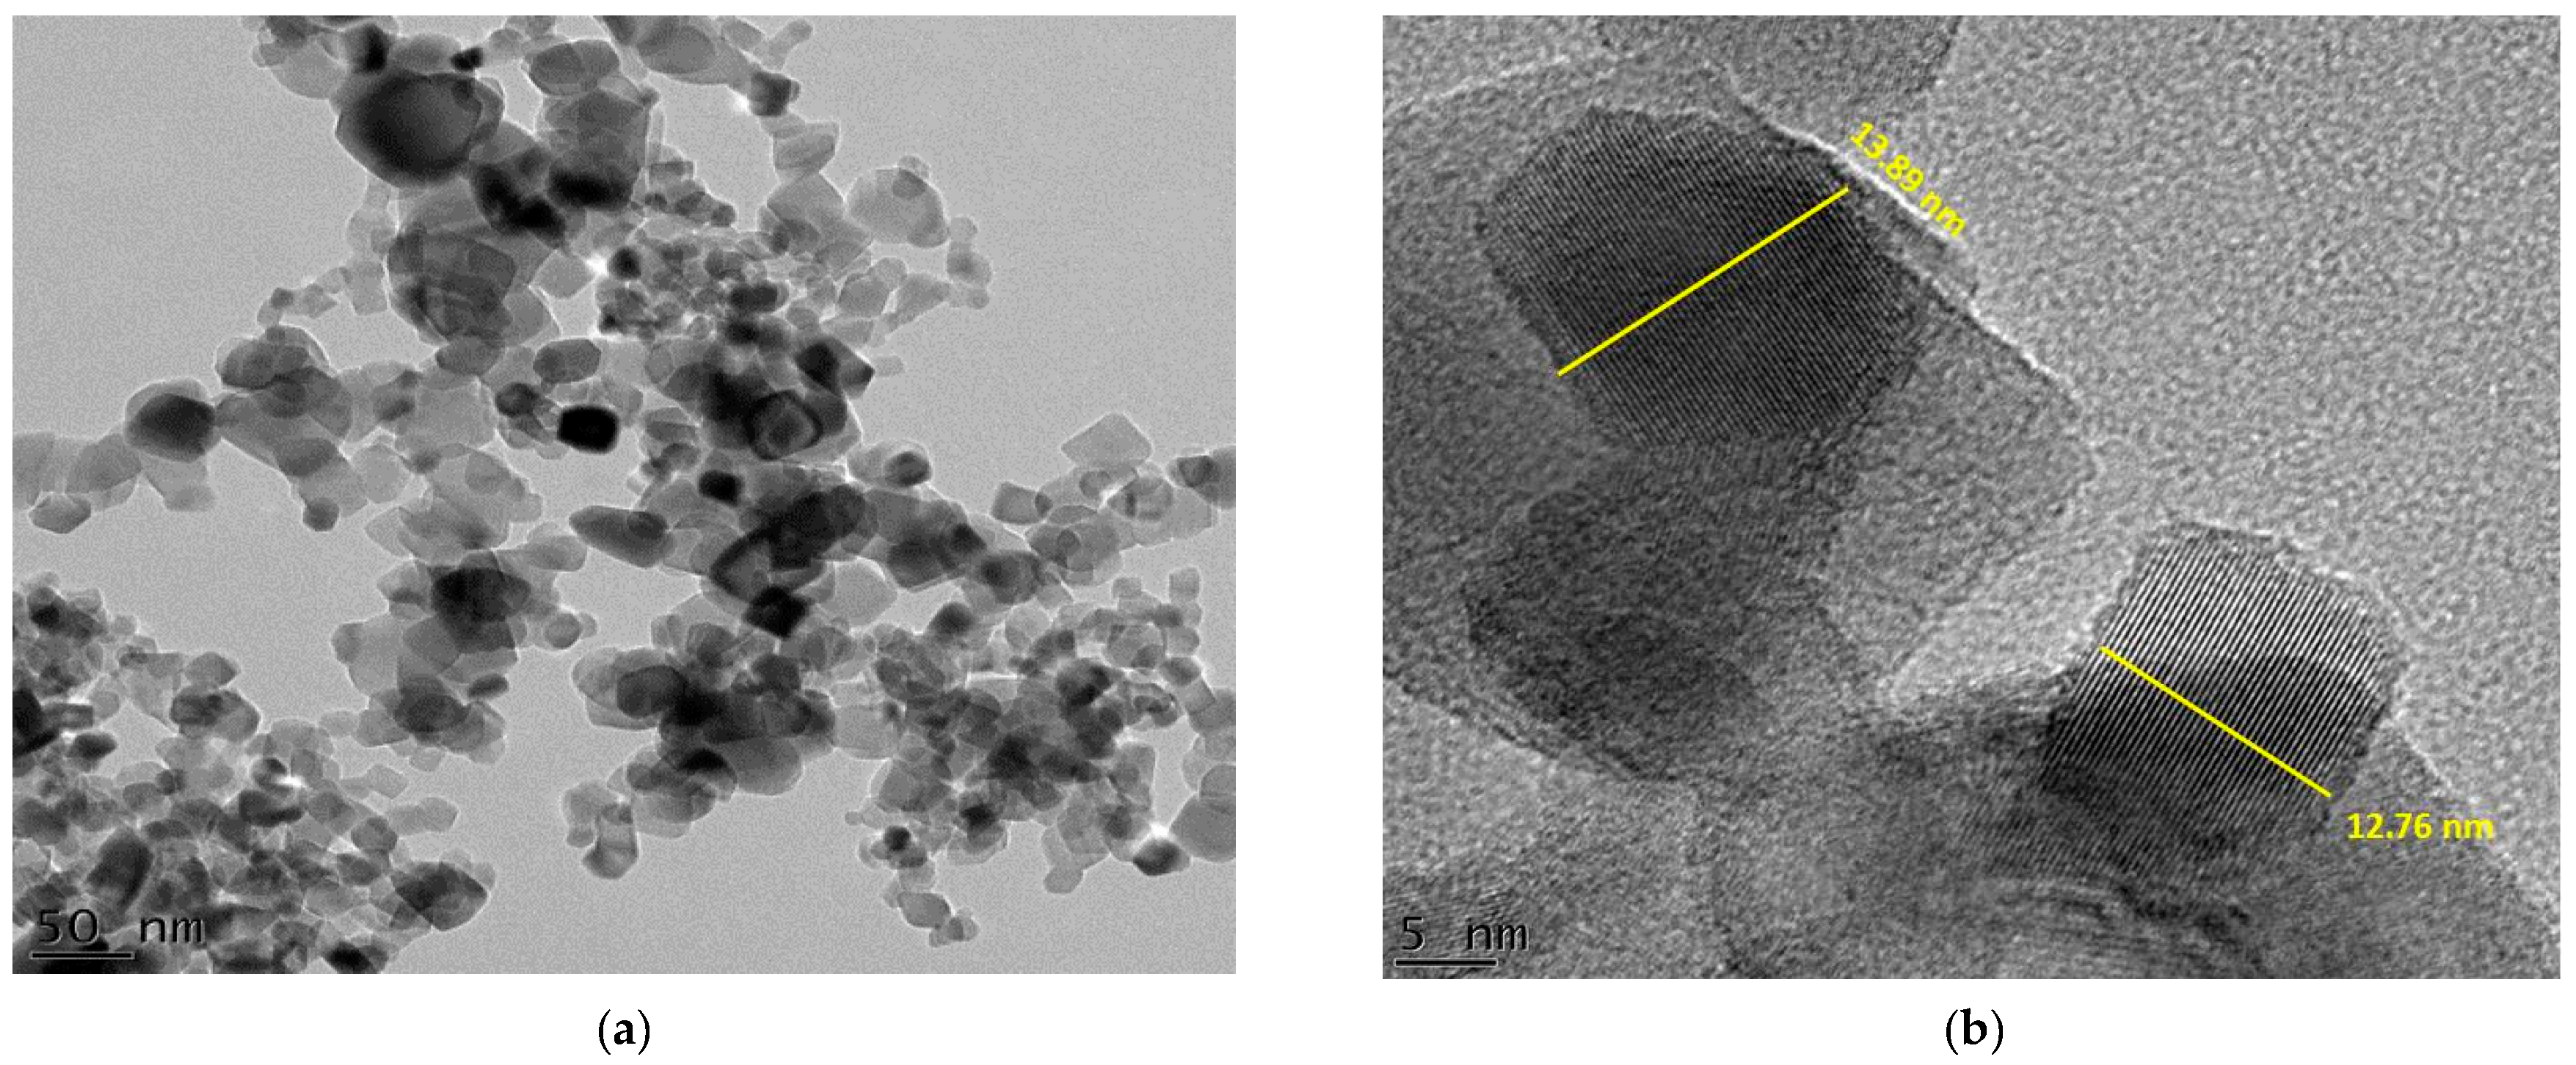
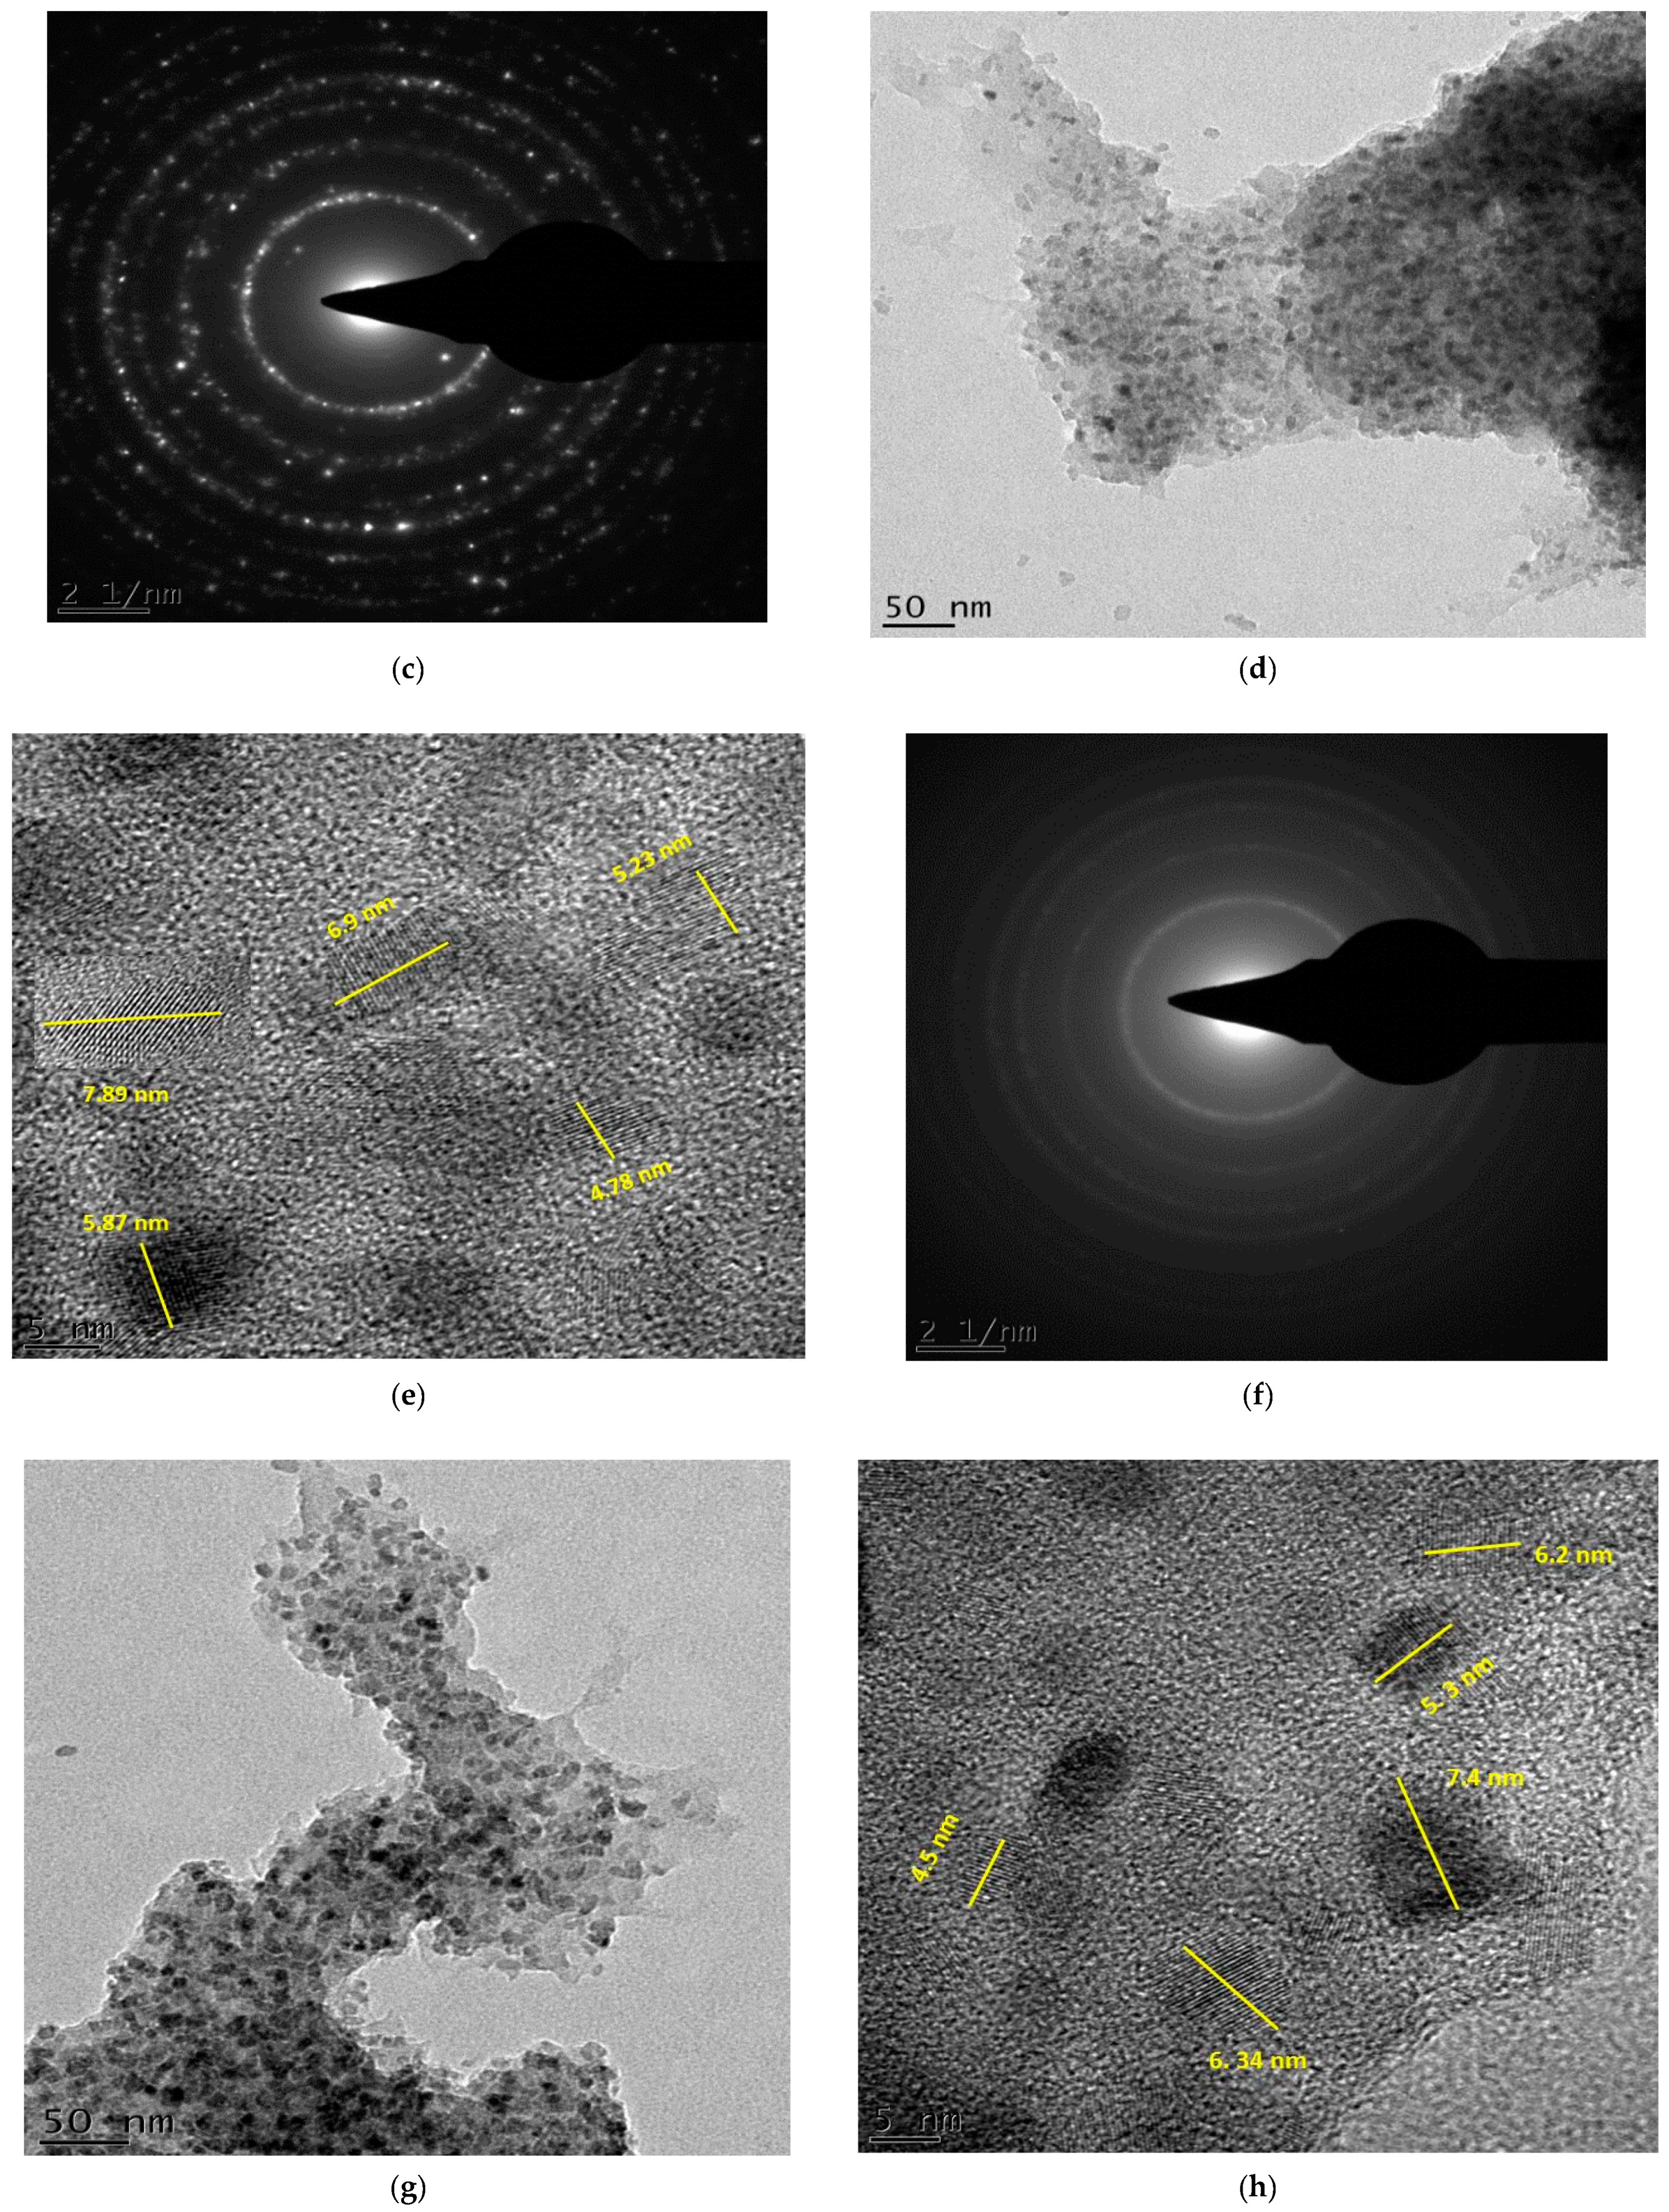
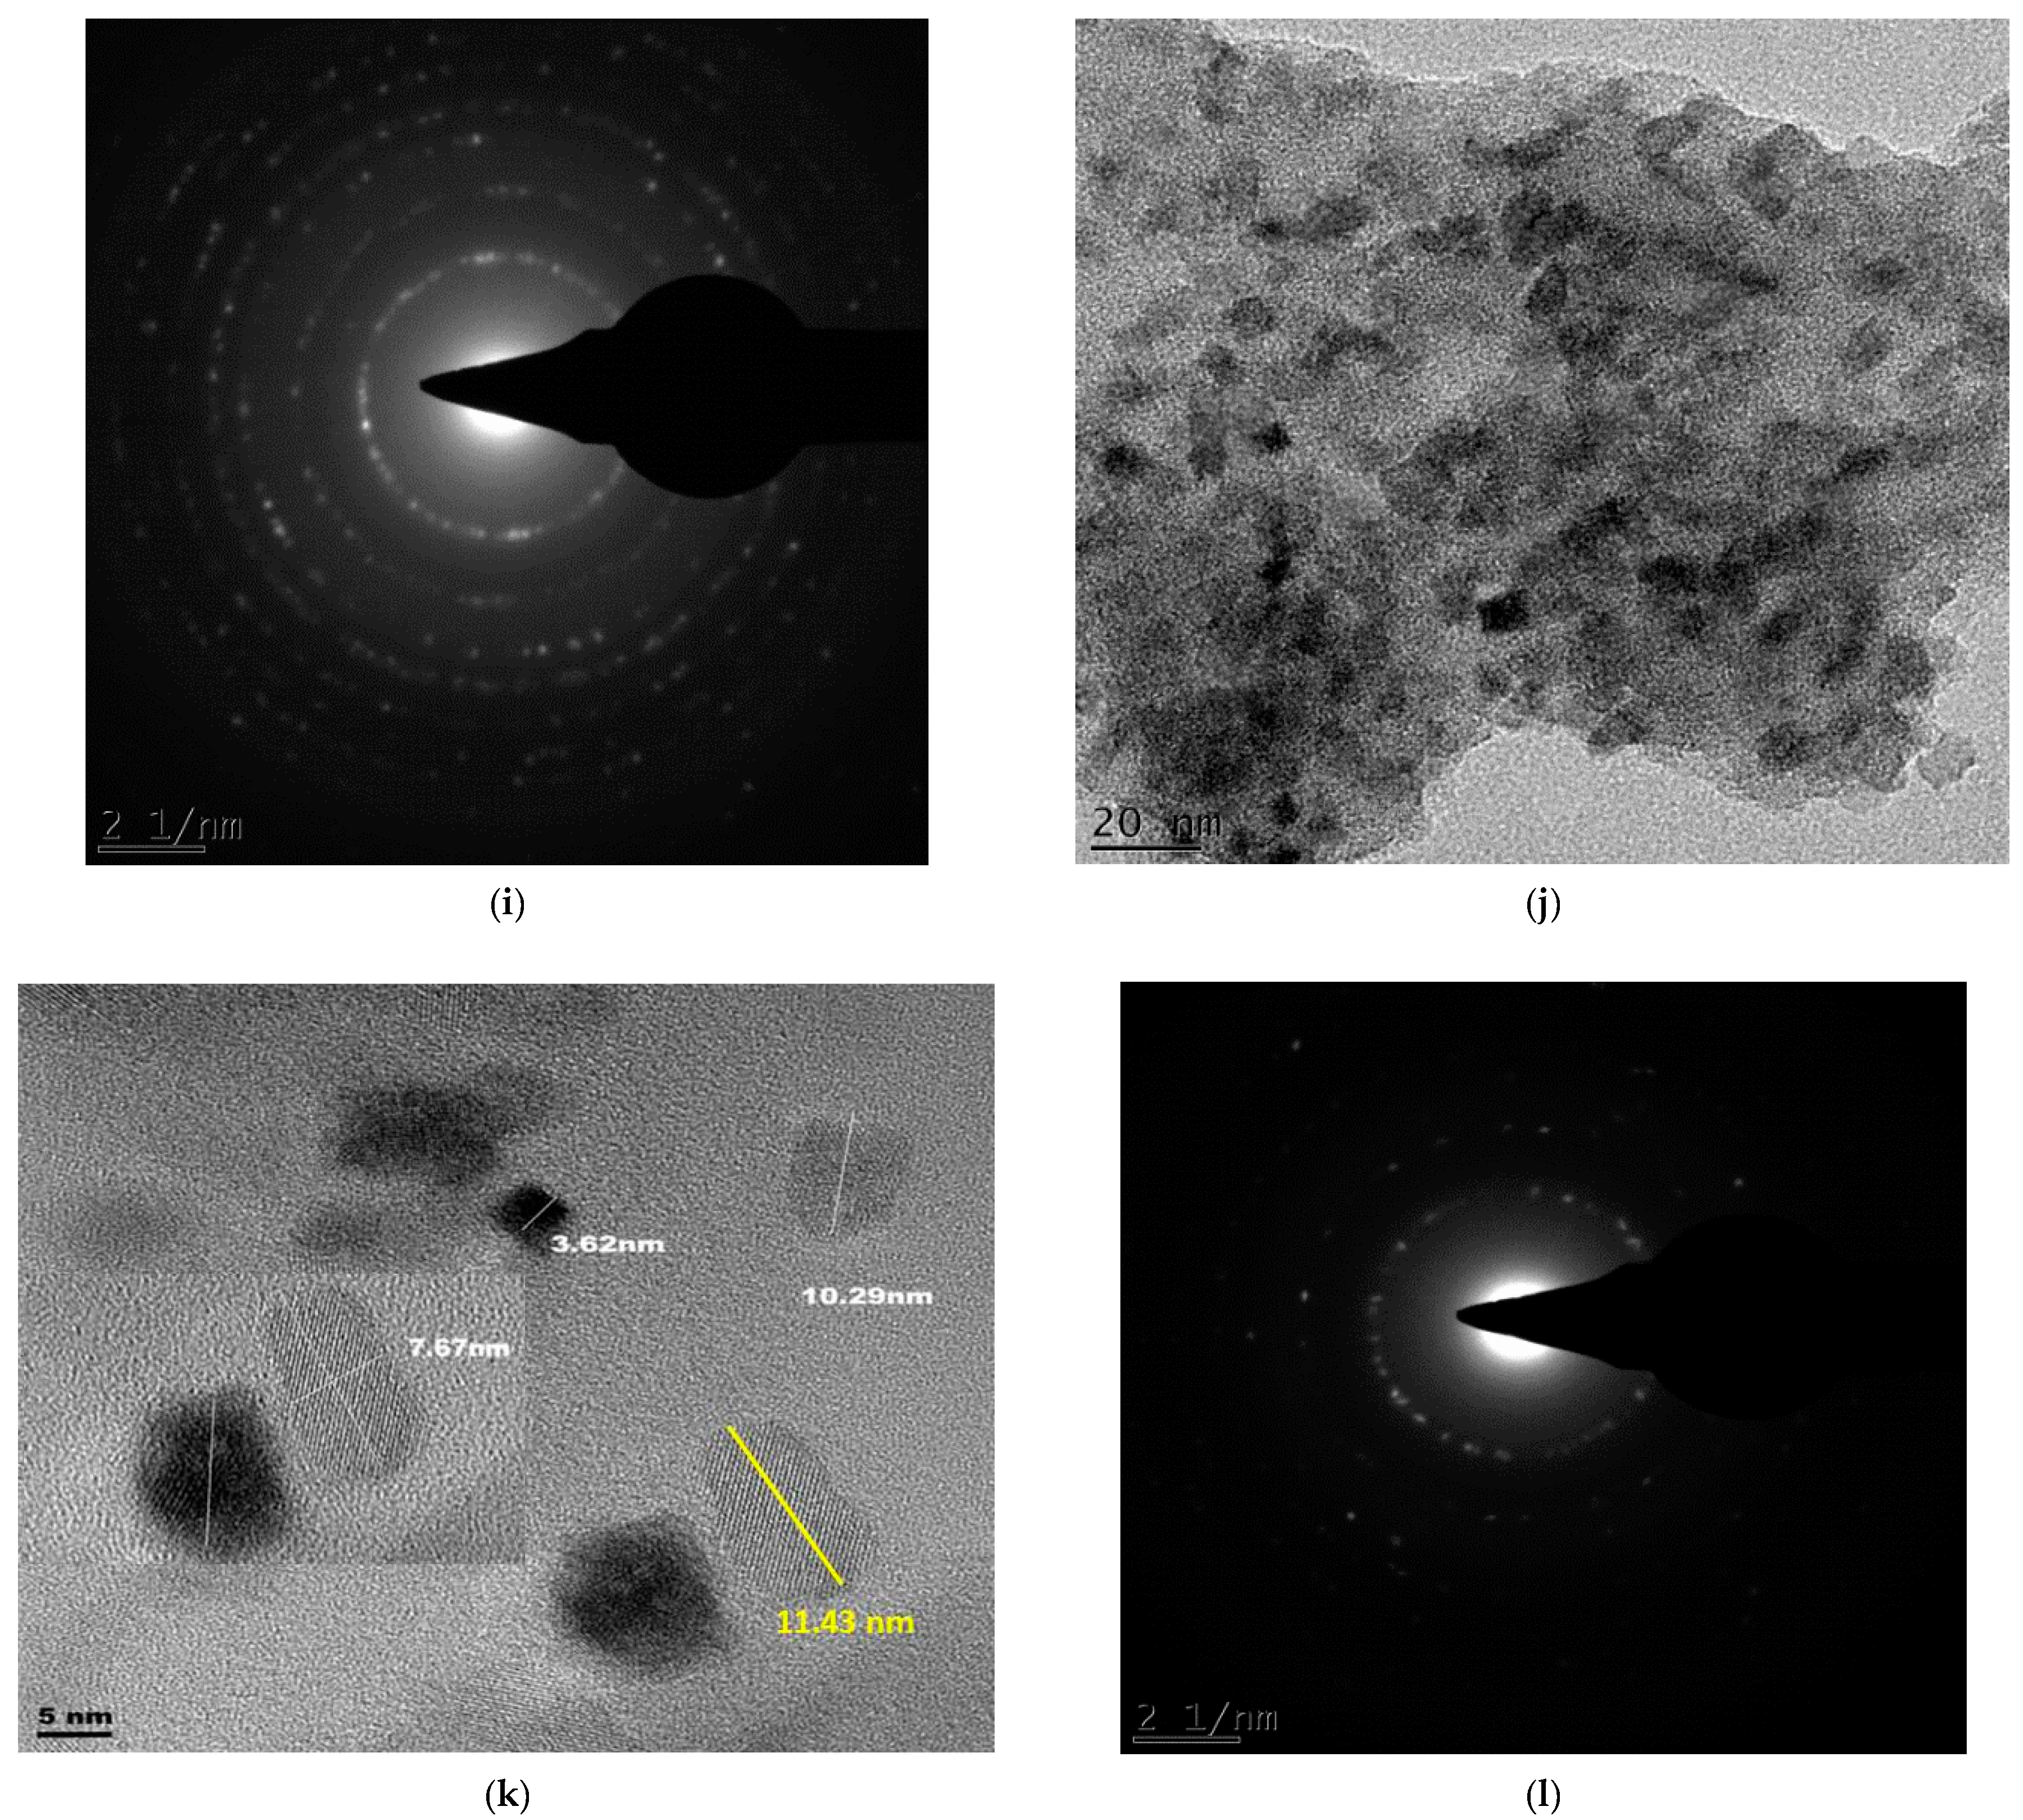
2.7. Transmission Electron Microscopy and Thin Film Energy-Dispersive Spectroscopy of the Synthesised C–N–TiO2 Nano-Composites

The FEG-TEM analysis coupled with EDS spot analysis (TEM-EDS) of small selected areas were used to determine the elemental composition of the prepared nano composites. This allowed the determination of the relative concentrations of C, N and other elements in the catalysts to compliment the claims discussed in FTIR, TGA and SEM analysis.
Although the sensitivity of SEM-EDS was very low for N detection, the small area approach during TEM-EDS allowed for greater sensitivity as shown in Table 3, with weight percentage of C (72.32%), Ti (10.55%), N (7.1%) and O (8.26%) showing that C and N were present in the TiO2 compound after 105 min of holding time. While chlorine impurities (1.66%) were certainly derived from the Ti precursor (TiCl4) used during sol-gel preparation, Cu resulted from the copper grid used to support samples during TEM analysis. The C to Ti ratios in Table 3 show that a slight change in holding time causes such a difference in the carbon matrix due to the instability of C in PAN heated at 350 °C. Moreover, the huge amount of carbon measured by TEM-EDS in Table 3 probably includes residues of degraded PAN gluing the crystals together; on the other hand, this could also result from C diffused to the surface of C–N–TiO2 when PAN decomposed during the calcination process.
As expected, it could be noticed that increasing pyrolysis time resulted in a decrease of the C content and the concomitant increase of Ti content. This is proven by the EDS weight% results showing the decline in carbon content from 72, 64.0 to 40 after 105, 120 or 135 min of pyrolysis, while that of Ti content increased from 10.55%, 21.86% to 49.65%, probably due to the carbon loss during pyrolysis. In addition, it should be mentioned that as PAN has N in its structure; N was already present before NH4NO3 addition; therefore, this explains the increase in N content observed in Table 3.
Furthermore, nitrogen content decreased from 7% to 3% during the pyrolysis process. Therefore, a longer pyrolysis time induced volatilisation of the C and N introduced upon the TiO2 matrix by use of PAN and NH4NO3 and led to morphological changes of the synthesised nanoparticles as shown by SEM analysis in Figure 5.

2.8. Transmission Electron Microscopy and Selected Area Electron Diffraction Analysis of TiO2 Degussa and C–N–TiO2 Nanoparticles

The C and N forming a matrix around and upon the TiO2 of C–N–TiO2 pyrolysed for different holding times was assessed by TEM coupled with selected area diffraction patterns (TEM-SAED) as shown in Figure 6. Figure 6c,f,i,l presents the SAED patterns of S0 (Figure 6c) and those of C–N–TiO2 nano catalysts S1 (Figure 6d–f), S2 (Figure 6g–i) and S3 (Figure 6j–l) pyrolysed under nitrogen gas at 350 °C at a ramping rate of 50 °C/min.
The TEM micrographs in Figure 6a showed the Degussa P25 TiO2 crystals (bright crystals) and its SAED pattern (5c). While in Figure 6d,g,j the TEM images showed that C and N impurities were well distributed throughout the TiO2 matrix. These observations were also supported by the TiO2 crystals embedded in the carbon matrix surrounding the TiO2 catalysts as shown in Figure 6e,h,k. The bright small reflections in the polymorphic rings observed in these images confirmed the polycrystalline nature of the TiO2 nanoparticles.
The bright reflections on the spherical lines corresponded to the crystal plane (110) could be ascribed to distinctive C–N–TiO2 nano crystals mostly in pure mineral anatase phase. However, the crystal lattice reflections are brighter in the S0 sample compared to those in Figure 6f,i,l probably due to the small randomly oriented nanoscale TiO2 domains in agglomerated particles as can be deduced by comparing Scherrer equation estimations and SEM or TEM images.
From the SAED, it is also possible to account for the graphitic carbon content as diffuse rings were evident, particularly in Figure 6f in which the sample had the highest carbon content [44].

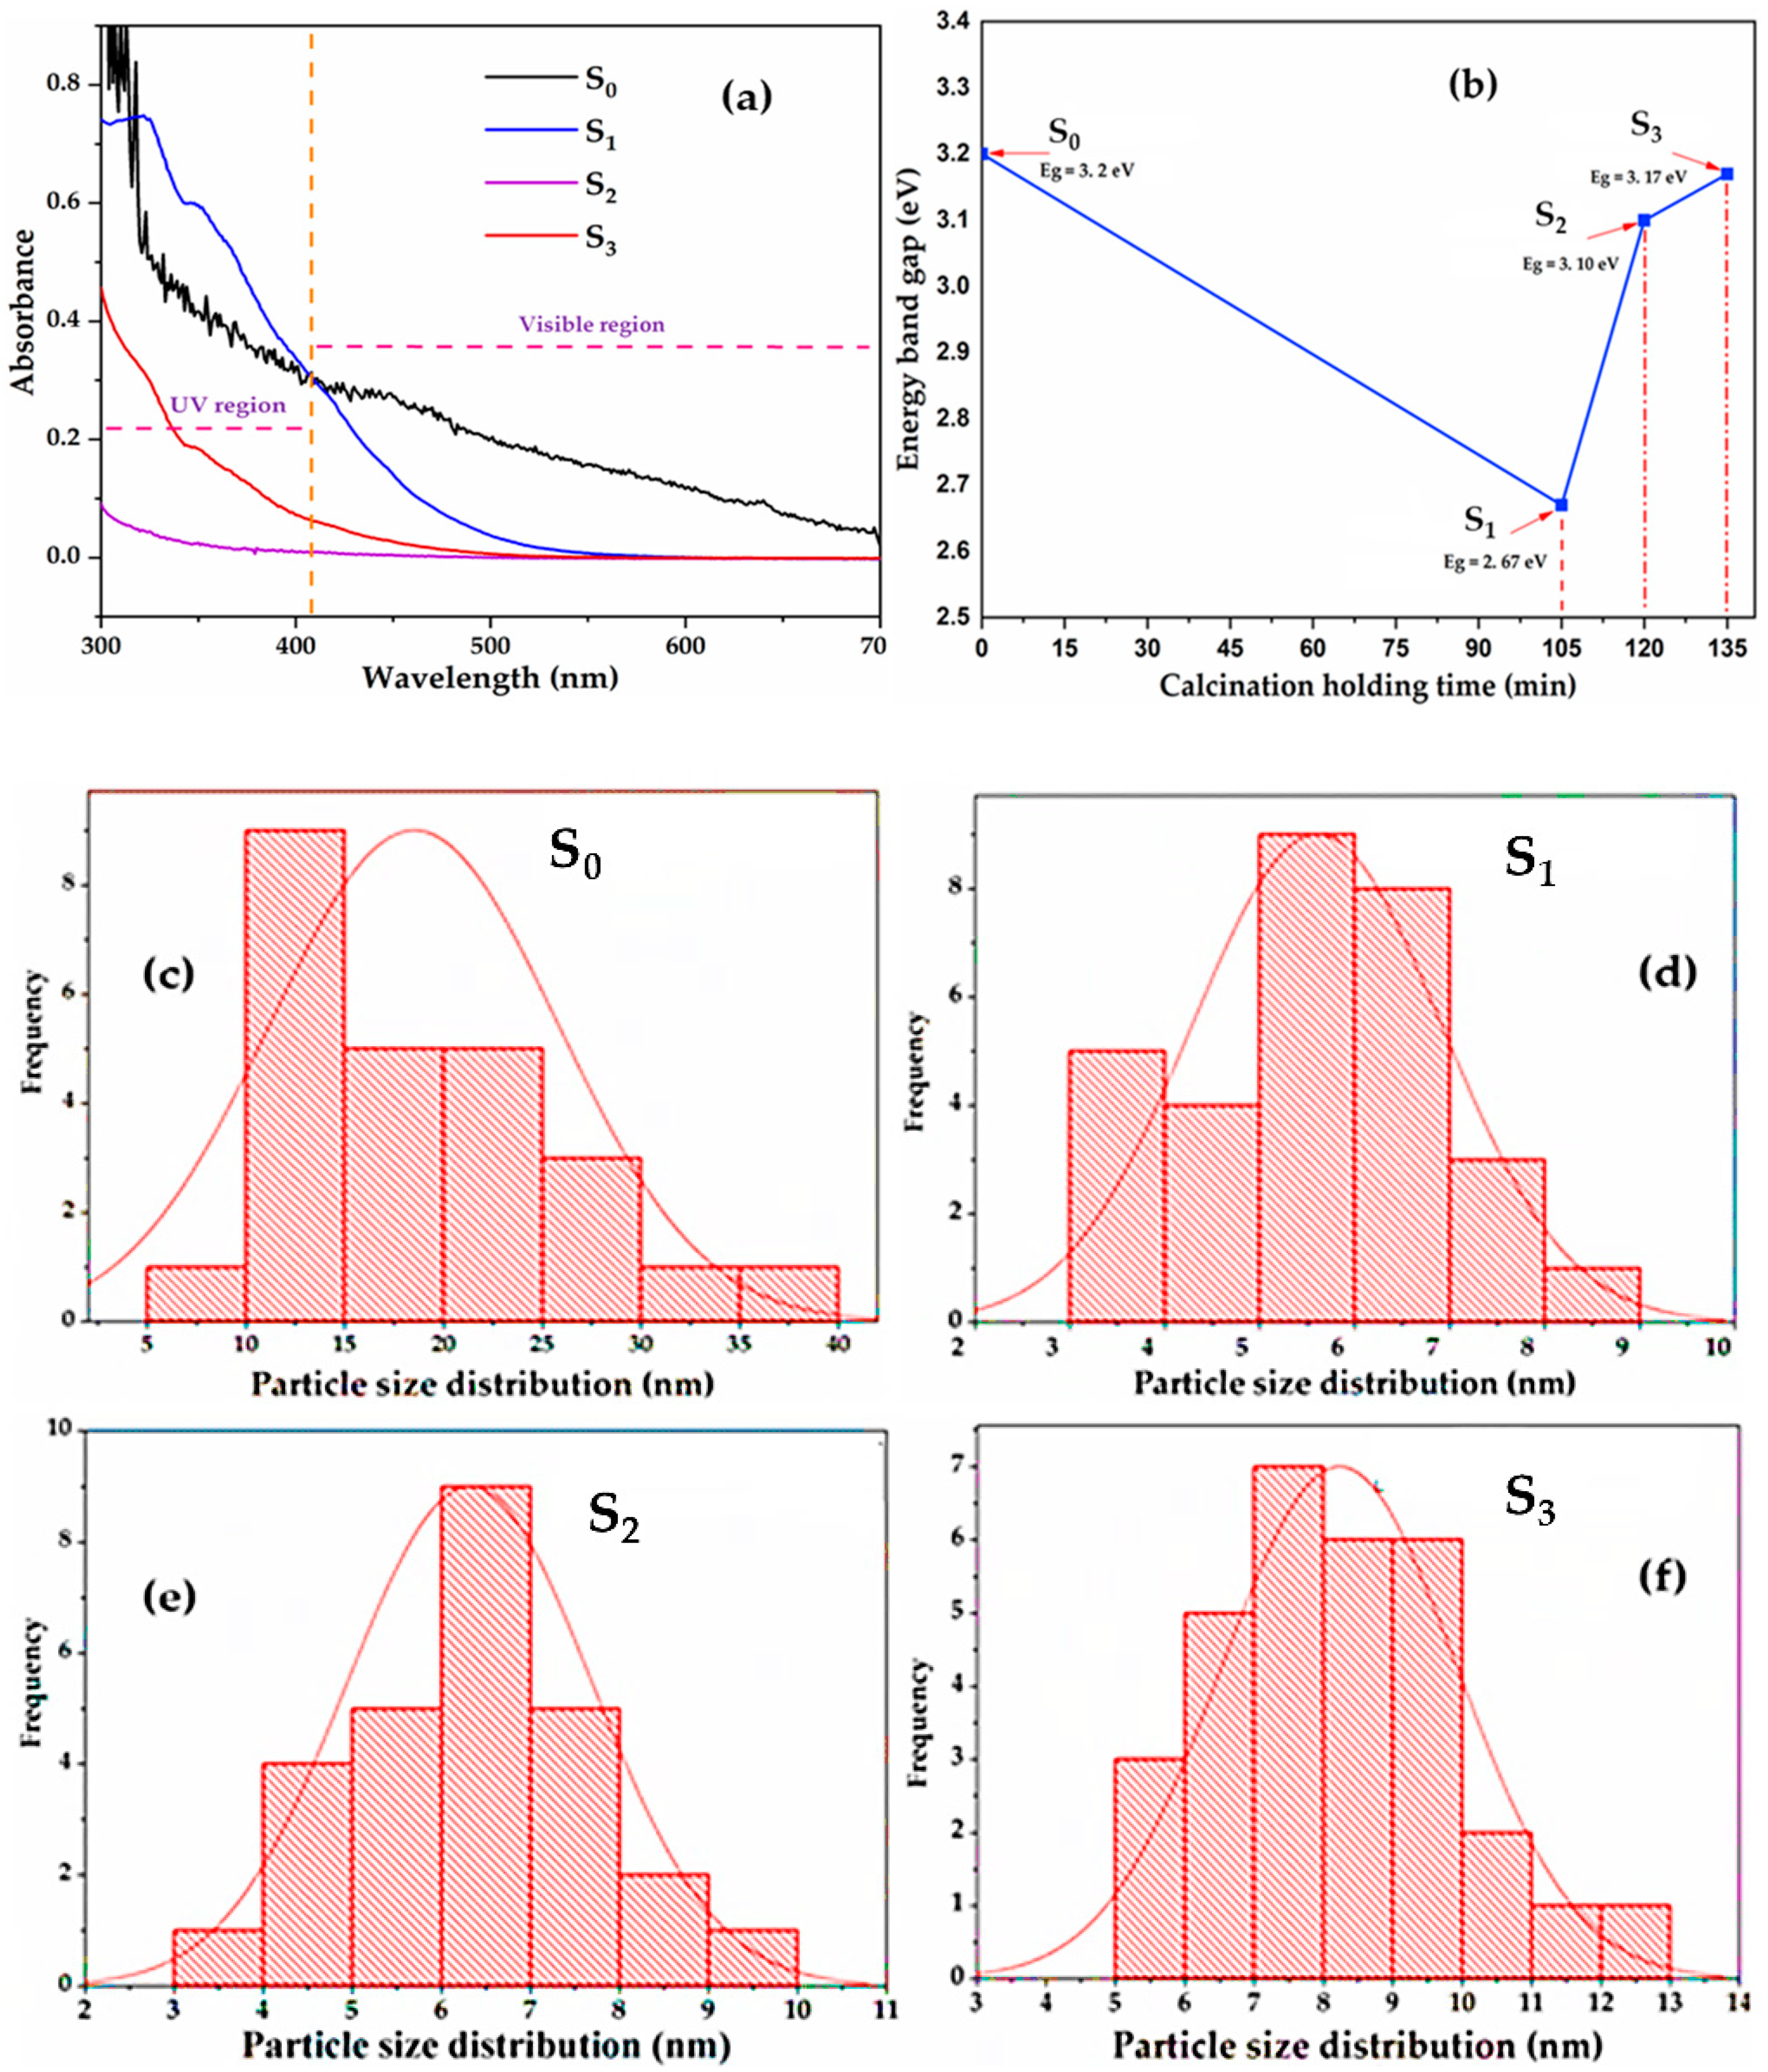
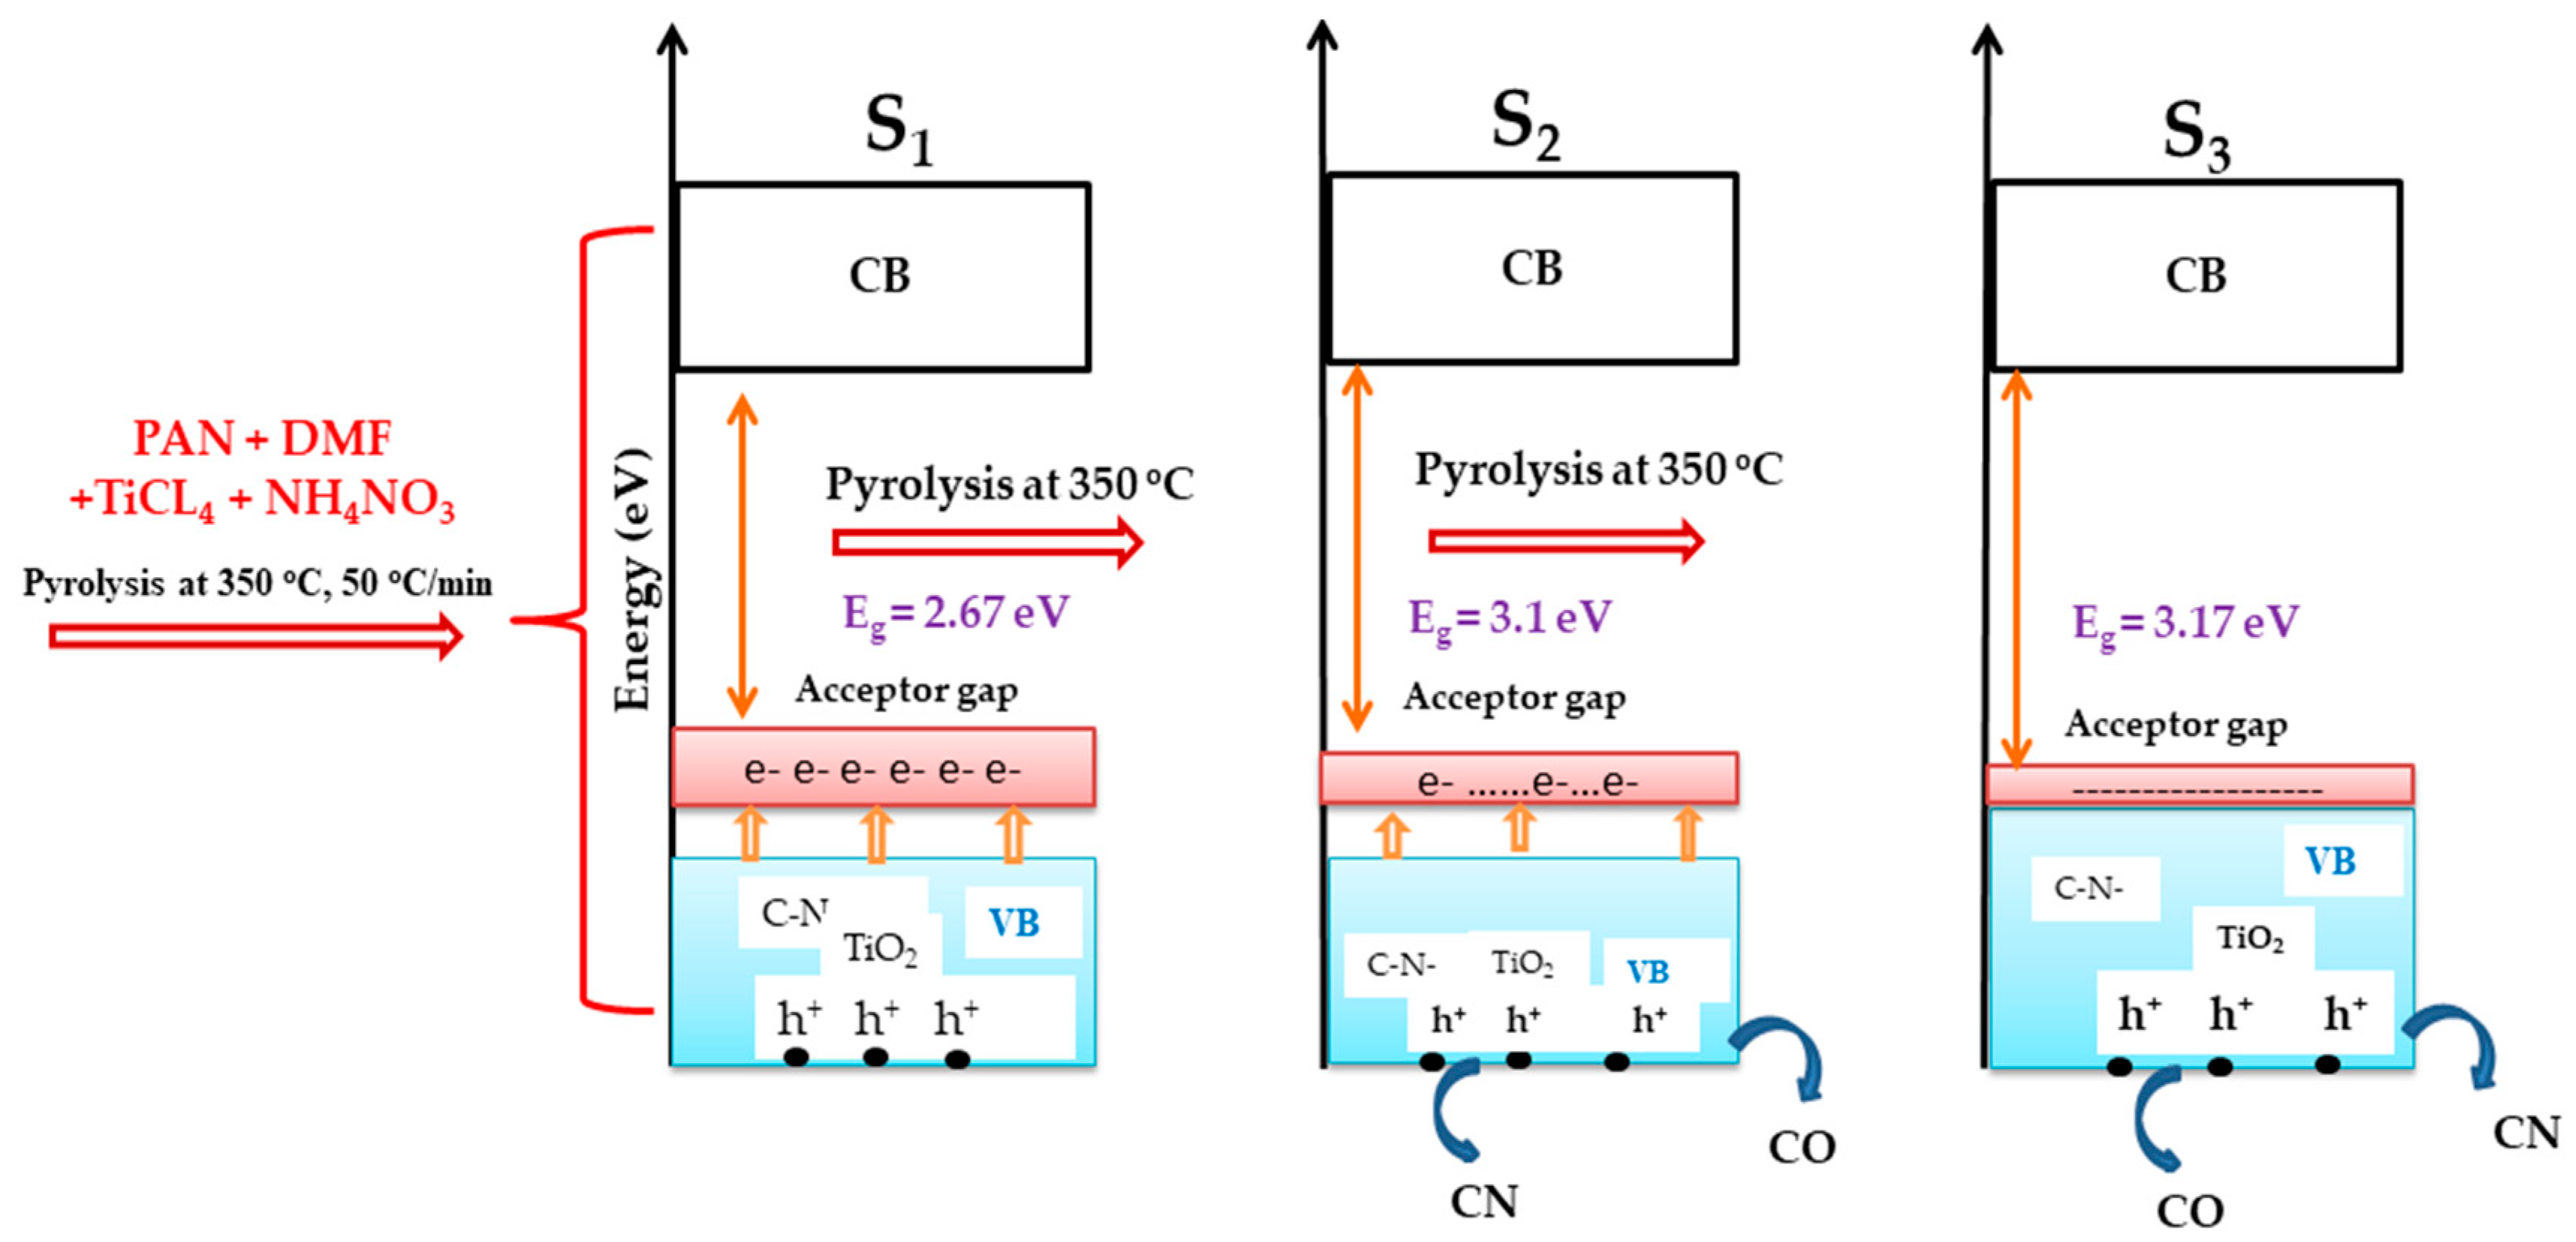
2.9. UV-Vis Spectroscopy Analysis, Determination of the Nano Catalyst Band Gap

The outcomes exhibited in Table 4 indicated that upon C and N deposition, the 3.2 eV absorption band gap of pure anatase/Degussa TiO2 was narrowed to 2.67 eV, 3.10 and 3.17eV when pyrolysis time was altered from 105, 120 to 135 min, correspondingly showing how accurately the pyrolysis time allows band gap tailoring. The wavelengths and the approximated band gaps are recorded in Table 4 and plotted in Figure 7b.
The results in Table 4 and Figure 7a,b showed that C–N–TiO2 catalysts S1 had a band gap of 2.67 eV, smaller than 3.10 and 3.17 eV obtained for S2 and S3 when pyrolysis time was increased to 120 min and 135 min. The UV-Vis wavelengths (from Figure 7a) showed that S0 absorbed at 408 nm and S1 in the visible region at approximately 462 nm; S2 and S3 absorbed in the UV region at 393 and 333 nm, respectively.
The slight decrease of wavelength and small increase of the computed band gap of the C–N–TiO2 nano catalysts obtained after longer pyrolysis time was correlated with the amount of C and N remaining after evaporation during the pyrolysis process as confirmed by FTIR and TGA analysis. All C–N–TiO2 nano catalysts presented band gap values smaller than the one of S0 (3.2 eV) as presented in Table 4 and highlighted by Carp et al. [45], Li et al. [46] and Gilmour and Ray [47].
The reduction of the typical TiO2 band gap from 3.2 eV to 2.67 eV after 105 min of pyrolysis was likely due to the presence of oxygen vacancies that acted like electron-donors in the valence band of the photo catalyst and hence accumulating more layers (microstates) with new electronic properties which further reduced its energy absorption gap [15,48].
In this study, concentrations of PAN and NH4NO3 precursors of C and N were kept constant during synthesis of C–N–TiO2 co-doped nano catalyst. The increase of the band gap from 2.67 to 3.10 and 3.17 eV when increasing pyrolysis time suggested that the stability of C and N upon and inTiO2 structural lattice depended on the degree of volatilisation of these two substituents as previously shown by FTIR. This inferred that the engineered C–N–TiO2 nano particles are stable at a specific pyrolysis holding time; an increase of holding time may lead to changes in their band gap, recombination rate of electron hole pairs, morphology, and particle size as early reported by Tijani et al. [49].
Thus, to achieve the maximum desired catalytic properties, of the C–N–TiO2-based materials via the sol-gel pyrolysis protocol, one should optimise and carefully control the holding time during the pyrolysis process. To our knowledge, most of the studies published in the literature have not observed this condition when using PAN as a C precursor.

2.10. Particles Size Distribution of TiO2 Degussa and the Synthesised C–N–TiO2 Nano Composites

The TEM morphologies of TiO2 Degussa and the synthesised C–N–TiO2 nano catalysts earlier presented in Figure 6a,d,g,j were further used to determine the particle size distribution of the catalysts shown in Figure 7c–f using ImageJ Java-based software (developed by Wayne Rasband (retired from the National Institutes of Health and the Laboratory for Optical and Computational Instrumentation (LOCI, University of Wisconsin, Madison, WI, USA).
The TEM size distribution normalised results of the Degussa catalyst presented in Figure 7c show that the particle size distribution of TiO2 of Degussa P25 varied between 5 and 40 nm and the most abundant TiO2 particle sizes were between 10 and 25 nm which is in conformity with XRD results.
All synthesised C–N–TiO2 specimens were in the nano scale and had smaller crystallite sizes than TiO2 Degussa. As shown in Figure 7d–f, among the nano catalysts synthesised in this study, the granular S1 had the smallest particle size range of 5 to 6 nm. Apart from being in nanotube shapes, and agglomerated forms, compared to S2 and S3 obtained after longer pyrolysis time (as shown by SEM analysis), their most abundant particle size ranged consistently in the 6–8 nm interval. These results confirmed that the size of C–N–TiO2 doped nano catalysts increased slightly with an increase in the pyrolysis time.

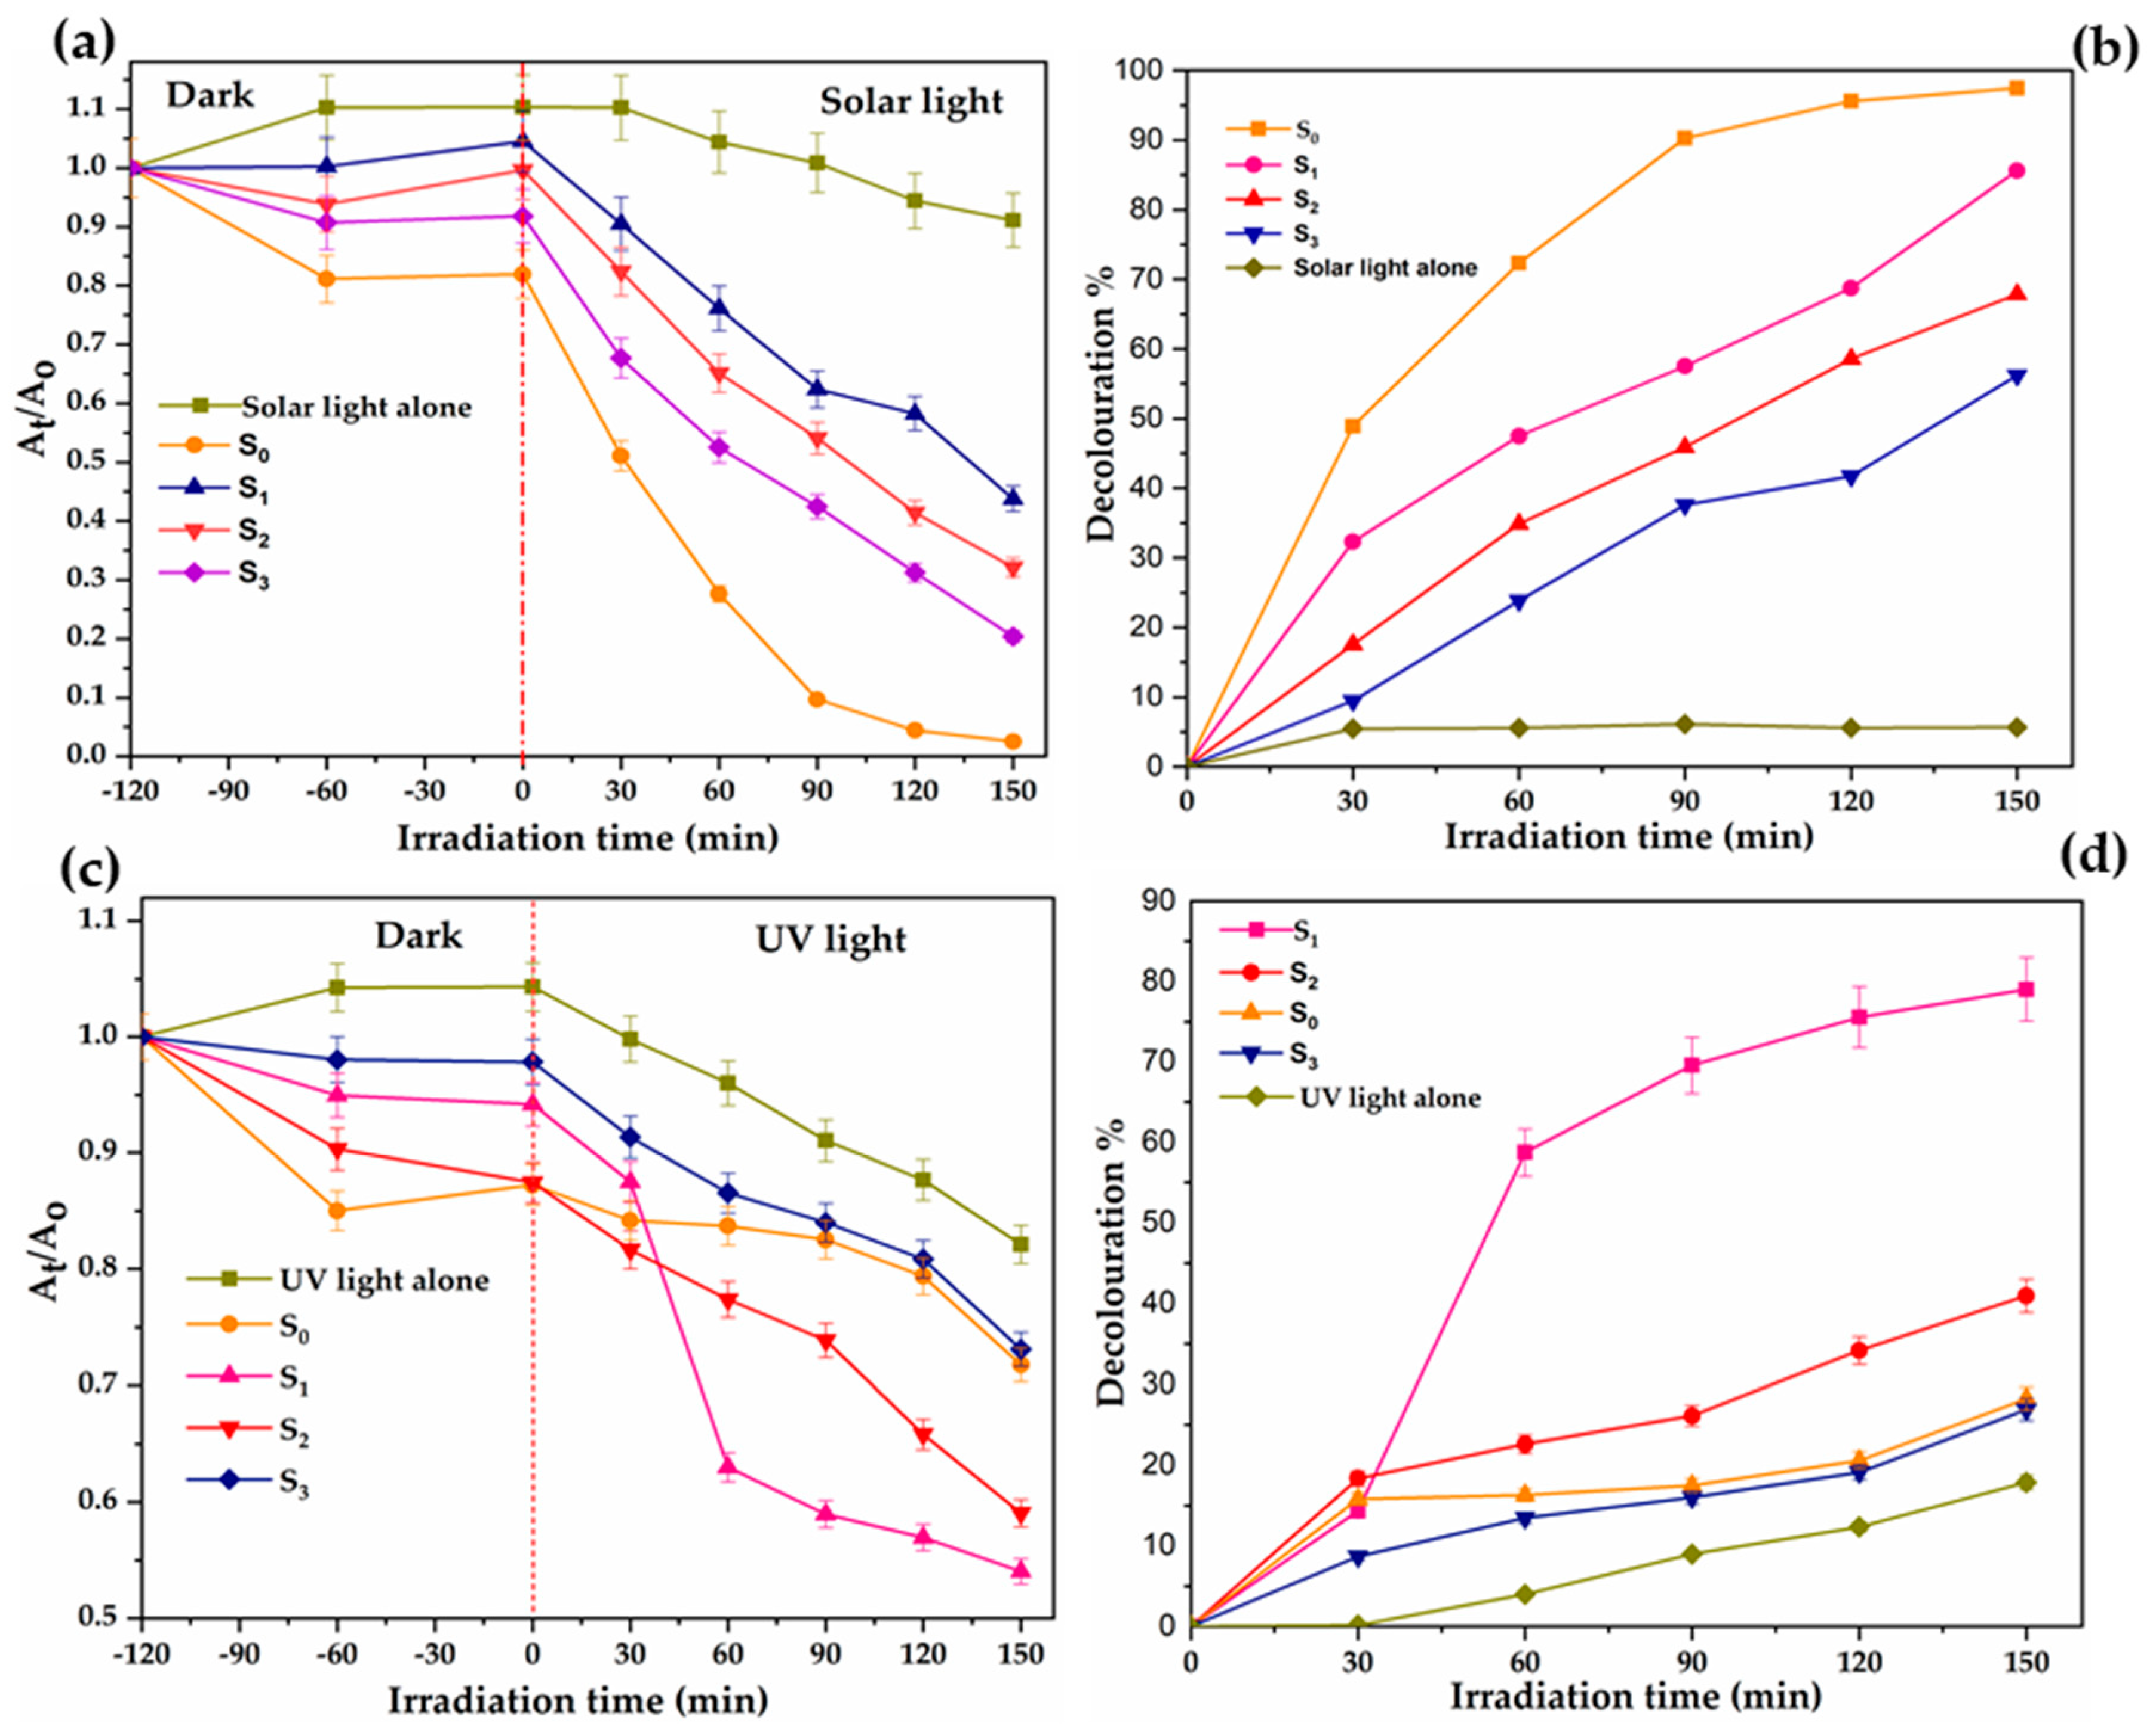
2.11. Effect of Pyrolysis Holding Time of C–N–TiO2 Nano Catalysts on Photocatalytic Decolouration of Orange II Dye
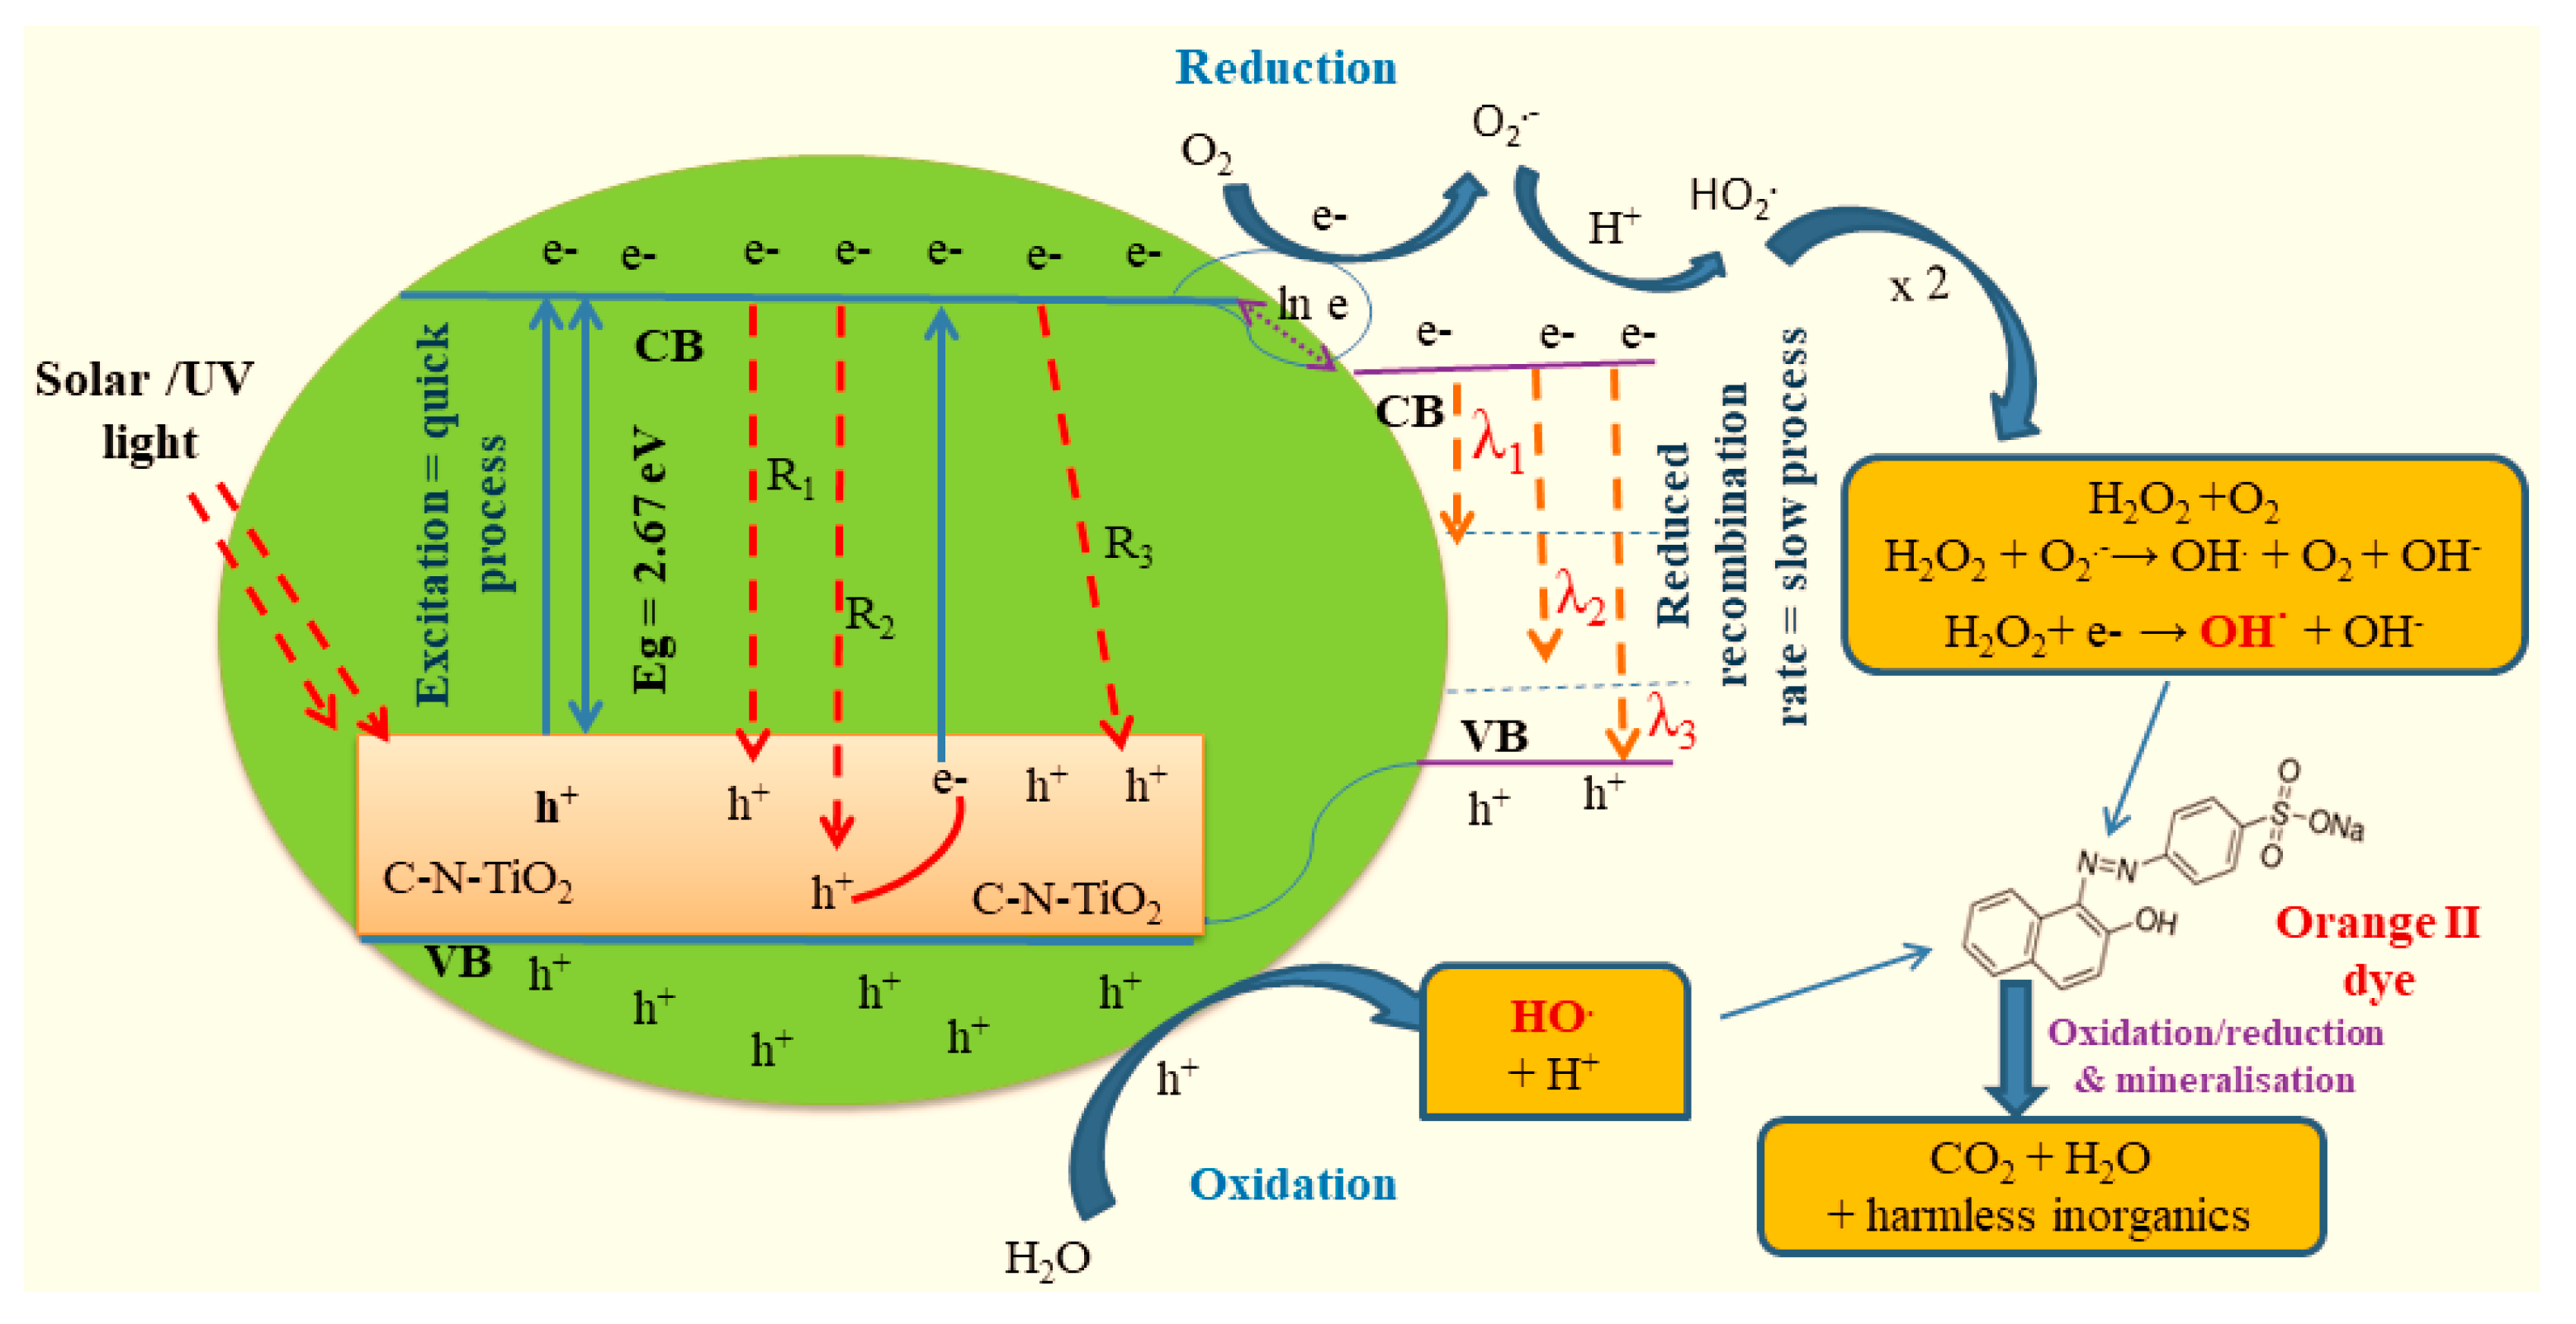
The photo catalytic activity of Degussa TiO2 (S0) and the synthesised C–N–TiO2 nano catalysts was investigated upon the decolouration of O.II sodium salt dye under solar and UV light at the applied conditions and the results are presented in Figure 8.
The duplicated photo catalysis results presented in Figure 8 show that all C–N–TiO2 nano catalysts were photo catalytically active under solar and UV light and the best photocatalytic decolouration of O.II was achieved with S1 in both solar and UV light followed by S2 and S3. The pure TiO2 Degussa showed higher removal rate under solar light compared to C–N–TiO2 nano composites due to titanium carbides entities that are assumed to have formed. Since both solar and UV light were used, the improvement of catalysts performance in UV light could be ascribed to the decrease of charge recombination rate (detailed in discussion section). The carbon residues that glued crystals together did not negatively affect S1 catalyst activity by much compared to the Degussa (S1).
In Figure 8a, the photo catalytic results under solar light show that after 150 min of irradiation, the C–N–TiO2 105 min achieved enhanced activity of 85% compared to 67.9% or 56% decolouration rates that were reached with 120 min and 135 min C–N–TiO2 nano catalysts, correspondingly. This is in accordance with the band gap values earlier recorded in Table 4 which showed that higher dye removal is achieved with catalysts with low band gap and hence compliments the highlights/findings of Jinghong Li and Jin Z. Zhang [50]. This further demonstrated that alteration of calcination holding time results in band gap tailoring which, in turn, affects photo catalytic activity of the nano materials.
On the other hand, the highest photo catalytic decolouration of O.II 97% in Figure 8b achieved with S0 after 150 min of illumination under solar light may be due to the inhibition of C–N–TiO2 active sites by Ti–C as revealed by XPS. This consequently may have decelerated the activity of the C–N–TiO2 catalysts upon increased pyrolysis holding time compared to TiO2 Degussa.
Figure 8b shows that the sol-gel synthesised C–N–TiO2 nano composites were also active under UV light, with S1 showing an improved activity of 79% followed by 41% or 27% achieved after 150 min of UV exposure with S2 and S3, respectively. This was attributed to a retarded electron recombination rate that resulted from the microstates created via incorporation of C and N in TiO2 bulk [51]. However, the overall removal rates under UV light were less than those achieved with solar light, probably because the UV lamp (UV-C) used in this study had low power (18 W) and, hence, reduced intensity.
On the other hand, lower removal percentages of O.II dye achieved with high band gap catalysts could be assigned to poor promotion of excited electrons from the valence band (VB) to the conductive band (CB) and a rapid electron–hole pair recombination rate of the semi-conductor which, in return, retarded the oxidation and reduction reactions occurring on VB and CB energy levels [52]. Indeed, the oxidation of water molecules by the empty holes on the VB and the reduction of oxygen molecules by highly energised electron on the CB thus contributed to the production of non-selective hydroxyl radicals (OH·) that unselectively destroyed the pollutant [15].
Thus, higher band gaps of 3.2, 3.17 and 3.10 limited the production of OH· and co-produced oxidants under UV light; and thus, low degradation percentages of O.II dye. The correlation of C–N–TiO2 activity and other properties previously discussed shows that the granular C–N–TiO2 nano composites with particle size of 5.5 nm and a band gap of 2.6 eV achieved 79% removal of O.II dye in their mainly anatase phase and is in conformity with Palanivelu and Sun Im [16]. While lower percentage removals of O.II were reached with C–N–TiO2 with higher particle sizes 6.3 and 6.4 nm and band gap (3.10 and 3.17 eV).
Consequently, the amount of carbon residue, coupled with the crystal structure, the shape, and the size of nanomaterial have an impact on their photocatalytic activity mainly through band-gap engineering and reducing electron–hole pair recombination rate [53,54,55,56].

3. Discussion

Semiconductors such as TiO2 are characterised by a valence band (VB) and a conductive band (CB). The VB is governed by positively charged holes while the CB is populated by negative charge carriers (electrons). The introduction of impurities such as C and N into the Ti lattice led to the formation of new sub energy levels mostly in the VB lattice that consequently reduced the band gap of the newly prepared C–N–TiO2 nano catalyst according to the intrinsic and extrinsic Fermi-Dirac distribution principal in p-type semiconductors reported by Shriver and Atkins, [57].
Initially after pyrolysis of C–N–TiO2 sol-gel for 105 min (S1) at the applied conditions, the prepared C–N–TiO2 had a band gap of 2.6 eV. The thermally excited electrons within VB of the S1 nano catalyst created holes (h+) in the latter while the remaining electrons were mobile and stored in the acceptor gap. The trapping of thermally excited electrons of VB in the acceptor gap led not only to the upward enlargement/stretching of the C–N–TiO2 VB, but prevented the relaxation of the free electrons to their empty holes within the VB. This, therefore, resulted in the shrinking of the C–N–TiO2 band gap to 2.67 eV corresponding to a wavelength of 462 nm characteristic of the visible region that was lower than the 3.2 eV band gap of commercial TiO2 Degussa reported by Carp et al. [45] and Gilmour and Ray [47].
On the other hand, the increase of pyrolysis holding time to 120 min or 135 min accelerated the evaporation of C and N which consequently resulted in the relaxation of trapped electrons and hence to the decrease of the acceptor gap and the reduction of C–N–TiO2 VB that subsequently caused a slight increase of the C–N–TiO2 band gap to 3.1 and 3.17 eV, respectively to 393 nm and 333 nm characteristics of the UV range (Schematically shown in Figure 9).
These findings are in accordance with Shriver and Atkins, [57] and Mu et al. [58] who claimed that decreasing concentration of impurities may result in band gap increase with high energy that may reduce the photocatalytic activity of the nano catalyst. Their statement is in conformity with the TEM-EDS percentage abundance of C and N disclosed in Table 3 that decreased from 72 to 40% and from 7.1 to 3.63%, respectively when the pyrolysis holding time was increased from 105 to 135 min, correspondingly.
This was further supported by the functional groups such as C=O, N=O, etc. depicted by FIIR in Table 2 and the mass loss% dictated by TGA in Figure 2. Furthermore, the SAED data in Figure 6 showed that the synthesised C–N–TiO2 catalysts have dominant anatase and minimal rutile phases present in the crystal structure that were earlier confirmed by XRD and Raman analysis in Figure 1. The decrease in carbon and nitrogen content was probably due to the diffusion of C and N toward the surface of the nanocomposites which later formed gases or volatile degradation by-products as PAN decomposed during the pyrolysis process according to Darányi Mária et al. [33]. A few authors [59,60] suggested that the relaxation and evaporation of non-metals such as C and N in TiO2 lattice similarly observed in the current study could be prevented or minimized by extended co-doping of the C–N–TiO2 with transition metals, such as nobidium (Nb) and Thallium (Ta), to achieve stable co-dope TiO2 based catalysts with reduced energy gap, improved optical absorption and enhanced carrier mobility.
Thus, altering the pyrolysis holding time allows control of the amount of C and N around and in the TiO2 lattice framework. This resulted not only in band gap tailoring but also may have retarded the relaxation of the free electrons stored in the acceptor gap to their empty holes created within the VB of C–N–TiO2 lattice [31,32]. It is worthwhile to mention that these electron motions occurred in microstates within the valence band of the C–N–TiO2 catalysts when pyrolysis holding time was being tuned before photo catalytic applications and hence justifies the changes in catalysts band gap observed in Figure 7b and Figure 9. In order to test (the exclusion of) this hypothesis further, photocatalytic experiments were conducted under solar and UV light, which showed the effect of charge recombination rates between VB and CB of the catalysts (Figure 10) rather than band gap tailoring.
Furthermore, despites the various motivations highlighted above, it could still be stated that the reason behind the reduction of the band gap is unclear; C and N may have entered the crystal structure and acted as dopants, i.e., replacing partially O2− or Ti4+. However, this would imply one or more mechanisms for charge balancing, in order to maintain the overall neutral charge of the compound. The charge is not altered if C4+ partially replaces Ti4+ but the nature of the N substitution is less straightforward. If N enters the structure as anion, N3−, then it would partially replace the O2− anion causing a charge imbalance. Potentially, the charge compensation mechanism to re-balance this excess of negative charge could be the formation of anion vacancies. It would be these anion vacancies that form the acceptor additional bands to which the shrinking of the band gap could be attributed, due to the presence of Ti3+ for charge balancing. This hypothesis was verified by XPS analysis that confirmed the presence of Ti3+ deriving mostly from the reduction of Ti4+. Alternatively, the C and N species only form functional groups on the surface of the nanoparticles as a consequence of C and N diffusion during pyrolysis of PAN, perhaps replacing oxide anions to form bonding systems, such as Ti–C and Ti–N, and causing, again, anion vacancies, which influenced the band gap. This scenario is more in agreement with the FTIR and XPS results. Furthermore, the relatively low temperature at which the pyrolysis process was carried out is not conducive to cation or even anion substitution in a stable compound such as TiO2.
The fact that C–N–TiO2 nano composites were active under both solar and UV light at a reduced band gap suggested that the electron–hole pair’s recombination rate was slowed down as described in Figure 10. This might have contributed to a significant storage of electrons in the conduction band (CB) and creation of more vacant holes in the valence band (VB) and consequently increased the concentration of OH· and related species that decolourised the polluted water [61]. Therefore, the retarded electron–hole recombination process was the driving force behind the improved O.II degradation.
Indeed, during the photocatalytic irradiation process, the electrons stored in the CB, were largely involved in reduction of O2 to superoxide anions producing free radicals OH· and related oxidants that effectively attacked O.II pollutant [62]. On the other hand, the oxidation of H2O/OH acid-base conjugate system by the positive empty holes on the VB contributed to boosting the amount of OH· in the contaminated water and quickly induced the fading of O.II dye [54,55].
Apart from excitation intensities, electrical potential and electrolyte composition aspects that Haque et al. [63] claimed to affect the electron–hole pairs (e–h) recombination process, the deceleration of electron–hole recombination rate of C–N–TiO2 synthesised in this investigation was certainly due to transitions such as the Shockley-Read-Hall Model (SRH model) recombination (R2) and the Auger recombination (R3). These mechanisms might have retarded the principal band to band recombination process (R1) that consequently led to the proliferation of charge carriers (electrons and positive empty holes) in the CB and VB, respectively [52]. These consequently empowered the generation of a significant number of free radicals in the polluted water and hence enhanced the decolouration of O.II dye.
Moreover, the slowing of (e–h) recombination rate could also be ascribed to the intrinsic electron transitions (λ1 and λ2) occurring when accumulated electrons preferentially migrated from the CB to the nearest vacant p orbitals of C and N dopants fused in TiO2 matrix [64] as shown in Figure 10. In this regard, λ1 and λ2 decelerated the completion of band to band (λ3) transition in the VB, resulting in the generation of more charge carriers and hence increased the concentration of free active species from the oxidation and reduction processes occurring in both VB and CB bands, respectively. This consequently advanced the oxidative removal of O.II dye.
Thus, the high photo catalytic removal of O.II achieved with S1 under solar and UV-light, demonstrated that C–N–TiO2 nano catalysts had a high electron storing capacity and a reduced/low recombination rate. The outcomes of this work showed that combining TiO2 with high amounts of non-metal C and N residues through pyrolysis of PAN and NH4NO3 resulted in a highly active catalyst with a reduced band gap 2.67 eV and a low electron–hole pair recombination rate that can be used under solar and artificial (UV) light [21,22].
In this process, while PAN as the source of carbon and nitrogen was reported to decompose to various monomers and other species such as HCN, NH3, H2O and CO2 [29]; NH4NO3, on the other hand, likely decomposed to nitrous oxides [30,65] that were evident from the FTIR results.
The systematic alteration of pyrolysis holding time allowed control of the amount of C and N upon and around TiO2 and resulted in the fabrication of carbon- and nitrogen-rich catalysts with a tuneable band gap and low electron–hole pair recombination rate and tuneable band gap that can be used under both solar and UV light. So, the exposure of the as-prepared C–N–TiO2 nano catalysts under solar light boosted the decolouration of the textile dye much more rapidly than in UV light as shown in Figure 8. In this regard, we believe that various aspects including solar and UV light intensity/power need to be considered in photo catalysis experiments. Another aspect impeding the activity of C–N–TiO2 nano composites was the appearance of titanium carbides (Ti–C) on the surface of the catalysts as a result of C diffusion from the bulk to the surface of the catalyst during pyrolysis of PAN when increasing calcination time from 105, 120 to 135 min.
Moreover, the treatment time of 150 min could have been short/limited to reach completion of catalytic activity. This could also be observed from Figure 8a–c in which extrapolation of O.II degradation graphs to about two more hours could reach its complete decolouration. This could be considered as future task of this study.
Since we proved that the sol-gel/pyrolysis synthesised nano composites were active under both solar and UV light, this hence demonstrates its application in various areas of environmental remediation such as water and wastewater purification and solar cell technologies.
Furthermore, for any advanced oxidation system producing UV-light, such as the dielectric barrier discharge system [20,66,67,68,69,70], the synthesised C–N–TiO2 is best used to improve the efficiency of the generated UV light towards the decolouration of organic dye contaminants. The sol-gel synthesis route proposed in this work can be used as a rapid and effective technique for the fabrication of C–N–TiO2 nano-catalyst with controlled band gap and low recombination rate of electron–hole pairs for photocatalytic applications in both UV and visible light.

4. Materials and Methods

A magnetic stirrer Hei-Mix S-UK 230 V / 50 Hz with UK plug (purchased from Laboratory Equipment South Africa, Athlone, Cape Town, 7760, South Africa) was used during sol-gel mixing, ceramic crucibles, an 805 cm furnace tube made in quartz connected to a nitrogen gas inlet set at 100 mL/min were used to pyrolyse in N2 the C–N–TiO2-doped photo catalyst. The illumination sources were stimulated solar light (AM 1.5 radiation, 100 mW/cm2) obtained from a solar simulator (Sciencetech SS1.6 kW, London, ON, Canada) for photo degradation. A LUX meter (ISO-TECH ISM 410) was used to determine the location that achieved the required light intensity, and a UV lamp (Mega-Ray 160 W/240 V MR160 SPL11/14 from Kimix, Airport Industria, Cape Town, South Africa) and the photo catalytic setup shown in Figure 1 were used to perform the photo catalysis experiments elaborated in this study. The chemicals used were polyacrylonitrile (PAN) powder (99.5%, Good fellow Cambridge Ltd., Cambridge, UK); titanium tetrachloride (MW 189.68 g/mol, Sigma–Aldrich, Cape Town, South Africa); titanium (IV) oxide (powder), Degussa (99.5%, Sigma–Aldrich); N,N-dimethyl formamide (DMF) 99%, Industrial Analytical (Pty), Cape Town South Africa); ammonium nitrate, ACS (95%, Industrial Analytical (Pty), Cape Town South Africa); sulfuric acid (98%, Kimix Airport Industria, Cape Town, South Africa ); sodium hydroxide flakes CP (97%, Kimix RSA) and orange II sodium salt (85%, Sigma–Aldrich, Cape Town, South Africa) were used for the synthesis of carbon–nitrogen co-doped catalysts (C–N–TiO2) and applied in the photocatalytic degradation of orange II dye under UV illumination.

4.1. Preparation of 5% Ammonium Nitrate Solution

Approximately 5 g of 95% granular NH4NO3 was weighed and dissolved in a 100 mL volumetric flask and made up to the mark with distilled water. The prepared 5% NH4NO3 was stored for further experiments.

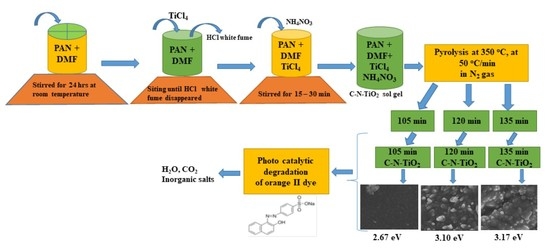
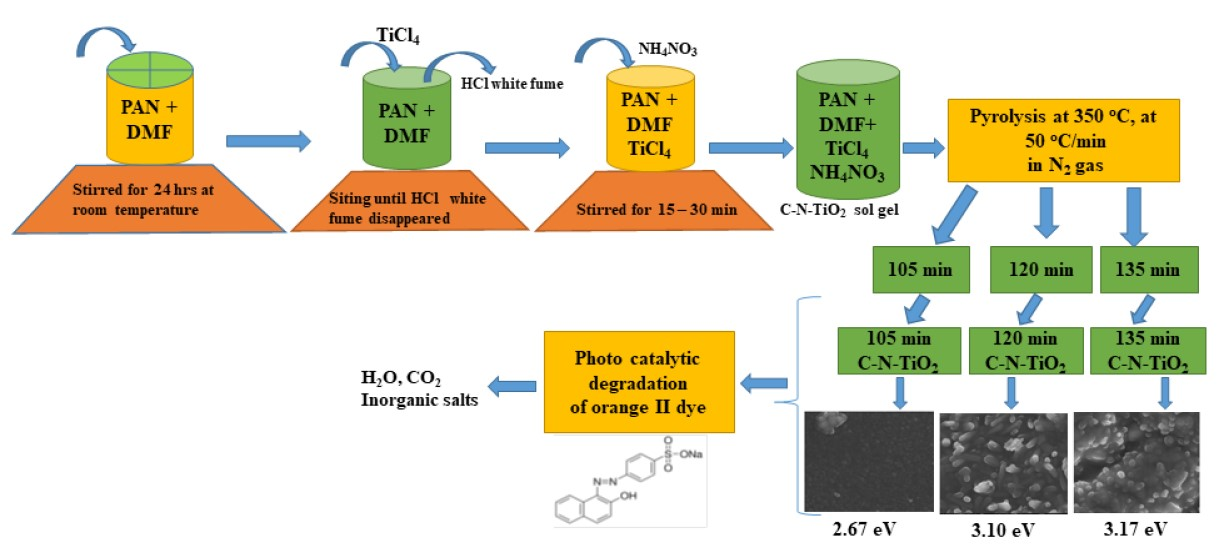
4.2. Preparation of C–N–TiO2 Sol-Gel and Pyrolysis Protocol

Eight grams of PAN powder were weighed and mixed with 100 mL of 99% DMF in a 200 mL capped borosilicate glass bottle and stirred for 24 h at room temperature to dissolve it. Approximately 3 mL of 98% concentrated TiCl4 was added dropwise into the prepared 8% PAN/DMF mixture and stirred in a fume hood until the white HCl fumes disappeared from the resultant sol-gel. Moreover, 3 mL of 5% NH4NO3 was added dropwise into the C–TiO2 sol-gel obtained and stirred for 15 to 30 min until the colour of the mixture slightly changed from brownish to yellow–brownish. Ceramic sample holders cleaned with acetone and ethanol, followed by distilled water, were dried in an oven at 25 °C for 15 min and cooled. Thereafter, 5 to 10 mL of the prepared C–N–TiO2 gel was introduced into the washed sample holders and heated in a furnace using a ramping rate of 50 °C/min under a nitrogen gas flow of 20 mL/min and annealed for different pyrolysis holding times of 105 min, 120 min or 135 min at 350 °C, respectively, according to methods developed by Totito [71]. The prepared catalysts were ground in a mortar and pestle until a fine powder was obtained which was used for characterisation and photo catalytic applications.
In the following the samples were noted as: S0—TiO2 Degussa; S1—C–N–TiO2 105 min; S2—C–N–TiO2 120 min and S3—C–N–TiO2 135 min.

4.3. Characterisation of Powdered C–N–TiO2 Photo Catalyst

Various techniques were used for the characterisation of powder C–N–TiO2 nano catalysts. The phase composition of the samples (C–N–TiO2 powder) was investigated by X-ray diffraction (XRD) using a Smart Lab diffractometer (Rigaku), with a CuKα radiation (λ = 0.15405 nm). The XRD patterns were obtained in a 2θ range of 20° to 100°, at a step size of 0.02°.
A scanning electron microscope (SEM) (FEI Nova NanoSEM 230 SEM manufactured by the FEI factory in Poland that was recently tasken over by Thermo Fisher Waltham, Waltham, MA, USA) coupled with an energy-dispersive X-ray spectrometer (EDS) was used for the surface morphology and elemental composition investigation. Images of the surface morphology for each specimen were recorded at both 30× and 100× magnification. The EDS was obtained using an Oxford instruments (X-Max 20 mm2 detector, using Oxford INCA software manufactured by Oxford Instruments, Oxford, UK). The identification of carbon, nitrogen and titanium distribution in the C–N–TiO2 samples and mapping elemental images was acquired in different areas of the sample surface.
The thermal gravimetric (TGA) was used to evaluate the mass loss percentage of the synthesised co-doped C–N–TiO2 catalysts; hence showing the effect of pyrolysis and degradation of the carbon source (PAN) using a PerkinElmer Thermo gravimetric analyser TGA 4000 (purchased from PerkinElmer, Inc. 940 Winter Street Waltham, MA 02451, USA).
The analysis was performed in the temperature range of 0 to 850 °C in N2 gas. After 2 h, the results obtained were collected from the PC and plotted using excel software. The graphs of weight (mg)/weight percentage versus temperature (°C) were obtained.
The various vibration bands of different functional groups were identified by Fourier transform infrared spectroscopy (FTIR) using a Perkin Elmer spectrum 100 FTIR spectrometer set in the range of 4000–380 cm−1. After the desired background was measured, the baseline was corrected and the spectra were smoothened.
Electron energy-loss spectroscopy (EELS) and X-ray photoluminescence spectroscopy (XPS) analysis were carried out to verify the chemical states/bonding and surface composition of C–N–TiO2 nano materials after pyrolysis.
X-ray photoelectron spectroscopy (XPS) spectra were carried out using multiprobe photoelectron spectroscopy (Omicron Nanotechnology, Taunusstein, Germany). A monochromatic Al Kα radiation (hν = 1486.6 eV) of source voltage 15 kV and an emission current of 20 mA was employed for measurement. All scans were done at a base pressure of ~2 × 10⁻⁸ Pa. The composition of the sample was extracted from the wide scan (survey scan), while the individual element peaks (high resolution scan) were recorded at a constant analyser transmission energy of 20 eV. As charging effects are unavoidable in an XPS study of non-conducting samples, charge compensation was performed by flooding of electron from neutralizer electron gun. The obtained XPS spectra were deconvoluted to individual components using Gaussian Lorentzian function in Casa XPS software (Casa Software Ltd., Terrace Teignmouth, TQ148NE, UK). The binding energies were calibrated with respect to adventitious hydrocarbon C 1s feature at 284.6 eV.
In these processes, Degussa TiO2 powder was used as control and for comparison purposes.
The band gap of the catalysts was calculated using the Equations (2)–(5) from Kubelka–Munk theory.
A = log ( 1 R )
K = ( 1 R ) 2 2   R
E ( e V ) = h υ λ
υ = c λ
where A is the absorbance of the sample converted to scattering coefficient (diffusion reflectance) (R); K is the adsorption coefficient, h = 6.626 × 10⁻³⁴ m3·kg/s Planck’s constant, c = 2.997 × 10⁸ m/s the speed of light and λ (nm) the wavelength at the corresponding sample absorbance.
The TEM micrographs were imaged using a Tecnai G squared 20 (Tecnai G220) field-emission TEM operated at 200 kV in bright-field mode, whereas all EDS data analysed during TEM studies were collected with a EDAX liquid nitrogen cooled lithium doped silicon detector. All EELS spectra were recorded with a Gatan GIF-2001 energy filter attached to the Tecnai G220 TEM; each spectrum was collected over 20 to 50 frames, each timed at 5 ms to limit electron beam radiation damage. In addition, to remove plural electron scattering and contribution from low energy plasmons, each spectrum was deconvoluted with the standard Log–Fourier iterative process (build into the Gatan Digital Micrograph Suite) and background subtracted using a power law function. Selected area electron diffraction (SAED) patterns of small clusters of nano-catalysts were collected using a 1 µm diameter selected area aperture in parallel beam mode.

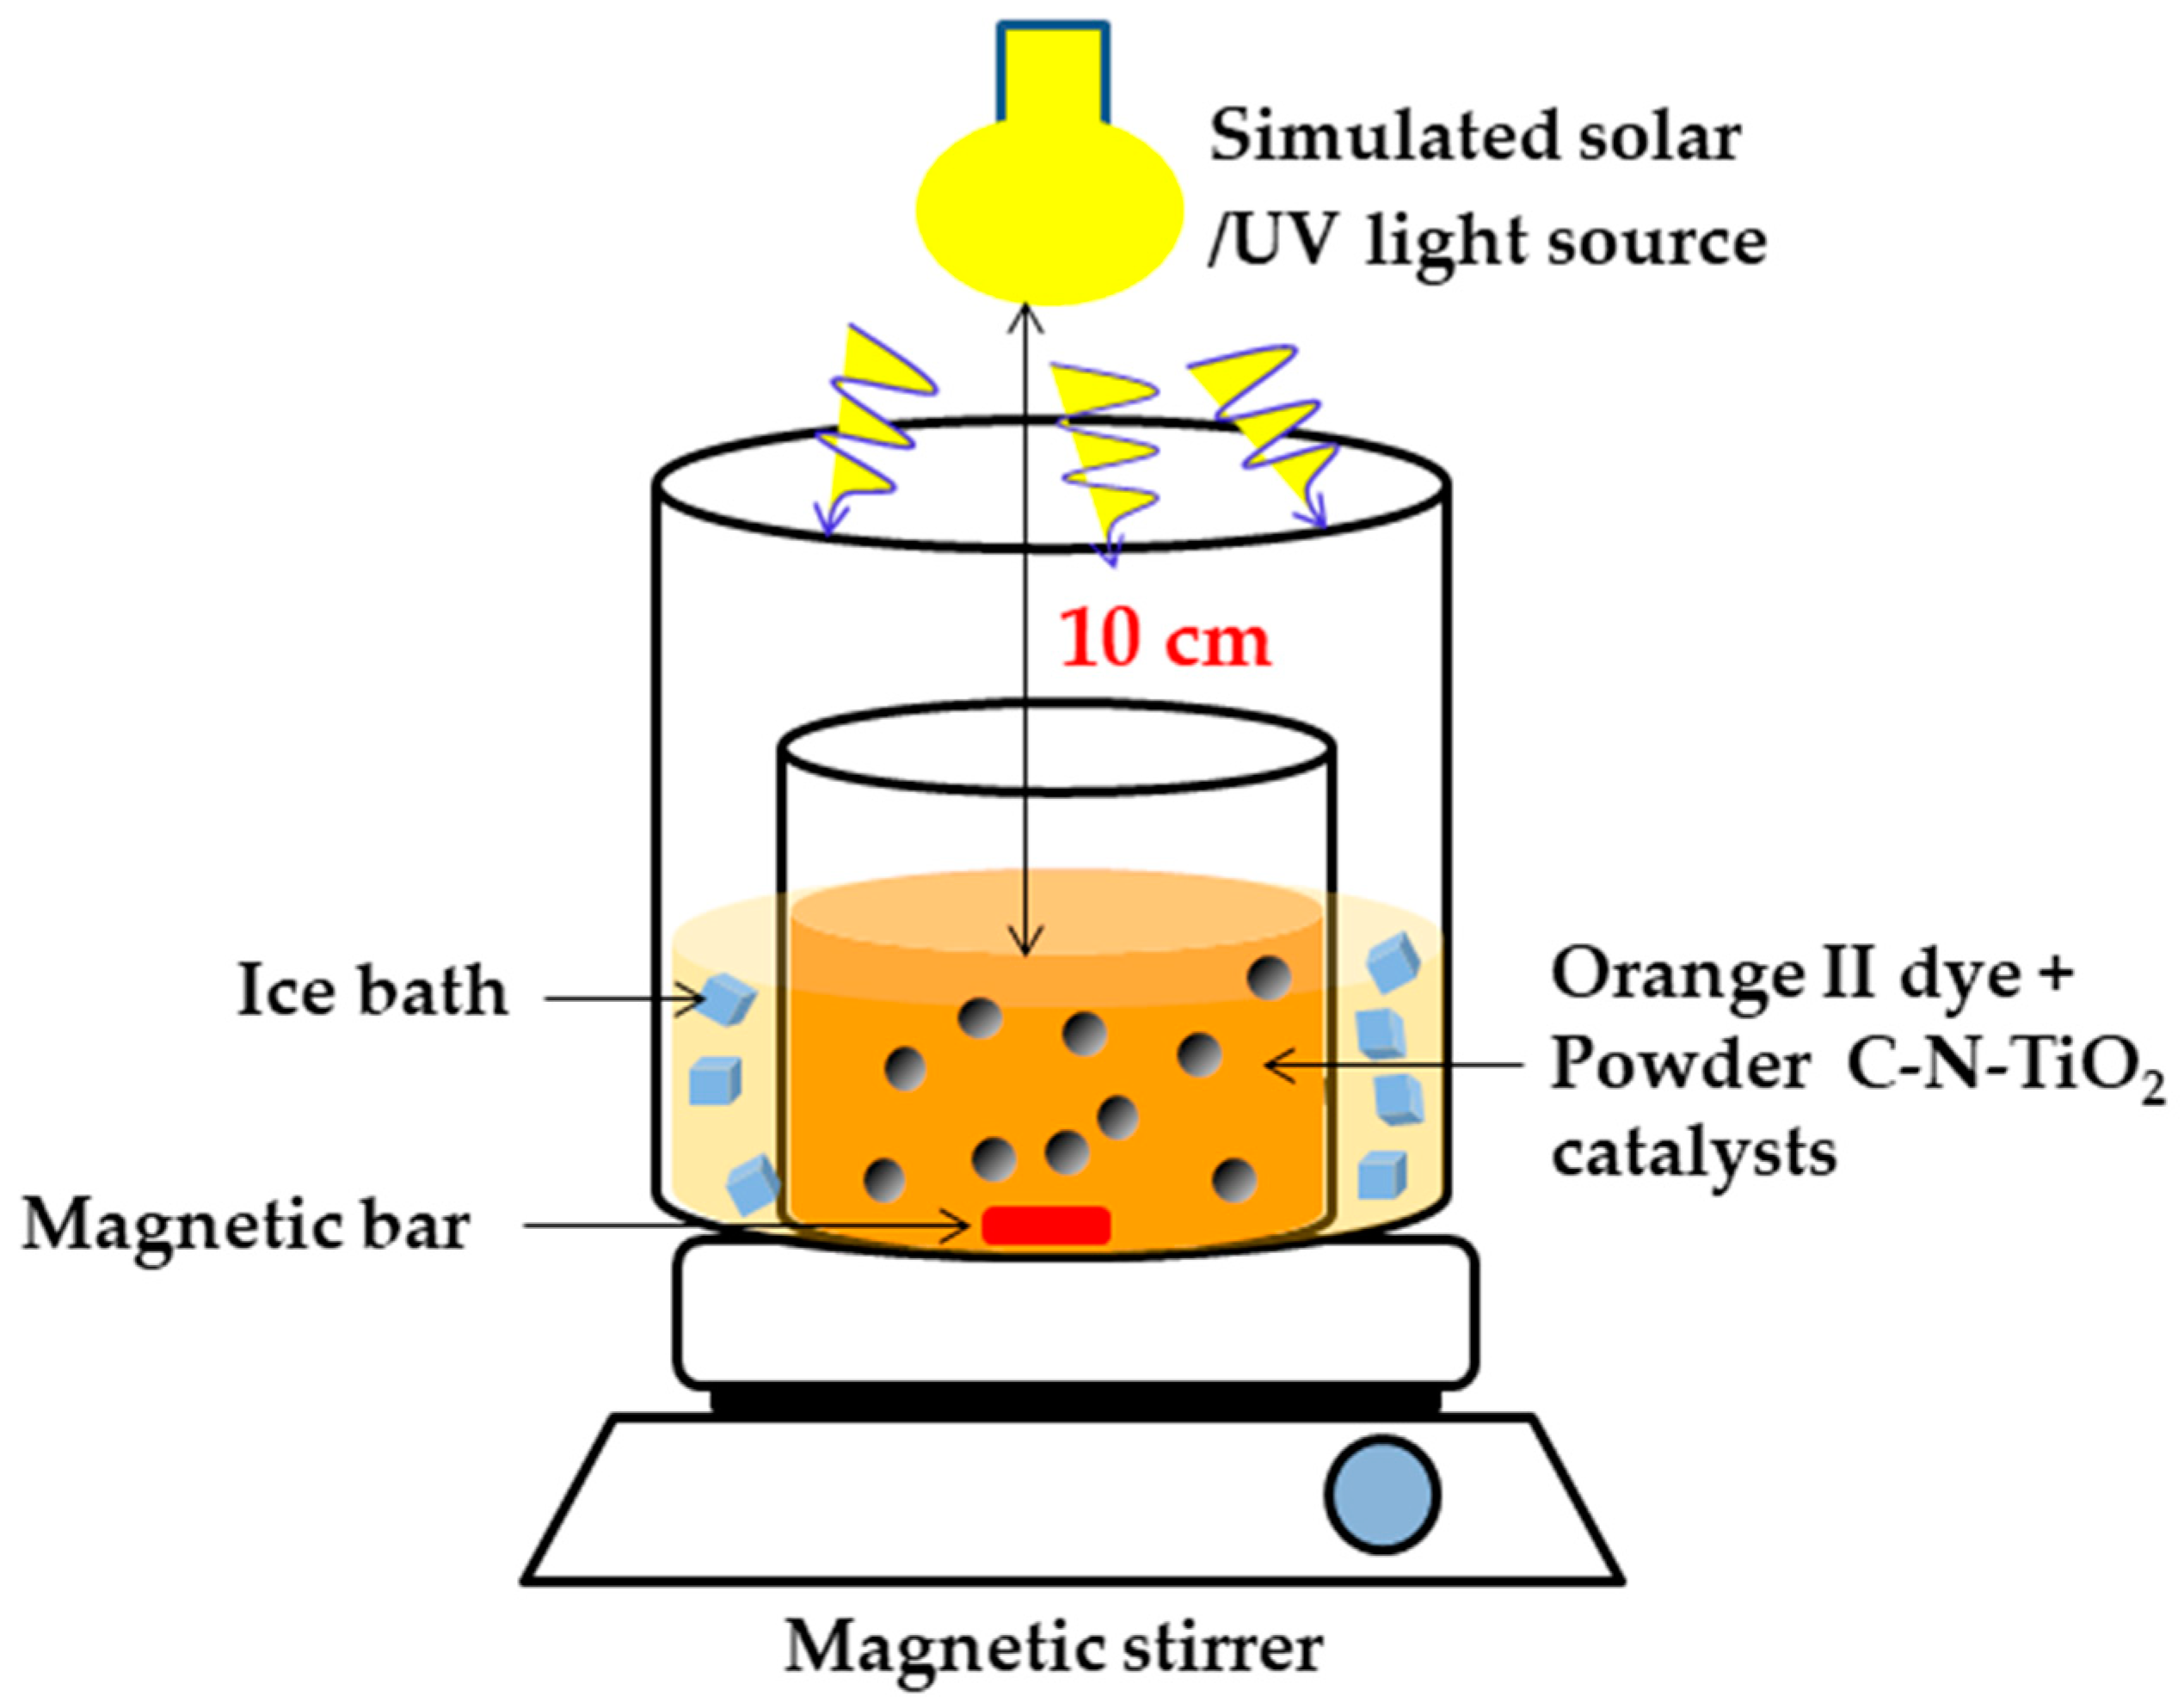
4.4. Photo Catalytic Irradiation of Orange II Dye

The activity of the photo catalysts pyrolysed at 350 °C for 105 min (S1), 120 min (S2) or 135 min (S3) was evaluated and compared with Degussa P25 using the photo catalysis procedure described in Figure 11.
Approximately, 500 mL of 5 mg/L orange II solution at pH 2.5 was introduced in a 1000 mL vessel in which 0.08 g of ground powder S1, S2 and S3 catalysts were added. The pH of 2.5 was chosen based on previous research outcomes supporting that azo dyes degrade well in acidic medium [72,73,74].
The vessel was placed in a photocatalytic system around which ice was packed to maintain consistent low temperature. This vessel was positioned on a magnetic stirrer. While stirring at 200 revolutions per minute (rpm), orange II dye solution was irradiated for 150 min with solar or UV light positioned at 10 cm above the 400 mL dye solution in the vessel. The solution was sampled every 30 min, and the samples were analysed using a GBC UV/VIS 920 spectrometer in the range of 200 to 800 nm. The quartz Suprasil cuvettes and deionised water were utilised to define the absorbance of O.II samples recorded at 284 nm.
The unknown concentrations of orange II solution were determined using the linear trend y = 0.069x obtained from standard concentrations of O.II versus absorbance, which was further used to calculate the degradation efficiency D of orange II dye using Equation (6). The synthesised catalyst was used under solar or UV light to validate the efficiency of the photo catalyst under both solar or UV light as in the AOPs reported by Tijani et al. [49].
D   ( % ) = [ A o A t A o ] × 100
where Ao represents orange II initial absorbance and At, the absorbance of the dye at time t.

5. Conclusions

A C and N co-doped TiO2 photo catalyst was prepared via sol-gel and pyrolysis method and found to be highly active in visible and UV light. Then the influence of pyrolysis holding times on its physicochemical properties and catalytic performance was investigated in detail. The C–N–TiO2 was pyrolysed using a ramping rate of 50 °C/min and held at 350 °C for different times of 105, 120 and 135 min. This study showed for the first time that pyrolysis holding time has an effect on carbon, nitrogen and TiO2 content as well as the band gap, shape and particle size and, thus, upon the photocatalytic activity of the prepared photo catalysts.
Carbon and nitrogen residues were present in substantial quantities upon the TiO2 matrix. When increasing pyrolysis time beyond 105 min, the C and N content was reduced through thermal evaporation of gases and their benefit was lost, as seen by the photocatalytic activity which decreased. Changes in C/N content were evidenced by FTIR and EDS results as well as by TGA and XPS. The C–N–TiO2 band gap estimated at 2.67 eV after 105 min pyrolysis increased to 3.10 and 3.17 eV when pyrolysis time increased to 120 or 135 min, respectively.
The synthesised C–N–TiO2 nano-photo catalysts pyrolysed for 105 min showed excellent photocatalytic activity when solar or UV irradiation was applied as a consequence of reduced band gap or electron–hole pair recombination rate, respectively. Hence this fabricated C–N–TiO2 can be used under solar light or in any system generating UV light to enhance the production of free radicals and hence improve the degradation of organic pollutants.

Author Contributions

E.S.M.M., M.D., O.O.F., A.C.P., A.V., M.B. and L.F.P. planned the research and synthesised/developed the nano catalysts, F.C., M.T.Z.M., H.H.K., M.A. and E.S.M.M. performed the characterisation of the powder C–N–TiO2 nano catalysts; E.S.M.M., M.T.Z.M., H.H.K., M.A.-A., S.D. and L.F.P. conducted the Raman, XPS and tested the activity of the catalysts upon decolouration of O.II dye under solar and UV irradiations; E.S.M.M., L.F.P., M.G.F., S.P., A.D.C., A.A., M.D. and M.B. examined the data and provided positive input in data interpretation and supervised the work. E.S.M.M., M.D., O.O.F., A.C.P., A.V., M.B. and L.F.P. wrote the first draft of the manuscript; the work was reviewed and approved by all authors before submission to the journal. All authors have read and agreed to the published version of the manuscript

Funding

The authors are grateful for the financial support from NRF UID104018 and UEFSISCDI-Romania 14BM/14.07.2016 and Oman/RSA Cooperation Programme (project reference no. UID: 111007).

Acknowledgments

The authors also thank all funders, the Water Research Commission SA, and the NRF South Africa. M.D., A.C.P., A.V. and M.B. acknowledge the support of the Romanian Ministry of Research and Innovation through the Core Program, Project no. 18N/2019. A.A., S.P. and A.D. gratefully acknowledge funding from European Union’s Horizon 2020 Research Innovation Program under grant agreement GrapheneCore3 and Spearhead Project 5 GRAPES SGA 881603. ADC gratefully acknowledges the financial support from the Ministry of Education and Science of the Russian Federation in the framework of Increase Competitiveness Program of NUST MISIS (No K2-2019-13). Our extended thanks go to Mrs Miranda Walddron at the University of Cape Town for her assistance and guidance in SEM and EDS analysis.

Conflicts of Interest

The authors declare no conflict of interest for publishing this work.

Future Prospects

As future prospects, the catalysts synthesised in this study could be used in DBD plasma systems to make use of the UV light generated and, hence, enhance the detoxification of the targeted pollutants.

References

  1. Kümmerer, K. The presence of pharmaceuticals in the environment due to human use–present knowledge and future challenges. J. Environ. Manag. 2009, 90, 2354–2366. [Google Scholar] [CrossRef] [PubMed]
  2. Esplugas, S.; Bila, D.M.; Krause, L.G.T.; Dezotti, M. Ozonation and advanced oxidation technologies to remove endocrine disrupting chemicals (EDCs) and pharmaceuticals and personal care products (PPCPs) in water effluents. J. Hazard. Mater. 2007, 149, 631–642. [Google Scholar] [CrossRef] [PubMed]
  3. Sirés, I.; Brillas, E.; Sadornil, I.S. Remediation of water pollution caused by pharmaceutical residues based on electrochemical separation and degradation technologies: A review. Environ. Int. 2012, 40, 212–229. [Google Scholar] [CrossRef] [PubMed]
  4. Feng, Y.; Song, Q.; Lv, W.; Liu, G. Degradation of ketoprofen by sulfate radical-based advanced oxidation processes: Kinetics, mechanisms, and effects of natural water matrices. Chemosphere 2017, 189, 643–651. [Google Scholar] [CrossRef] [PubMed]
  5. Huang, W.; Bianco, A.; Brigante, M.; Mailhot, G. UVA-UVB activation of hydrogen peroxide and persulfate for advanced oxidation processes: Efficiency, mechanism and effect of various water constituents. J. Hazard. Mater. 2018, 347, 279–287. [Google Scholar] [CrossRef] [PubMed]
  6. Chen, C.; Feng, H.; Deng, Y. Re-evaluation of sulfate radical based–advanced oxidation processes (SR-AOPs) for treatment of raw municipal landfill leachate. Water Res. 2019, 153, 100–107. [Google Scholar] [CrossRef] [PubMed]
  7. Klavarioti, M.; Mantzavinos, D.; Fatta-Kassinos, D. Removal of residual pharmaceuticals from aqueous systems by advanced oxidation processes. Environ. Int. 2009, 35, 402–417. [Google Scholar] [CrossRef] [PubMed]
  8. Klamerth, N.; Rizzo, L.; Malato, S.; Maldonado, M.I.; Agüera, A.; Fernández-Alba, A.R. Degradation of fifteen emerging contaminants at microg l(-1) initial concentrations by mild solar photo-Fenton in MWTP effluents. Water Res. 2010, 44, 545–554. [Google Scholar] [CrossRef]
  9. Zhao, F.; Liu, Y.; Hammouda, S.B.; Doshi, B.; Guijarro, N.; Min, X.; Tang C-Jian Sillanpaa, M.; Sivula, K.; Wang, S. MIL-101(Fe)/g-C3N4 for enhanced visible-light-driven photocatalysis toward simultaneous reduction of Cr (VI) and oxidation of bisphenol A in aqueous media. Appl. Catal. B Environ. 2020, 272, 119033. [Google Scholar] [CrossRef]
  10. Alemany, L.; Bañares, M.A.; Pardo, E.; Jiménez, F.D.P.M.; Blasco, J. Morphological and Structural Characterization of a Titanium Dioxide System. Mater. Charact. 2000, 44, 271–275. [Google Scholar] [CrossRef]
  11. Khan, M.; Bhatti, K.; Qindeel, R.; Alonizan, N.; Althobaiti, H.S. Characterizations of multilayer ZnO thin films deposited by sol-gel spin coating technique. Results Phys. 2017, 7, 651–655. [Google Scholar] [CrossRef]
  12. Cheng, X.; Yu, X.; Xing, Z.; Wan, J. Enhanced Photocatalytic Activity of Nitrogen Doped TiO2 Anatase Nano-Particle under Simulated Sunlight Irradiation. Energy Procedia 2012, 16, 598–605. [Google Scholar] [CrossRef] [Green Version]
  13. Sambandam, B.; Surenjan, A.; Philip, L.; Pradeep, T. Rapid Synthesis of C-TiO2: Tuning the Shape from Spherical to Rice Grain Morphology for Visible Light Photocatalytic Application. ACS Sustain. Chem. Eng. 2015, 3, 1321–1329. [Google Scholar] [CrossRef]
  14. Nyamukamba, P.; Tichagwa, L.; Ngila, J.C.; Petrik, L. Plasmonic metal decorated titanium dioxide thin films for enhanced photodegradation of organic contaminants. J. Photochem. Photobiol. A Chem. 2017, 343, 85–95. [Google Scholar] [CrossRef] [Green Version]
  15. Morikawa, T.; Asahi, R.; Ohwaki, T.; Aoki, K.; Taga, Y. Band-Gap Narrowing of Titanium Dioxide by Nitrogen Doping. Jpn. J. Appl. Phys. 2001, 40, L561–L563. [Google Scholar] [CrossRef]
  16. Palanivelu, K.; Im, J.S.; Lee, Y.-S. Carbon Doping of TiO2 for Visible Light Photo Catalysis—A review. Carbon Lett. 2007, 8, 214–224. [Google Scholar] [CrossRef] [Green Version]
  17. Kanade, K.; Kale, B.; Baeg, J.-O.; Lee, S.M.; Lee, C.W.; Moon, S.-J.; Chang, H. Self-assembled aligned Cu doped ZnO nanoparticles for photocatalytic hydrogen production under visible light irradiation. Mater. Chem. Phys. 2007, 102, 98–104. [Google Scholar] [CrossRef]
  18. Wang, J.; Huang, B.; Wang, Z.; Qin, X.; Zhang, X. Synthesis and characterization of C, N-codoped TiO2 nanotubes/nanorods with visible-light activity. Rare Met. 2011, 30, 161–165. [Google Scholar] [CrossRef]
  19. Cheng, X.; Yu, X.; Xing, Z.; Yang, L. Synthesis and characterization of N-doped TiO2 and its enhanced visible-light photocatalytic activity. Arab. J. Chem. 2016, 9 (Suppl. 2), S1706–S1711. [Google Scholar] [CrossRef]
  20. Tijani, J.O.; Fatoba, O.O.; Totito, T.C.; Roos, W.D.; Petrik, L.F.; Info, A. Synthesis and characterization of carbon doped TiO2 photo-catalysts supported on stainless steel mesh by sol-gel method Original Articles. Carbon Lett. 2017, 22, 48–59. [Google Scholar] [CrossRef]
  21. Yu, C.; Yu, J.C.-M. A Simple Way to Prepare C–N-Codoped TiO2 Photocatalyst with Visible-Light Activity. Catal. Lett. 2009, 129, 462–470. [Google Scholar] [CrossRef]
  22. Li, F.; Zhou, J.; Du, C.; Li, W.; Wang, Y.; He, G.; He, Q. Preparation and photocatalytic properties of porous C and N co-doped TiO2 deposited on brick by a fast, one-step microwave irradiation method. J. Environ. Sci. 2017, 60, 24–32. [Google Scholar] [CrossRef]
  23. Mohamed, M.A.; Othman, M.H.D.; Zain, M.M.; Minggu, L.J.; Kassim, M.B.; Salehmin, M.N.I.; Rosmi, M.S.; Salleh, W.N.W.; Othman, M.H.D. Concurrent growth, structural and photocatalytic properties of hybridized C, N co-doped TiO2 mixed phase over g-C3N4 nanostructured. Scr. Mater. 2018, 142, 143–147. [Google Scholar] [CrossRef]
  24. Osin, O.A.; Yu, T.; Cai, X.; Jiang, Y.; Peng, G.; Cheng, X.; Li, R.; Qin, Y.; Lin, S. Photocatalytic Degradation of 4-Nitrophenol by C, N-TiO2: Degradation Efficiency vs. Embryonic Toxicity of the Resulting Compounds. Front. Chem. 2018, 6, 192. [Google Scholar] [CrossRef] [Green Version]
  25. Thamaphat, K.; Limsuwan, P.; Ngotawornchai, B. Phase Characterization of TiO2 Powder by XRD and TEM. Nat. Sci. 2008, 42, 357–361. [Google Scholar]
  26. Xie, C.; Yang, S.; Li, B.; Wang, H.; Shi, J.-W.; Li, G.; Niu, C. C-doped mesoporous anatase TiO2 comprising 10 nm crystallites. J. Colloid Interface Sci. 2016, 476, 1–8. [Google Scholar] [CrossRef]
  27. Zhang, Q. Effects of calcination on the photocatalytic properties of nanosized TiO2 powders prepared by TiCl4 hydrolysis. Appl. Catal. B Environ. 2000, 26, 207–215. [Google Scholar] [CrossRef]
  28. Geng, J.; Yang, N.; Zhu, J.; Chen, D.; Jiang, Z. Nitrogen-doped TiO2 nanotubes with enhanced photocatalytic activity synthesized by a facile wet chemistry method. Mater. Res. Bull. 2009, 44, 146–150. [Google Scholar] [CrossRef]
  29. Wu, S.; Gao, A.; Wang, Y.; Xu, L. Modification of polyacrylonitrile stabilized fibers via post-thermal treatment in nitrogen prior to carbonization and its effect on the structure of carbon fibers. J. Mater. Sci. 2018, 53, 8627–8638. [Google Scholar] [CrossRef]
  30. Cagnina, S.; Rotureau, P.; Singh, S.; Turcotte, R.; Fayet, G.; Adamo, C. Theoretical and Experimental Study of the Reaction between Ammonium Nitrate and Sodium Salts. Ind. Eng. Chem. Res. 2016, 55, 12183–12190. [Google Scholar] [CrossRef] [Green Version]
  31. Shao, G.-S.; Zhang, X.-J.; Yuan, Z.-Y. Preparation and photocatalytic activity of hierarchically mesoporous-macroporous TiO2−xNx. Appl. Catal. B Environ. 2008, 82, 208–218. [Google Scholar] [CrossRef]
  32. Sánchez-Soto, P.J.; Avilés, M.; Del Río, J.; Ginés, J.; Pascual, J.; Pérez-Rodríguez, J. Thermal study of the effect of several solvents on polymerization of acrylonitrile and their subsequent pyrolysis. J. Anal. Appl. Pyrolysis 2001, 58, 155–172. [Google Scholar] [CrossRef]
  33. Darányi, M.; Sarusi, I.; Sápi, A.; Kukovecz, Á.; Konya, Z.; Erdőhelyi, A. Characterization of carbon thin films prepared by the thermal decomposition of spin coated polyacrylonitrile layers containing metal acetates. Thin Solid Films 2011, 520, 57–63. [Google Scholar] [CrossRef]
  34. Laffont, L.; Monthioux, M.; Serin, V.; Mathur, R.; Guimon, C.; Guimon, M. An EELS study of the structural and chemical transformation of PAN polymer to solid carbon. Carbon 2004, 42, 2485–2494. [Google Scholar] [CrossRef]
  35. Huang, Y.; Ho, W.; Lee, S.-C.; Zhang, L.; Li, G.; Yu, J.C.-M. Effect of Carbon Doping on the Mesoporous Structure of Nanocrystalline Titanium Dioxide and Its Solar-Light-Driven Photocatalytic Degradation of NOx. Langmuir 2008, 24, 3510–3516. [Google Scholar] [CrossRef] [PubMed]
  36. Guo, Y.; Guo, T.; Chen, J.; Wei, J.; Bai, L.; Ye, X.; Ding, Z.; Xu, W.; Zhou, Z. Synthesis of C–N–S co-doped TiO2 mischcrystal with an isobandgap characteristic and its photocatalytic activity under visible light. Catal. Sci. Technol. 2018, 8, 4108–4121. [Google Scholar] [CrossRef]
  37. Abdullah, A.M.; Al-Thani, N.J.; Tawbi, K.; Al-Kandari, H. Carbon/nitrogen-doped TiO2: New synthesis route, characterization and application for phenol degradation. Arab. J. Chem. 2016, 9, 229–237. [Google Scholar] [CrossRef] [Green Version]
  38. Wang, M.; Han, J.; Hu, Y.; Rong, G. Mesoporous C, N-codoped TiO2 hybrid shells with enhanced visible light photocatalytic performance. RSC Adv. 2017, 7, 15513–15520. [Google Scholar] [CrossRef] [Green Version]
  39. Zhang, J.; Xing, Z.; Cui, J.; Li, Z.; Tan, S.; Yin, J.; Zou, J.; Zhu, Q.; Zhou, W. C,N co-doped porous TiO2 hollow sphere visible light photocatalysts for efficient removal of highly toxic phenolic pollutants. Dalton Trans. 2018, 47, 4877–4884. [Google Scholar] [CrossRef] [PubMed]
  40. Ghazzal, M.N.; Wojcieszak, R.; Raj, G.; Gaigneaux, E. Study of mesoporous CdS-quantum-dot-sensitized TiO2 films by using X-ray photoelectron spectroscopy and AFM. Beilstein J. Nanotechnol. 2014, 5, 68–76. [Google Scholar] [CrossRef] [PubMed] [Green Version]
  41. Jia, T.; Fu, F.; Yu, D.; Cao, J.; Sun, G. Facile synthesis and characterization of N-doped TiO2/C nanocomposites with enhanced visible-light photocatalytic performance. Appl. Surf. Sci. 2018, 430, 438–447. [Google Scholar] [CrossRef]
  42. Igathinathane, C.; Pordesimo, L.; Columbus, E.; Batchelor, W.; Methuku, S.; Cannayen, I. Shape identification and particles size distribution from basic shape parameters using ImageJ. Comput. Electron. Agric. 2008, 63, 168–182. [Google Scholar] [CrossRef]
  43. Igathinathane, C.; Pordesimo, L.; Batchelor, W.; Cannayen, I. Major orthogonal dimensions measurement of food grains by machine vision using ImageJ. Food Res. Int. 2009, 42, 76–84. [Google Scholar] [CrossRef]
  44. Chen, T.; Xia, Y.; Jia, Z.; Liu, Z.; Zhang, H. Synthesis, Characterization, and Tribological Behavior of Oleic Acid Capped Graphene Oxide. J. Nanomater. 2014, 2014, 1–8. [Google Scholar] [CrossRef]
  45. Carp, O.; Huisman, C.; Reller, A. Photoinduced reactivity of titanium dioxide. Prog. Solid State Chem. 2004, 32, 33–177. [Google Scholar] [CrossRef]
  46. Li, S.; Gong, Y.; Yang, Y.; He, C.; Hu, L.; Zhu, L.; Sun, L.; Shu, D. Recyclable CNTs/Fe3O4 magnetic nanocomposites as adsorbents to remove bisphenol A from water and their regeneration. Chem. Eng. J. 2015, 260, 231–239. [Google Scholar] [CrossRef]
  47. Gilmour, C.R.; Ray, A.; Zhu, J.; Ray, M.B. Photocatalytic Performance of Titanium Dioxide Thin Films from Polymer-Encapsulated Titania. Ind. Eng. Chem. Res. 2013, 52, 17800–17811. [Google Scholar] [CrossRef]
  48. Sakthivel, S.; Kisch, H. Daylight Photocatalysis by Carbon-Modified Titanium Dioxide. Angew. Chem. Int. Ed. 2003, 42, 4908–4911. [Google Scholar] [CrossRef] [PubMed]
  49. Tijani, J.; Mouele, M.E.S.; Fatoba, O.; O Babajide, O.; Petrik, L.F. Degradation of bisphenol-A by dielectric barrier discharge system: Influence of polyethylene glycol stabilized nano zero valent iron particles. Adv. Nat. Sci. Nanosci. Nanotechnol. 2017, 8, 035013. [Google Scholar] [CrossRef] [Green Version]
  50. Li, J.; Zhang, J.Z. Optical properties and applications of hybrid semiconductor nanomaterials. Coord. Chem. Rev. 2009, 253, 3015–3041. [Google Scholar] [CrossRef]
  51. Chen, Y.; Dionysiou, D.D. A comparative study on physicochemical properties and photocatalytic behavior of macroporous TiO2-P25 composite films and macroporous TiO2 films coated on stainless steel substrate. Appl. Catal. A Gen. 2007, 317, 129–137. [Google Scholar] [CrossRef]
  52. Wu, Y.-C.; Ju, L.-S. Annealing-free synthesis of CN co-doped TiO2 hierarchical spheres by using amine agents via microwave-assisted solvothermal method and their photocatalytic activities. J. Alloy Compd. 2014, 604, 164–170. [Google Scholar] [CrossRef]
  53. Saravanan, R.; Gupta, V.K.; Narayanan, V.; Stephen, A. Comparative study on photocatalytic activity of ZnO prepared by different methods. J. Mol. Liq. 2013, 181, 133–141. [Google Scholar] [CrossRef]
  54. Khan, M.M.; Ansari, S.A.; Pradhan, D.; Ansari, M.O.; Han, D.H.; Lee, J.; Cho, M.H. Band gap engineered TiO2 nanoparticles for visible light induced photoelectrochemical and photocatalytic studies. J. Mater. Chem. A 2014, 2, 637–644. [Google Scholar] [CrossRef]
  55. Khan, M.M.; Adil, S.F.; Al-Mayouf, A.M. Metal oxides as photocatalysts. J. Saudi Chem. Soc. 2015, 19, 462–464. [Google Scholar] [CrossRef] [Green Version]
  56. Gnanasekaran, L.; Hemamalini, R.; Ravichandran, K. Synthesis and characterization of TiO2 quantum dots for photocatalytic application. J. Saudi Chem. Soc. 2015, 19, 589–594. [Google Scholar] [CrossRef] [Green Version]
  57. Shriver, D.F.; Atkins, P.W.; Langford, C.H. Inorganic Chemistry, 2nd ed.; International Student Edition; Oxford University Press: Oxford, UK; Melbourne, Australia; Tokyo, Japan, 1994. [Google Scholar]
  58. Mu, Y.; Yu, H.-Q.; Zheng, J.-C.; Zhang, S. TiO2-mediated photocatalytic degradation of Orange II with the presence of Mn2+ in solution. J. Photochem. Photobiol. A Chem. 2004, 163, 311–316. [Google Scholar] [CrossRef]
  59. Yin, W.-J.; Tang, H.; Wei, S.-H.; Al-Jassim, M.; Turner, J.; Yan, Y. Band structure engineering of semiconductors for enhanced photo electrochemical water splitting: The case of TiO2. Phys. Rev. B 2010, 82, 045106. [Google Scholar] [CrossRef] [Green Version]
  60. Ma, X.; Wu, Y.; Lu, Y.; Xu, J.; Wang, Y.; Zhu, Y. Effect of Compensated Codoping on the Photo electrochemical Properties of Anatase TiO2 Photocatalyst. J. Phys. Chem. C 2011, 115, 16963–16969. [Google Scholar] [CrossRef]
  61. Fujishima, A.; Zhang, X.; Tryk, D. TiO2 photocatalysis and related surface phenomena. Surf. Sci. Rep. 2008, 63, 515–582. [Google Scholar] [CrossRef]
  62. Ikoma, T.; Zhang, Q.; Saito, F.; Akiyama, K.; Tero-Kubota, S.; Kato, T. Radicals in the Mechanochemical Dechlorination of Hazardous Organochlorine Compounds Using CaO Nanoparticles. Bull. Chem. Soc. Jpn. 2001, 74, 2303–2309. [Google Scholar] [CrossRef]
  63. Haque, S.A.; Tachibana, Y.; Willis, R.L.; Moser, J.-E.; Grätzel, M.; Klug, D.R.; Durrant, J.R. Parameters Influencing Charge Recombination Kinetics in Dye-Sensitized Nanocrystalline Titanium Dioxide Films. J. Phys. Chem. B 2000, 104, 538–547. [Google Scholar] [CrossRef] [Green Version]
  64. Prokes, S.; Gole, J.L.; Chen, X.; Burda, C.; Carlos, W.E. Defect-Related Optical Behavior in Surface Modified TiO2 Nanostructures. Adv. Funct. Mater. 2005, 15, 161–167. [Google Scholar] [CrossRef]
  65. MacNeil, J.H.; Berseth, P.A.; Bruner, E.L.; Perkins, T.L.; Wadia, Y.; Westwood, G.; Trogler, W.C. Mechanism of Nitrous Oxide Formation by Metal-Catalyzed Reduction of Nitric Oxide in Aqueous Solution. J. Am. Chem. Soc. 1997, 119, 1668–1675. [Google Scholar] [CrossRef]
  66. Kogelschatz, U.; Eliasson, B.; Egli, W. Dielectric-Barrier Discharges. Principle and Applications. Le J. de Phys. Colloq. 1997, 7, C4-47–C4-66. [Google Scholar] [CrossRef]
  67. Kogelschatz, U. Dielectric-Barrier Discharges: Their History, Discharge Physics, and Industrial Applications. Plasma Chem. Plasma Process. 2003, 23, 1–46. [Google Scholar] [CrossRef]
  68. Nehra, V.; Kumar, A.; Dwivedi, H.K. Atmospheric Non-Thermal Plasma Sources. Int. J. Eng. 2008, 2, 53–68. [Google Scholar]
  69. Lopez, J.L. Dielectric Barrier Discharge, Ozone Generation, and Their Applications; Complex Plasmas Summer Institute: Jersey City, NJ, USA, 2008. [Google Scholar]
  70. Valinčius, V.; Grigaitienė, V.; Tamošiūnas, A. Report on the Different Plasma Modules for Pollution Removal; Plasma for Environ Protect, Lithuanian Energy Institute: Kaunas, Lithuania, 2012; pp. 1–49. [Google Scholar]
  71. Totito, T.C. Photocatalytic Activity of Supported TiO2 Nanocrystals. Master’s Thesis, University of the Western Cape, Cape Town, South Africa, 2013. [Google Scholar]
  72. Kuang, L.; Zhao, Y.; Liu, L. Photodegradation of Orange II by mesoporous TiO2. J. Environ. Monit. 2011, 13, 2496. [Google Scholar] [CrossRef]
  73. Sayed, E.; El-Ashtoukhy, Z. Removal of Indigo Carmine Dye from Synthetic Wastewater by Electrochemical Oxidation in a New Cell with Horizontally Oriented Electrodes. Int. J. Electrochem. Sci. 2013, 8, 846–858. [Google Scholar]
  74. Mouele, E.S.M.; Dinu, M.; Parau, A.C.; Missengue, R.; Vladescu, A.; Petrik, L.F.; Braic, M. Dinu Evaluation of Photocatalysis Effect of Stainless Steel Mesh Coated with Nitrides, Oxynitrides and Transition Metals Cr and Ti on the Degradation of Orange II Dye. Proceedings 2019, 29, 14. [Google Scholar] [CrossRef] [Green Version]
Figure 1. (a) X-ray diffraction (XRD) and (b) Raman analysis of TiO2 Degussa (S0) and the synthesised C–N–TiO2 nano catalysts pyrolysed at 350 °C, a ramping rate of 50 °C/min at different holding times (105 min (S1), 120 min (S2), and 135 min (S3)) with A = anatase and R = rutile.
Catalysts 10 00847 g001
Figure 2. (a) FTIR spectra and (b) thermal gravimetric analysis (TGA) of C–N–TiO2 nano composites pyrolysed in nitrogen gas at 350 °C and held at temperature for different times 105, 120 and 135 min.
Catalysts 10 00847 g002
Figure 3. Electron energy-loss spectra of (a) carbon K edge and nitrogen K edge line profiles and (b) titanium L3,2 and oxygen K edge line profiles of the different catalysts synthesized by sol-gel method, and pyrolysed at 350 °C at 50 °C/min ramping rate for different times (S0 = Degussa TiO2; S1 = C–N–TiO2 105 min; S1 = C–N–TiO2 105 min; S2 = C–N–TiO2 120 min; S3 = C–N–TiO2 135 min).
Catalysts 10 00847 g003
Figure 4. (a) The XPS survey spectra, (b) high-resolution C 1s, (c) high-resolution N 1s and (d) high-resolution Ti 2p for C–N–TiO2 catalysts calcined at 350 °C for 105 min, 120 min and 130 min.
Catalysts 10 00847 g004
Figure 5. (ad) Scanning electron microscopy (SEM) of (a) pure Degussa and C–N–TiO2 pyrolysed at 350 °C at a ramping rate of 50 °C/min at different holding times: (b) 105 min, (c) 120 min and (d) 135 min, and energy-dispersive X-ray spectroscopy (EDS) elemental mapping (ei) of selected C–N–TiO2 pyrolysed for 105 min.
Catalysts 10 00847 g005aCatalysts 10 00847 g005b
Figure 6. Bright-field micrographs and SAED patterns of (ac) Degussa TiO2 (S0); (df) 105 min C–N–TiO2 (S1); (gi) 120 min C–N–TiO2 (S2); (jl) 135 min C–N–TiO2 (S3) pyrolysed at 350 °C at 50 °C/min ramping.
Catalysts 10 00847 g006aCatalysts 10 00847 g006bCatalysts 10 00847 g006c
Figure 7. Effect of calcination holding time (min) on band gap (a,b) and particle distribution of the Degussa TiO2 (c) compared to the synthesised C–N–TiO2 nano composites pyrolysed at 350 °C for 105 (d); 120 (e) and135 (f) minutes (S0 = with Degussa TiO2; S1 = C–N–TiO2 105 min; S2 = C–N–TiO2 120 min and S3 = C–N–TiO2 135 min).
Catalysts 10 00847 g007
Figure 8. Photocatalytic decolouration of orange II by TiO2 Degussa and C–N–TiO2 Nano composites pyrolysed at 350 °C under N2 gas using 50 °C/min ramping rate for different holding times (S0 = with Degussa TiO2; S1 = C–N–TiO2 105 min; S2 = C–N–TiO2 120 min and S3 = C–N–TiO2 135 min). (a,b) kinetics decay and decolouration efficiency of O.II dye in the dark and in solar light correspondingly. (c) and (d) kinetics decay and decolouration efficiency of O.II dye in the dark and in UV light, respectively. Experimental conditions O.II concentration 5 mg/L, volume 500 mL, pH 2.5, catalyst dosage 0.08 g and irradiation time of 150 min. The error bar was extracted from the standard error resulting from two photo catalytic measurements performed with each catalyst (n = 2).
Catalysts 10 00847 g008
Figure 9. Schematic of changes occurring during pyrolysis of C–N–TiO2 at 350 °C for different holding times 105, 120 and 135 min (S1 = C–N–TiO2 105 min; S2 = C–N–TiO2 120 min and S3 = C–N–TiO2 135 min).
Catalysts 10 00847 g009
Figure 10. Schematic of photo catalytic and recombination mechanisms for the decolouration of O.II (R1, R2 and R3 = recombination mechanisms between conduction band (CB) and valence band (VB), (λ1, λ2 and λ3 = recombination mechanisms between CB and p empty orbitals of C and N dopants).
Catalysts 10 00847 g010
Figure 11. Photo catalysis set up for the degradation of orange II dye.
Catalysts 10 00847 g011
Table 1. Summary of the average particle sizes of TiO2 Degussa and the synthesised C–N–TiO2 photo catalysts estimated from XRD analysis using the Scherer equation.
Photo CatalystsCatalyst Size (nm)
XRD (Scherrer Equation)
S021.0
S15.5
S26.3
S36.4
Table 2. Functional groups of the synthesised C–N–TiO2 nano catalysts, pyrolysed with nitrogen gas at 350 °C using a ramping rate of 50 °C/min and held at different times 105 min (S1), 120 min (S2) or 135 min (S3).
Photo Catalysts and Pyrolysis Time (Min)Absorption Bands (cm−1)Functional Groups/Stretching/Vibrations
S03800–3000, 275–1000OH stretching, Ti–O, Ti –O–Ti
S13800–3600OH/N-H stretching, etc.
1900–1800, 1800–1200–N–H, –C–C–, C–O and C–N, OH, stretching, etc.
1200–700TiO, Ti–O–Ti, N–Ti–O2, C–Ti–O, C–Ti, C–O–Ti–O, N–Ti–O, N=O, etc.
S23800–3600OH/N–H stretching, etc.
1900–1800, 1800–1200–N–H, –C–C–, C–O and C–N, OH, stretching, etc.
1200–700Ti–O, Ti–O–Ti, N–Ti–O2, C–O–Ti–O, C–Ti, N–Ti–O, N=O, etc.
S33800–3600OH/N–H stretching, etc.
1900–1800, 1800–1200–N–H, –C–C–, C–O and C–N, OH, stretch, etc.
1200–700Ti–O, Ti–O–Ti, N–Ti–O2, C–O–Ti–O, C–Ti, N–Ti–O N=O, etc.
Table 3. Weight percentage as derived TEM-energy-dispersive spectroscopy (TEM-EDS) of the synthesised nano catalysts pyrolysed at 350 °C using a 50 °C/min ramping rate and holding times of 105 min (S1), 120 min (S2) or 135 min (S3) under nitrogen.
ElementsWeight Percentage (%)
S0S1S2S3
CNA±72.2±64±40
NNA±7.1±5.0±3.6
Ti63.4±10±21.8±49.6
O34.6±8.3±12±2.9
ClNA±1.6±2.1±3.7
C to Ti ratioNA7:13:11:1
Table 4. Effect of pyrolysis time under N2 gas at 350 °C and ramping rate of 50° C/min on the band gap of the synthesised C–N–TiO2 nano catalysts (S0 = with Degussa TiO2; S1 = C–N–TiO2 105 min; S2 = C–N–TiO2 120 min and S3 = C–N–TiO2 135 min).
Photo CatalystsPyrolysis Holding Time (min)UV-Vis Absorption Wavelength (nm)Band Gap (eV)
S0NA4083.2
S11054622.67
S21203933.10
S31353333.17

