Article

Comparison of Catalytic Properties of Vanadium Centers Introduced into BEA Zeolite and Present on (010) V2O5 Surface–DFT Studies

by
Agnieszka Drzewiecka-Matuszek
,
Renata Tokarz-Sobieraj
,
Małgorzata Witko
and
Dorota Rutkowska-Zbik
*
Jerzy Haber Institute of Catalysis and Surface Chemistry, Polish Academy of Sciences, Niezapominajek 8, 30-239 Krakow, Poland
*
Author to whom correspondence should be addressed.
Submission received: 25 August 2020 / Revised: 10 September 2020 / Accepted: 15 September 2020 / Published: 18 September 2020

Abstract

:
Vanadium-based catalysts, in which vanadium is present either as bulk V2O5 or as isolated species, are active in numerous oxidation reactions. In the present study, vanadium speciation and the possibility of its introduction in various forms (V=O, V–OH, V(=O)(–OH)) into the structurally different crystallographic positions in BEA zeolite was considered by means of Density Functional Theory (DFT). Out of nine nonequivalent positions, T2 and T3 positions are the most preferred. The former may accommodate V=O or V–OH, the latter V–OH or V(=O)(–OH). The structural and electronic properties of all possible centers present in the BEA zeolite are then compared with the characteristics of the same species on the most abundant (010) V2O5 surface. It is demonstrated that they exhibit higher nucleophilic character when introduced into the zeolite, and thus, may be more relevant for catalysis.

1. Introduction

Catalytic materials incorporating vanadium are an important class of heterogeneous catalysts, applied mostly to oxidation reactions [1,2,3]. This follows from high reactivity of vanadium pentoxide, V2O5, which is an active component of many catalysts. Due to its low specific surface area, vanadium phase is often deposited on the solid support. Such a modification is done in order to develop its surface, and in consequence, to expose vanadium centers to reactants. Numerous metal oxide supports are used for V2O5. Among various supports, microporous and mesoporous systems, such as zeolites, play a distinctive role because their highly specific surface area allows for preparation of catalysts with well-dispersed vanadium species. As claimed in the literature, the dispersion and isolation of the active sites is an important factor in the design of efficient catalysts for selective oxidation [4,5]. Vanadium was successfully introduced into e.g., HMS [6], MCM-41 [7], MCM-48 [8], SBA-15 [9], BEA [10], FAU [11,12], EMT [11], and ZSM-5, Y [13]. Our attention is focused on the V-incorporated BEA system, as it proved to be active in many catalytic processes, including oxidative dehydrogenation of propane [14], propene epoxidation [15], methanol oxidation to formaldehyde [16], and NO reduction with NH3 [17].
BEA zeolite is a microporous crystalline aluminosilicate built of [SiO4] and [AlO4] tetrahedra, arranged into three-dimensional interconnected 12-membered ring channels of 6.68 Å diameter. In the crystal structure of BEA, there are nine non-equivalent tetrahedral positions (referred to usually as T sites, which are occupied by Si or Al atoms in zeolites)—see Figure 1. BEA zeolite can be synthetized with Si/Al ratio varying from 10 to 100. It was experimentally shown that vanadium can substitute T sites (Si or Al) in BEA zeolite [10].
There exist a few theoretical studies of the vanadium-substituted BEA systems done within periodic models using PBE/PAW as implemented in VASP. The earliest studies employed the geometry of the sodalite (SOD) zeolite as models of the BEA structure [18,19,20]. Such a choice of the model followed from the fact that the SOD structure contains only one type of T atom, allowing for the simplification and acceleration of calculations. Two forms of vanadium atoms were considered; one in which vanadium is incorporated into the zeolite framework bearing the vanadyl oxygen (V=O) and the second in which it is connected with the hydroxyl group (V–OH). The V=O group linked to three silicon atoms via oxygen bridges is the most stable form of vanadium introduced into SOD. In such an arrangement, vanadium preserves tetrahedral geometry of the T site. The exchange of the SOD silicon into vanadium was predicted as not energetically favored. The form in which vanadium was bound to both oxo and hydroxyl ligand (V(=O)(–OH) site) was also considered, but found unfavorable [19]. Then, the chemical reactivity of vanadium sites was explored with molecular electrostatic potential [18]. Low reactivity of the vanadyl oxygen (V=O) towards hard nucleophile was predicted, whereas the vanadyl hydroxide (V–OH) was found to be more nucleophilic. Further, the acid-basic properties of the V=O and V–OH vanadium models were assessed with PBE/PAW periodic approach by considering protonation and deprotonation of the vanadyl oxygen and hydroxide and comparing with protonation and deprotonation of the bridging oxygen site (V–O–Si) [21]. The calculations showed that the vanadium-bound hydroxyls are more acidic than the Si–OH groups and their protonation is favored over deprotonation. Although it was shown that SOD model might yield the correct local geometry of the V=O and V–OH site, Wojtaszek et al. [22] pointed out that in the BEA zeolite, there are nine structurally different T positions, which can be substituted by other elements and, therefore, the preference of vanadium can vary depending on the position. Based on the periodic PBE/PAW method, the authors claim that vanadium is preferentially located as V=O center in T1 and T2 sites. It can adopt also the V–OH form when in T7 and T9, although T6, T8, and T5 sites are less preferred by only 0.1, 0.1, and 0.2 eV. The chemical character of the sites was not determined, as the main aim of the study was to check if group V elements (V, Ta, Nb) can substitute T atoms in the BEA zeolite.
In the present article, we consider three possible forms of vanadium, which can be found in the BEA zeolite, namely V=O, V–OH, and V(=O)(–OH), and study their feasible location in nine structurally different crystallographic positions. Further, we characterize all vanadium active sites and compare their structural and electronic properties with the active sites present on the most exposed surface of vanadium pentoxide, V2O5, which is (010). The system chosen for comparison (V2O5) constitutes the active phase of numerous industrial catalysts, applied in particular for selective oxidation of o-xylene to phtalic anhydride, selective reduction of NOx with NH3, or selective oxidation of CH3OH. Theoretical studies of V2O5 reported in the literature aim at characterization of the bulk oxide and its surfaces and employ both cluster and periodic models [23,24,25,26]. Activity of V2O5 in oxidation reactions prompted the intensive studies in its reducibility, formation of vacancies, and the re-oxidation [23,27,28,29]. Vanadium pentoxide is a crystalline solid built of [VO6] distorted octahedra, in which V-O bonds have different lengths: one of 1.58 Å, one of 1.78 Å, two of 1.89 Å, one of 2.02 Å, and one long bond of 2.78 Å. The consequence of such a long vanadium-oxygen bond is the layered structure of V2O5. The layers are perpendicular to (010) surface and interact one with another via van der Waals forces. The (010) surface being the most stable and coordinatively saturated, is mainly exposed in the vanadium pentoxide crystals as can be seen in STM or AFM experiments [30,31,32].

2. Results and Discussion

The vanadium centers introduced into BEA zeolite were modeled by cluster approach, in which fragments of the BEA zeolites were cut out from the crystallographic structure of BEA retrieved from the zeolite structures database [33], and terminal bonds were saturated with hydrogen atoms, which were then kept frozen during geometry optimization. In each cluster, a central T-atom was replaced with vanadium species in such a way that its coordination sphere is saturated with Si tetrahedra. We have considered three different forms of vanadium species: V–OH, V=O, and V(=O)(–OH)—see Figure 2. In all of the models, vanadium was on its +V oxidation state and formed respectively four, three, and two bonds with the neighboring Si atoms via oxygen bridges. The V–OH and V=O centers were proposed based on the available literature data on the geometry and environment of the V-sites in zeolites, in particular the theoretical studies regarding SOD and BEA zeolites [16,18,22]. The V(=O)(–OH) center was taken into account in [16], where it was proposed as one of the active sites for methanol oxidation to formaldehyde.
Although the cluster approaches to model zeolitic materials as the one employed in the present study exist in literature, we are aware that the representation of an extended crystalline system such as the BEA zeolite by the cluster model of a finite size may introduce some inaccuracies. On the one hand, cluster studies are relatively simple and can be applied to a wide range of structures. For instance, Migues et al. [34,35] developed a systematic method to construct cluster models that ensure the convergence of the energetic effects of the selected zeolite-catalyzed reactions. On the other hand, cluster calculations may miss some information on the long-range interactions within the bulk, which are otherwise captured by periodic calculations. Such a limitation can be partially overcome by embedding cluster models inside the system of atoms or partial charges representing the larger portion of the solid. To do so, mixed quantum mechanics/molecular mechanics (QM/MM), ONIOM-like methods, and electronic embedding schemes are often employed [36,37,38]. The discussion on the influence of the type of electronic embedding of cluster models of zeolites can be found, e.g., in [39], where the authors consider two alternative models. In the first one, a correction potential is introduced by fitting a non-periodic set of point charges to the difference between the bare cluster and periodic potentials. In the second one, the cluster is immersed in a lattice of atomic charges of fitted values. No matter if the cluster is embedded or not, the proper calculation protocol requires that the computed values are converged with respect to the cluster size. In the present manuscript, we focus mostly on structural (bond lengths) and electronic parameters (bond orders and Mulliken charges) of the vanadium centers introduced into different positions of BEA zeolite. Therefore, we performed benchmark calculations to check to what extent they are affected by the size of the model. In order to do so, the models of increased size were created for exemplary T sites—see Supplementary Materials Figure S1, starting from the simple ones, in which vanadium is surrounded by only one “layer” of Si atoms, through a larger one, in which we put more T sites, up to the largest one where bigger fragments of zeolite walls are considered. Next, the parameters of the vanadium site were computed for each of the models to check the convergence. Analysis of the obtained data reveals that the character of the vanadium centers is comparable irrespective of the size of the model (see Table S1), therefore, the reported calculations are done with the use of the middle size cluster as it is the one that guarantees a good balance between the geometry representation of the site and the computational cost.
In order to determine which form of vanadium is the most probable in any of the possible crystallographic positions of the BEA zeolite, the energy needed to exchange Si for V was calculated according to the equations given below.
The substitution of Si for V–OH was considered as a product of the following process:
Si–BEA + V(OH)5 → Si(OH)4 + (V–OH)–BEA
accompanied by the change of the energy computed as:
∆ESiVOH = E((V–OH)–BEA) + E(Si(OH)4) − E(Si-BEA) − E(V(OH)5)
The substitution of Si for V=O was considered as the product of the following reaction:
Si–BEA + V(OH)5 → Si(OH)4 + (V=O)–(H–BEA)
in which Si4+ ion becomes replaced by the V(=O)3+ species. In order to keep the neutrality of the network, after incorporation of V, one of the Si–O bonds is saturated with hydrogen (denoted above as H–BEA).
Accordingly, the energy needed to substitute Si with V=O is calculated as:
∆ESiV=O = E((V=O)–(H–BEA)) + E(Si(OH)4) − E(Si–BEA) − E(V(OH)5)
Finally, the substitution of Si for V(=O)(–OH) can proceed according to the reaction:
Si–BEA + V(OH)5 + H2O → Si(OH)4 + V(=O)(–OH)–(2H–BEA)
The energy needed for the process is calculated as:
∆ESiV(=O)(OH) = E(V(=O)(–OH)–(2H–BEA)) + E(Si(OH)4) − E(Si–BEA) − E(V(OH)5) − E(H2O)
The computed energies needed for the isomorphic Si to V substitution described above are gathered in Table 1.

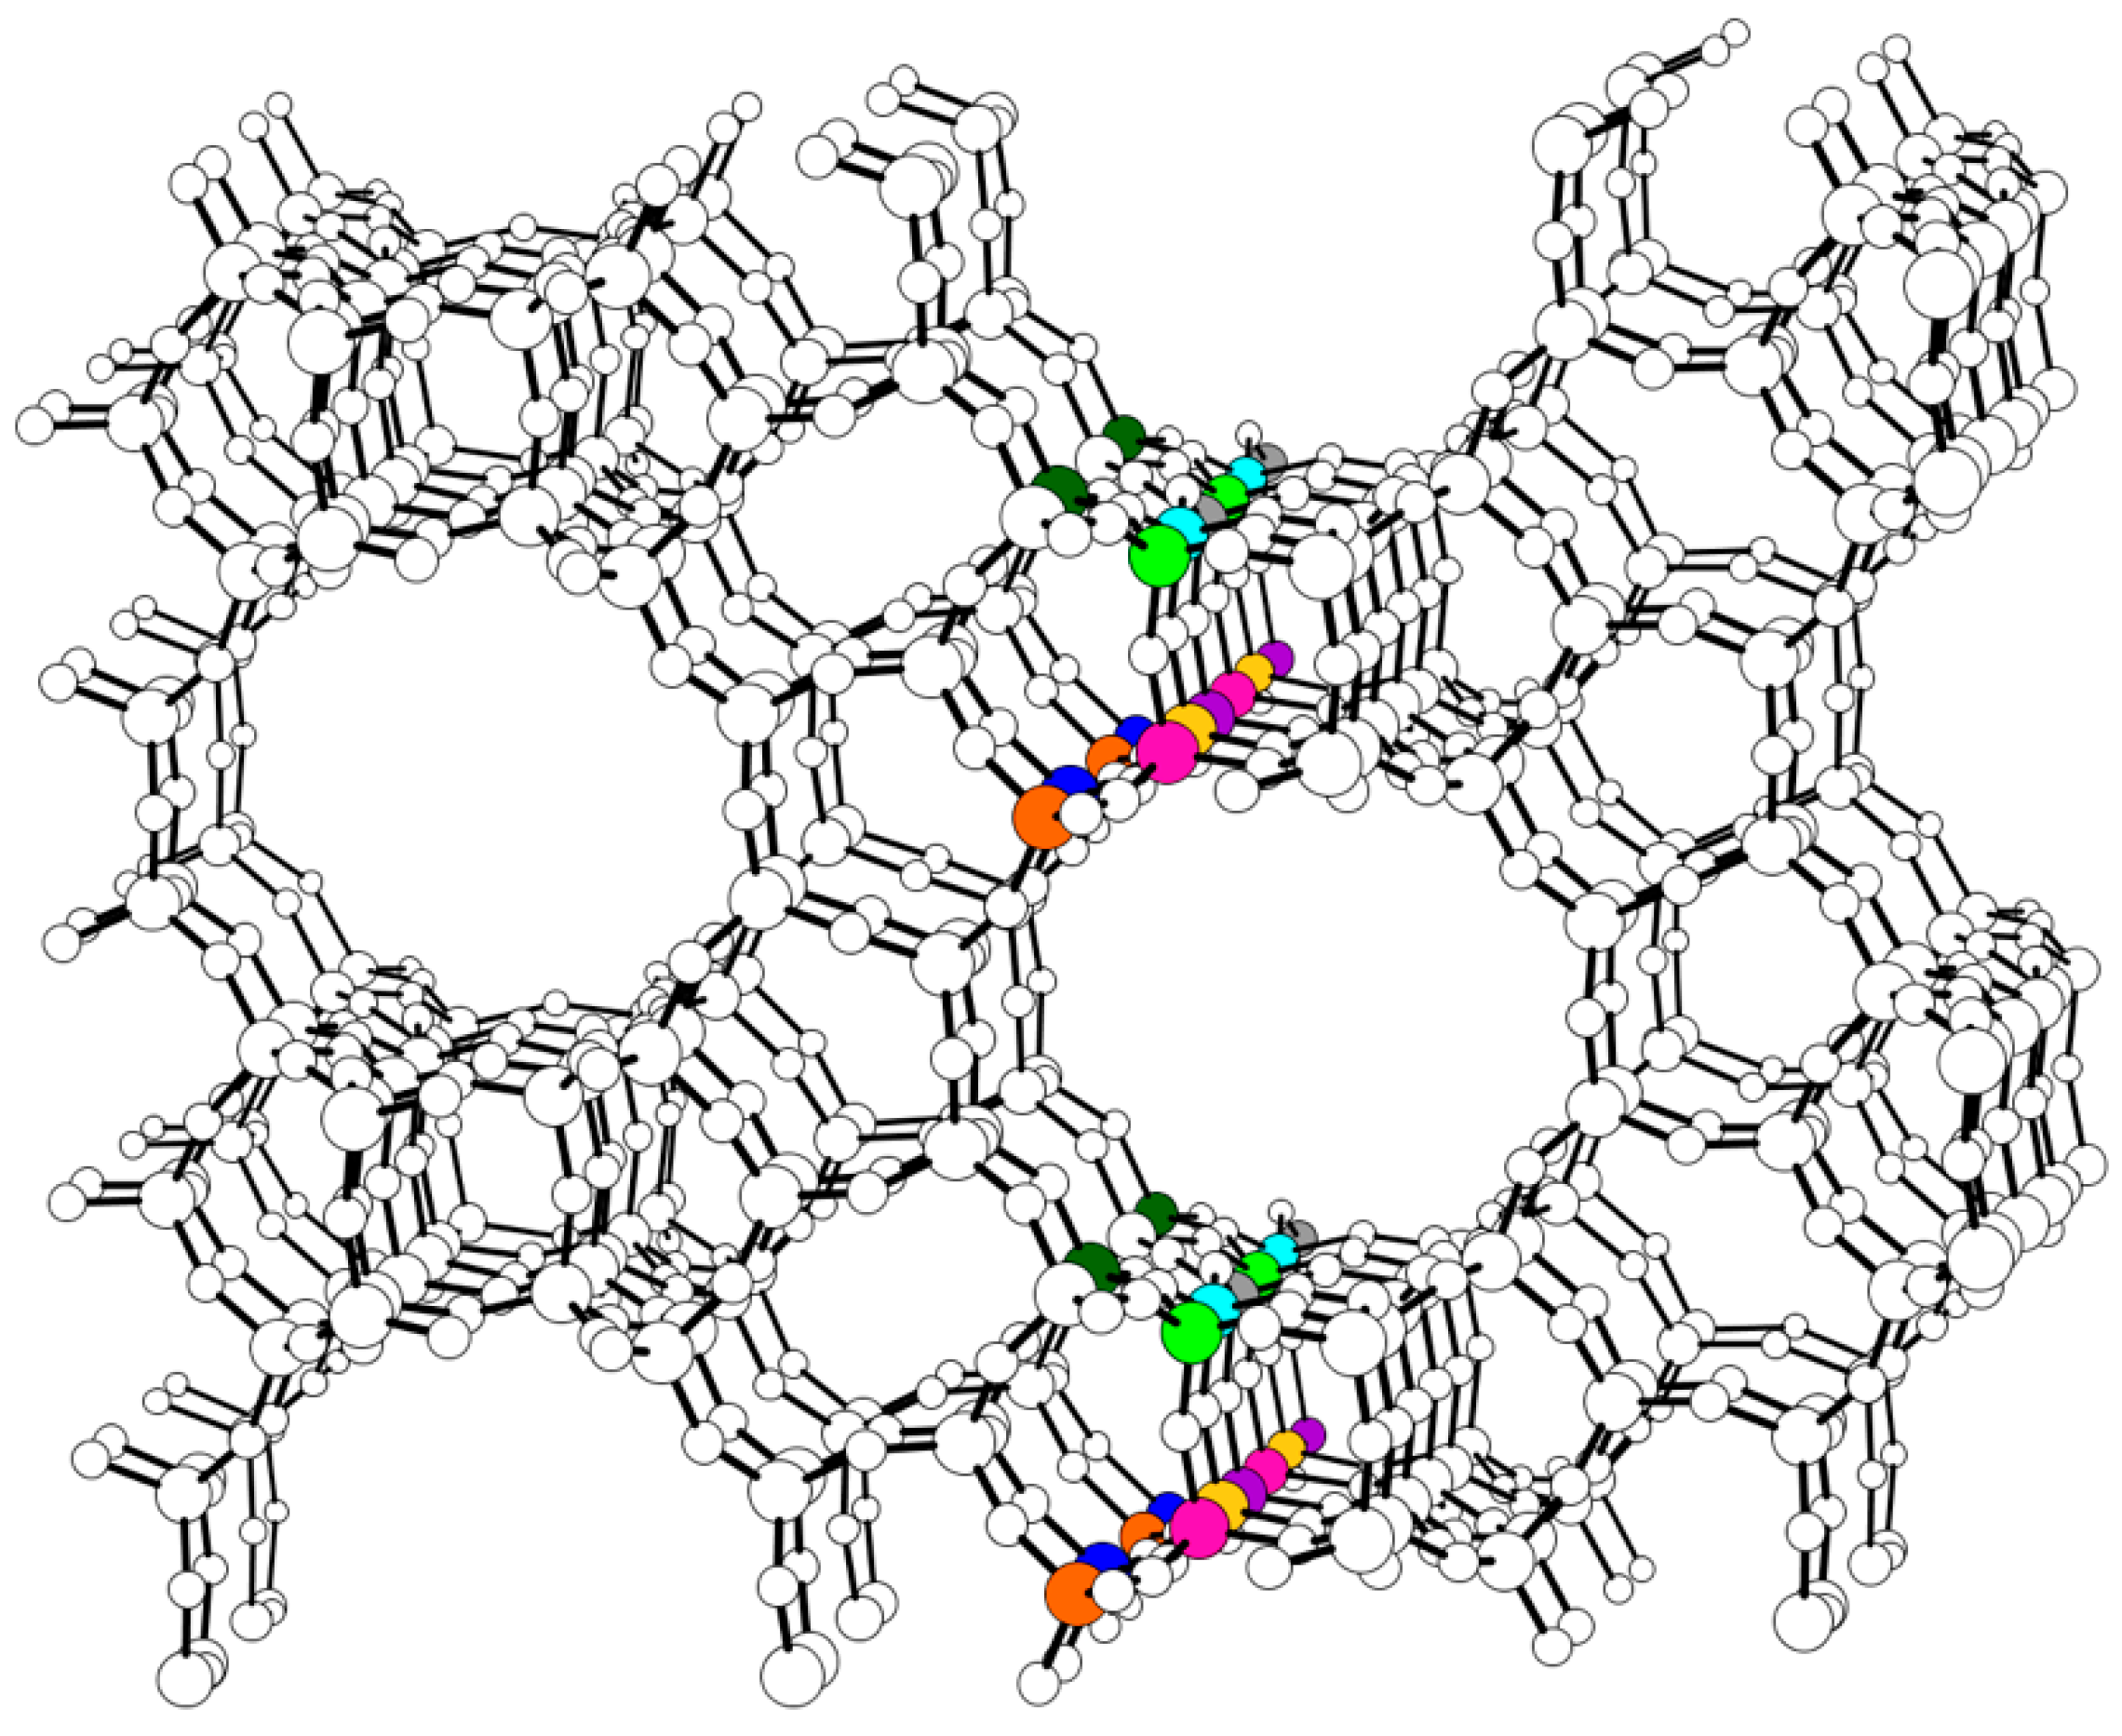
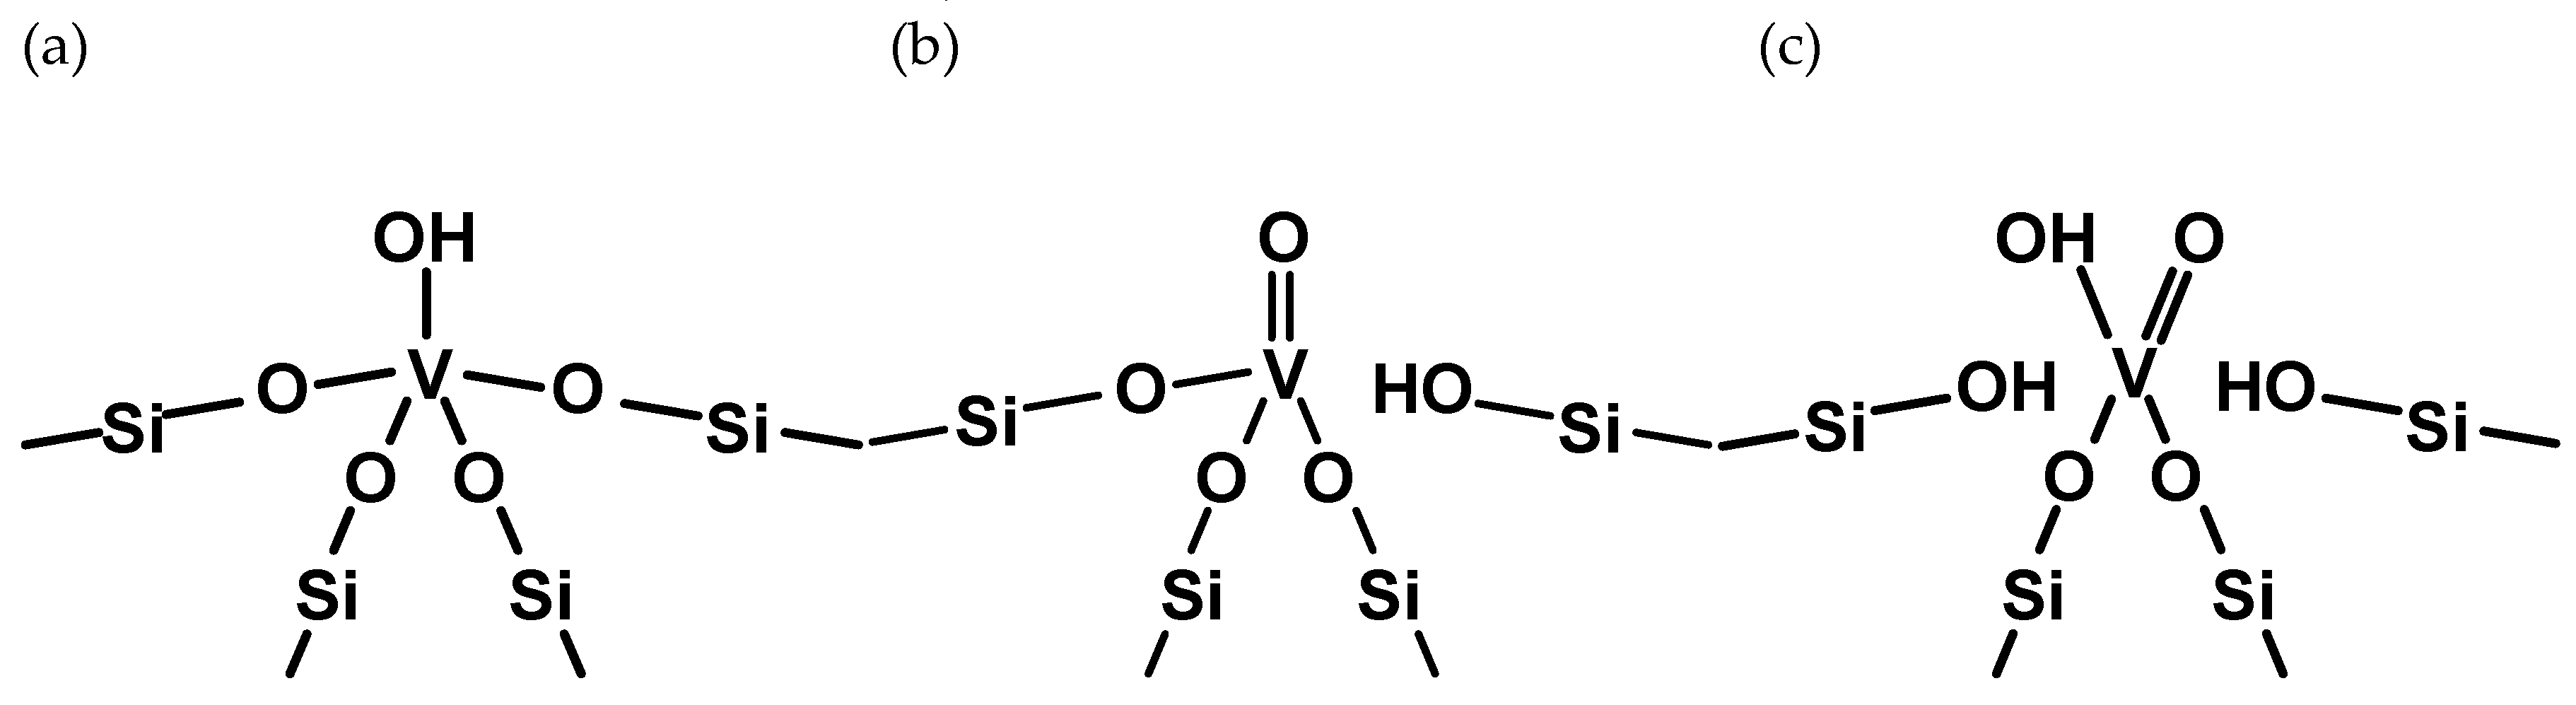
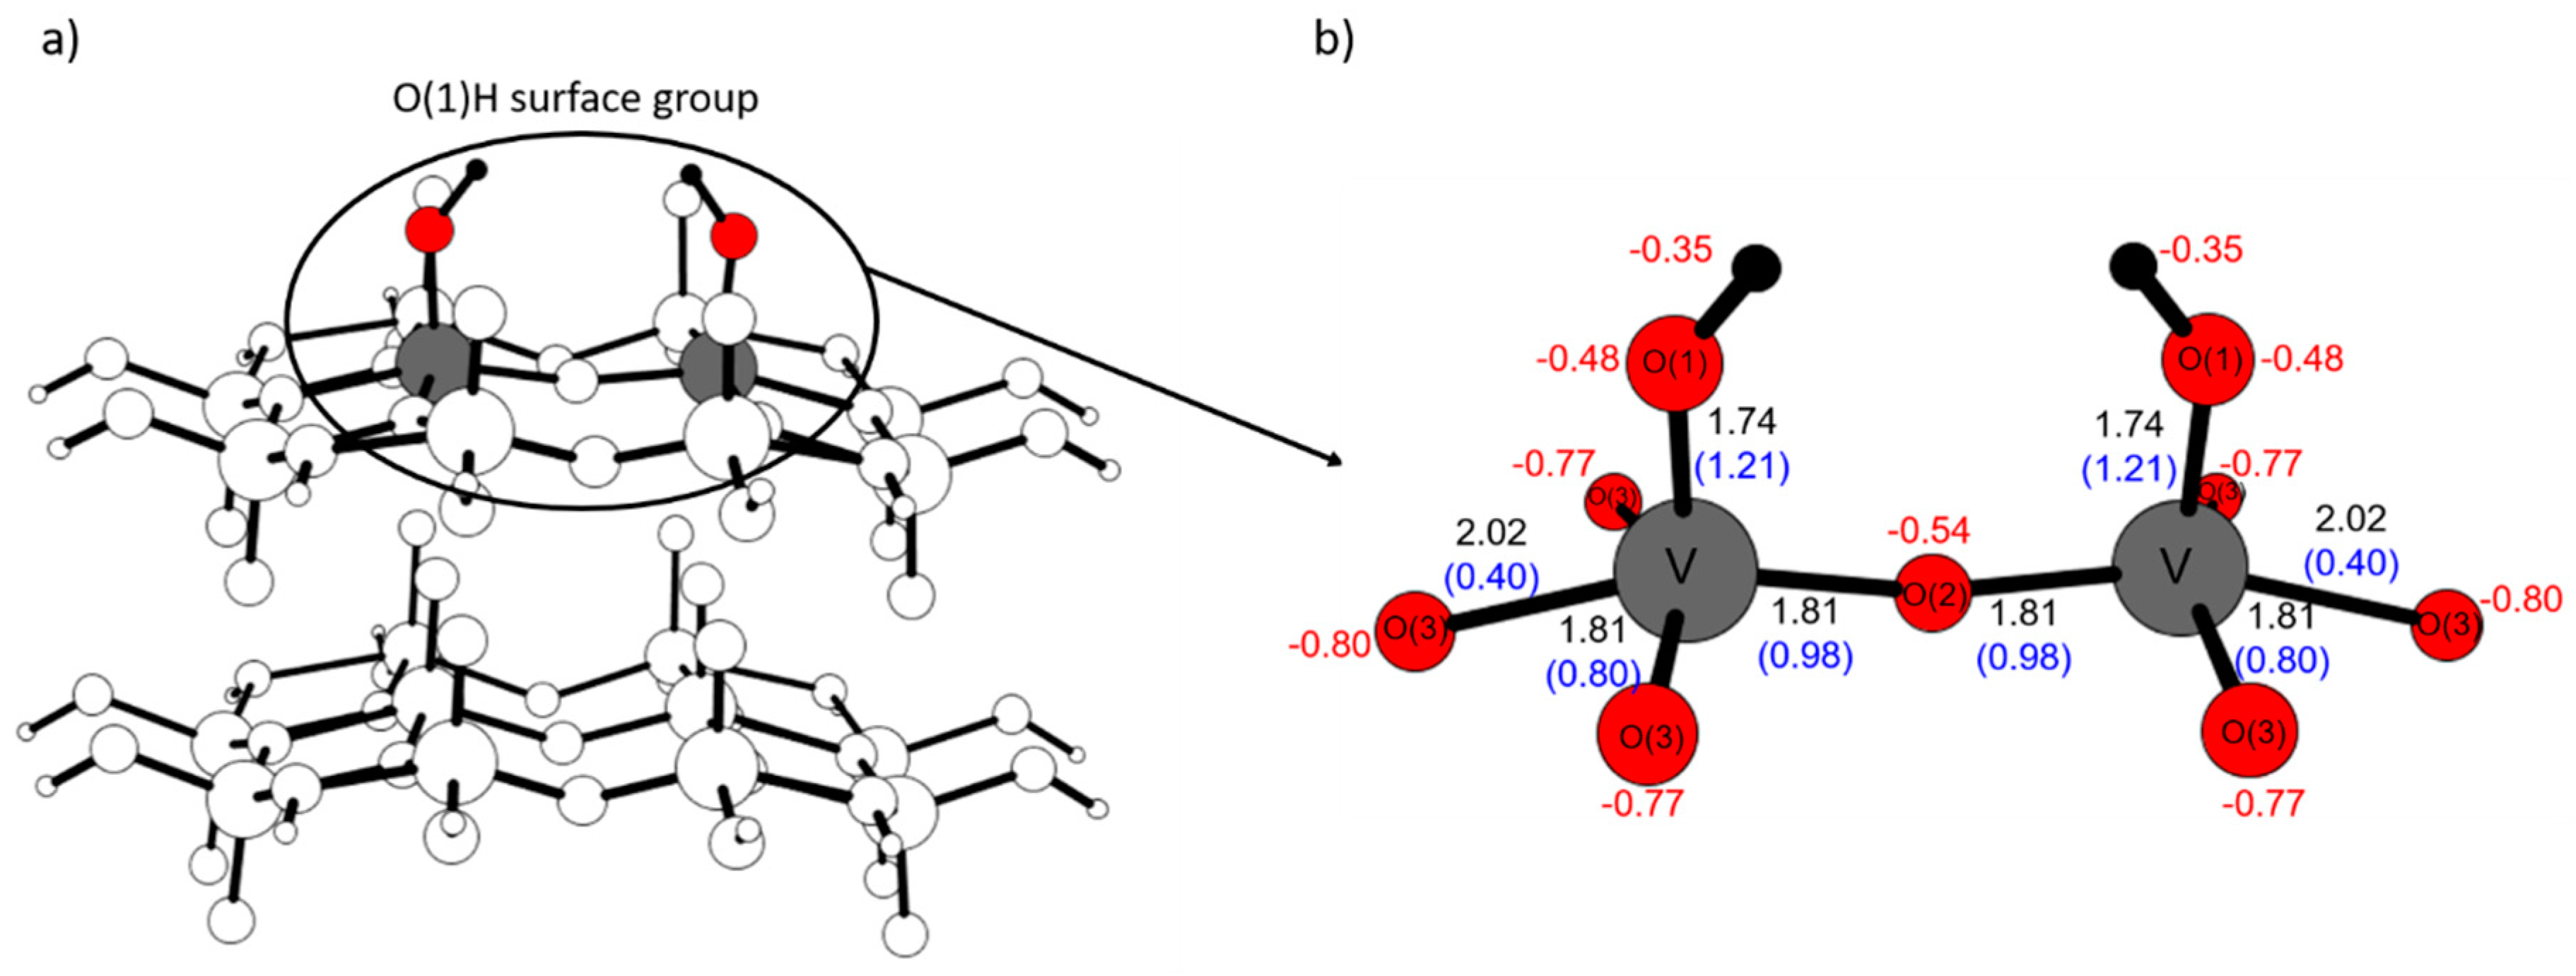
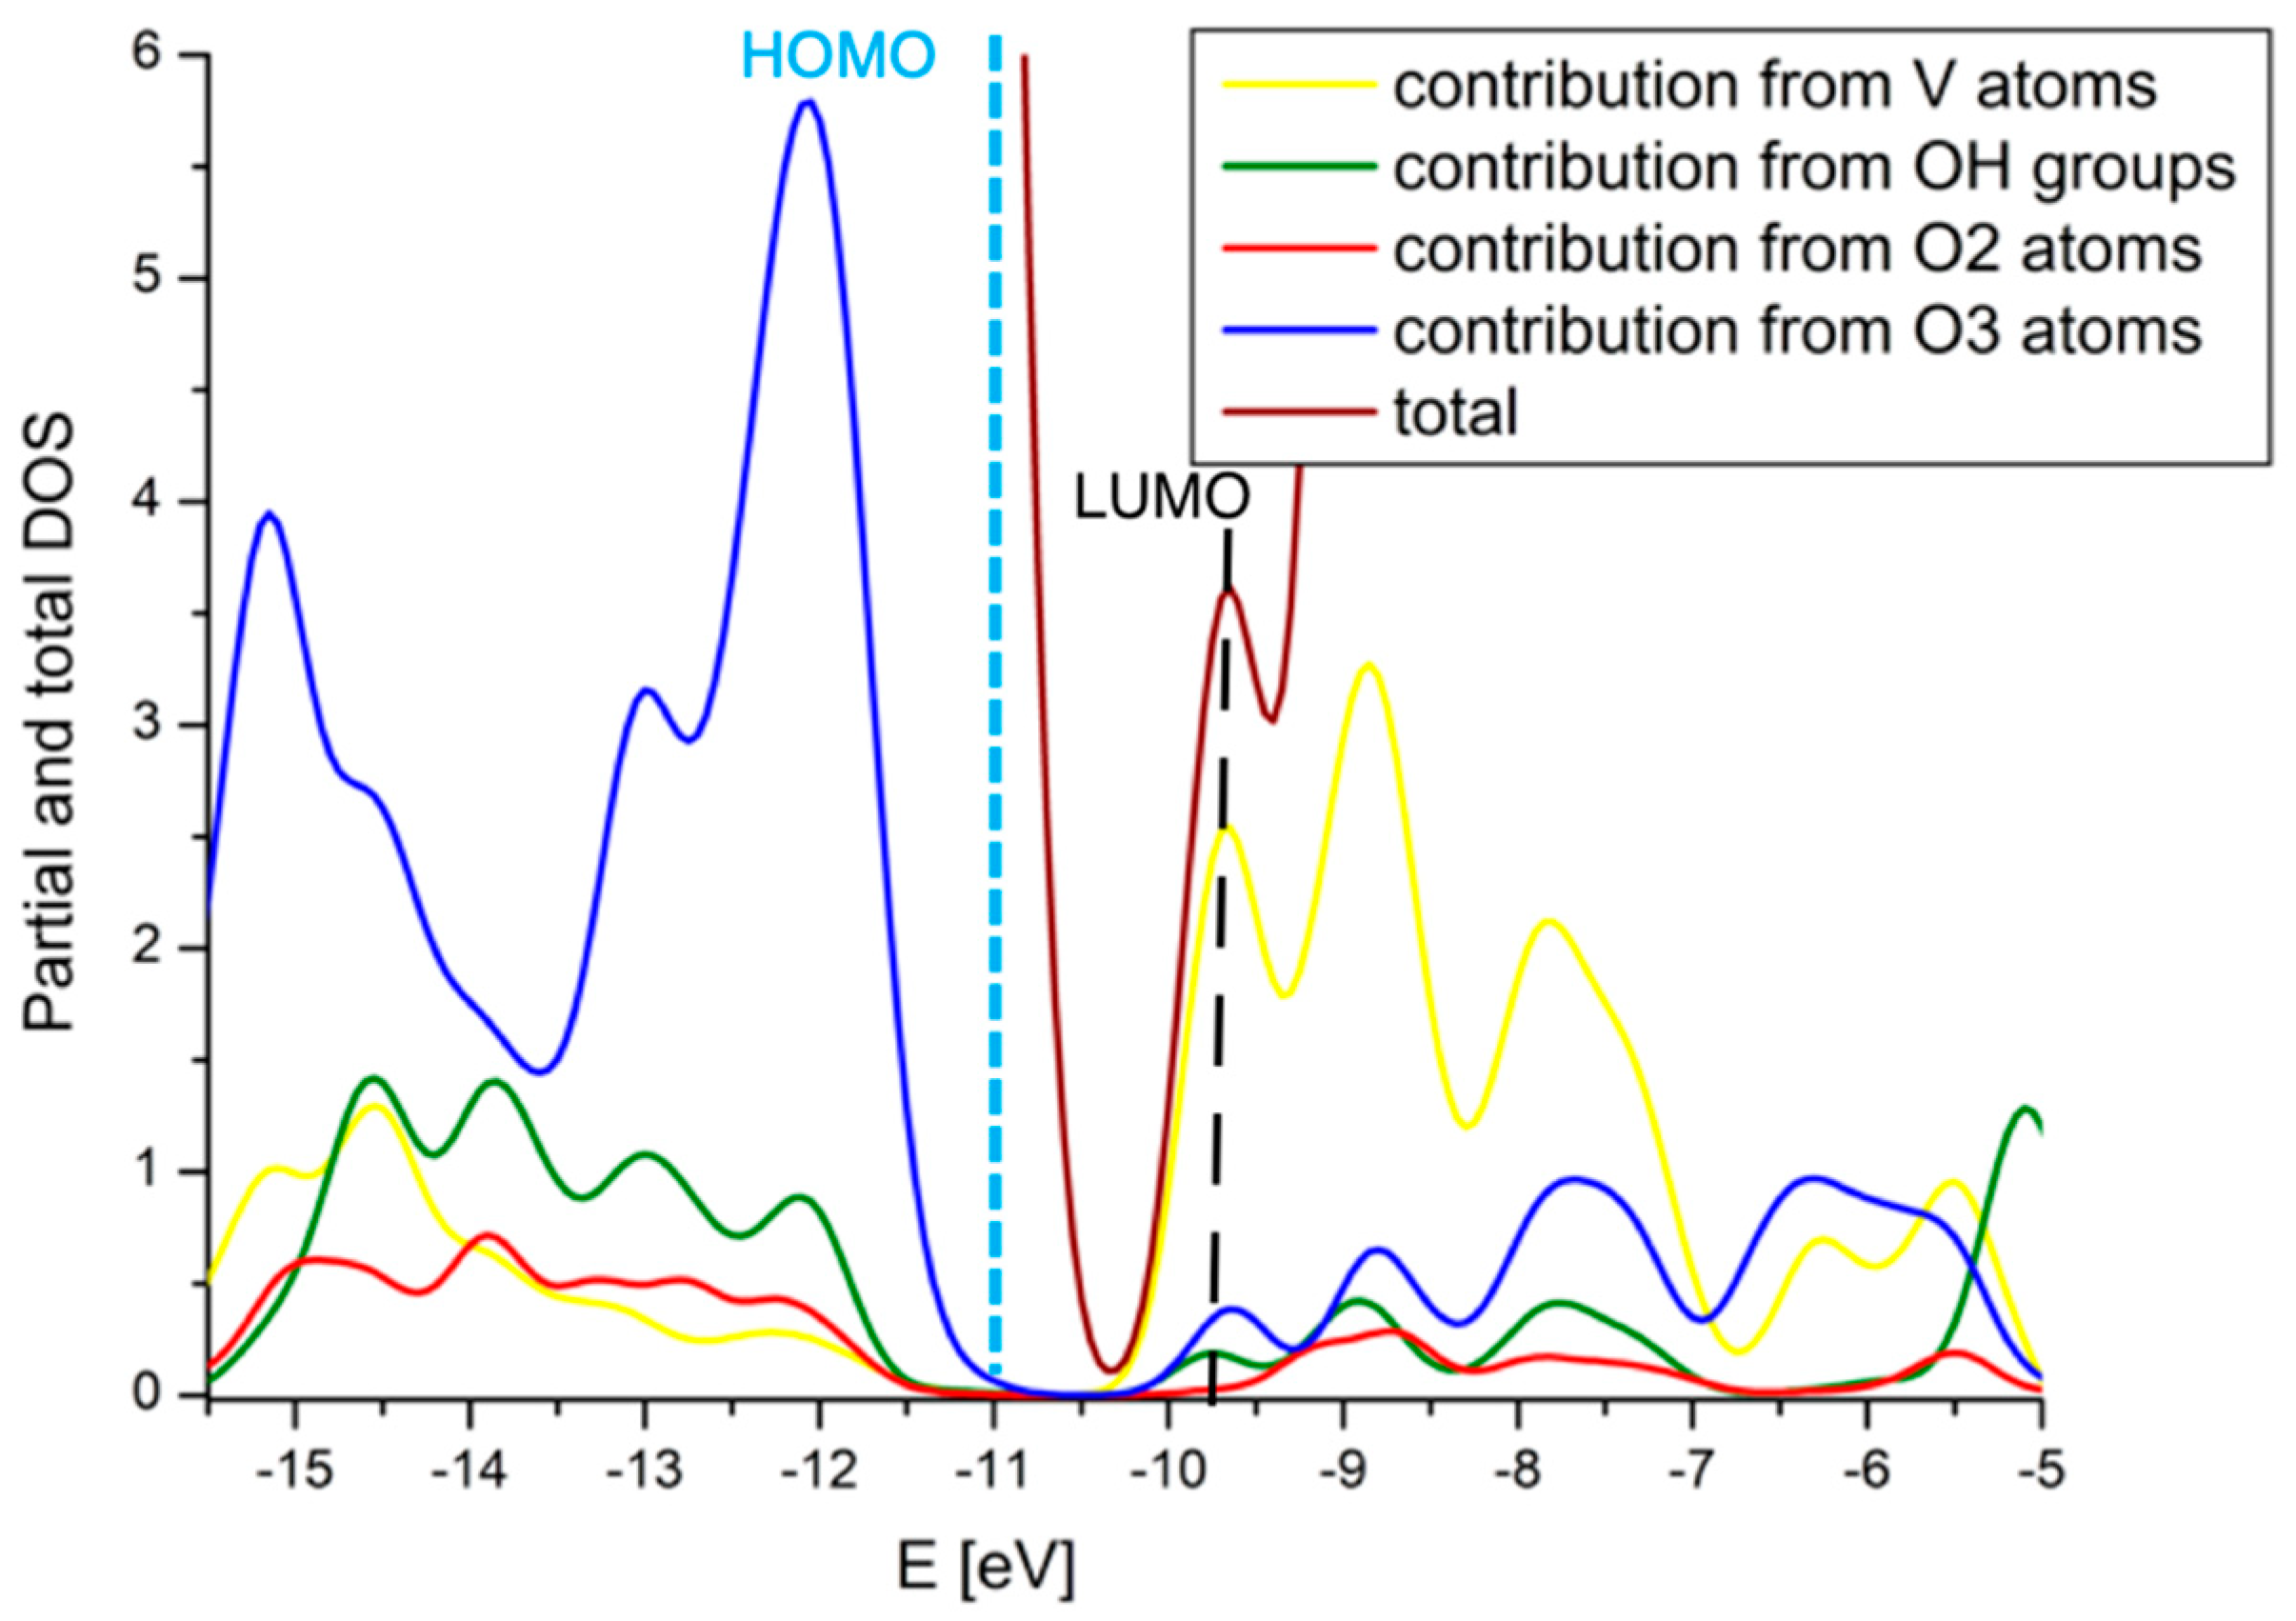
2.1. The Substitution of Si for V–OH

The substitution of silicon for vanadyl hydroxo group is exothermic in most crystallographic positions. It is the most exothermic for T2 position; for other positions, the order of reaction energies is as follows T3 > T9 > T7~T4~T5. The process is endothermic when V–OH is introduced into T1, T6, and T8 positions, but the energetic cost associated with the isomorphous substitution is not large and equals to 0.23 eV, 0.10 eV, and 0.06 eV, respectively.
Table 2 collects the V–OH bond lengths, bond orders, and Mulliken charges accumulated on the V–OH center computed for all considered structures. The V–OH bond length varies between 1.81–1.85 Å and has a single bond character (bond order is equal to 0.94–1.22). The positive charge accumulated on the vanadium in the V–OH form is in the range 1.25–1.39. The charge on the oxygen atom from the OH group is similar irrespective of its location and is in the range of −0.44 to −0.50. In this complex, however, it is connected to the positively charged hydrogen atom (its charge is equal to 0.32–0.33), therefore, as a whole, the charge on the OH group varies from −0.12 to −0.17.
The T2 position is the most energetically favored one for Si to V–OH substitution. Figure 3 presents the main parameters calculated for this site.
The examination of the parameters describing V–OH placed in the T2 position reveals that all five vanadium-oxygen bonds are similar. Their length (1.77–1.84 Å) and bond orders (0.91–1.09) are comparable. The oxygen atoms that connect vanadium with the zeolite silicas are only slightly less negatively charged (−0.39, −0.40, −0.46, −0.47) than the hydroxyl oxygen (−0.50). Therefore, all of them may act as nucleophilic centers interacting with organic substrates. This observation is further supported by the inspection of the density of states (DOS) plots—see Figure 4. In there, total DOS (rising from contributions of all atoms present in the structure) and atom projected partial DOS (rising from the atoms constituting the vanadium center) are depicted. The valence band is dominated by all types of oxygen atoms, which are bound to vanadium, while the conduction band is composed mostly of the vanadium orbitals with the admixture of the oxygen atoms from the V–O–Si bonds. The band gap width (HOMO–LUMO gap) calculated for the model is equal to 2.71 eV, which is narrower by 2.56 eV than the gap calculated for the pure silica model.

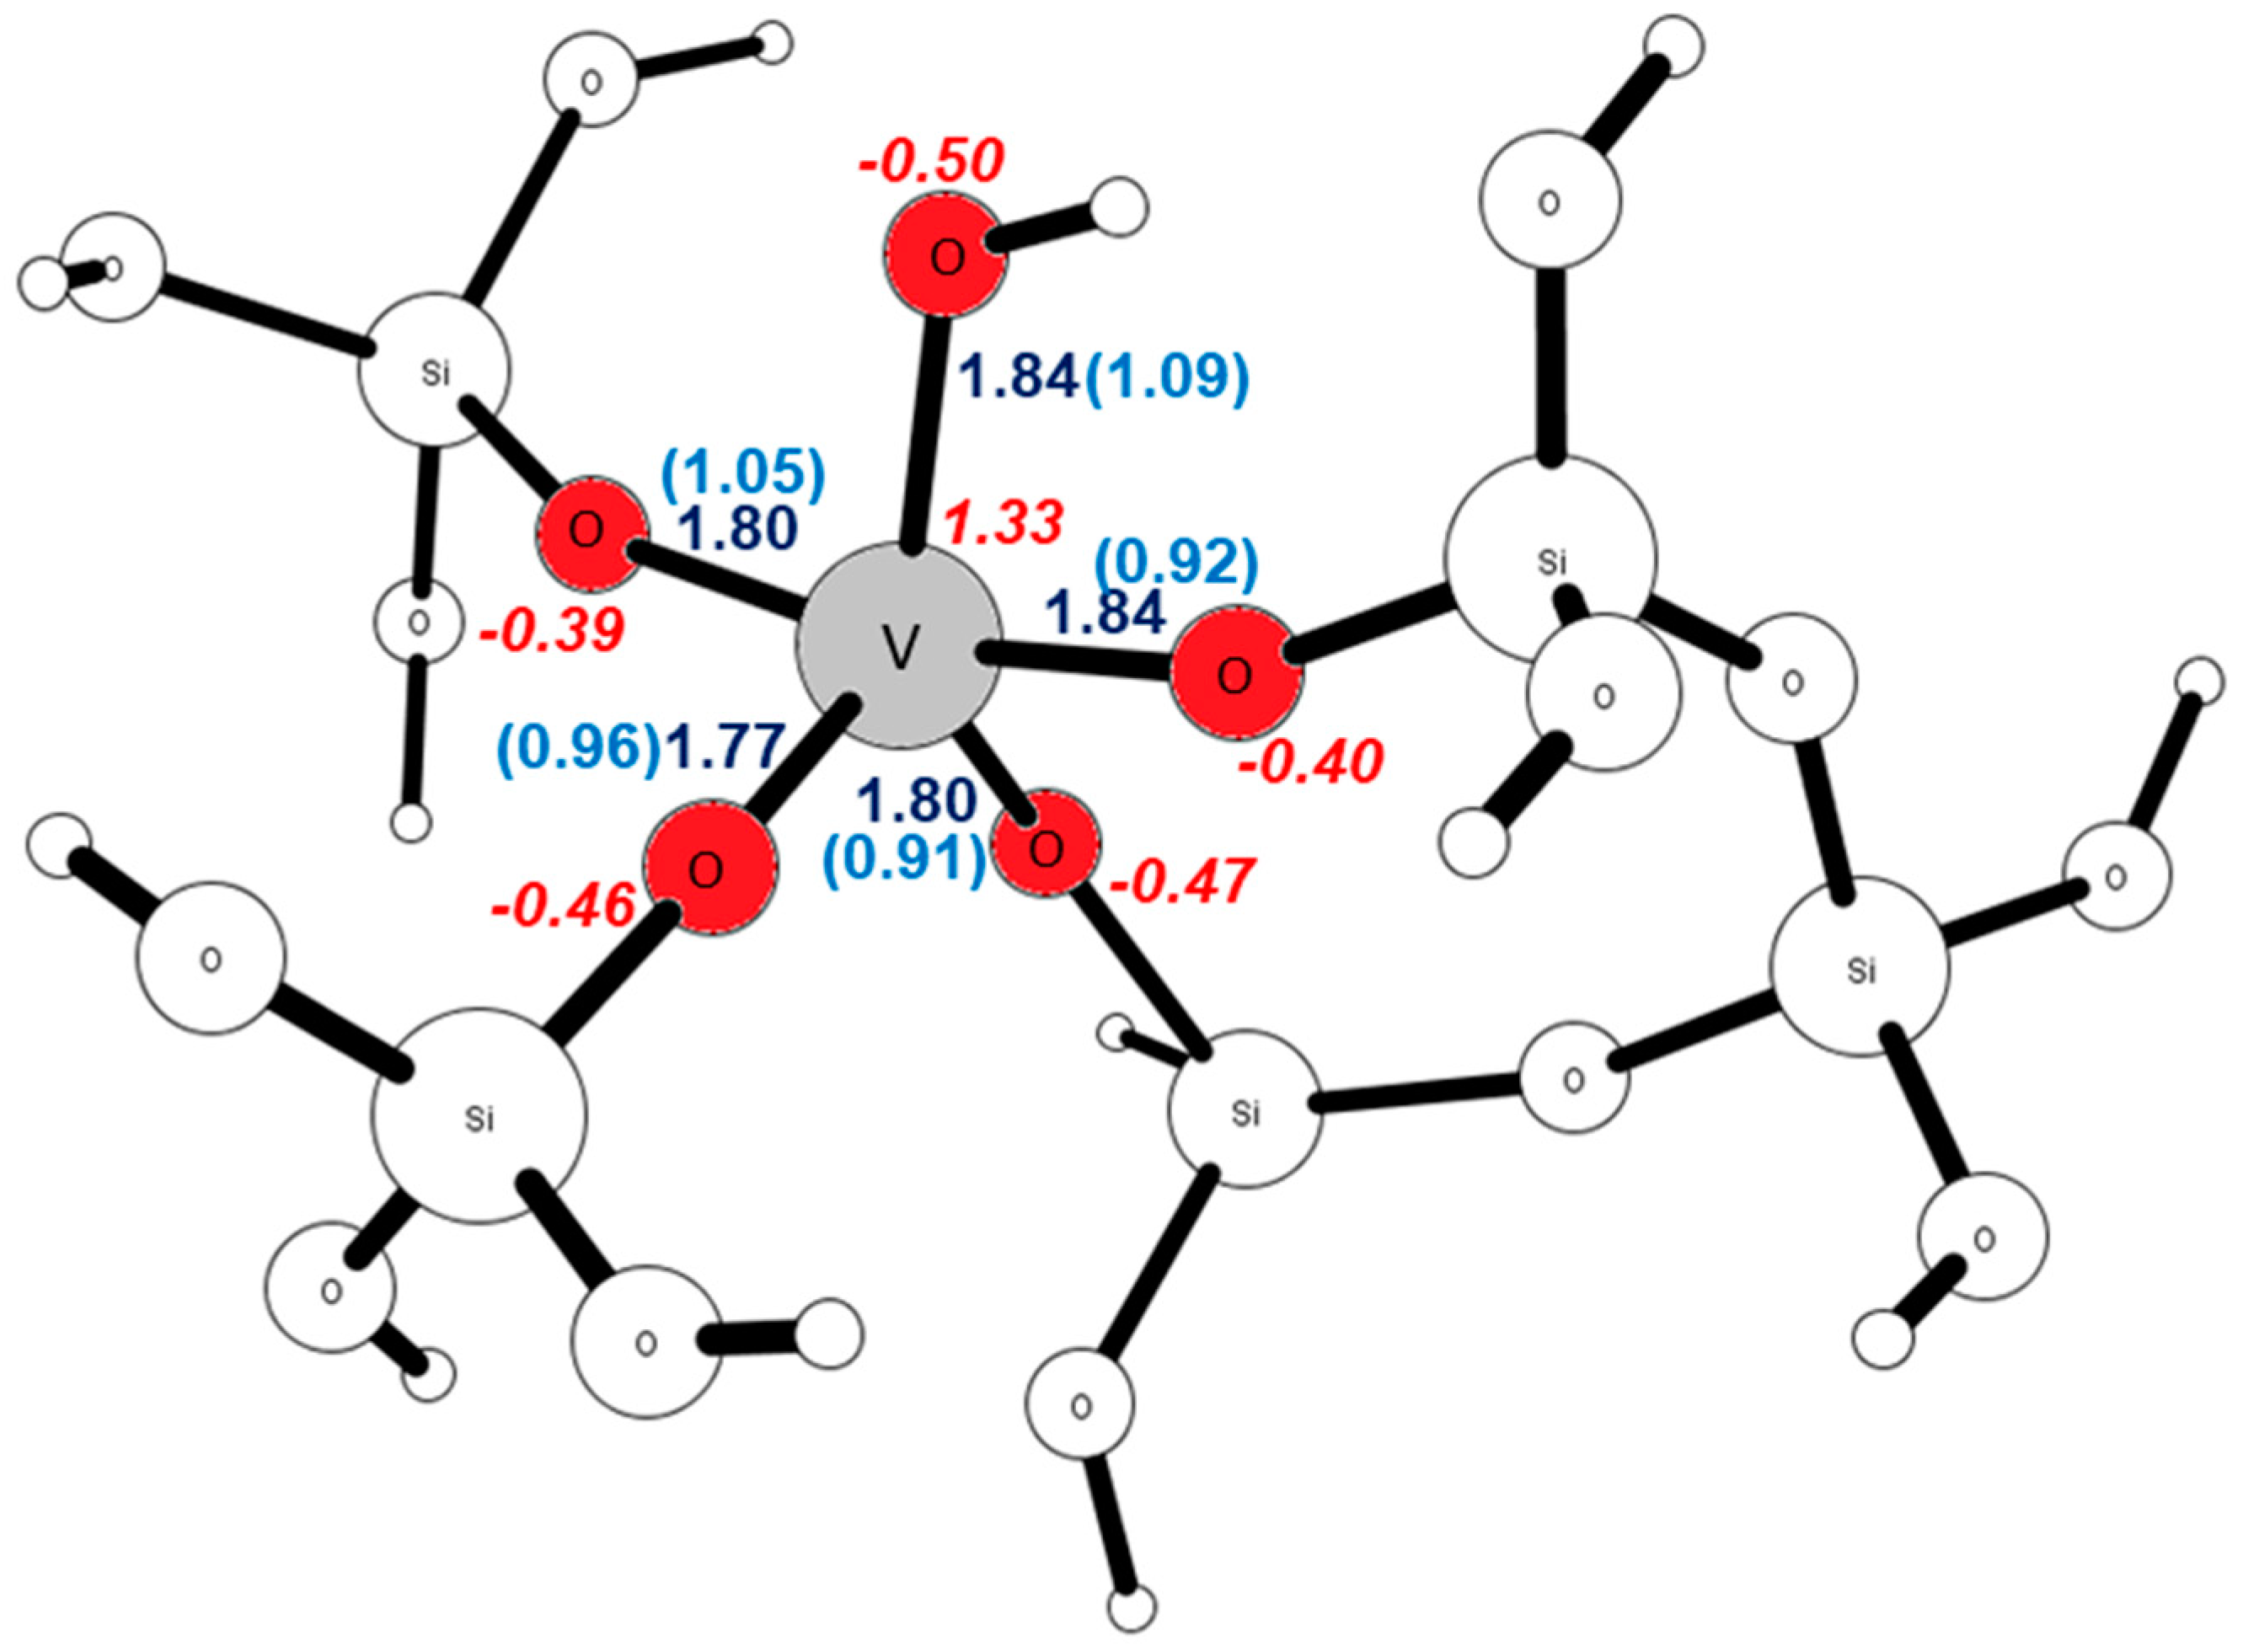
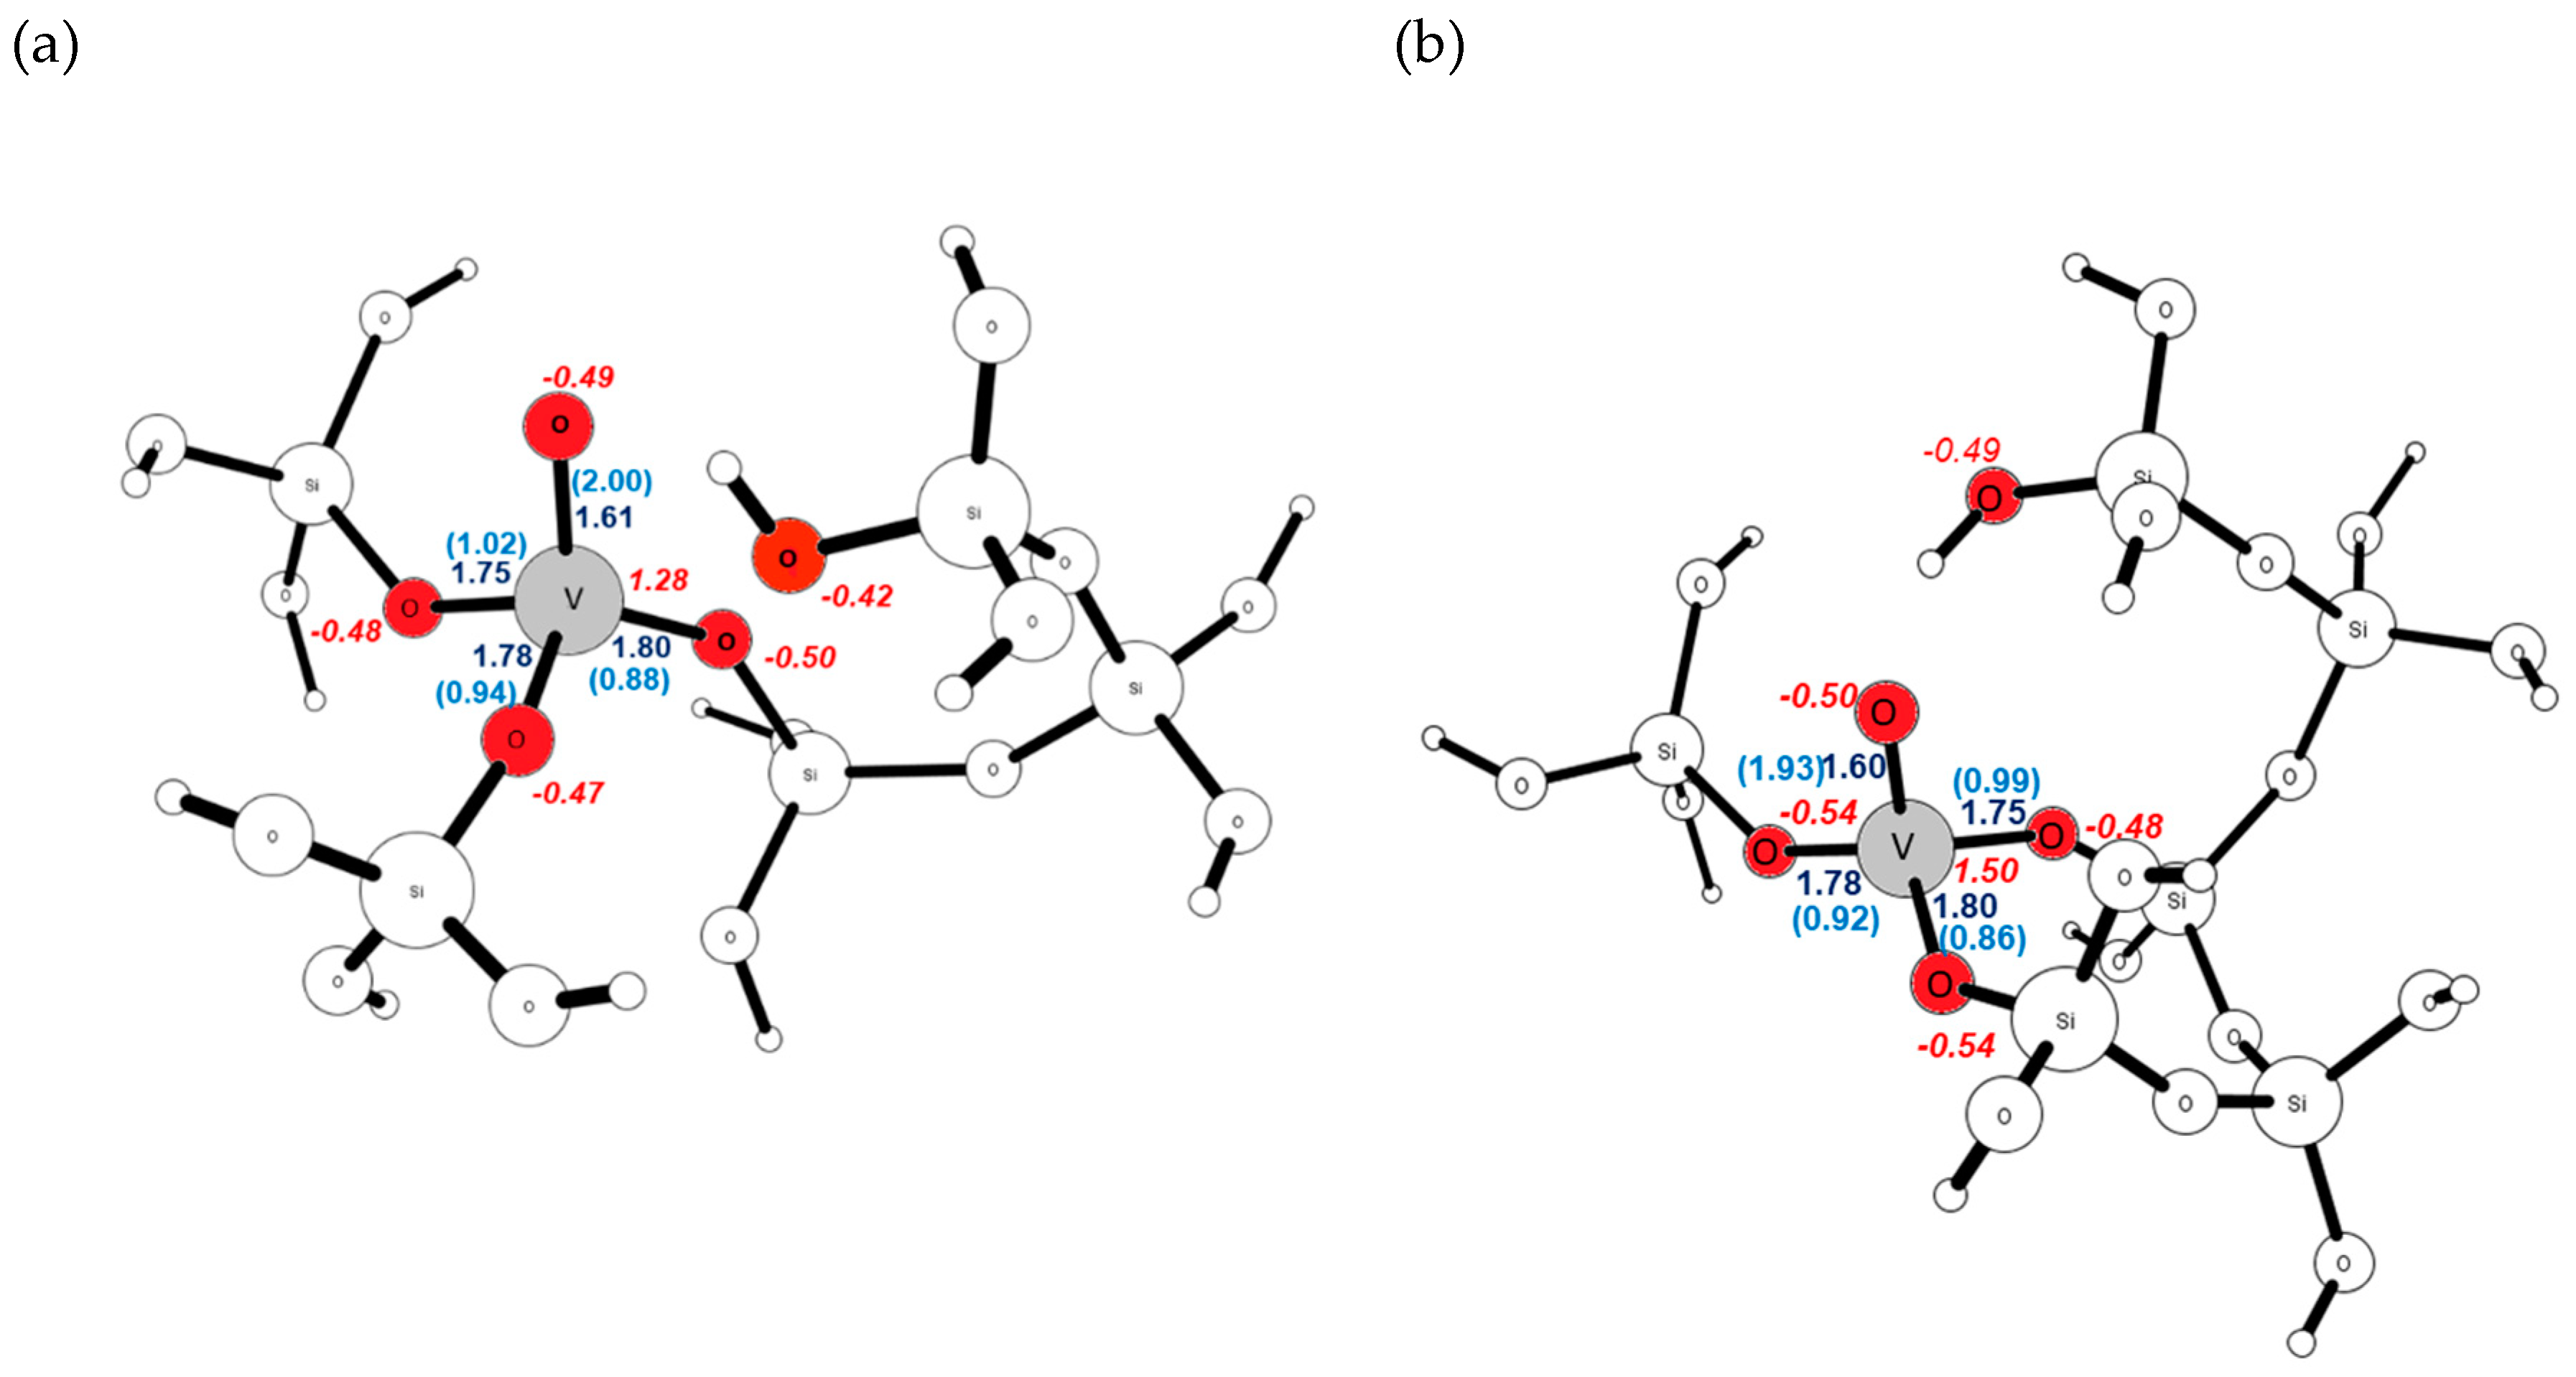
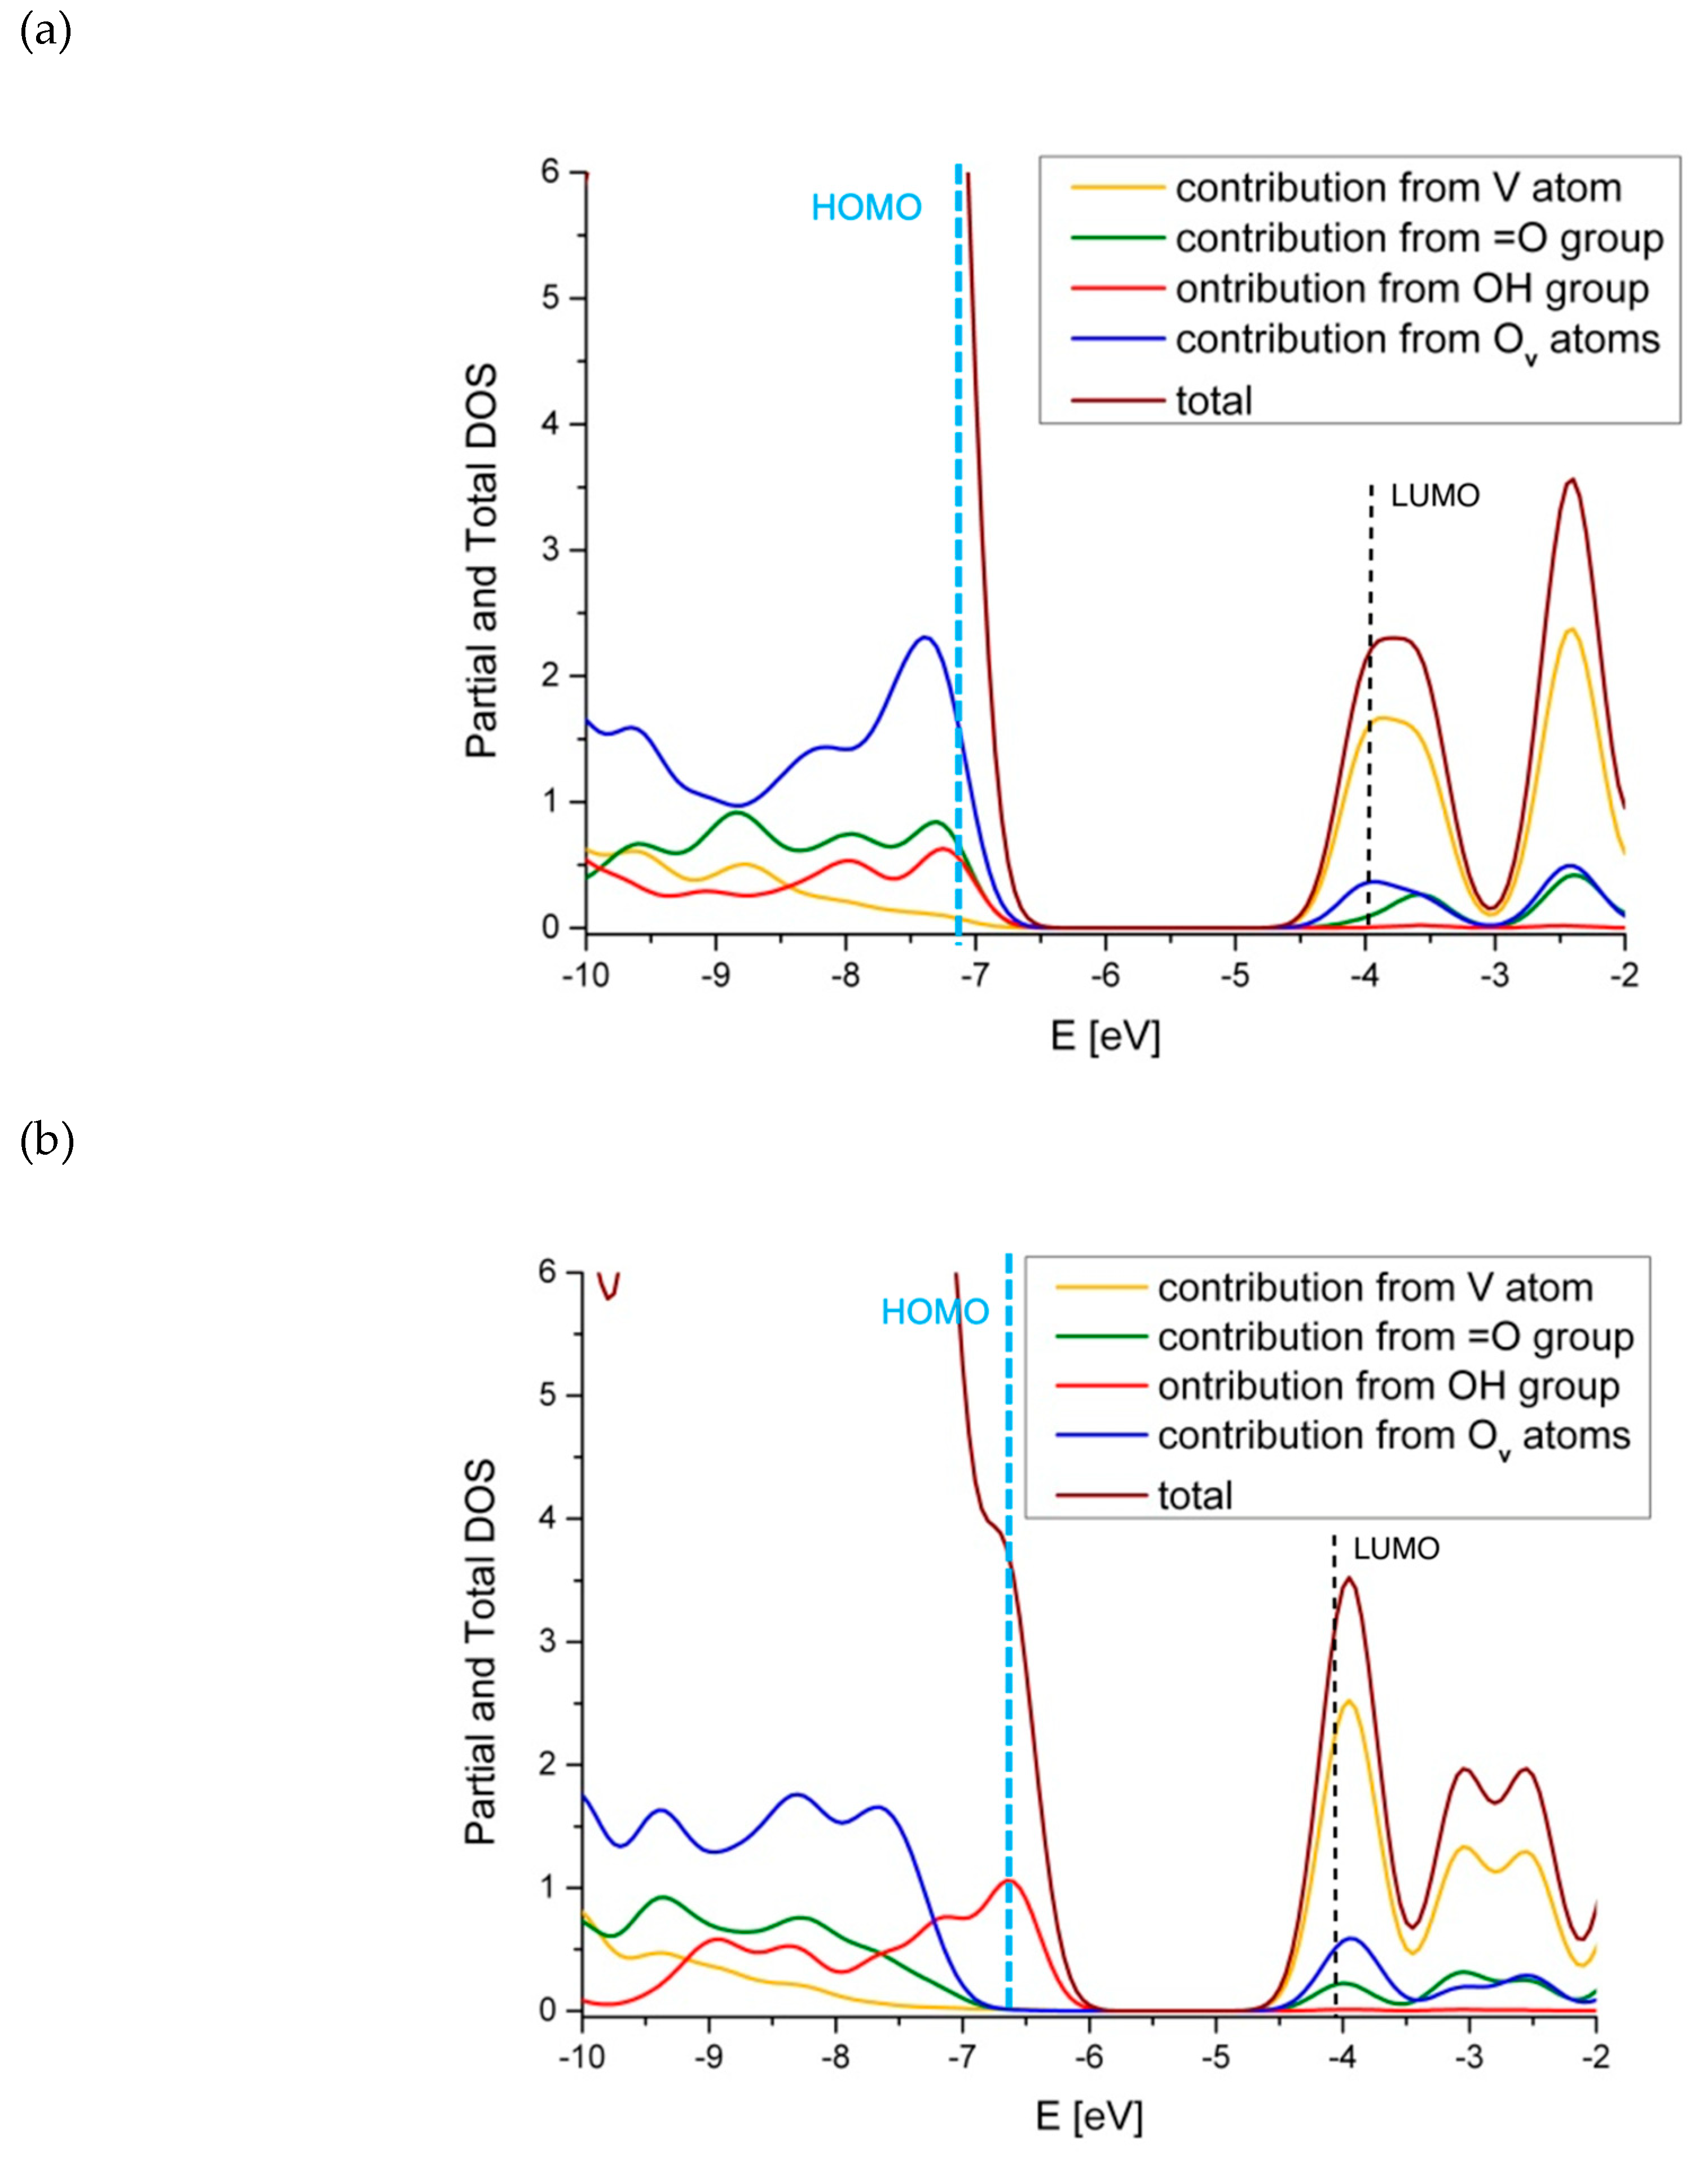
2.2. The Substitution of Si for V=O

As can be seen from Table 1, the isomorphous substitution of silicon for vanadyl oxo group is exothermic in all but T6 crystallographic positions. The energy values for exothermic reactions change in order T2~T3 > T9 > T8 > T4~T7 > T5 > T1. For the T6 site, there is no energy gain associated with the process (∆E = 0.00 eV). Our finding that the T2 is the preferred siting for the V=O site is in agreement with earlier calculations by Wojtaszek [22]. By contrast, our calculations indicate that the T1 site is considerably less favored than T2. This discrepancy probably results from the different models employed for both studies. In the current article, we adopt cluster model approach, in which cuts from the lattice are considered, whereas Wojtaszek et al. considered the whole periodic cell of the zeolite. Table 3 collects the V=O bond lengths, bond orders, and Mulliken charges accumulated on the V=O moiety computed for all considered structures.
The V=O bond has a typical character of the double bond, its length ranges between 1.59–1.61 Å and bond order from 1.83–2.09. The V=O group is polar and positively charged. The Mulliken charge accumulated on the V atom depends on the type of T site it occupies and varies between 1.23 (for the T1 site) and 1.60 (for the T9 site) and is on average higher than the charge accumulated on vanadium in the V–OH form—see Table 2. The charge on the O atom form the V=O group lies in the range between −0.46 (for the T1 site) to −0.54 (for the T4 and T5 sites). The vanadyl oxygen is thus more nucleophilic than the OH group of the V–OH species (charge on OH varies from −0.12 to −0.17, see Table 2).
Data in Table 1 indicate that the T2 and T3 positions are the most suitable for silicon substitution for vanadium as V=O. The energy gain equals to −2.24 eV and −2.21 eV, respectively. Therefore, the structural and electronic parameters of both structures are depicted in Figure 5a,b. The analogous geometry and electronic data for the remaining sites are shown in the supplementary information file.
The inspection of the geometry of the V=O neighborhood in the T2 site shows the difference between the V=O bond and the remaining V–O ones through which vanadium is bound to the silicon atoms. The latter are longer (V–O bond length ranges between 1.75–1.80 Å) and of single bond character (B.O. = 0.88–1.02). The nucleophilicity of all four oxygen atoms connected to vanadium is comparable; the Mulliken charge varies between −0.47 to −0.50. The parameters characterizing the V=O group in the T3 position are similar. The lengths of the single V–O bonds (1.75–1.80 Å) and their bond orders (0.86–0.99) are comparable to those found for the T2 position. The positively charged vanadium ion (qV = 1.50) is surrounded by the negatively charged oxygen atoms whose charges are almost equal (−0.50–−0.54). The occurrence of the V=O group in the T position results in the presence of the additional Si–OH bond in the proximity of the vanadyl center. In the T2 complex, the negative charge accumulated on this oxygen atom is lower than on those bound to vanadium and equals to − 0.42. When the V=O is present in the T3 position, the charge on this oxygen atom is almost equal to the charge on the remaining oxygen centers (−0.48). The newly formed Si–OH group can be viewed as an additional Brønsted acid center, capable of interaction with reagents. When present in proximity to the V=O center, it may function as an anchor for the reagent, which reacts with the active site. The positive effect of weak and medium Brönsted acid sites was reported for vanadium-containing zeolites applied for hydrocarbon transformations, in particular in propane ODH [12,40].
The density of states (DOS) plots were drawn for all the studied models (see supplementary materials), here only DOS plots designed for the T2 and T3 sites (see Figure 6a,b, respectively) are shown. For the T2 geometry, the valence band is dominated by the contributions from the oxygen atoms, mostly the vanadyl oxygen (=O), but also the oxygen atoms connecting vanadium with the silica atoms. The conduction band originates mainly from the vanadium orbitals. For the T3 geometry, the valence band is dominated by the contribution from the hydroxyl group of the Si–OH group, while the conduction band is dominated by the contributions from the vanadium atom. The fact that the orbitals of the Si–OH fragments form the valence band may have implications for the catalysis. They may become active nucleophilic centers, able to interact with the positively charged reagents, such as e.g., carbocations, as discussed in the previous paragraph. In the case of both structures, the band gap becomes narrower when V=O is introduced into the zeolite matrix. The decrease of the HOMO-LUMO gap is equal to 2.07 eV and 2.75 eV for T2 and T3 sites, respectively.

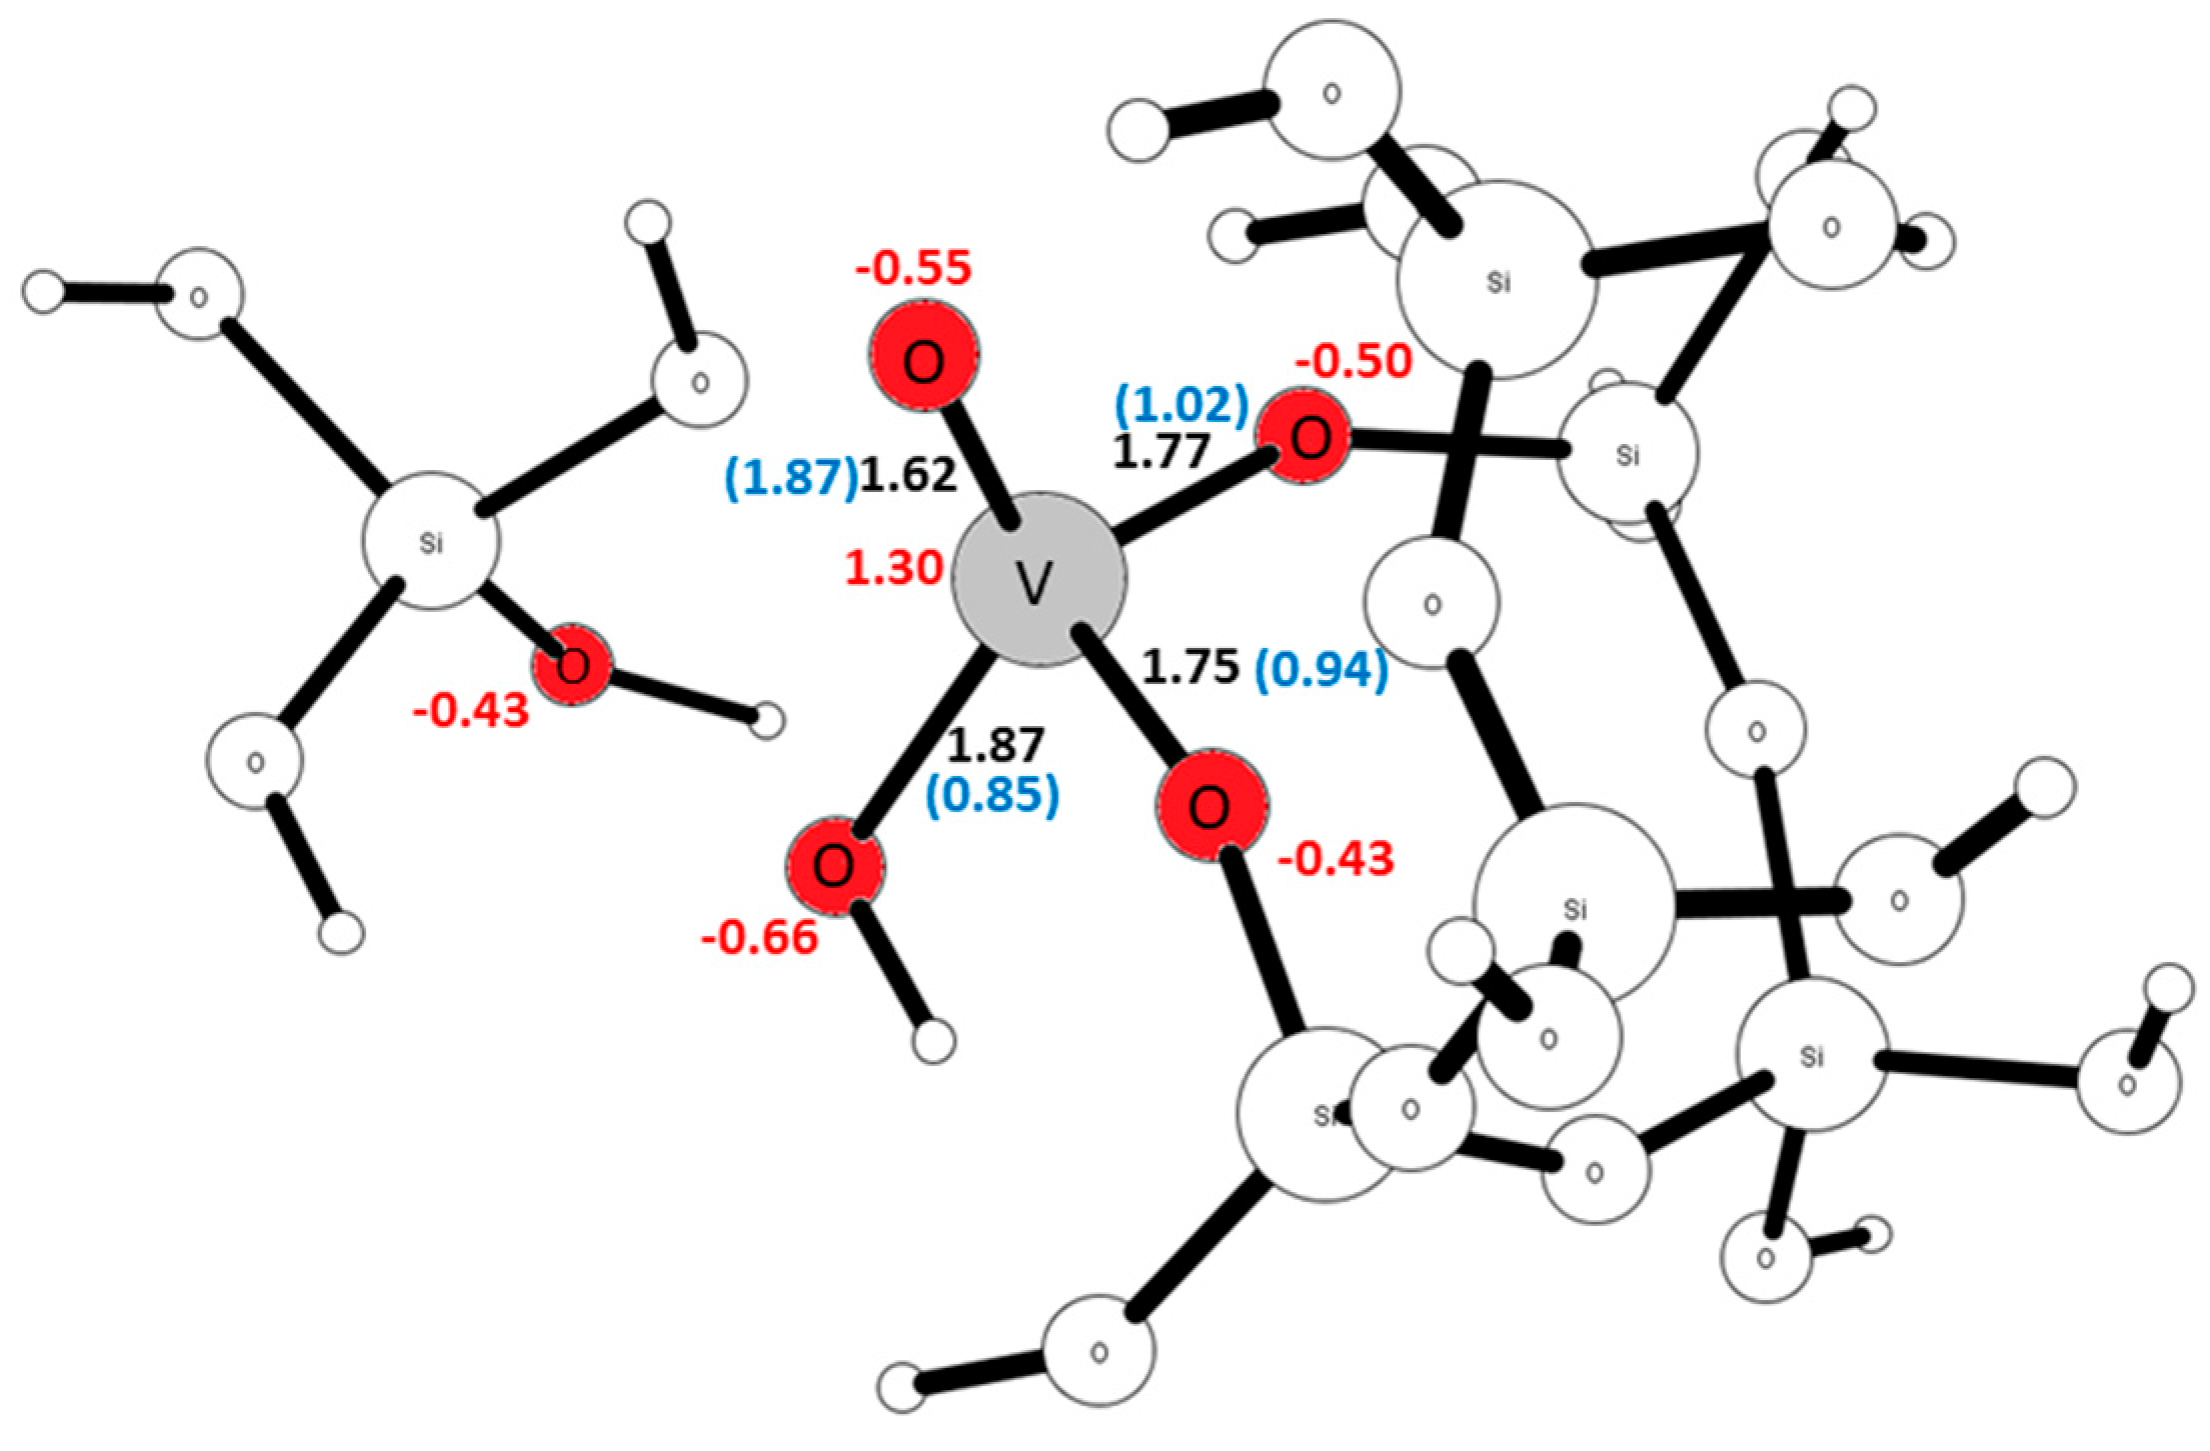
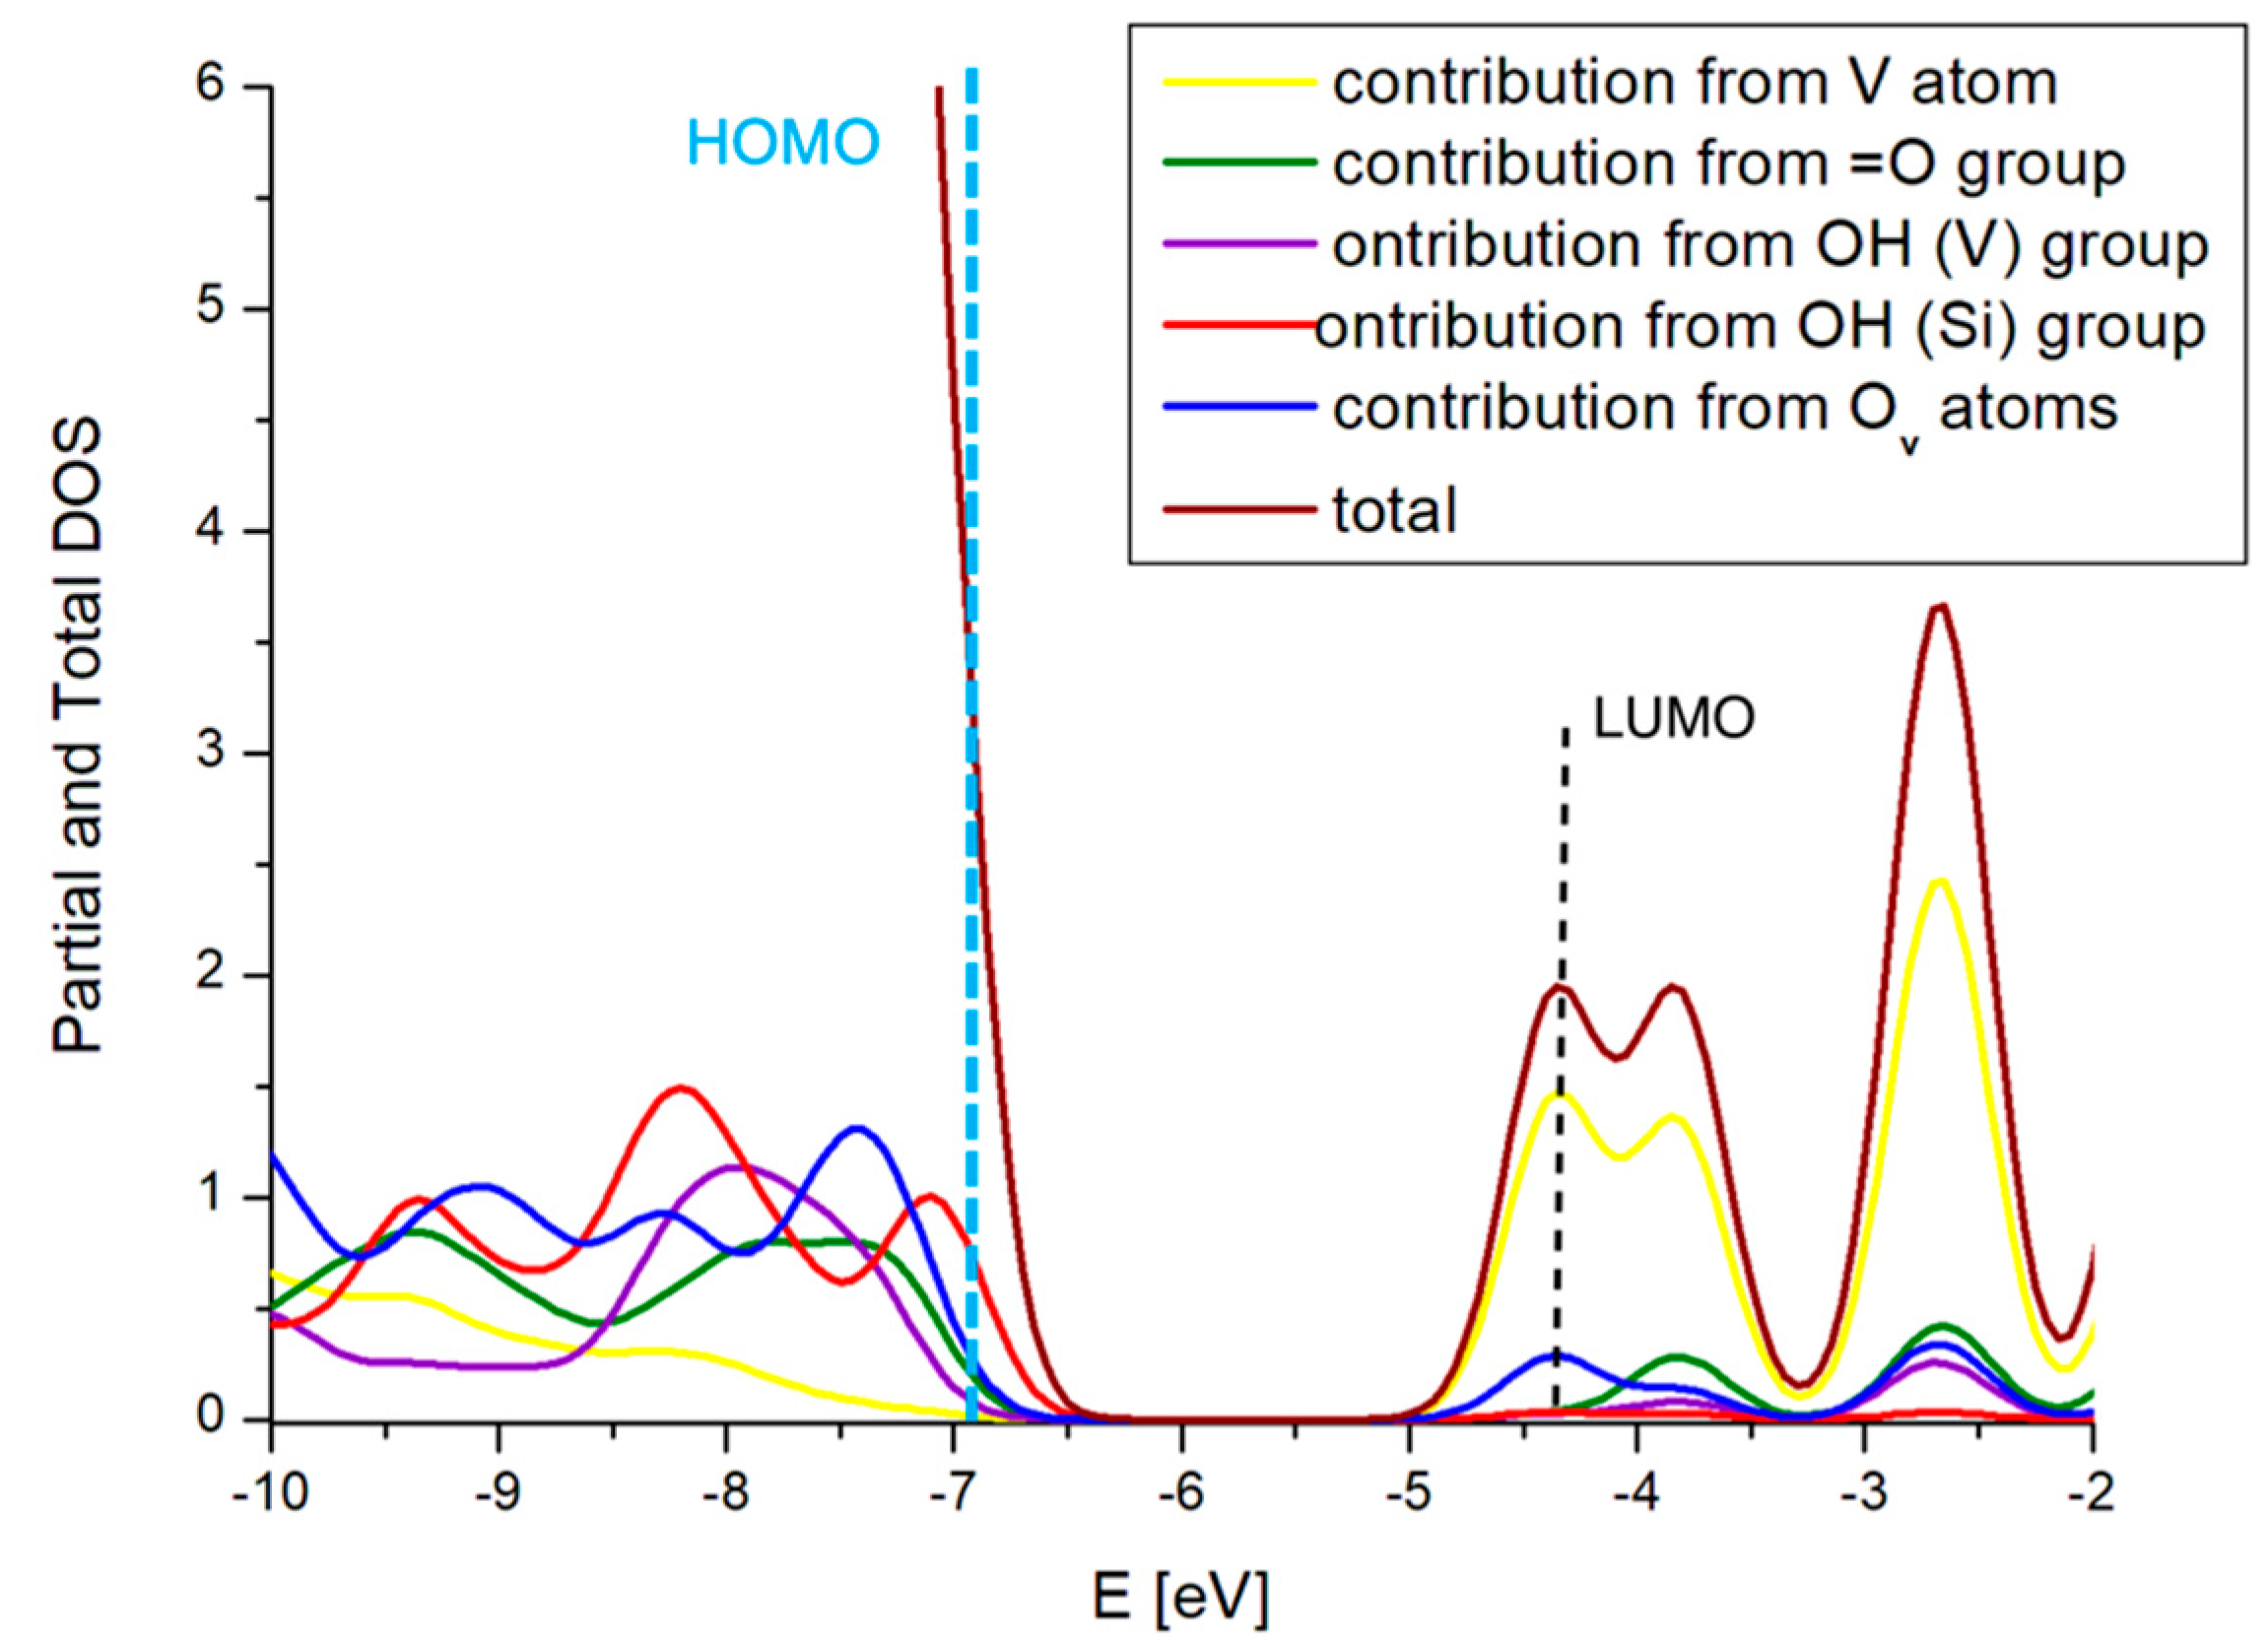
2.3. The Substitution of Si for V(=O)(–OH)

As the last possibility, the isomorphous substitution of silicon for the V(=O)(–OH) group is considered. According to the data gathered in Table 1, such a process is exothermic when vanadium is introduced into all but T1 crystallographic positions, where it costs as much as 1.43 eV. The reaction energies change in order T3 > T2 > T9~T8 > T4 > T5 > T6 > T7. Table 4 collects the V=O and V–OH bond lengths, bond orders, and Mulliken charges accumulated on the V(=O)(–OH) groups.
In the investigated structures, the V=O bond lengths are in the range 1.58–1.62 Å and appropriate bond orders 1.78–2.17. Similarly, as in the case of the V=O moiety discussed in paragraph 2.2., the charges accumulated on vanadium and its oxo ligand depend on the occupied crystallographic position. The charge accumulated on the V atom varies greatly from 0.76 (for the T1 site) up to 1.40 (for the T6 and T9 sites), whereas that on the O rises from −0.34 (for the T1 site) up to −0.61 (for the T9 site). The charging of the OH moiety is more homogeneous throughout the considered set of structures and is in the range between −0.20 (for the T9 site) to −0.38 (for the T5 and T7 sites). The differences are due to the variations in the charge accumulated on the oxygen atoms. The hydroxyl ligand in the V(=O)(–OH) moiety is more negatively charged (more nucleophilic) than when it is the sole ligand of vanadium (see Table 2). The introduction of the V(=O)(–OH) moiety into the T3 position is the most energetically favorable, the energy gain equals to − 2.19 eV. Therefore, Figure 7 depicts the structural and electronic parameters of the structure, while Figure 8 shows the DOS plot.
In this structure, two vanadium-oxygen bonds connecting the V(=O)(–OH) moiety with the silicon atoms have lengths of 1.75 Å and 1.77 Å, which is in between the length of the V–OH bond (1.87 Å) and the V=O bond (1.62 Å). Their bond orders are typical for the single bonds (0.94 and 1.02, respectively). They are negatively charged (Mulliken charges are equal to −0.43 and −0.50), which makes them slightly less nucleophilic than the oxygen atoms from oxo and hydroxo groups of the V(=O)(–OH) site. The substitution of Si by V(=O)(–OH) results in the formation of two hydroxyl groups bound to the zeolitic silicon atom. Their occupied orbitals dominate the valence band of the DOS plot of the structure, indicating that they can be active as nucleophilic centers in catalytic reactions. The conduction band, on the contrary, is dominated by the empty orbitals of the vanadium atom, which can serve as the electrophilic center of the catalyst. The HOMO-LUMO band gap has decreased from 5.31 eV (as found for all Si cluster) to 2.69 eV for the cluster in which the V(=O)(–OH) center was introduced.

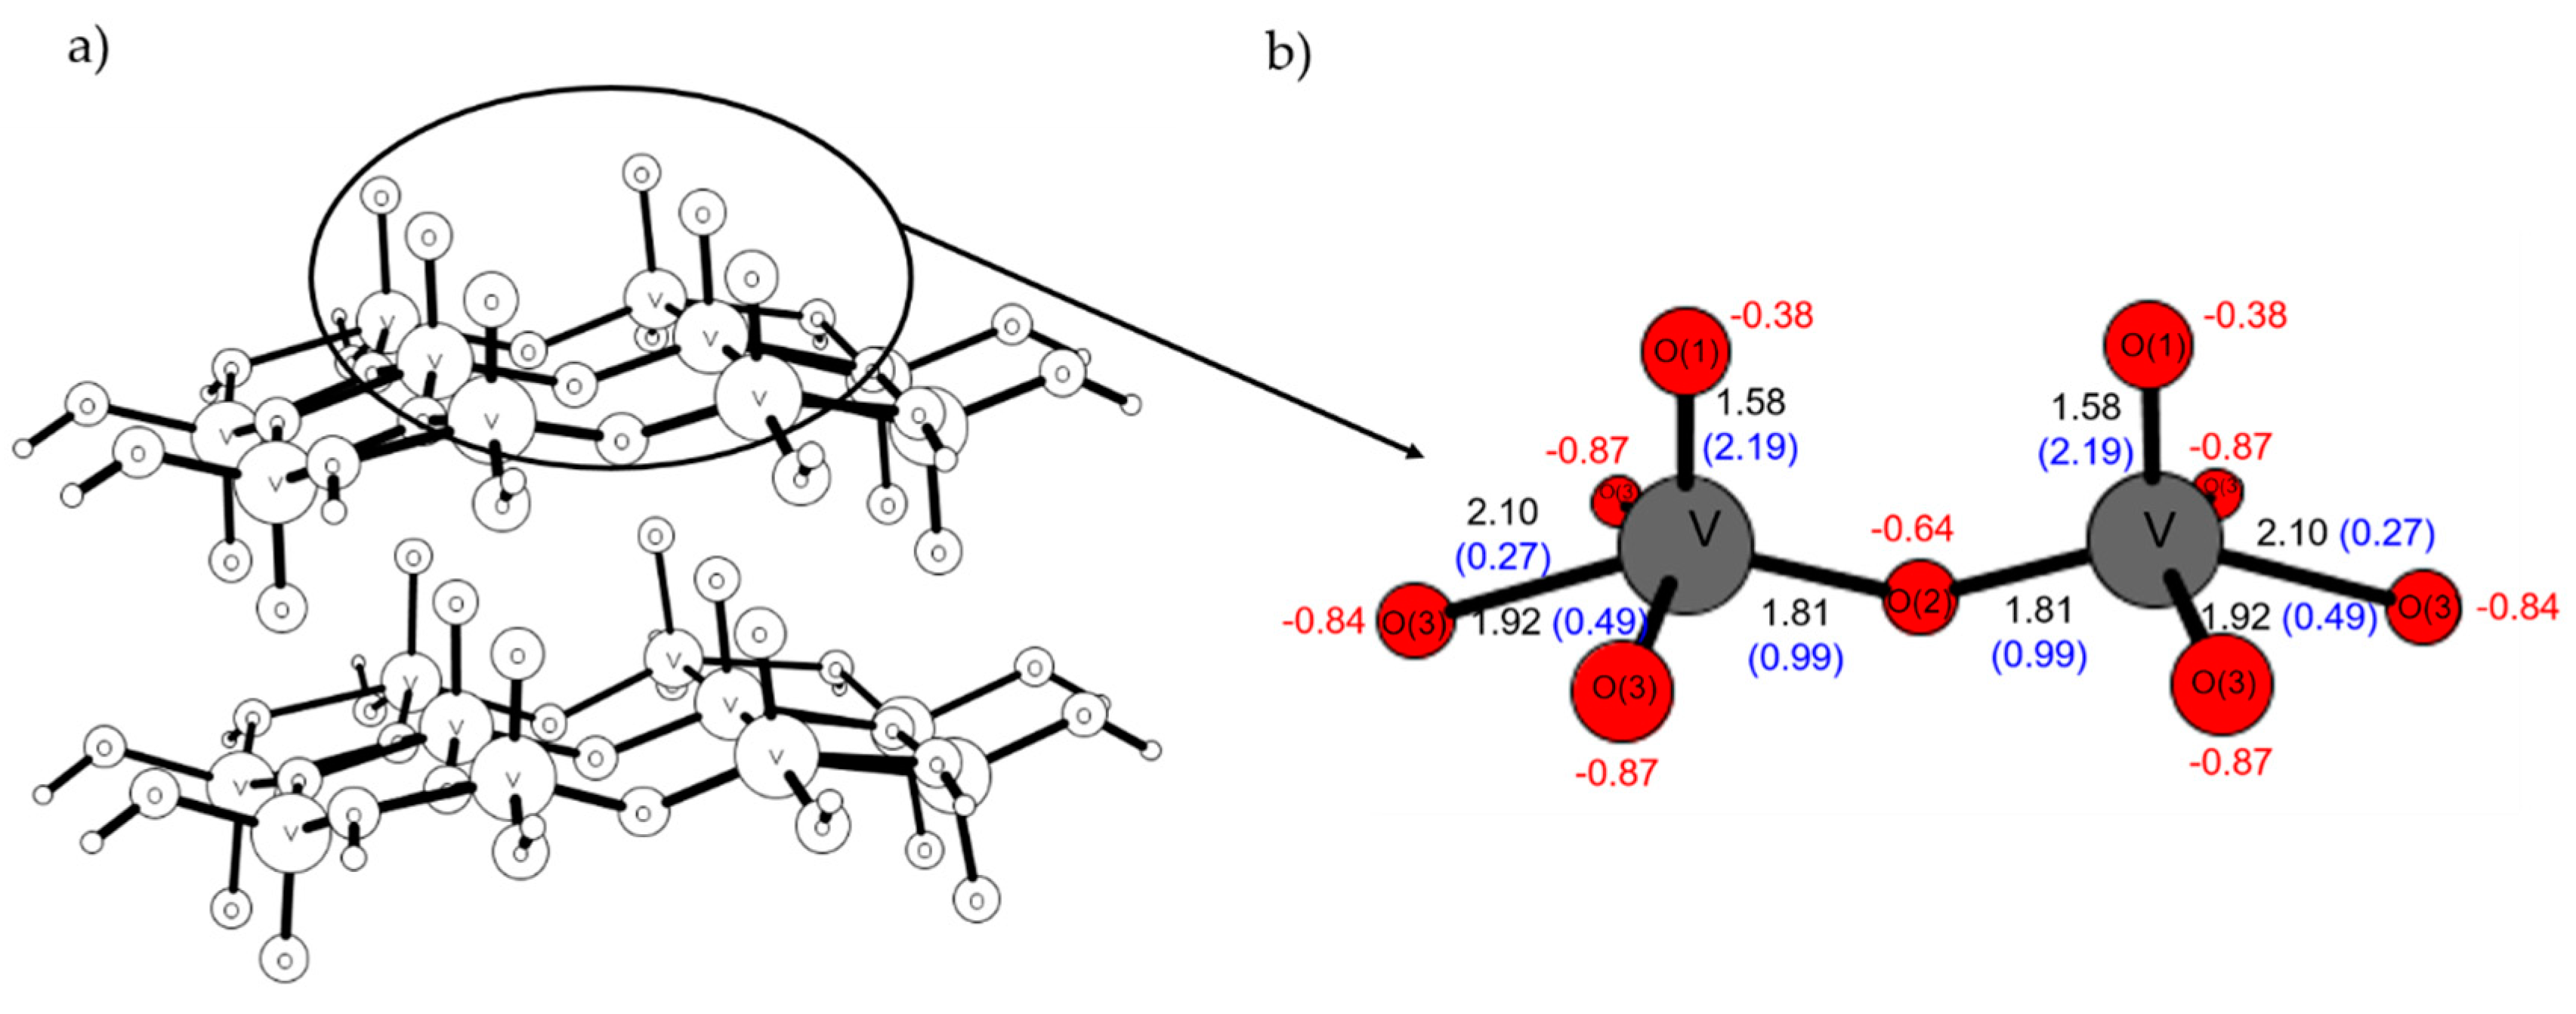
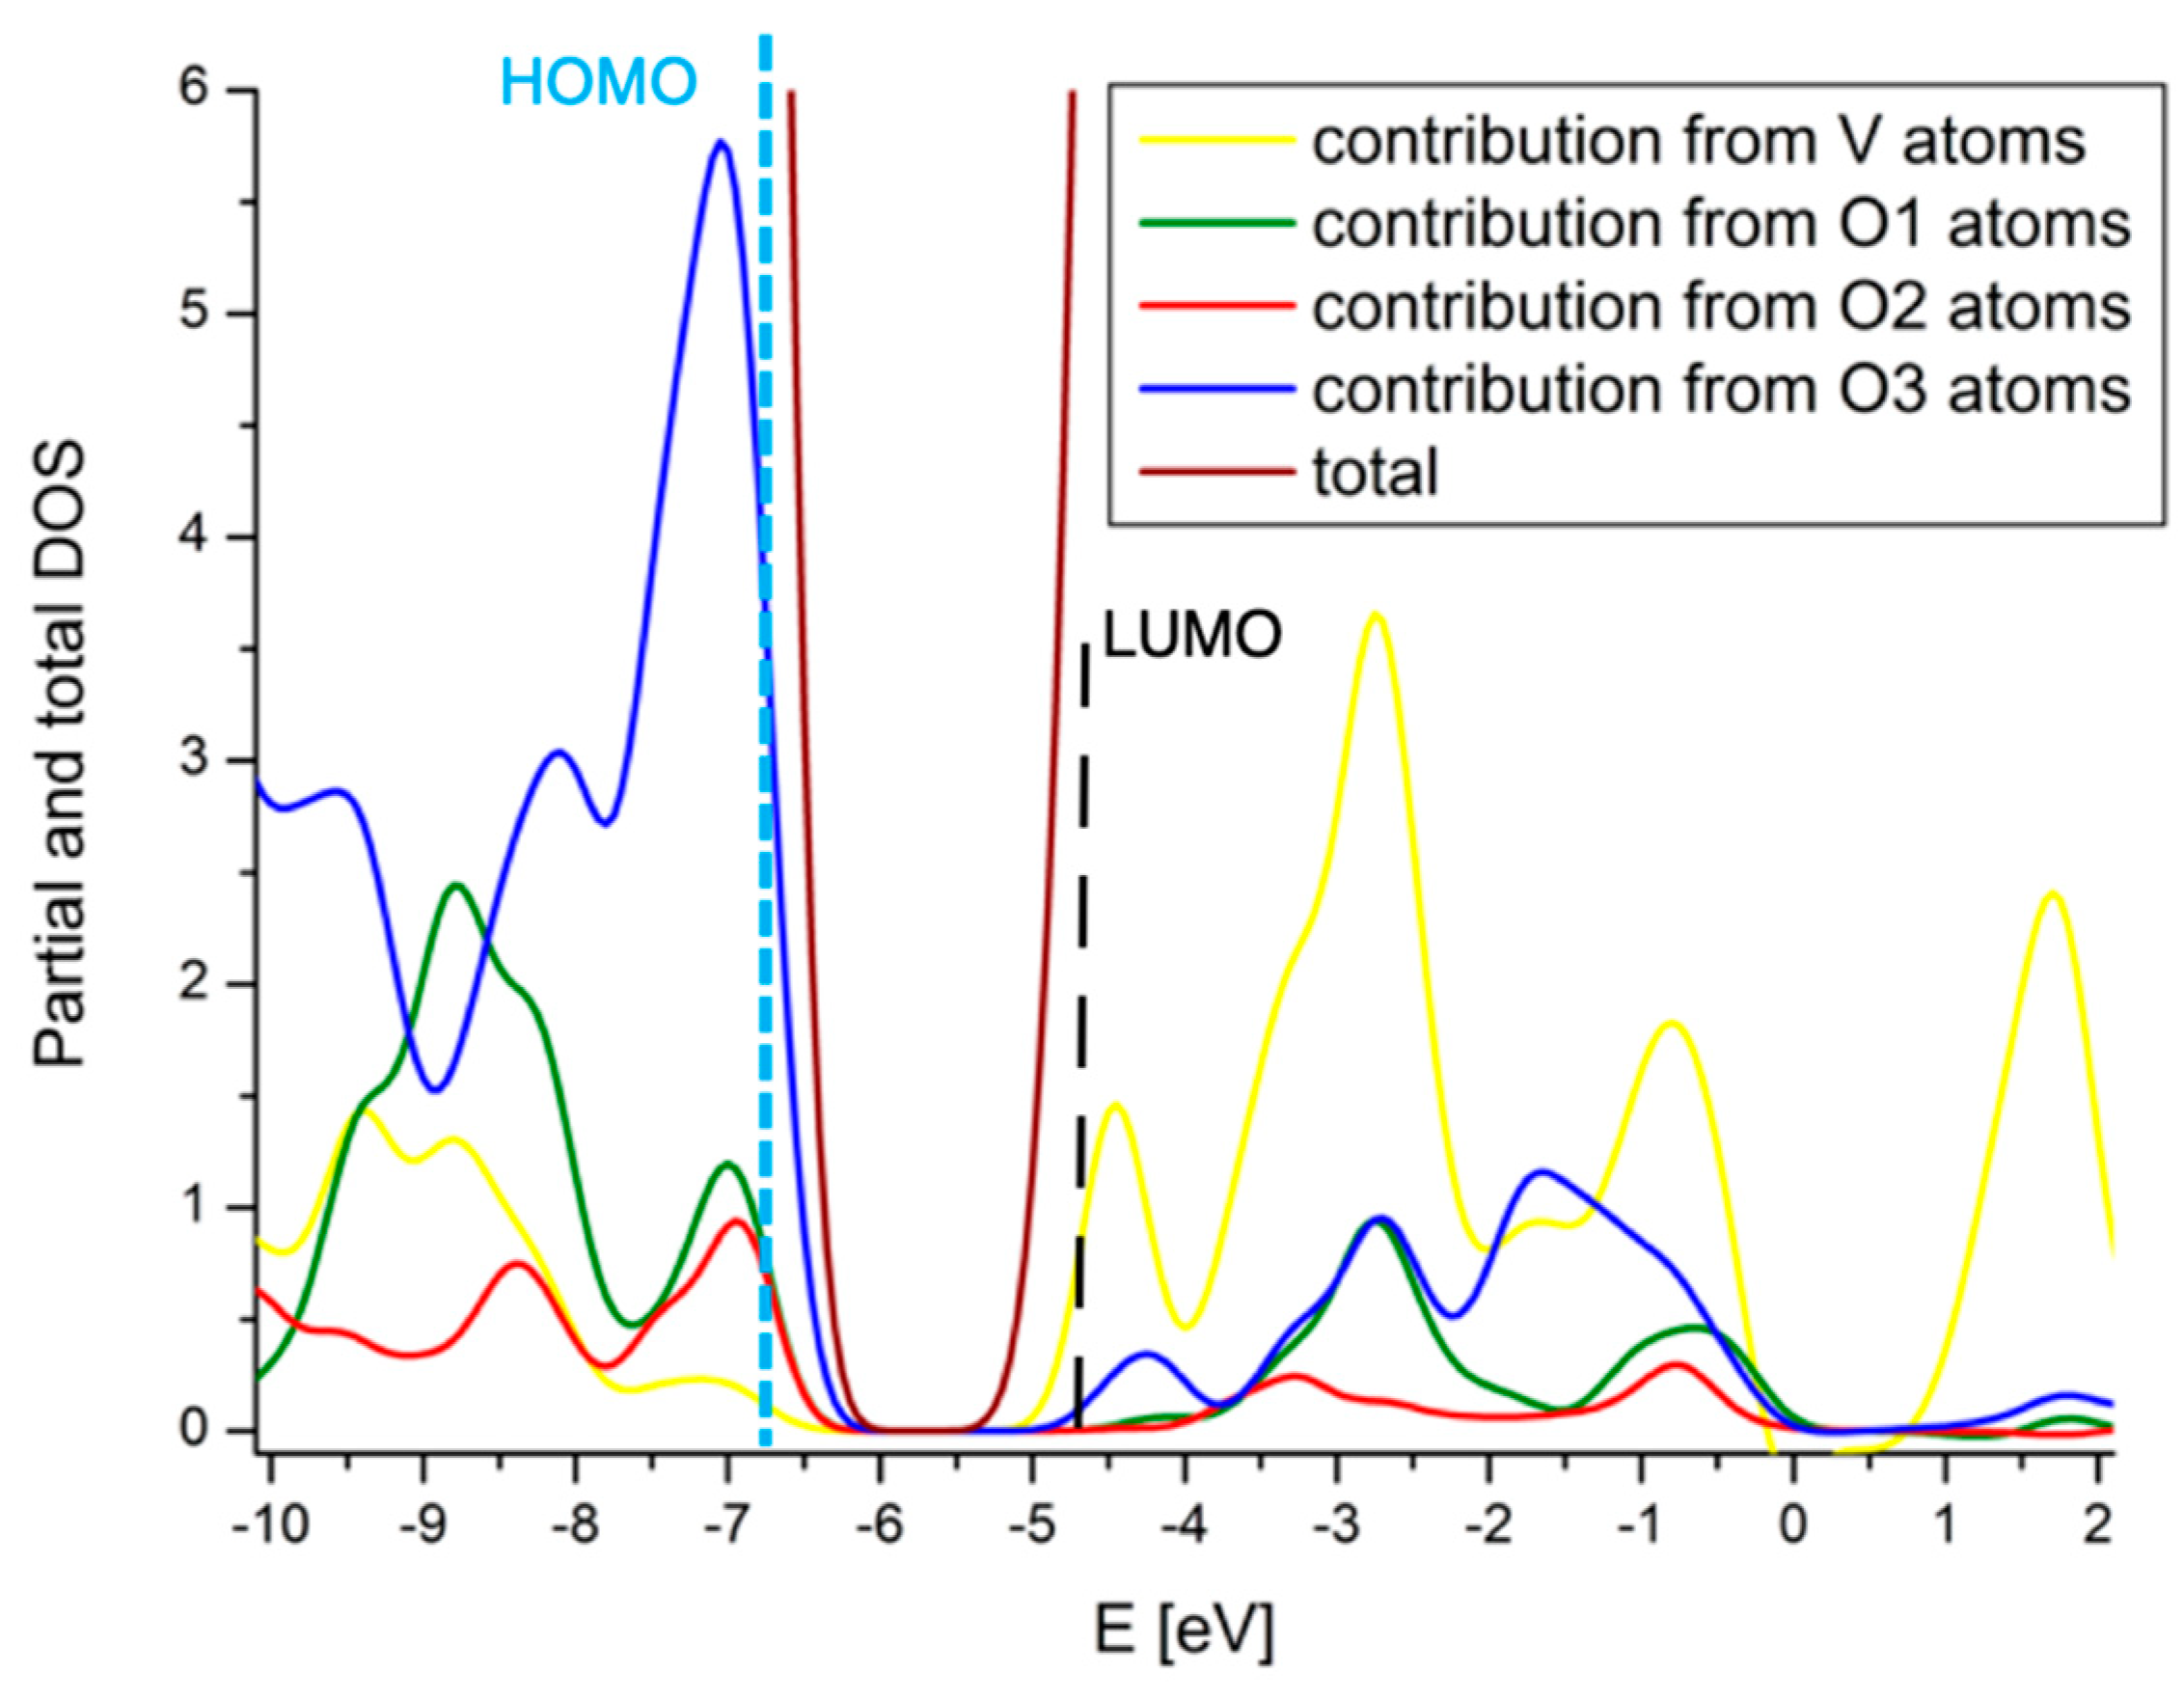
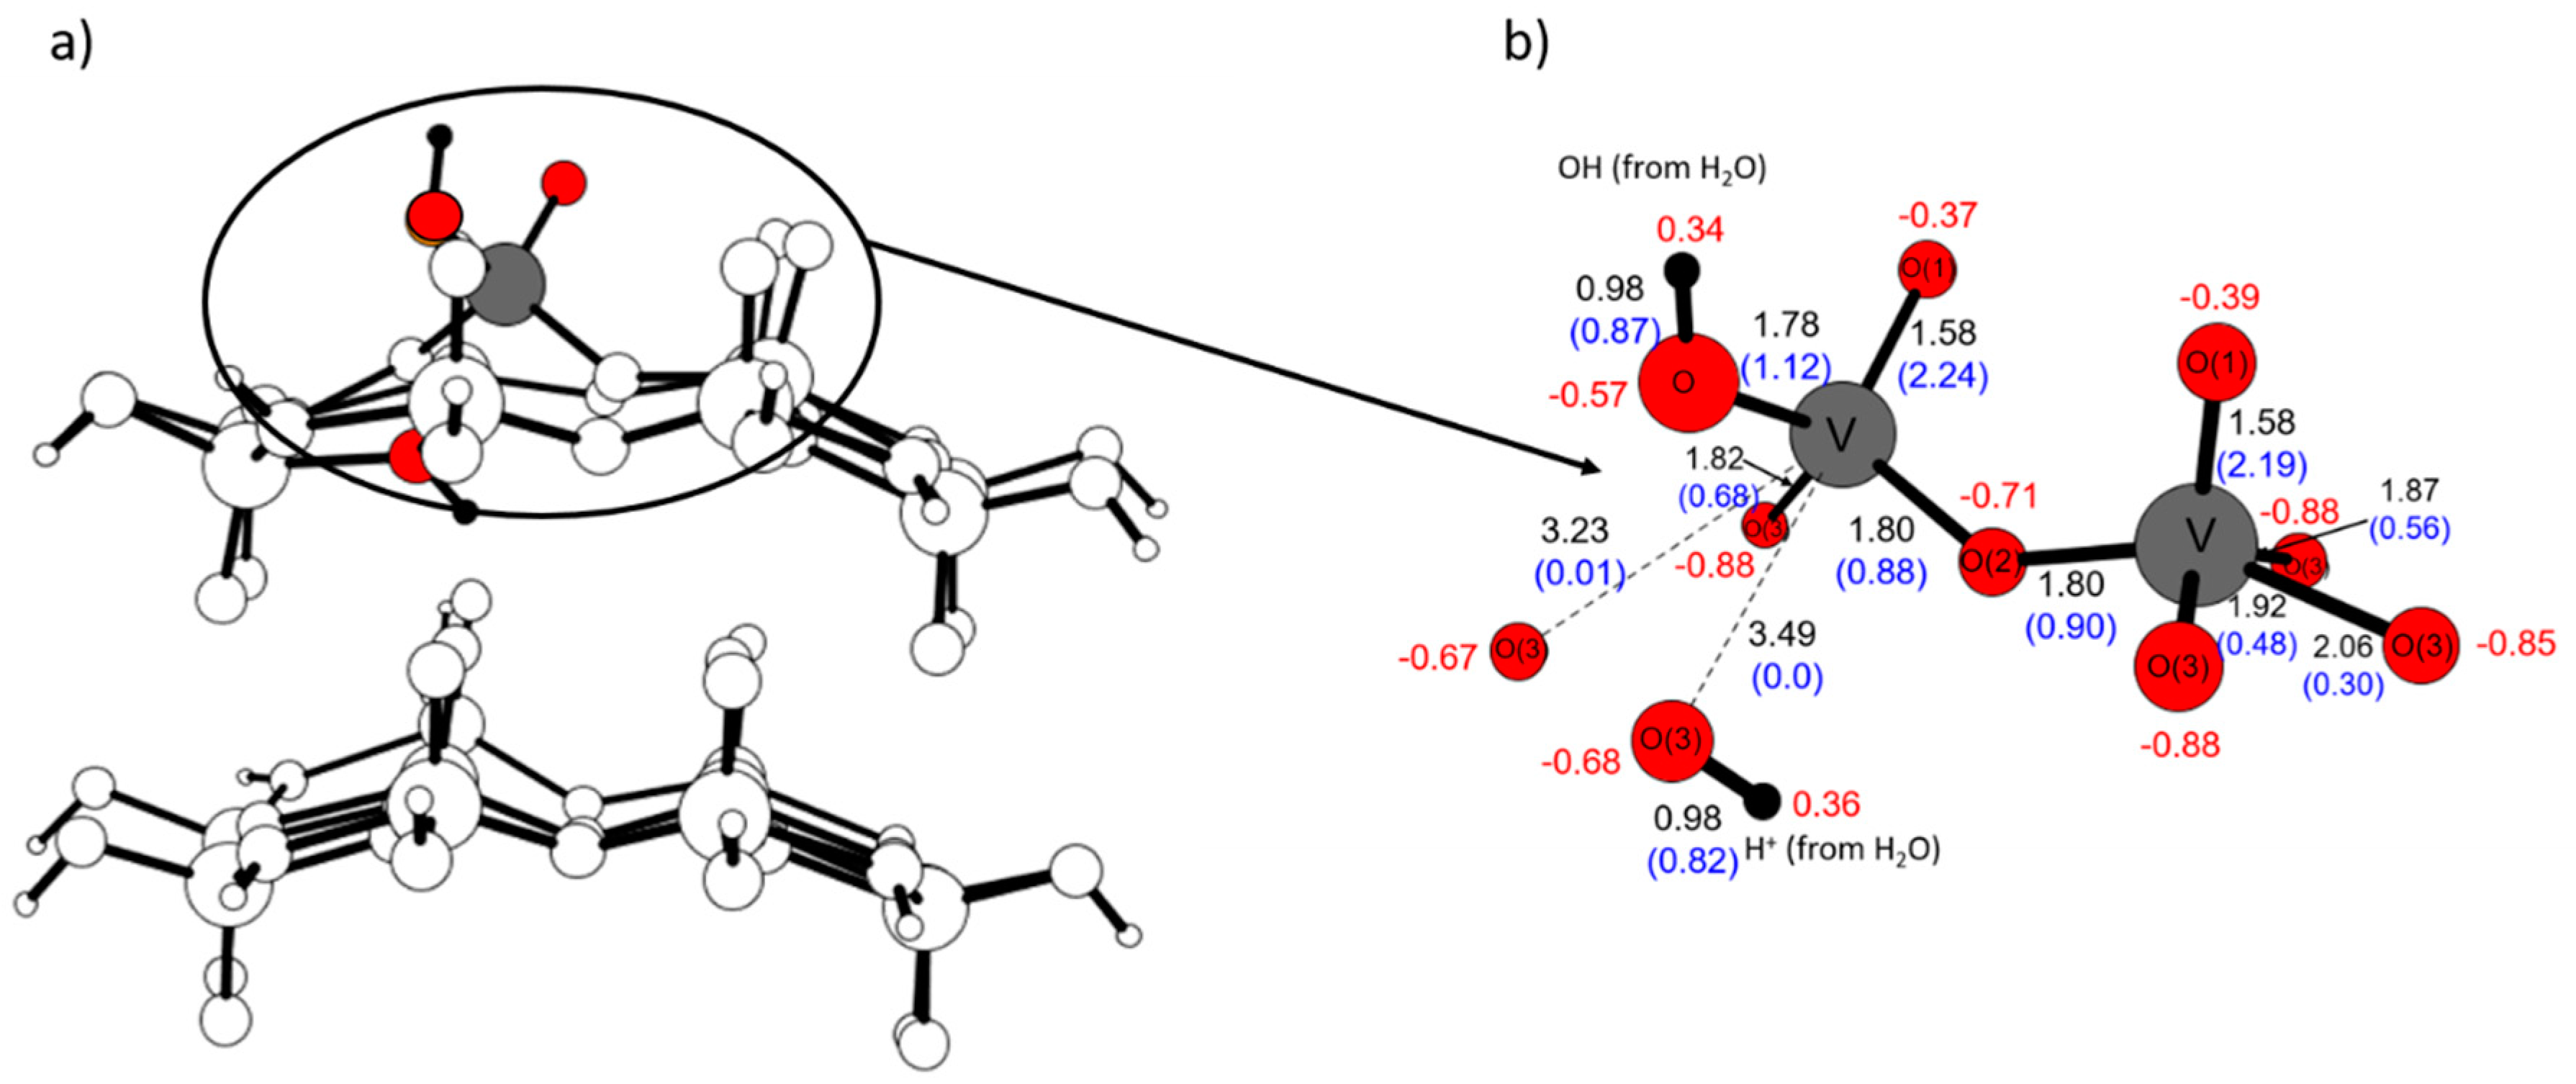
2.4. Comparison with V2O5

The properties of the energetically favorable vanadium sites (in position T2 for V–OH, T2, T3 for V=O and T3 for V(=O)(–OH)) described above, present in the vanadium-substituted BEA zeolite, can be compared with the active centers present on the (010) surface of the most known vanadium catalyst—V2O5 (see Table 5). The electronic structure of V2O5 was a subject of several papers, where the cluster and periodic models and theory on various theory levels was used [23,24,25,26,27,29]. In here, we report the cluster calculations for the (010) V2O5 surface using the V20O62H22 cluster model—see Figure 9a. The same methodology as for the vanadium-substituted BEA models was applied to minimize the influence of the calculations’ parameters (DFT functional, basis set, etc.) on the obtained results. V2O5 has a layered structure in which vanadium-oxygen layers are held together by van der Waals forces. In the present manuscript, the PBE functional is used, which does not describe correctly the dispersion interactions. We have checked how the lack of dispersion in PBE affects our results for V2O5. To do so, we applied the B97-D functional [41] instead of the PBE one and calculated properties of the V20O62H22 cluster. First of all, we checked if inclusion of the dispersion changes the inter-layer distance in V2O5. The distance between vanadium atoms, which are one above the other in two layers, is here used as a measure of the layer–layer distance. The computed values are gathered in Table S2. It is shown that the distance between two layers changes by 7.5% at maximum. Next, the influence of the choice of functional on the computed parameters of the vanadium centers (bond lengths, bond orders, Mulliken charges) was checked; Figure S56 gathers the data obtained for the center with PBE and B97-D functionals. The comparison of the results reveals that the choice of functional has negligible effect on the structural data reported here (bond length changes up to 1.4% at maximum). Bond orders of V–O–V bonds are the most affected electronic parameters (they change by 11%). Figure 9b shows the structural and electronic data obtained for the employed cluster representing vanadium pentoxide. In order to facilitate further discussion and comparison of the geometry and electronic structure parameters of vanadium centers in both environments, the key parameters computed for BEA zeolite and V2O5 are additionally gathered in Table 5.
On the unmodified (010) V2O5 surface one can distinguish three types of oxygen atoms, singly, doubly, and triply coordinated (usually denoted as O(1), O(2), and O(3)) to the vanadium atoms). Their chemical character is different, which can be seen not only from their geometry parameters (bond lengths), but also electronic ones (bond orders, charges).
The singly coordinated oxygen atoms form typical vanadyl groups (V=O) of the 1.58 Å length. The character of their double bond is confirmed by Mayer bond order analysis (bond order equals to 2.19). As compared to the V=O species located in the BEA zeolite, where V=O bond length was found to be 1.60 Å and its bond order 1.93 and 2.00 (for T2 and T3 respectively), see Table 5, the vanadyl groups present on the (010) surface are slightly shorter and stronger (their bond order is higher). The electronic properties of the V=O species are also distinct when present in different environments. On the (010) surface, the vanadium atom is positively charged (Mulliken charge is equal to 1.70), while in the V=O form of BEA, its charge is less positive (charges accumulated on the V atoms in different crystallographic positions are equal to 1.28 and 1.50 (for T2 and T3 respectively)). The vanadyl oxygen on the surface of V2O5 is negatively charged (−0.38), which is less than what was found for the vanadyl oxygens encounters in the BEA zeolite (−0.49 and −0.50). One can conclude that the vanadyl groups would be more nucleophilic when introduced into the zeolite matrix than on the (010) V2O5 surface.
It should be kept in mind that on the (010) V2O5 surface there exist also other types of oxygen atoms (O(2) and O(3)), which can constitute active centers competing with the vanadyl ones. The O(2) oxygens are bound to two vanadium atoms with bonds of 1.81 Å and of bond orders of 0.92 each. The Mulliken charge computed for O(2) is equal to −0.64. The O(3) oxygens are connected to three vanadium atoms with bonds of 1.92 Å, 2.00 Å, and 2.02 Å and bond orders of 0.49, 0.49, and 0.27, respectively. The Mulliken charge computed for O(3) is equal to −0.87. As can be seen, the triply coordinated oxygen atoms would be the most nucleophilic center on the (010) surface, followed by the doubly coordinated oxygen. The singly coordinated one has the least nucleophilic character.
The V2O5 DOS plot is depicted in Figure 10. In V2O5, the valence band is dominated by the oxygen orbitals, mostly coming from the doubly and triply coordinated oxygen atoms. The conduction band is dominated by the empty orbitals of vanadium atoms, which in this case play a role of Lewis acid centers. The character of the V2O5 frontier orbitals is similar to the one found for the vanadium centers introduced into BEA zeolite.
The band gap width (HOMO–LUMO gap) calculated for the model is equal to 2.02 eV, which is in good agreement with experimental values obtained by photoemission (2.35 eV) [42], optical adsorption (2.30 eV) [43], and optical reflectance (2.38 eV) [44]. The difference between the theoretical and experimental values should be attributed to DFT method, which underestimates this property.
The results of the calculations available in the literature [45] show that the formation of –OH surface hydroxyl group is the result of proton/hydrogen stabilization at each oxygen center presented on (010) V2O5. Although the previous calculations (done with the use of single-layer clusters) showed a strong stabilization on the O(1) center, the calculations made for the purposes of this study indicate the dominance of adsorption on the doubly and triply coordinated oxygen atoms. The adsorption at the O(2) and O(3) centers leads to stabilization of the proton between the layers (formation of precursor to vanadium bronzes), and the formation of additional hydrogen bonds makes these adsorption processes energetically preferred. However, the –OH groups formed in this way are inaccessible to the reactants, therefore, for the purpose of the discussion in this paper, we present only surface –OH groups formed with O(1) vanadyl oxygen (geometries of the results obtained for other sites are presented in supplementary materials).
Figure 11 depicts the geometry of the resulting structure with their structural and electronic parameters. The newly formed V–OH groups are characterized by the V–O bonds of 1.74 Å of a single bond character (Mayer bond order equals to 1.21). This is shorter than the analogous bond in the V–OH form of the BEA zeolite (1.84 Å), with Mayer bond order equal to 1.09—see Table 5. The vanadium charge is equal to 1.70, considerably higher than in the V–OH group in the zeolite (1.33). The charge of the OH ligand (−0.13) is not big and comparable to the charge of the same group in the BEA model (−0.17). In this sense, the nucleophilic properties of hydroxyls are similar irrespective of their surroundings.
Figure 12 depicts the DOS plot for the cluster representing the (010) V2O5 surface with two hydroxyl groups. The valence band of such a modified system is still dominated by all types of oxygen atoms, but the contributions from the OH groups are located further from the Fermi level than other oxygen atoms. The conduction band is dominated by the empty orbitals of vanadium atoms. In this respect, it is similar to the DOS plot of the BEA zeolite with the V–OH group. The formation of the hydroxyl species at the (010) surface results in lowering the HOMO–LUMO gap from 2.02 eV–1.17 eV.
Finally, the properties of the V(=O)(–OH) species formed on the (010) V2O5 surface were elucidated. Such centers can be formed upon the dissociative adsorption of water on the clean surface. The heterogeneity of the surface offers many possibilities and various combinations for the adsorption of –OH and H+ fragments. The group –OH, derived from the dissociation of water, can adsorb at the surface (010) on the bare (exposed) vanadium atoms or on the vanadium atom bonded with O(1), whereas the proton can be bound at one of the three surface oxygen atoms O(1), O(2), and O(3) [46]. The geometry of energetically favorable dissociative water adsorption at theV20O62H22 cluster, in which OH is bound to the V(=O) site and the proton is located at the nearby oxygen O(3) type center, is depicted in Figure 13.
In the resulting structure, the vanadium atom forms a double bond of 1.58 Å with the vanadyl oxygen (Mayer bond order equals to 2.24) and a single bond of 1.78 Å with the hydroxyl group (Mayer bond order equals to 1.12). These bond lengths and bond orders are very close to the values found for the isolated V=O and V–OH groups (for V=O 1.58 Å/B.O. 2.19, for V–OH 1.74 Å/B.O. 1.21, respectively). The comparison with the V(=O)(OH) species that can be encountered in the BEA zeolite reveals that both the V=O and V–OH bonds are in general shorter and stronger on the (010) surface than in the zeolitic environment (for V=O 1.62 Å, B.O. 1.87, for V–OH 1.83 Å, B.O. 0.85, respectively) —see Table 5. This discrepancy may be due to the differences in charges accumulated on the fragments. When the V(=O)(–OH) group is present on the surface of vanadium pentoxide, the positive charge on vanadium is higher and equals to 1.41 vs. 1.30 in the BEA zeolite. The negative charge of the vanadyl oxo group is smaller (−0.37) than in most T2 positions in the zeolite (−0.55), similar to the net charge on –OH, which is also smaller on vanadium surfaces (equals −0.23), compared to −0.35 founded in T3 site in zeolite. This indicates that they constitute stronger nucleophilic sites, able to interact with e.g., hydrocarbons.
The inspection of the DOS plot for the surface modified by the presence of the V(=O)(–OH) site (depicted in Figure 14) reveals that the valence band is composed of oxygen atom orbitals (mostly triply coordinated). The band originating from the OH fragment is shifted deeper than from other oxygen moieties. The conduction band is composed mostly of vanadium orbitals.

3. Methods

The present computational studies were performed by means of Density Functional Theory (DFT), as implemented in Turbomole v6.3 [47]. The Perdew–Burke–Ernzerhof (PBE) functional was used with def2-TZVP basis set [48] for all atoms. Resolution of Identity (RI) approach [49,50] was applied for computing the electronic Coulomb interactions. The electronic properties of the systems were studied with the aid of Mulliken Population Analysis [51]. Additionally, Mayer bond orders and density-of-states (DOS) spectra were calculated using the AOMix program [52,53].
For the geometry optimizations, all atoms were allowed to relax, except for the hydrogen atoms saturating dangling Si–O/V–O bonds, resulting from cutting the models out of the crystal geometry. The frequency calculations were done in order to check if the resulting structures were the minima on the potential energy surface.

4. Conclusions

The present DFT calculations suggest that vanadium could substitute T atoms in all available nine crystallographic positions in BEA. As the V–OH group, vanadium center is bound preferentially in the T2 position. Vanadium could be present as the V=O moiety in T2 or T3 positions, but the energy difference between the two is too low to draw any definite conclusions regarding the preference as to its sitting. The introduction of the V=O center generates an additional acidic site in its proximity, which may act as an anchor for reagents. The most energetically favored position for the V(=O)(–OH) group is T3. The analysis of Mulliken charges accumulated on oxo and hydroxyl centers indicates their nucleophilic character. Their dominance in the valence band (as revealed by DOS plots) points out that both oxygen species may play an active role in catalysis, in particular in redox processes.
The parameters of the V=O, V–OH, and V(=O)(–OH) groups present in the BEA zeolite were then compared with the characteristics of the same species on the most abundant (010) V2O5 surface. While at the surface of the oxide, vanadium forms shorter and stronger (in terms of bond order indices) bonds with oxygen ligands. The V=O species are more nucleophilic being introduced into the BEA structure than on the (010) V2O5 surface. In the former system, they can become the sites actively participating in catalytic events. On contrary, on the unmodified (010) V2O5 surface, there exist sites of higher nucleophilicity than V=O—triply and doubly coordinated oxygen atoms—which may be more relevant for catalysis. Similarly, the V(=O)(–OH) group has more nucleophilic character when introduced into BEA and hence would be more relevant for catalysis than a similar group on V2O5.

Supplementary Materials

The following are available online at https://0-www-mdpi-com.brum.beds.ac.uk/2073-4344/10/9/1080/s1, Figure S1: Clusters of various sizes representing the T3 center used to check the convergence of calculations. Figure S2: Computed parameters of V–OH center in T1 position (black—bond lengths in Å; blue, in parentheses—bond order indices; red—Mulliken charges), Figure S3: DOS plot for the system in which V–OH center is in T1 position, Figure S4: Computed parameters of V–OH center in T2 position (black—bond lengths in Å; blue, in parentheses—bond order indices; red—Mulliken charges), Figure S5: DOS plot for the system in which V–OH center is in T2, Figure S6: Computed parameters of V–OH center in T3 position (black—bond lengths in Å; blue, in parentheses—bond order indices; red—Mulliken charges), Figure S7: DOS plot for the system in which V–OH center is in T3 position, Figure S8: Computed parameters of V–OH center in T4 position (black—bond lengths in Å; blue, in parentheses—bond order indices; red—Mulliken charges), Figure S9: DOS plot for the system in which V–OH center is in T4 position, Figure S10: Computed parameters of V–OH center in T5 position (black—bond lengths in Å; blue, in parentheses—bond order indices; red—Mulliken charges), Figure S11: DOS plot for the system in which V–OH center is in T5 position, Figure S12: Computed parameters of V–OH center in T6 position black—bond lengths in Å; blue, in parentheses—bond order indices; red—Mulliken charges), Figure S13: DOS plot for the system in which V–OH center is in T6 position, Figure S14: Computed parameters of V–OH center in T7 position black—bond lengths in Å; blue, in parentheses—bond order indices; red—Mulliken charges), Figure S15: DOS plot for the system in which V–OH center is in T7 position, Figure S16: Computed parameters of V–OH center in T8 position (black—bond lengths in Å; blue, in parentheses—bond order indices; red—Mulliken charges), Figure S17: DOS plot for the system in which V–OH center is in T8 position, Figure S18: Computed parameters of V–OH center in T9 position (black—bond lengths in Å; blue, in parentheses—bond order indices; red—Mulliken charges), Figure S19: DOS plot for the system in which V–OH center is in T9 position, Figure S20: Computed parameters of V=O center in T1 position (black—bond lengths in Å; blue, in parentheses—bond order indices; red—Mulliken charges), Figure S21: DOS plot for the system in which V=O center is in T1 position, Figure S22: Computed parameters of V=O center in T2 position (black—bond lengths in Å; blue, in parentheses—bond order indices; red—Mulliken charges), Figure S23: DOS plot for the system in which V=O center is in T2, Figure S24: Computed parameters of V=O center in T3 position (black—bond lengths in Å; blue, in parentheses—bond order indices; red—Mulliken charges), Figure S25: DOS plot for the system in which V=O center is in T3 position, Figure S26: Computed parameters of V=O center in T4 position (black—bond lengths in Å; blue, in parentheses—bond order indices; red—Mulliken charges), Figure S27: DOS plot for the system in which V=O center is in T4 position, Figure S28: Computed parameters of V=O center in T5 position (black—bond lengths in Å; blue, in parentheses—bond order indices; red—Mulliken charges), Figure S29: DOS plot for the system in which V=O center is in T5 position, Figure S30: Computed parameters of V=O center in T6 position (black—bond lengths in Å; blue, in parentheses—bond order indices; red—Mulliken charges), Figure S31: DOS plot for the system in which V=O center is in T6 position, Figure S32: Computed parameters of V=O center in T7 position (black—bond lengths in Å; blue, in parentheses—bond order indices; red—Mulliken charges), Figure S33: DOS plot for the system in which V=O center is in T7 position, Figure S34: Computed parameters of V=O center in T8 position (black—bond lengths in Å; blue, in parentheses—bond order indices; red—Mulliken charges), Figure S35: DOS plot for the system in which V=O center is in T8 position, Figure S36: Computed parameters of V=O center in T9 position (black—bond lengths in Å; blue, in parentheses—bond order indices; red—Mulliken charges), Figure S37: DOS plot for the system in which V=O center is in T9 position, Figure S38: Computed parameters of V(=O)(–OH) center in T1 position (black—bond lengths in Å; blue, in parentheses—bond order indices; red—Mulliken charges), Figure S39: DOS plot for the system in which V(=O)(–OH) center is in T1 position, Figure S40: Computed parameters of V(=O)(–OH) center in T2 position (black—bond lengths in Å; blue, in parentheses—bond order indices; red—Mulliken charges), Figure S41: DOS plot for the system in which V(=O)(–OH) center is in T2, Figure S42: Computed parameters of V(=O)(–OH) center in T3 position (black—bond lengths in Å; blue, in parentheses—bond order indices; red—Mulliken charges), Figure S43: DOS plot for the system in which V(=O)(–OH) center is in T3 position, Figure S44: Computed parameters of V(=O)(–OH) center in T4 position (black—bond lengths in Å; blue, in parentheses—bond order indices; red—Mulliken charges), Figure S45: DOS plot for the system in which V(=O)(–OH) center is in T4 position, Figure S46: Computed parameters of V(=O)(–OH) center in T5 position (black—bond lengths in Å; blue, in parentheses—bond order indices; red—Mulliken charges), Figure S47: DOS plot for the system in which V(=O)(–OH) center is in T5 position, Figure S48: Computed parameters of V(=O)(–OH) center in T6 position (black—bond lengths in Å; blue, in parentheses—bond order indices; red—Mulliken charges), Figure S49: DOS plot for the system in which V(=O)(–OH) center is in T6 position, Figure S50: Computed parameters of V(=O)(–OH) center in T7 position (black—bond lengths in Å; blue, in parentheses—bond order indices; red—Mulliken charges), Figure S51: DOS plot for the system in which V(=O)(–OH) center is in T7 position, Figure S52: Computed parameters of V(=O)(–OH) center in T8 position (black—bond lengths in Å; blue, in parentheses—bond order indices; red—Mulliken charges), Figure S53: DOS plot for the system in which V(=O)(–OH) center is in T8 position, Figure S54: Computed parameters of V(=O)(–OH) center in T9 position (black—bond lengths in Å; blue, in parentheses—bond order indices; red—Mulliken charges), Figure S55: DOS plot for the system in which V(=O)(–OH) center is in T9 position, Figure S56: Comparison of the computed parameters (Mulliken charges at selected atoms, bond distances [Å] and Mayer bond order indices) with PBE and B97-D functionals: V20O62H24 cluster, Table S1: Comparison of the selected parameters for V–OH (T3 site) as a function of the cluster size, Table S2: Distances [Å] between vanadium atoms from the first and the second layer of the V20O62H24 cluster computed with B97-D functional.

Author Contributions

A.D.-M.: DFT calculations, data analysis, and discussion; R.T.-S.: DFT calculations, data analysis, and discussion; M.W.: data analysis and discussion; D.R.-Z.: conceptualization, data analysis, discussion and manuscript preparation. All authors have read and agreed to the published version of the manuscript.

Funding

This work was supported by the National Science Centre, Poland within project no 2016/23/B/ST4/02854. The work of R.T.S. and M.W. was done within the statutory funds of the Jerzy Haber Institute of Catalysis and Surface Chemistry, PAS. This research was supported in part by PL-Grid Infrastructure. This publication is in part based upon work from COST Action 18234, supported by COST (European Cooperation in Science and Technology).

Acknowledgments

This article is dedicated to honor Gerhard Ertl for his 85th birthday, a key figure in the topic of heterogeneous catalysis. M.W. is particularly thankful to Ertl for his help and kindness shown during her stay at FHI MPG in Berlin.

Conflicts of Interest

The authors declare no conflict of interest.

References

  1. Cornils, B.; Herrmann, W.A.; Wong, C.-H.; Zanthoff, H.-W. Catalysis from A to Z. A Concise Encyclopedia; Wiley-VCH Verlag GmbH & Co. KGaA: Weinheim, Germany, 2013. [Google Scholar]
  2. Carrero, C.A.; Schloegl, R.; Wachs, I.E.; Schomaecker, R. Critical Literature Review of the Kinetics for the Oxidative Dehydrogenation of Propane over Well-Defined Supported Vanadium Oxide Catalysts. ACS Catal. 2014, 4, 3357–3380. [Google Scholar] [CrossRef]
  3. Langeslay, R.R.; Kaphan, D.M.; Marshall, C.L.; Stair, P.C.; Sattelberger, A.P.; Delferro, M. Catalytic Applications of Vanadium: A Mechanistic Perspective. Chem. Rev. 2019, 119, 2128–2191. [Google Scholar] [CrossRef] [PubMed]
  4. Cavani, F.; Trifirò, F. The oxidative dehydrogenation of ethane and propane as an alternative way for the production of light olefins. Catal. Today 1995, 24, 307–313. [Google Scholar] [CrossRef]
  5. Grasselli, R.K. Fundamental Principles of Selective Heterogeneous Oxidation Catalysis. Top. Catal. 2002, 21, 79–88. [Google Scholar] [CrossRef]
  6. Knotek, P.; Čapek, L.; Bulánek, R.; Adam, J. Vanadium supported on hexagonal mesoporous silica: Active and stable catalysts in the oxidative dehydrogenation of alkanes. Top. Catal. 2007, 45, 51–55. [Google Scholar] [CrossRef]
  7. Han, Z.-F.; CXue, X.-L.; Wu, H.-M.; Lang, W.-Z.; Guo, Y.-J. Preparation and catalytic properties of mesoporous nV-MCM-41 for propane oxidative dehydrogenation in the presence of CO2. Chin. J. Catal. 2018, 39, 1099–1109. [Google Scholar] [CrossRef]
  8. Nguyen, L.D.; Loridant, S.; Launay, H.; Pigamo, A.; Dubois, J.L.; Millet, J.M.M. Study of new catalysts based on vanadium oxide supported on mesoporous silica for the partial oxidation of methane to formaldehyde: Catalytic properties and reaction mechanism. J. Catal. 2006, 237, 38–48. [Google Scholar] [CrossRef]
  9. Wallis, P.; Wohlrab, S.; Kelevaru, V.N.; Frank, M.; Martin, A. Impact of support pore structure and morphology on catalyst performance of VOx/SBA-15 for selective methane oxidation. Catal. Today 2016, 278, 120–126. [Google Scholar] [CrossRef]
  10. Baran, R.; Millot, Y.; Onfroy, T.; Averseng, F.; Krafft, J.-M.; Dzwigaj, S. Influence of the preparation procedure on the nature and environment of vanadium in VSiBEA zeolite: XRD, DR UV–vis, NMR, EPR and TPR studies. Microporous Mesoporous Mater. 2012, 161, 179–186. [Google Scholar] [CrossRef]
  11. El-Roz, M.; Lakiss, L.; Telegeiev, I.; Lebedev, O.I.; Bazin, P.; Vicente, A.; Fernandez, C.; Valtchev, V. High-Visible-Light Photoactivity of Plasma-Promoted Vanadium Clusters on Nanozeolites for Partial Photooxidation of Methanol. ACS Appl. Mater. Interfaces 2017, 9, 17846–17855. [Google Scholar] [CrossRef]
  12. Smoliło, M.; Samson, K.; Zhou, T.; Duraczyńska, D.; Ruggiero-Mikołajczyk, M.; Drzewiecka-Matuszek, A.; Rutkowska-Zbik, D. Oxidative Dehydrogenation of Propane over Vanadium-Containing Faujasite Zeolite. Molecules 2020, 25, 1961. [Google Scholar]
  13. Lie Bøyesen, K.; Meneau, F.; Mathisen, K. A combined in situ XAS/Raman and WAXS study on nanoparticulate V2O5 in zeolites ZSM-5 and Y. Phase Transit. 2011, 84, 675–686. [Google Scholar] [CrossRef]
  14. Chalupka, K.; Thomas, C.; Millot, Y.; Averseng, F.; Dzwigaj, S. Mononuclear pseudo-tetrahedral V species of VSiBEA zeolite as the active sites of the selective oxidative dehydrogenation of propane. J. Catal. 2013, 305, 46–55. [Google Scholar] [CrossRef]
  15. Held, A.; Kowalska-Kuś, J.; Millot, Y.; Averseng, F.; Calers, C.; Valentin, L.; Dzwigaj, S. Influence of the Preparation Procedure of Vanadium-Containing SiBEA Zeolites on Their Catalytic Activity in Propene Epoxidation. J. Phys. Chem. C 2018, 122, 18570–18582. [Google Scholar] [CrossRef]
  16. Tranca, D.C.; Keil, F.J.; Tranca, I.; Calatayud, M.; Dzwigaj, S.; Trejda, M.; Tielens, F. Methanol Oxidation to Formaldehyde on VSiBEA Zeolite: A Combined DFT/vdW/Transition Path Sampling and Experimental Study. J. Phys. Chem. C 2015, 119, 13619–13631. [Google Scholar] [CrossRef]
  17. Baran, R.; Onfroy, T.; Grzybek, T.; Dzwigaj, T. Influence of the nature and environment of vanadium in VSiBEA zeolite on selective catalytic reduction of NO with ammonia. Appl. Catal. B Environ. 2013, 136–137, 186–192. [Google Scholar] [CrossRef]
  18. Tielens, F. Exploring the reactivity of intraframework vanadium, niobium and tantalum sites in zeolitic materials using the molecular electrostatic potential. J. Mol. Struct. THEOCHEM 2009, 903, 23–27. [Google Scholar] [CrossRef]
  19. Tielens, F.; Calatayud, M.; Dzwigaj, S.; Che, M. What do vanadium framework sites look like in redox model silicate zeolites? Microporous Mesoporous Mater. 2009, 119, 137–143. [Google Scholar] [CrossRef]
  20. Tielens, F.; Trejda, M.; Ziolek, M.; Dzwigaj, S. Nature of vanadium species in V substituted zeolites: A combined experimental and theoretical study. Catal. Today 2008, 139, 221–226. [Google Scholar] [CrossRef]
  21. Tielens, F.; Dzwigaj, S. Probing acid–base sites in vanadium redox zeolites by DFT calculation and compared with FTIR results. Catal. Today 2010, 152, 66–69. [Google Scholar] [CrossRef]
  22. Wojtaszek, A.; Ziolek, M.; Dzwigaj, S.; Tielens, F. Comparison of competition between T=O and T–OH groups in vanadium, niobium, tantalum BEA zeolite and SOD based zeolites. Chem. Phys. Lett. 2011, 514, 70–73. [Google Scholar] [CrossRef]
  23. Witko, M.; Tokarz-Sobieraj, R. Surface oxygen in catalysts based on transition metal oxides—What can we learn from cluster DFT calculations? Catal. Today 2004, 91–92, 171–176. [Google Scholar] [CrossRef]
  24. Kerber, T.; Sierka, M.; Sauer, J. Application of semiempirical long-range dispersion corrections to periodic systems in density functional theory. J. Comput. Chem. 2008, 29, 2088–2097. [Google Scholar] [CrossRef] [PubMed]
  25. Jovanović, A.; Dobrota, A.S.; Rafailović, L.D.; Mentus, S.V.; Pašti, I.A.; Johansson, B.; Skorodumova, N.V. Structural and electronic properties of V2O5 and their tuning by doping with 3d elements—Modelling using the DFT+U method and dispersion correction. Phys. Chem. Chem. Phys. 2018, 20, 13934–13943. [Google Scholar] [CrossRef] [PubMed] [Green Version]
  26. Ganduglia-Pirovano, M.V.; Sauer, J. Stability of reduced V2O5 (001) surfaces. Phys. Rev. B 2004, 70, 045422. [Google Scholar] [CrossRef]
  27. Helali, Z.; Jedidi, A.; Syzgantseva, O.A.; Calatayud, M.; Minot, C. Scaling reducibility of metal oxides. Theor. Chem. Acc. 2017, 136, 100. [Google Scholar] [CrossRef]
  28. Słoczyński, J.; Grabowski, R.; Kozłowska, A.; Tokarz-Sobieraj, R.; Witko, M. Interaction of oxygen with the surface of vanadia catalysts. J. Mol. Catal. A Chem. 2007, 277, 27–34. [Google Scholar] [CrossRef]
  29. Goclon, J.; Grybos, R.; Witko, M.; Hafner, J. Relative stability of low-index V2O5 surfaces: A density functional investigation. J. Physics: Condens. Matter 2009, 21, 095008. [Google Scholar]
  30. Oshio, T.; Sakai, Y.; Ehara, S. Scanning tunneling microscopy/spectroscopy study of V2O5 surface with oxygen vacancies. J. Vac. Sci. Technol. B Microelectron. Nanometer Struct. 1994, 12, 2055–2059. [Google Scholar] [CrossRef]
  31. Smith, R.L.; Rohrer, G.S.; Lee, K.S.; Seo, D.-K.; Whangbo, M.-H. A scanning probe microscopy study of the (001) surfaces of V2O5 and V6O13. Surf. Sci. 1996, 367, 87–95. [Google Scholar] [CrossRef]
  32. Goschke, R.A.; Vey, K.; Maier, M.; Walter, U.; Goering, E.; Klemm, M.; Horn, S. Tip induced changes of atomic scale images of the vanadiumpentoxide surface. Surf. Sci. 1996, 348, 305–310. [Google Scholar] [CrossRef]
  33. Structure Commission of the International Zeolite Association. Zeolite Structures Database. Available online: http://www.iza-structure.org/databases/ (accessed on 21 November 2017).
  34. Migues, A.N.; Muskat, A.; Auerbach, S.M.; Sherman, W.; Vaitheeswaran, S. On the Rational Design of Zeolite Clusters. ACS Catal. 2015, 5, 2859–2865. [Google Scholar] [CrossRef] [Green Version]
  35. Migues, A.N.; Sun, Q.; Vaitheeswaran, S.; Sherman, W.; Auerbach, S.M. On the Rational Design of Zeolite Clusters for Converging Reaction Barriers: Quantum Study of Aldol Kinetics Confined in HZSM-5. J. Phys. Chem. C 2018, 122, 23230–23241. [Google Scholar] [CrossRef]
  36. Fermann, J.T.; Moniz, T.; Kiowski, O.; McIntire, T.J.; Auerbach, S.M.; Vreven, T.; Frisch, M.J. Modeling Proton Transfer in Zeolites: Convergence Behavior of Embedded and Constrained Cluster Calculations. J. Chem. Theory Comput. 2005, 1, 1232–1239. [Google Scholar] [CrossRef]
  37. de Vries, A.H.; Sherwood, P.; Collins, S.J.; Rigby, A.M.; Rigutto, M.; Kramer, G.J. Zeolite Structure and Reactivity by Combined Quantum-Chemical−Classical Calculations. J. Phys. Chem. B 1999, 103, 6133–6141. [Google Scholar] [CrossRef]
  38. Sierka, M.; Sauer, J. Finding transition structures in extended systems: A strategy based on a combined quantum mechanics–empirical valence bond approach. J. Chem. Phys. 2000, 112, 6983–6996. [Google Scholar] [CrossRef]
  39. Sherwood, P.; De Vries, A.H.; Collins, S.J.; Greatbanks, S.P.; Burton, N.A.; Vincent, M.A.; Hillier, I.H. Computer simulation of zeolite structure and reactivity using embedded cluster methods. Faraday Discuss. 1997, 106, 79–92. [Google Scholar] [CrossRef]
  40. Centi, G.; Trifiro, F. Catalytic behavior of V-containing zeolites in the transformation of propane in the presence of oxygen. Appl. Catal. A-Gen. 1996, 143, 3–16. [Google Scholar] [CrossRef]
  41. Grimme, S. Semiempirical GGA-type density functional constructed with a long-range dispersion correction. J. Comput. Chem. 2006, 27, 1787–1799. [Google Scholar] [CrossRef]
  42. Hieu, N.V.; Lichtman, D. Bandgap radiation induced photodesorption from V2O5 powder and vanadium oxide surfaces. J. Vac. Sci. Technol. 1981, 18, 49–53. [Google Scholar] [CrossRef]
  43. Cogan, S.F.; Nguyen, N.M.; Perrotti, S.J.; Rauh, R.D. Optical properties of electrochromic vanadium pentoxide. J. Appl. Phys. 1989, 66, 1333–1337. [Google Scholar] [CrossRef]
  44. Moshfegh, A.Z.; Ignatiev, A. Formation and characterization of thin film vanadium oxides: Auger electron spectroscopy, X-ray photoelectron spectroscopy, X-ray diffraction, scanning electron microscopy, and optical reflectance studies. Thin Solid Films 1991, 198, 251–268. [Google Scholar] [CrossRef]
  45. Hermann, K.; Witko, M.; Druzinic, R.; Tokarz, R. Hydrogen assisted oxygen desorption from the V2O5(010) surface. Top. Catal. 2000, 11, 67–75. [Google Scholar] [CrossRef]
  46. Hejduk, P.; Szaleniec, M.; Witko, M. Molecular and dissociative adsorption of water at low-index V2O5 surfaces: DFT studies using cluster surface models. J. Mol. Catal. A 2010, 325, 98–104. [Google Scholar] [CrossRef]
  47. TURBOMOLE V6.3 adoUoKa; Forschungszentrum Karlsruhe GmbH; TURBOMOLE GmbH, saf. 2011. Available online: http://www.turbomole.com (accessed on 7 February 2011).
  48. Weigend, F.; Ahlrichs, R. Balanced basis sets of split valence, triple zeta valence and quadruple zeta valence quality for H to Rn: Design and assessment of accuracy. Phys. Chem. Chem. Phys. 2005, 7, 3297–3305. [Google Scholar] [CrossRef]
  49. Eichkorn, K.; Treutler, O.; Öhm, H.; Häser, M.; Ahlrichs, R. Auxiliary Basis Sets to Approximate Coulomb Potentials. Chem. Phys. Lett. 1995, 240, 283–289. [Google Scholar] [CrossRef]
  50. Eichkorn, K.; Weigend, F.; Treutler, O.; Ahlrichs, R. Auxiliary basis sets for main row atoms and transition metals and their use to approximate Coulomb potentials. Theor. Chem. Acc. 1997, 97, 119–124. [Google Scholar] [CrossRef]
  51. Mulliken, R.S. Electronic Population Analysis on LCAO[Single Bond]MO Molecular Wave Functions. I. J. Chem. Phys. 1955, 23, 1833–1840. [Google Scholar] [CrossRef] [Green Version]
  52. Gorelsky, S.I.; Lever, A.B.P. Electronic structure and spectra of ruthenium diimine complexes by density functional theory and INDO/S. Comparison of the two methods. J. Organomet. Chem. 2001, 635, 187–196. [Google Scholar] [CrossRef]
  53. Gorelsky, S.I. AOMix: Program for Molecular Orbital Analysis. version X.X. 2015. Available online: http://www.sg-chem.net/ (accessed on 21 May 2013).
Figure 1. Crystal structure of BEA zeolite. Nine non-equivalent T sites are highlighted (T1—magenta, T2—bright green, T3—yellow, T4—cyan, T5—violet, T6—grey, T7—blue, T8—dark green, T9—orange).
Catalysts 10 01080 g001
Figure 2. Three different forms of vanadium considered in the current work: (a) V–OH, (b) V=O, (c) V(=O)(–OH).
Catalysts 10 01080 g002
Figure 3. The parameters of the V–OH center in the T2 position (navy—bond lengths in Å; blue, in parentheses—bond order indices; red—Mulliken charges).
Catalysts 10 01080 g003
Figure 4. DOS plot of the V–OH center in the T2 position.
Catalysts 10 01080 g004
Figure 5. The parameters of the V=O center in the (a) T2 and (b) T3 positions (navy—bond lengths in Å; blue, in parentheses—bond order indices; red—Mulliken charges).
Catalysts 10 01080 g005
Figure 6. DOS plot of the V=O center in (a) T2 and (b) T3 positions.
Catalysts 10 01080 g006
Figure 7. The parameters of the V(=O)(–OH) center in the T3 position (navy—bond lengths in Å; blue, in parentheses—bond order indices; red—Mulliken charges).
Catalysts 10 01080 g007
Figure 8. DOS plot of the V(=O)(–OH) center in the T3 position.
Catalysts 10 01080 g008
Figure 9. (a) V20O62H22 cluster representing the (010) V2O5 surface side view; (b) parameters characterizing centers present on the model (black—bond lengths in Å; blue, in parentheses—bond order indices; red—Mulliken charges).
Catalysts 10 01080 g009
Figure 10. Simulated DOS plot of V2O5.
Catalysts 10 01080 g010
Figure 11. (a) V20O62H22(2H+) cluster representing the results of 2H+ adsorption at O(1)O(1) on the (010) V2O5 surface—side view; (b) parameters characterizing V–OH surface group and their neighbors (black—bond lengths in Å; blue, in parentheses—bond order indices; red—Mulliken charges).
Catalysts 10 01080 g011
Figure 12. DOS plot of the V20O62H242+ cluster.
Catalysts 10 01080 g012
Figure 13. (a) V20O62H22(H2O) cluster representing results of the dissociative water adsorption at V=O and O(3) on the (010) V2O5 surface—side view; (b) parameters characterizing V(=O)(–OH) group and their neighbors (black—bond lengths in Å; blue, in parentheses—bond order indices; red—Mulliken charges).
Catalysts 10 01080 g013
Figure 14. DOS plot of the V20O63H26 cluster.
Catalysts 10 01080 g014
Table 1. Energy (in eV) needed for the isomorphic substitution of the zeolite Si atom into V–OH, V=O, and V(=O)(–OH) sites.
SiteΔE V–OH
[eV]
ΔE V=O
[eV]
ΔE V(=O)(–OH)
[eV]
T10.23−0.691.43
T2−2.16−2.24−1.51
T3−1.69−2.21−2.19
T4−0.42−1.14−1.29
T5−0.41−0.85−1.09
T60.100.00−0.40
T7−0.48−1.12−0.14
T80.06−1.42−1.38
T9−1.19−1.79−1.41
Table 2. Structural parameters of the V–OH group introduced to different crystallographic positions in BEA zeolite.
SiteR(V–OH) [Å]B.O.qOOHqOHqV
T11.851.12−0.48−0.161.25
T21.841.09−0.50−0.171.33
T31.821.12−0.49−0.161.37
T41.831.09−0.50−0.171.39
T51.831.09−0.49−0.161.38
T61.841.14−0.48−0.161.31
T71.841.09−0.50−0.171.39
T81.810.94−0.46−0.131.31
T91.821.22−0.44−0.121.27
R—distance, B. O. Mayer bond order indices, q—Mulliken charges.
Table 3. Structural parameters (R—distance, B. O. Mayer bond order indices, q—Mulliken charges) of the V=O group introduced to different crystallographic positions in BEA zeolite.
SiteR(V–O) [Å]B.O.qOqV
T11.602.09−0.461.23
T21.612.00−0.491.28
T31.601.93−0.501.50
T41.601.83−0.541.58
T51.611.87−0.541.49
T61.591.91−0.501.53
T71.611.89−0.521.49
T81.601.91−0.511.48
T91.601.91−0.511.60
Table 4. Structural parameters of the V(=O)(–OH) group introduced to different crystallographic positions in BEA zeolite. OO denotes vanadyl oxygen, OOH denotes oxygen from hydroxyl.
SiteR(V=O) [Å]B.O. V=OR(V–OH) [Å]B.O. V–OHqOOqOOHqOHqV
T11.622.181.891.03−0.34−0.58−0.270.76
T21622.171.831.03−0.51−0.65−0.331.06
T31.621.871.870.85−0.55−0.66−0.351.30
T41.621.841.850.90−0.57−0.64−0.321.30
T51.611.991.890.82−0.49−0.70−0.381.24
T61.582.171.801.03−0.41−0.61−0.261.40
T71.621.901.860.82−0.54−0.69−0.381.24
T81.601.981.781.14−0.51−0.54−0.211.33
T91.621.781.761.19−0.61−0.54−0.201.40
R—distance, B. O. Mayer bond order indices, q—Mulliken charges.
Table 5. Structural parameters of the investigated vanadium groups present on the (010) V2O5 and introduced to most stable crystallographic positions in BEA zeolite (a T2 site, b T3 site). OO denotes vanadyl oxygen, OOH denotes oxygen from hydroxyl.
ParameterSite on (010) V2O5Site in V-BEA
V(–OH) group
R (V–OH)1.741.84 a
B.O. (V–OH)1.211.09 a
qO−0.48−0.50 a
qOH−0.13−0.17 a
qV1.701.33 a
V(=O) group
R (V=O)1.581.60 a, 1.60 b
B.O. (V=O)2.192.00 a, 1.93 b
qO−0.38−0.49 a, −0.50 b
qV1.701.28 a, 1.50 b
V(=O)(–OH) group
R (V–OH)1.781.83 b
R (V=O)1.581.62 b
B.O. (V–OH)1.120.85 b
B.O. (V=O)2.241.87 b
qOOH−0.57−0.66 b
qOH−0.23−0.35 b
qOO−0.37−0.55 b
qV1.411.30 b
R—distance, B. O. Mayer bond order indices, q—Mulliken charges.

