Ru/Ce/Ni Metal Foams as Structured Catalysts for the Methanation of CO2
by
 , ,
, ,
Stefano Cimino
1,* ,
,
Elisabetta Maria Cepollaro
1,
Luciana Lisi
1,
Stefano Fasolin
2,
Marco Musiani
2 and
Lourdes Vázquez-Gómez
2 1
Istituto di Scienze e Tecnologie per l’Energia e la Mobilità Sostenibili (STEMS), Consiglio Nazionale delle Ricerche (CNR), Via Guglielmo Marconi 4/10, 80125 Napoli, Italy
2
Istituto di Chimica della Materia Condensata e di Tecnologie per l’Energia (ICMATE), Consiglio Nazionale delle Ricerche (CNR), Corso Stati Uniti 4, 35127 Padova, Italy
*
Author to whom correspondence should be addressed.
Catalysts 2021, 11(1), 13; https://0-doi-org.brum.beds.ac.uk/10.3390/catal11010013
Submission received: 1 December 2020
/
Revised: 19 December 2020
/
Accepted: 22 December 2020
/
Published: 24 December 2020
(This article belongs to the Special Issue Catalysts for CO2 Conversion, Upgrading and Recycling)
Abstract
:The development of highly conductive structured catalysts with enhanced mass- and heat-transfer features is required for the intensification of the strongly exothermic catalytic hydrogenation of CO2 in which large temperature gradients should be avoided to prevent catalyst deactivation and to control selectivity. Therefore, in this work we set out to investigate the preparation of novel structured catalysts obtained from a commercial open cell Ni foam with high pore density (75 ppi) onto which a CeO2 layer was deposited via electroprecipitation, and, eventually, Ru was added by impregnation. Composite Ru/Ce/Ni foam catalysts, as well as simpler binary Ru/Ni and Ce/Ni catalysts were characterized by SEM-EDX, XRD, cyclic voltammetry, N2 physisorption, H2-temperature programmed reduction (TPR), and their CO2 methanation activity was assessed at atmospheric pressure in a fixed bed flow reactor via temperature programmed tests in the range from 200 to 450 °C. Thin porous CeO2 layers, uniformly deposited on the struts of the Ni foams, produced active catalytic sites for the hydrogenation of CO2 at the interface between the metal and the oxide. The methanation activity was further boosted by the dispersion of Ru within the pores of the CeO2 layer, whereas the direct deposition of Ru on Ni, by either impregnation or pulsed electrodeposition methods, was much less effective.
1. Introduction
Power-to-Gas (PtG) is a valuable technological option in order to foster the transition to renewable energy sources, representing a strategy for CO2 capture and utilization as well as a chemical storage of energy [1]. To this aim, the hydrogen produced by renewable energy surplus via water electrolysis can be reacted with CO2 (captured from power plants, industrial or biogenic processes) and catalytically transformed to methane (or Substitute Natural Gas, SNG) [1,2] via the well-known Sabatier reaction (Equation (1))
CO2 + 4H2 ↔ CH4 + 2H2O ΔH = −165 kJ mol−1
The process has recently attracted a renewed research interest for catalyst innovation with most efforts focused on improving the low-temperature activity of the catalysts (traditionally based on supported Ni and Ru) as well as their long-term stability and anti-sintering properties [2,3,4,5,6,7,8,9]. However, due to the high exothermicity and the equilibrium nature of the Sabatier reaction, a serious challenge in catalytic reactor design is to remove the heat produced and keep a relatively low process temperature without generating hot spots [5,6,7]. Therefore, the commercial process for SNG production makes use of adiabatic, packed bed reactors in series with inter-stage cooling and/or large product gas recycling [4,5].
Due to their outstanding heat- and mass-transfer features, coupled to high thermal and mechanical stability as well as low pressure drops, metallic foams are a valuable choice to contrast hot spot formation and reduce the size of the reactor needed to reach high conversions [10,11] when dealing with highly exothermic and possibly diffusion limited processes such as catalytic combustion [12,13,14], catalytic partial oxidation [15,16,17,18,19,20], and methanation [7,21,22,23,24]. More generally, highly conductive structured catalysts are promising for the intensification of a number of existing strongly exothermic/endothermic catalytic processes in which large temperature gradients should be avoided to prevent catalyst deactivation and to control selectivity [25].
In particular, it has been shown by both computational fluid dynamics calculations and experimental measurements that a large reduction in the “hotspot” temperature along the catalytic bed during methanation can be achieved by using structured catalysts based on reticulated Al- and Ni- open foam substrates, owing to their high thermal conductivity [7,21,23,24].
The preparation of a structured catalyst starting from an open foam metallic substrate is not a trivial matter [10,25] and generally requires the deposition of a thin, uniform, firmly anchored washcoat layer of refractory oxides (such as Al2O3, CeO2, ZrO2) [20,25] where nanosized active components are then dispersed. Traditional dip-coating procedures may be cumbersome and lead to pore blocking, inhomogeneous distribution, and poor adhesion [10,25]. Hence, alternative methods for efficiently embedding catalytic active components onto the foam substrates are particularly desirable [15]. In particular, taking advantage of the metallic nature of foams, some simple preparation methods such as electrochemically induced precipitation [13,14,16,17] or electrodeposition [12,13,20] have been shown capable to form well-dispersed active layers strongly interacting with the substrate.
In this work we set out to investigate the preparation and CO2 methanation activity of novel structured catalysts obtained from a commercial open cell Ni foam with high pore density (75 ppi) onto which a CeO2 layer was deposited via electroprecipitation, and, eventually Ru was added by impregnation. CeO2 was selected for the ability to vary its oxygen concentration without changing phase, providing a large concentration of active sites for the adsorption and activation of oxygen-containing molecules such as CO2. In particular, CeO2 was reported to be among the most effective supports (including γ-Al2O3, SiO2, TiO2, and ZrO2) in order to maximize the CO2 methanation activity of both Ni- and Ru-based catalysts [5,6,26,27,28].
Electroprecipitation is a versatile method that allows deposition of CeO2 on various conductive substrates. As the formation of solid deposits is caused by a local pH increase triggered by reduction reactions that produce hydroxide ions, electroprecipitation may be realized on both inert [29,30,31,32,33,34] and corrodible substrates [35,36,37,38,39,40]. We have shown that complex-shape 3D substrates, like foams, may be effectively coated [13]. A complex mechanism leading from Ce(III) ions to solid CeO2, possibly containing minor amounts of Ce(OH)3, has been proposed [13,30,31,33]. The layer thickness may be controlled via the transferred charge [39], although a simple linear relationship between thickness and charge cannot be assumed. While very thin CeO2 layers are continuous [13,32], cracked deposits form when their thickness is in the micrometers range [35,37,38,40]. This limits the interest of CeO2 layers for corrosion protection, but is not expected to negatively affect catalysis, especially when the CeO2-coated foam material is active towards the chosen reaction.
Accordingly, we pursued strong interactions among the composite structured catalyst components, i.e., between Ni foam and CeO2, between Ru and CeO2, and between the two metals, Ni and Ru, in order to develop additional active sites for CO2 methanation.
2. Results and Discussion
2.1. Characterization of the Catalysts
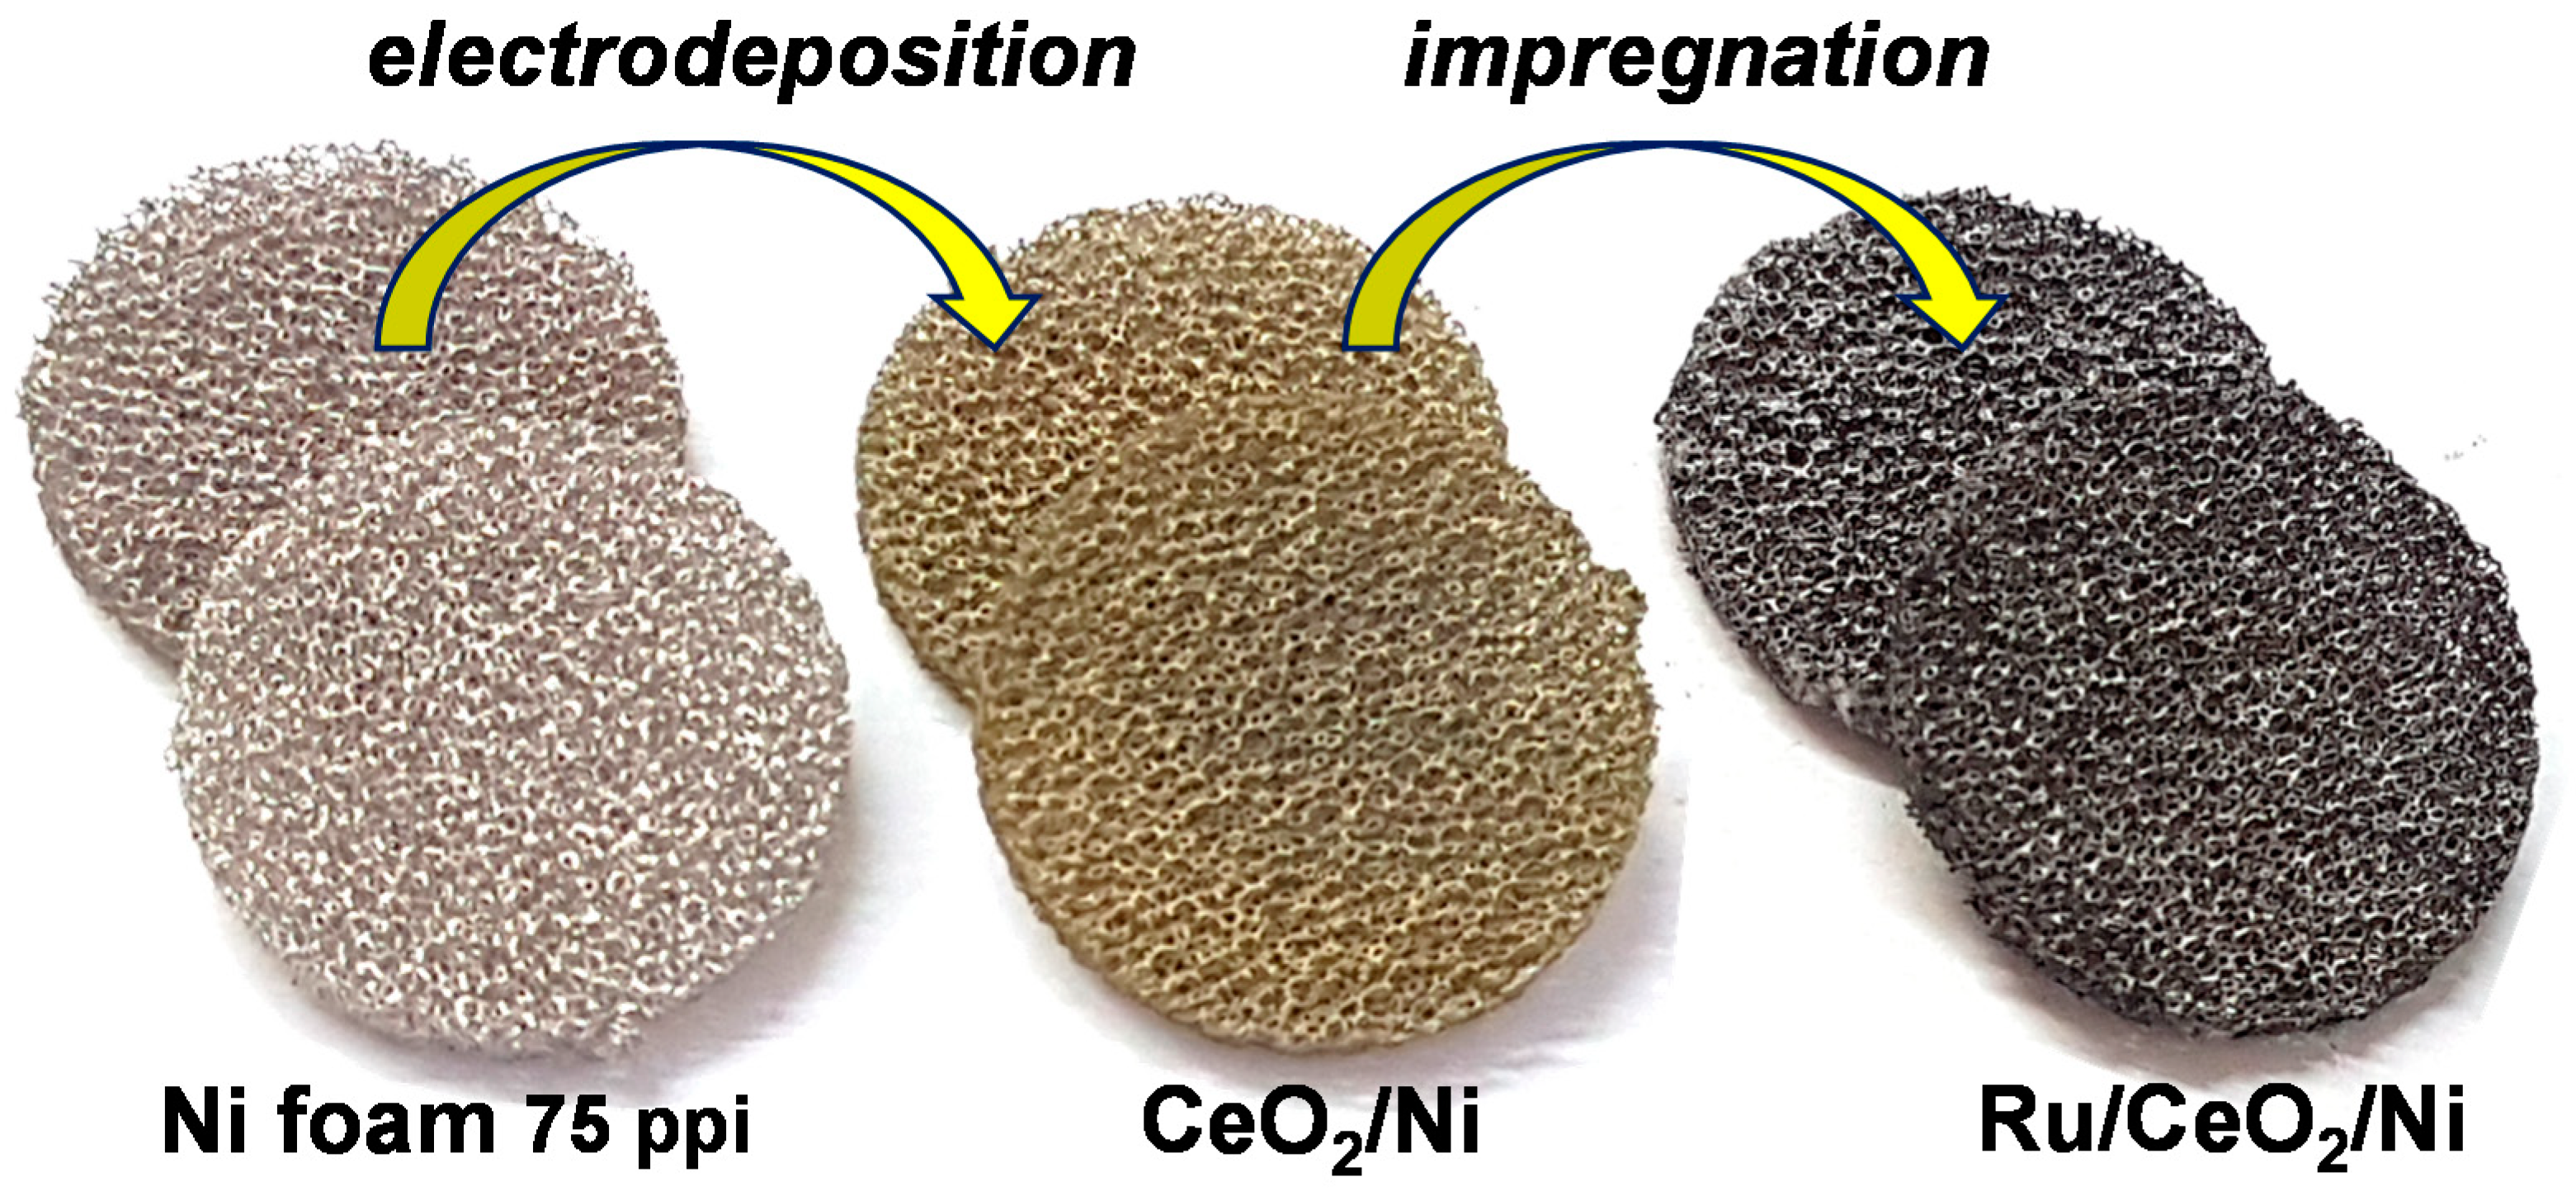
To obtain Ru/CeO2/Ni catalysts, Ru was deposited onto precut Ni foam disks modified by CeO2 layers prepared by electroprecipitation [18,19,20,21,22,23,24,25,26,27,28,29,30], as schematically depicted in Figure 1.
Table 1 presents a summary of the prepared catalysts. Catalysts containing ceria are labeled Ru/Cex/Ni, where the subscript x refers to the charge (in C cm−3) used for the deposition of CeO2.
SEM images of as-prepared Ce12/Ni and Ru/Ce12/Ni are collected in Figure 2. The lower-magnification image (Figure 2a) shows that the CeO2 layer covers homogeneously the struts of the Ni foam, independently of their position in the inner/outer parts of the disc. At higher magnification (Figure 2b), a few defects are detected, together with the traces of the boundaries between the crystals that constitute the foam, still visible due to the moderate thickness of ceria (0.3–1 μm). Loading with Ru does not induce major changes in the morphology of Ce12/Ni (Figure 2c) except a marked cracking, probably caused by the stresses induced by thermal treatments (at 120 °C and eventually at 450 °C) due to the mismatch between the thermal expansion coefficients of the metal and oxide phases.
In agreement with previous reports [35,37,38,40], the thicker CeO2 layers (1.5–3.5 μm) formed on Ce36/Ni samples are porous and heavily cracked, as shown by Figure S1a in the Supplementary Information. Upon Ru loading, Ru/Ce36/Ni samples exhibit areas where significant detachment of the oxide from Ni has occurred (Figure S1b). Part of the detached CeO2 scales are trapped inside the cells of the foam (Figure S1c).
SEM images of CeO2-free foam catalysts are shown in the Supplementary Information (Figure S2). Discontinuous layers of Ru with a low surface area were present in Ru/Ni. They probably formed via a Ru-Ni galvanic displacement reaction [18] and were possibly modified by the H2 reduction and thermal treatment. More continuous Ru layers were produced by a pulsed electrodeposition (PED) procedure which also caused Ni dissolution at the grain boundaries at the positive potential limit. In some areas, irregularly distributed on the foam, Ru deposits, hundreds of nanometers wide, were formed onto significantly roughened Ni (Figure S2d). The Ru surface areas measured for Ru/Ni and Ru/Ni-PED samples were respectively 0.011 ± 0.001 and 0.056 ± 0.005 m2 g−1 (referred to the whole catalyst mass). Cyclic voltammograms are shown in Figure S3. These figures confirm the larger Ru coverage of the Ni foam obtained by PED. However, in both cases the Ru surface area remained below that of Ni, a disappointing result at variance with those observed in the galvanic displacement of Ni by other metals, e.g., Pd [41], Rh and Pt [18], which formed well-dispersed, large-area nanometric deposits.
XRD spectra of Cex/Ni and Ru/Cex/Ni foam catalysts after the reductive pretreatment (Figure S4a) show the presence of sharp peaks at 44.5, 51.8, and 76.3° corresponding to metallic Ni (card 4-850) accompanied by rather small signals at ca. 28.6, 47.6, and 56.4° that can be assigned to the presence of CeO2 (card 43-1002). No peaks related to Ru can be identified, suggesting that Ru is present in a highly dispersed or amorphous form, although the close proximity of the Ni and Ru main peaks and the much lower content of the latter may be alternative reasons for the lack of clear Ru signals. In fact, also the XRD spectra relevant to Ru/Ni and Ru/Ni-PED samples show no clear signals due to crystalline Ru (Figure S4b), in spite of their rather large deposits detected by SEM analysis, further confirming amorphous nature.
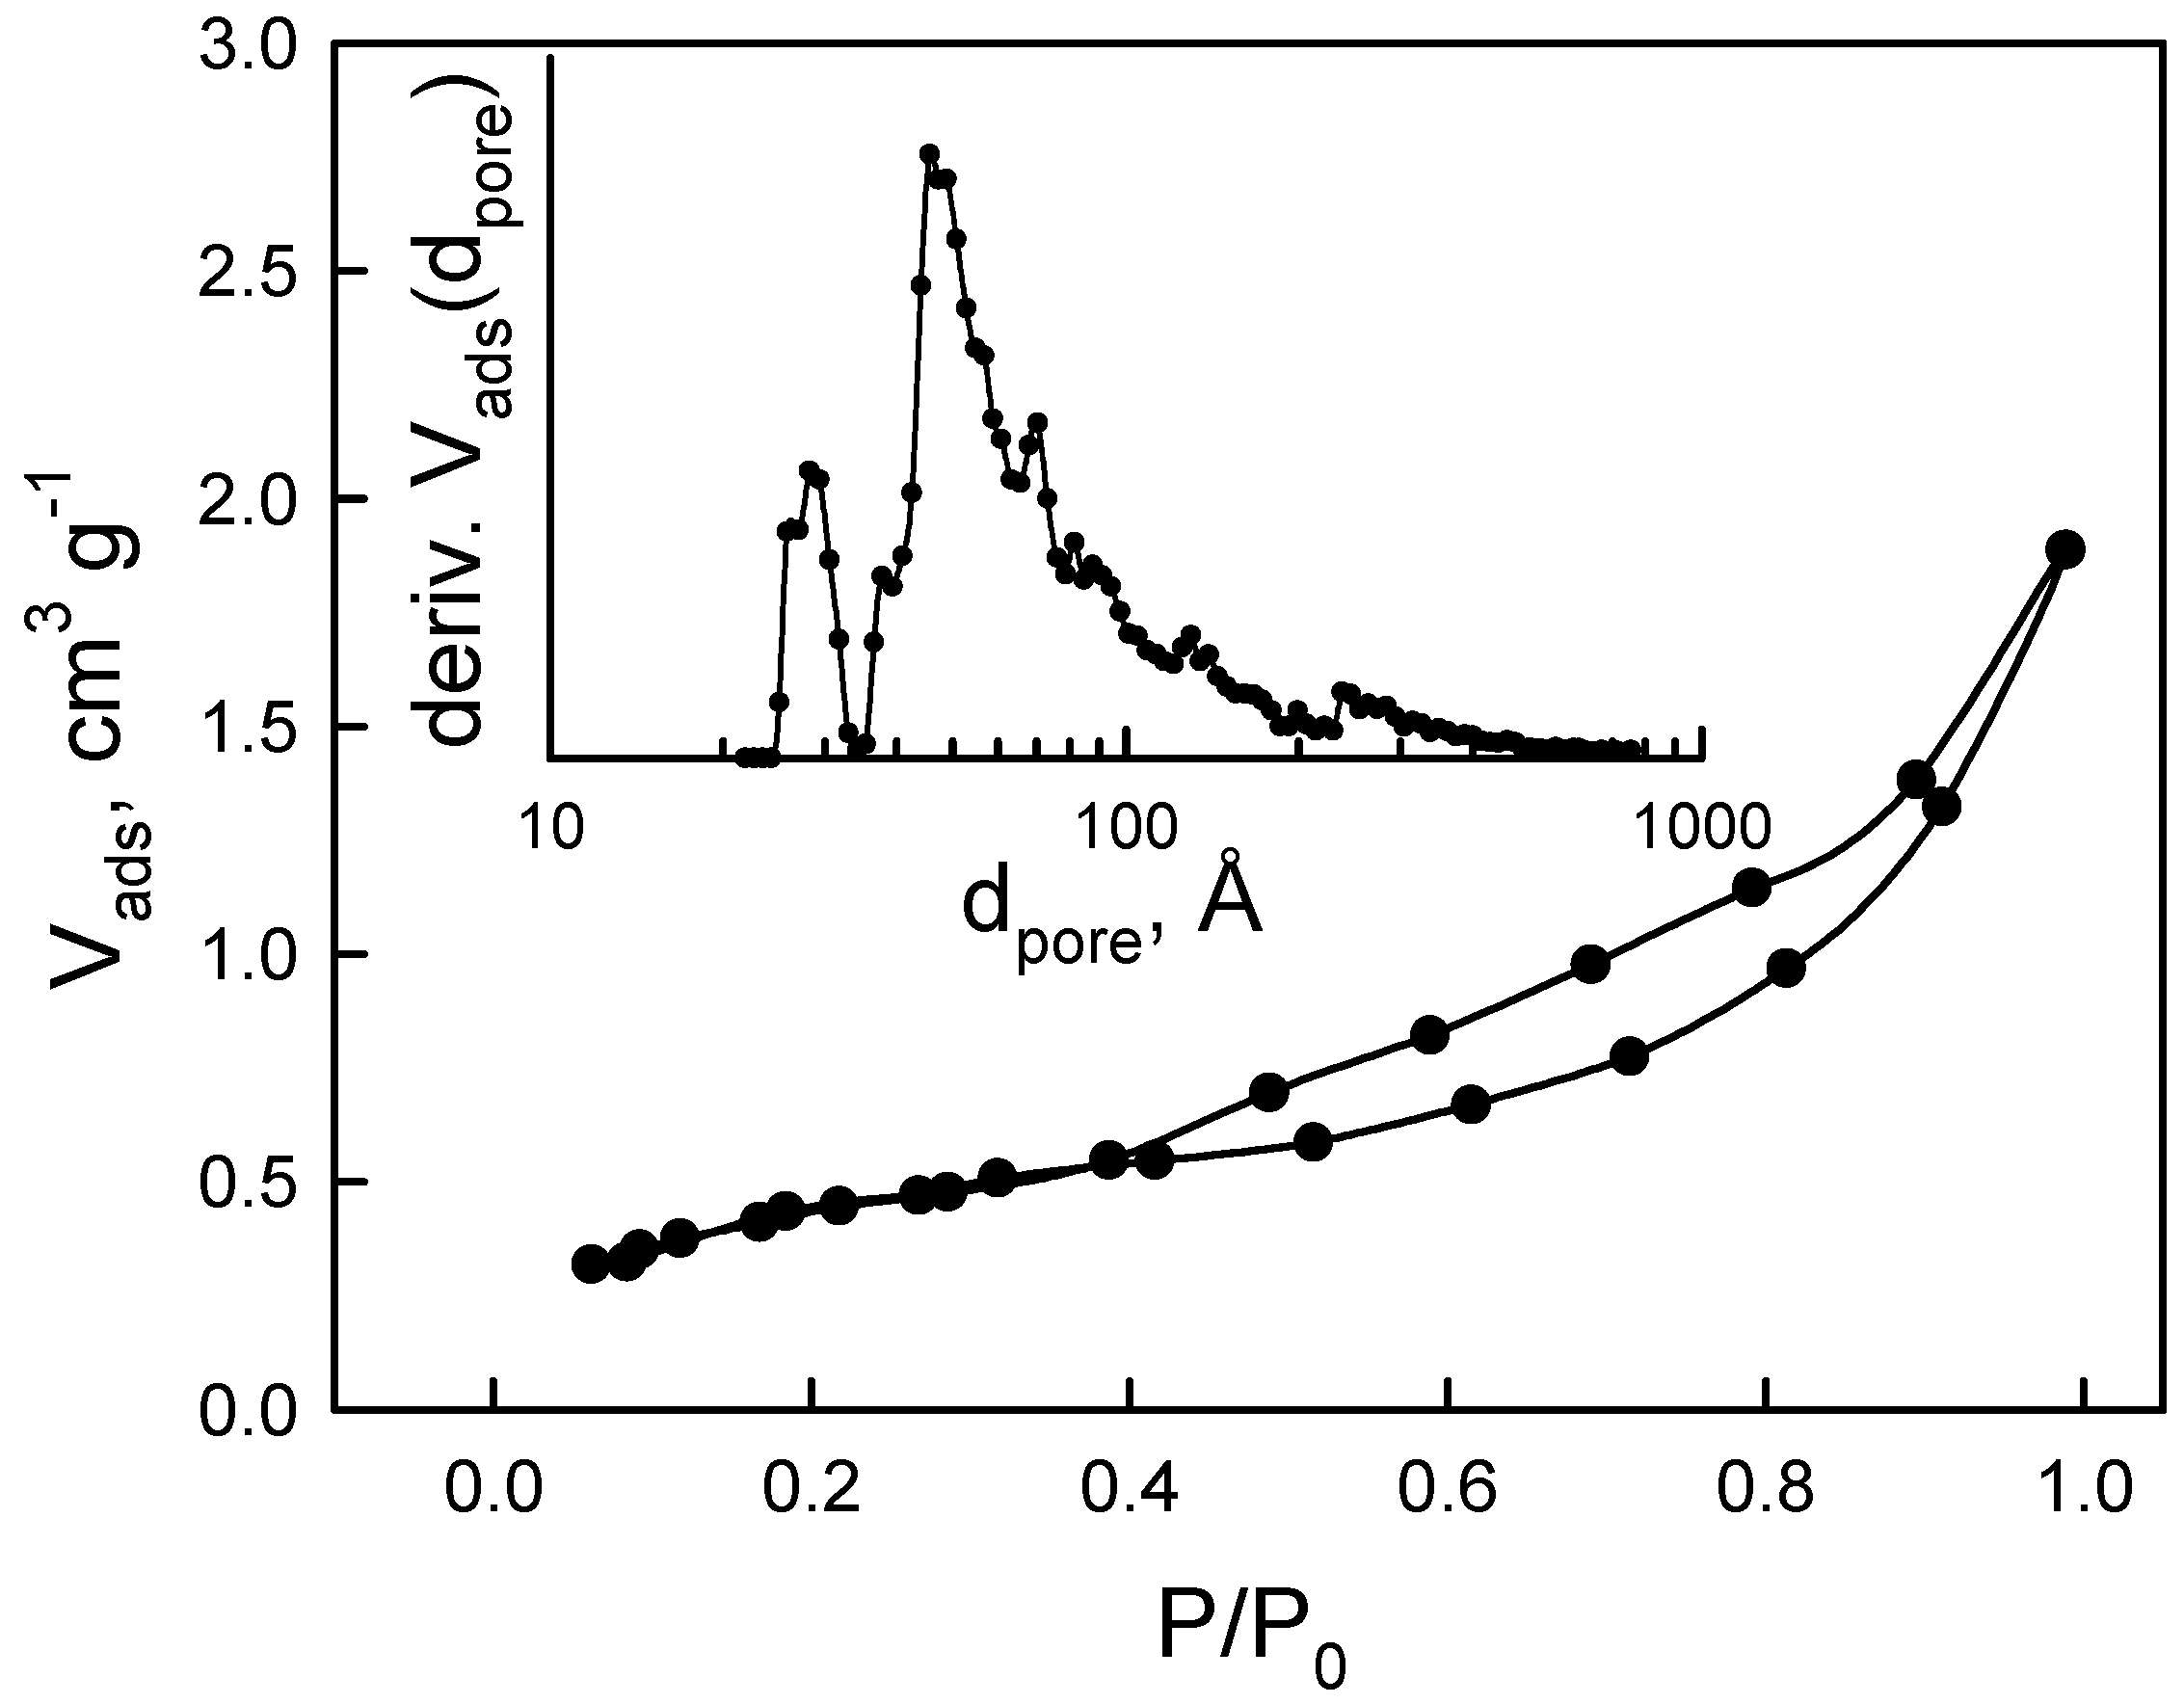
The N2 adsorption isotherms for Cex/Ni and Ru/Cex/Ni foams (shown in Figure 3) can be classified as Type IVb, which is typical of mesoporous materials showing some capillary condensation accompanied by a hysteresis on the desorption branch. Considering the negligible contribution from the exposed geometric surface area of the bare Ni structure (0.085 m2 g−1 Table 1), the overall specific surface area can be completely ascribed to the presence of CeO2: accordingly, it generally increased along with the ceria loading up 7.3 m2 g−1 for those samples with the thicker oxide coat (Table 1). In particular, considering the uncertainty related to the (low) actual oxide loading on the foams, the CeO2 layer was characterized by a S.S.A. comprised in the range 45–70 m2 g−1. This figure is roughly independent of the CeO2 loading and agrees well with recent data on a Pd/CeO2 catalyst electrodeposited on Fecralloy foams [14]. The pore size distribution (inset in Figure 3) extended from 25 to 250 Å with the main peak at ca. 50 Å and a further contribution centered at ca. 30 Å, giving a total pore volume of ca. 0.11 ± 0.02 cm3 g−1. The deposition of Ru onto Ce12/Ni foams did not modify significantly the specific surface area of the catalysts (Table 1). The apparent reduction of the specific surface area recorded for Ru/Ce36/Ni samples compared to their Ce36/Ni counterparts was probably due to some (uncontrolled) loss of the oxide by detachment from the Ni foam occurring either during the Ru-deposition step or (more likely) during the recovery after the catalytic testing. This agrees with SEM analysis of those Ru/Ce36/Ni (Figure S1c) showing some detached CeO2 platelets trapped in the cavities of the foams.
H2-temperature programmed reduction (TPR) experiments (Figure 4) were performed to clarify the interactions between phases and the reducibility of the catalysts that is known to play an important role for the CO2 methanation catalytic activity [9]. As a result, the bare Ni foam showed a weak signal in the temperature range from ca. 210 °C up to 350 °C (peak at ca. 290 °C), which did not change significantly in intensity upon the pre-treatment of the foam in air at 300 °C. This peak can be ascribed to the reduction of a small amount of NiO (ca. 0.3% of the total Ni), presumably formed at room temperature after the acid etching, not becoming thicker at 300 °C. All catalysts containing Ru (but no CeO2) showed a larger hydrogen consumption (Table 1) due to the presence of additional signals in the low temperature region of their H2-TPR profiles, which can be assigned to the reduction of RuOx species formed during the oxidative pretreatment [8]. In particular, the main peak broadened and its maximum shifted down to 260–265 °C and it was accompanied by a poorly resolved low temperature shoulder peaking at around 185–200 °C. It is also possible that the presence of Ru favored a larger formation of NiO during the oxidative pretreatment of the foams. Unfortunately, a correct estimation of the corresponding H2 consumption was precluded, because the peaks related to RuOx partly overlapped with the reduction of NiO, which can be possibly affected (enhanced) by the presence of Ru via a H2-spillover effect that was already reported for similar Ni foams modified with either Rh or Pt [18]. Notably, the reduction of RuOx started at as low as 85 °C and occurred over a larger temperature range for the Ru/Ni-PED sample compared to its Ru/Ni counterpart prepared by direct impregnation that, on the other hand, required ca. 160 °C to start being reduced: according to XRD and SEM analysis, this effect is possibly due to the amorphous nature of those Ru nanostructures formed during the pulsed electrodeposition.
The addition of the CeO2 layer on the Ni foam increased the total H2 uptake (per gram of sample, Table 1) and shifted the peak temperature for reduction of superficial NiO down to ca. 270 °C, suggesting a significant interaction between the two layers. While it is generally accepted that surface reduction of CeO2 to Ce2O3 by H2 occurs in the temperature range between 300 and 600 °C [42,43] it can be argued that the close interaction with the underlying Ni, which is easily accessible to gases, facilitated the reduction process [9], once again via a spill-over effect of H2 from Ni to CeO2. Therefore, the reduction of NiO partially overlapped with the reduction of the CeO2 fraction in close contact with the foam support.
The further addition of Ru on Cex/Ni foams significantly enhanced the low temperature reduction peak centered at ca. 190 °C (and starting from ca. 100 °C), which became the main reduction event in the TPR profile for Ru/Ce36/Ni catalyst (Figure 4). On the contrary, the second reduction event was less affected by the presence of Ru and resembled that recorded for Cex/Ni systems, though the peak temperature was slightly lower (ca. 250–260 °C). Considering that Ru loading in the two Ru/Cex/Ni composite catalysts (as well as in the Ru-Ni sample prepared by impregnation) was nominally identical, it follows that an even stronger interaction existed between Ru and CeO2 that caused the simultaneous reduction of RuOx and CeO2 at low temperature by promoting the extensive formation of oxygen vacancies and/or surface OH groups on CeO2 [8,42].
2.2. Catalytic Tests
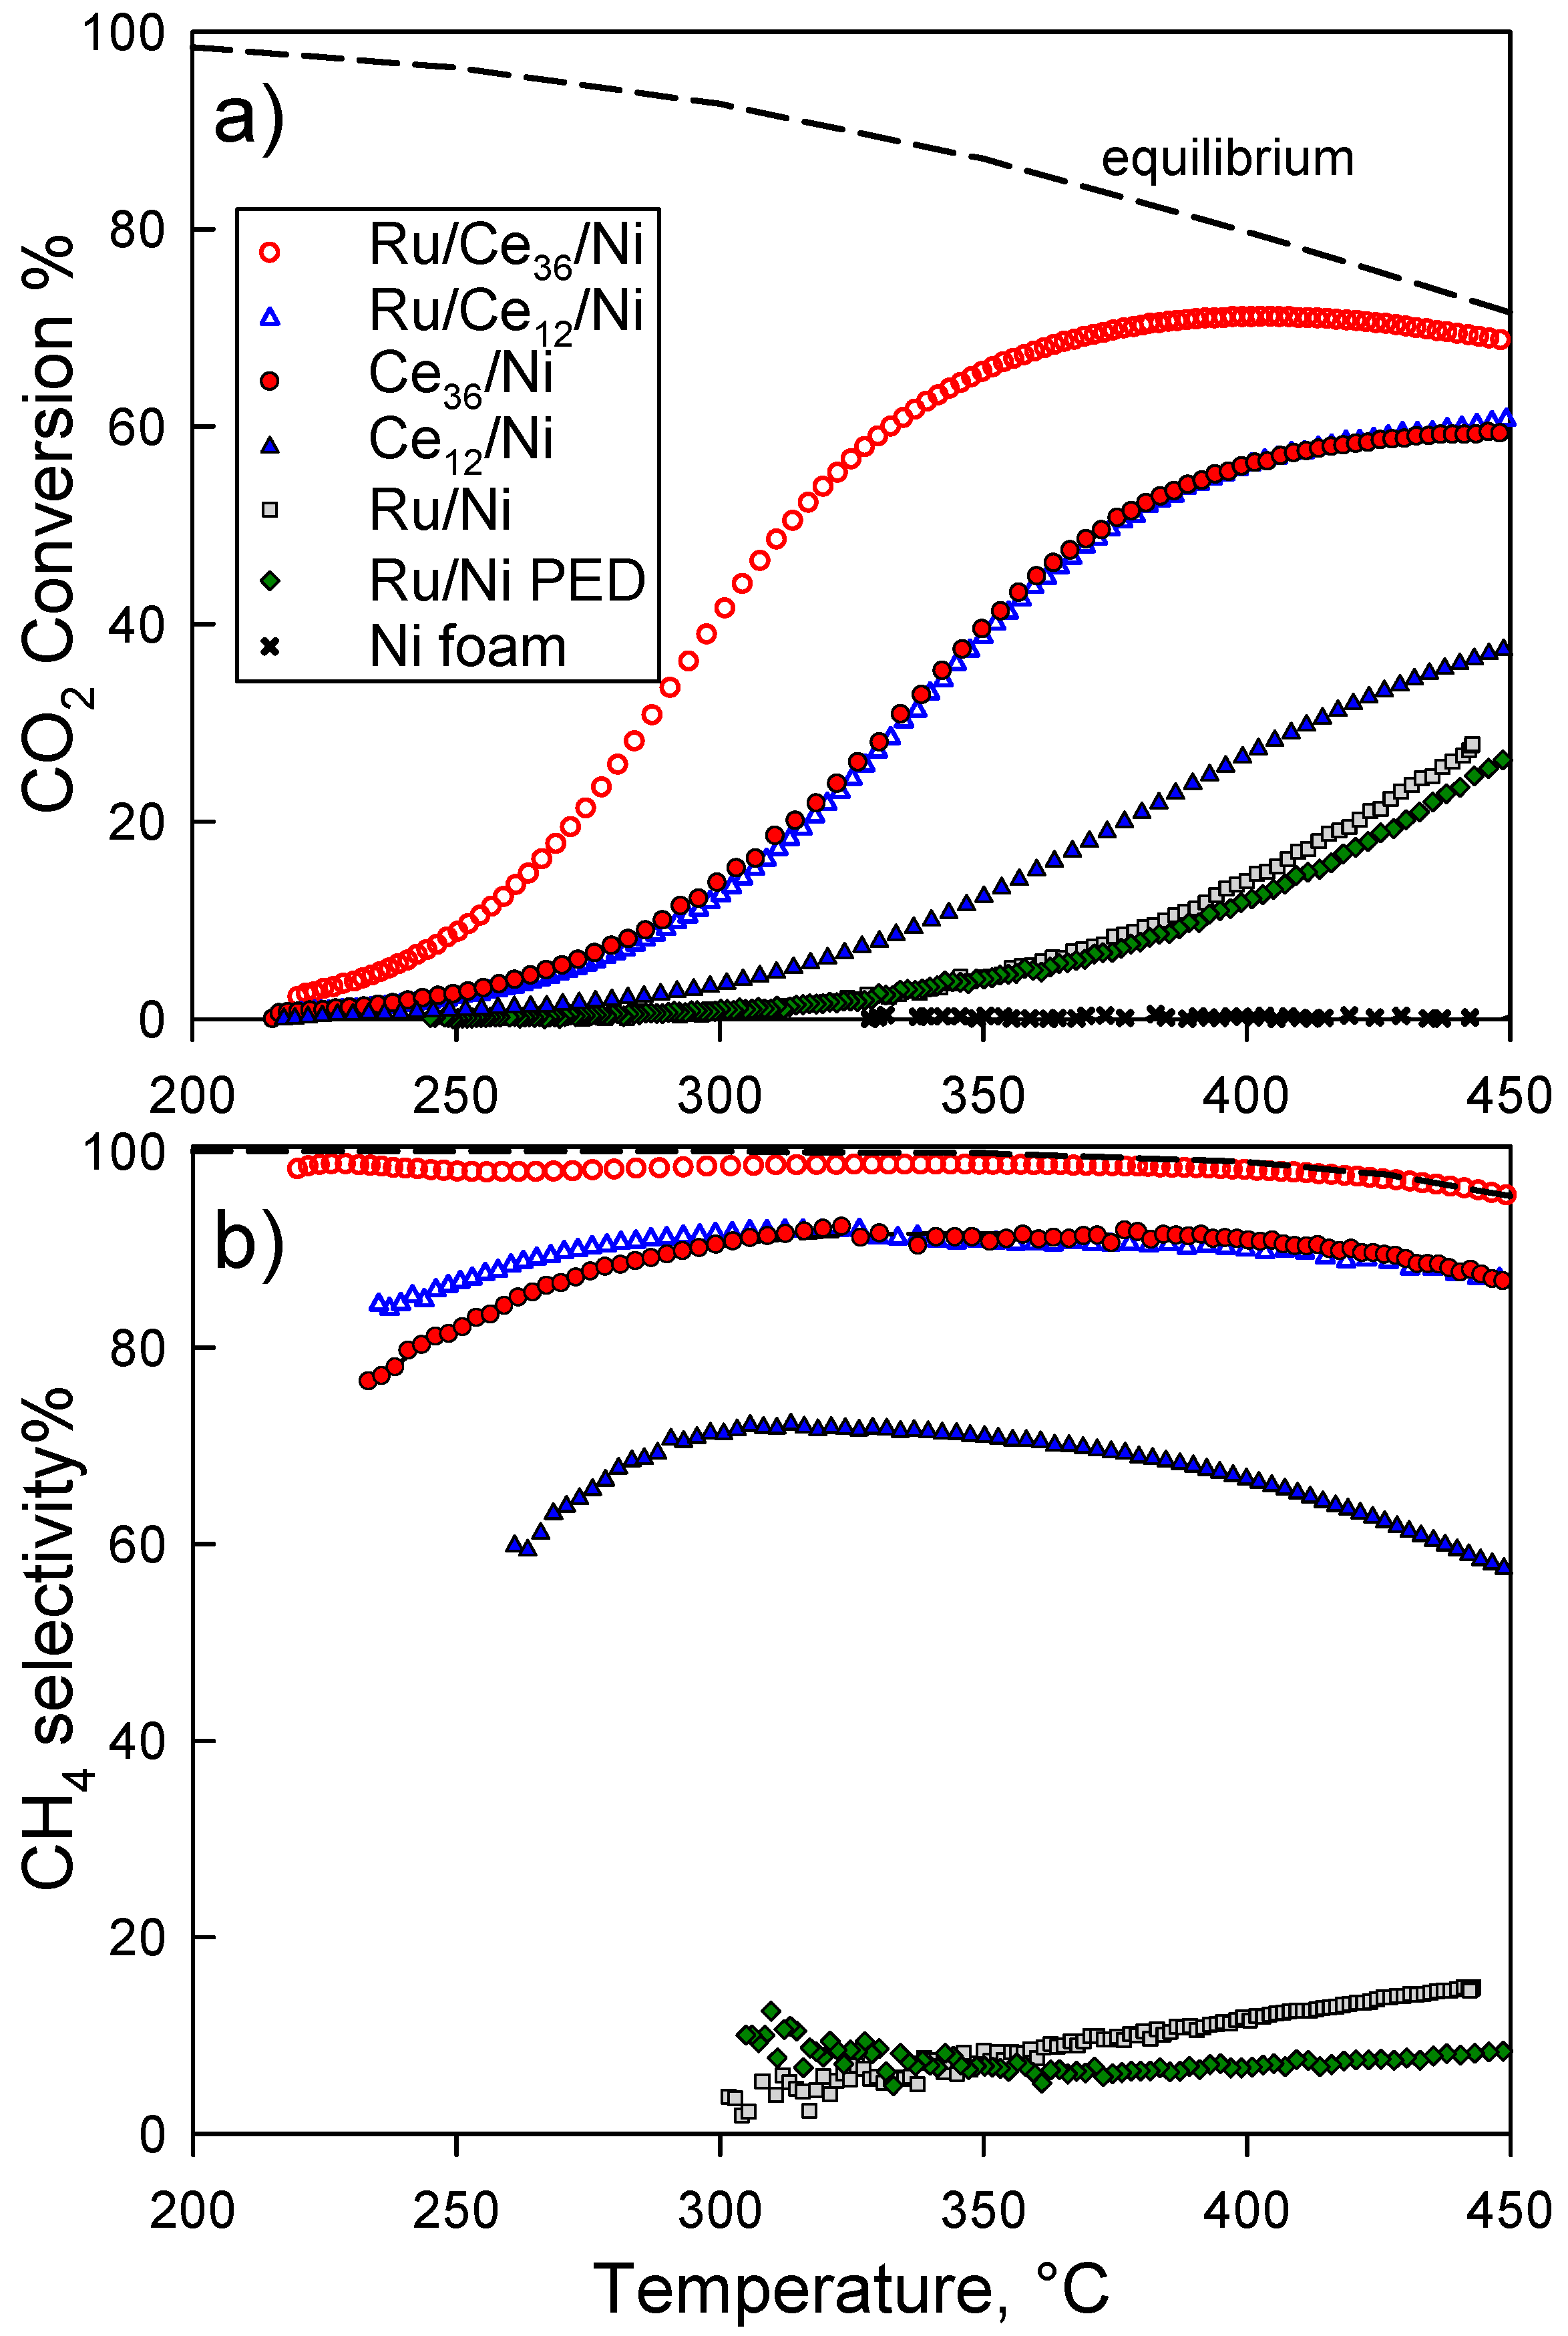
The CO2 hydrogenation activity of structured metal foam catalysts was investigated at atmospheric pressure under a steady feed flow of CO2/H2/N2 = 1/4/5 by volume. Figure 5 presents the results in terms of CO2 conversion and CH4 selectivity as a function of the reaction temperature (varied in the range 200–450 °C), compared with the corresponding values predicted by thermodynamic equilibrium (at constant T and P).
Bare Ni foams did not show any measurable catalytic activity under the experimental conditions explored in this work, which was in good agreement with previously reported results [23].
Generally, the direct deposition of Ru on the Ni foams promoted the conversion of CO2 starting from above 300 °C and monotonically increasing up to a maximum of ca. 25% at 450 °C, well below the corresponding thermodynamic equilibrium value. Notably, those foam catalysts prepared by direct impregnation with a Ru nitrosyl nitrate solution gave results quite similar to those of samples prepared by a pulsed electrodeposition method, in spite of their significantly different nominal loadings (see Table 1) and specific surface area of Ru, which, however, remained quite low (below that of the Ni foam). In particular, both types of catalysts displayed a rather low selectivity towards the formation of CH4, which slightly increased with the reaction temperature but remained below 15% in the whole temperature range. It can be argued that when Ru was in direct contact with the Ni foam, the main product of CO2 hydrogenation was CO rather than CH4, indicating the activation of the reverse water gas shift reaction (RWGS, Equation (2)) although the Sabatier reaction (Equation (1)) was thermodynamically favored (as shown by the equilibrium curve in Figure 5b which remains above 99% up to 400 °C).
H2 + CO2 → CO + H2O ΔH = +41 kJ mol−1.
Unsupported CeO2 powders were reported to have little activity toward CO2 hydrogenation and no CH4 selectivity under similar experimental conditions [43]. However, it is well known that nanometric Ni supported on CeO2 is an active catalyst for the methanation of CO2 (and CO) [5,6,43]. Although two types of mechanisms have been suggested for CO2 methanation on supported metal catalysts [42] (having CO or formates as the main intermediate species), it is generally accepted that H2 is dissociatively adsorbed on the metal, whereas CO2 is mainly adsorbed and activated on oxygen vacancies of CeO2 which are being restored via reduction of the oxide surface in order to close the catalytic cycle [42]. Whatever the intermediate species deriving from the adsorbed CO2, it has to finally spill over from CeO2 to Ni (or Ru) to complete the hydrogenation forming CH4, and therefore the interface between the two phases plays an important role [9]. In order to investigate whether the same reaction mechanism could be active at the interface between a Ni foam and an electrodeposited CeO2 layer, we tested Ce12/Ni and Ce36/Ni foams and the results are presented in Figure 5. We found that the electrodeposition of a thin porous CeO2 layer on the struts of the Ni foam was effective to promote the hydrogenation of CO2. The CO2 conversion plots over Cex/Ni catalysts shifted towards lower temperatures along with the increase in the oxide loading: this suggests either the formation of a larger number of accessible active sites located at the interface between CeO2 and Ni foam, or a larger availability of adsorption sites on CeO2 for the activation of CO2 and formation of intermediate species which can easily migrate towards the (Ni metal) hydrogenation sites. Unfortunately, it was not possible to measure the extent of the Ni-CeO2 interface by cyclic voltammetry due to the insulating nature of the oxide layer. Finally, we also observed a significant increase in process selectivity to CH4 that raised from 60% to 70% for Ce12/Ni up to 80–90% for Ce36/Ni.
As shown in Figure 5a, the interposition of thin CeO2 porous layers on the struts of the Ni foam before the deposition of Ru further enhanced the methanation activity of the composite catalysts. The CO2 conversion level attained over each Ru/Cex/Ni foam catalyst at any temperature was higher than over the corresponding Cex/Ni samples with the same oxide content and much higher than over Ru/Ni foams with the same Ru loading. Moreover, also in this case, the catalytic activity increased along with the loadings of CeO2 on the foam catalysts having a fixed content of Ru, following the same trend of reducibility found in TPR experiments. In particular, for the best performing Ru/Ce36/Ni catalyst, CO2 conversion increased from ca. 2% at 220 °C up to 71% at 400 °C, where it leveled-off before it started to decrease at higher temperatures closely following the trend of its thermodynamic equilibrium value. Figure 5b shows that the Ru/Ce36/Ni catalyst converted CO2 into methane showing a high selectivity (in the range 98–99%), which closely followed the trend predicted by thermodynamic equilibrium, thus starting to decrease for temperatures above 350 °C due to the formation of increasing amounts of CO via the RWGS reaction (Equation (2)). This agrees well with previous reports on high-performance Ru/CeO2 catalysts tested under similar conditions [28].
Therefore, it can be concluded that the interposition of CeO2 showed a marked promoting effect both for the CO2 methanation activity of Ru sites and for the underlying Ni foam. This is further confirmed considering that the selectivity to CH4 decreased to the range 87–91% when the ceria loading was reduced to ca. 1/3, at fixed Ru loading (i.e., Ru/Ce12/Ni catalyst), in analogy to the (even larger) drop in selectivity found for Ce12/Ni with respect to Ce36/Ni catalysts. As explained in the Materials and Methods section, we were unable to determine the Ru surface area in Ru/Cex/Ni foam catalysts. Thus, we cannot exclude that part of the activity enhancement was due to a geometric factor, besides the Ru–CeO2 interaction.
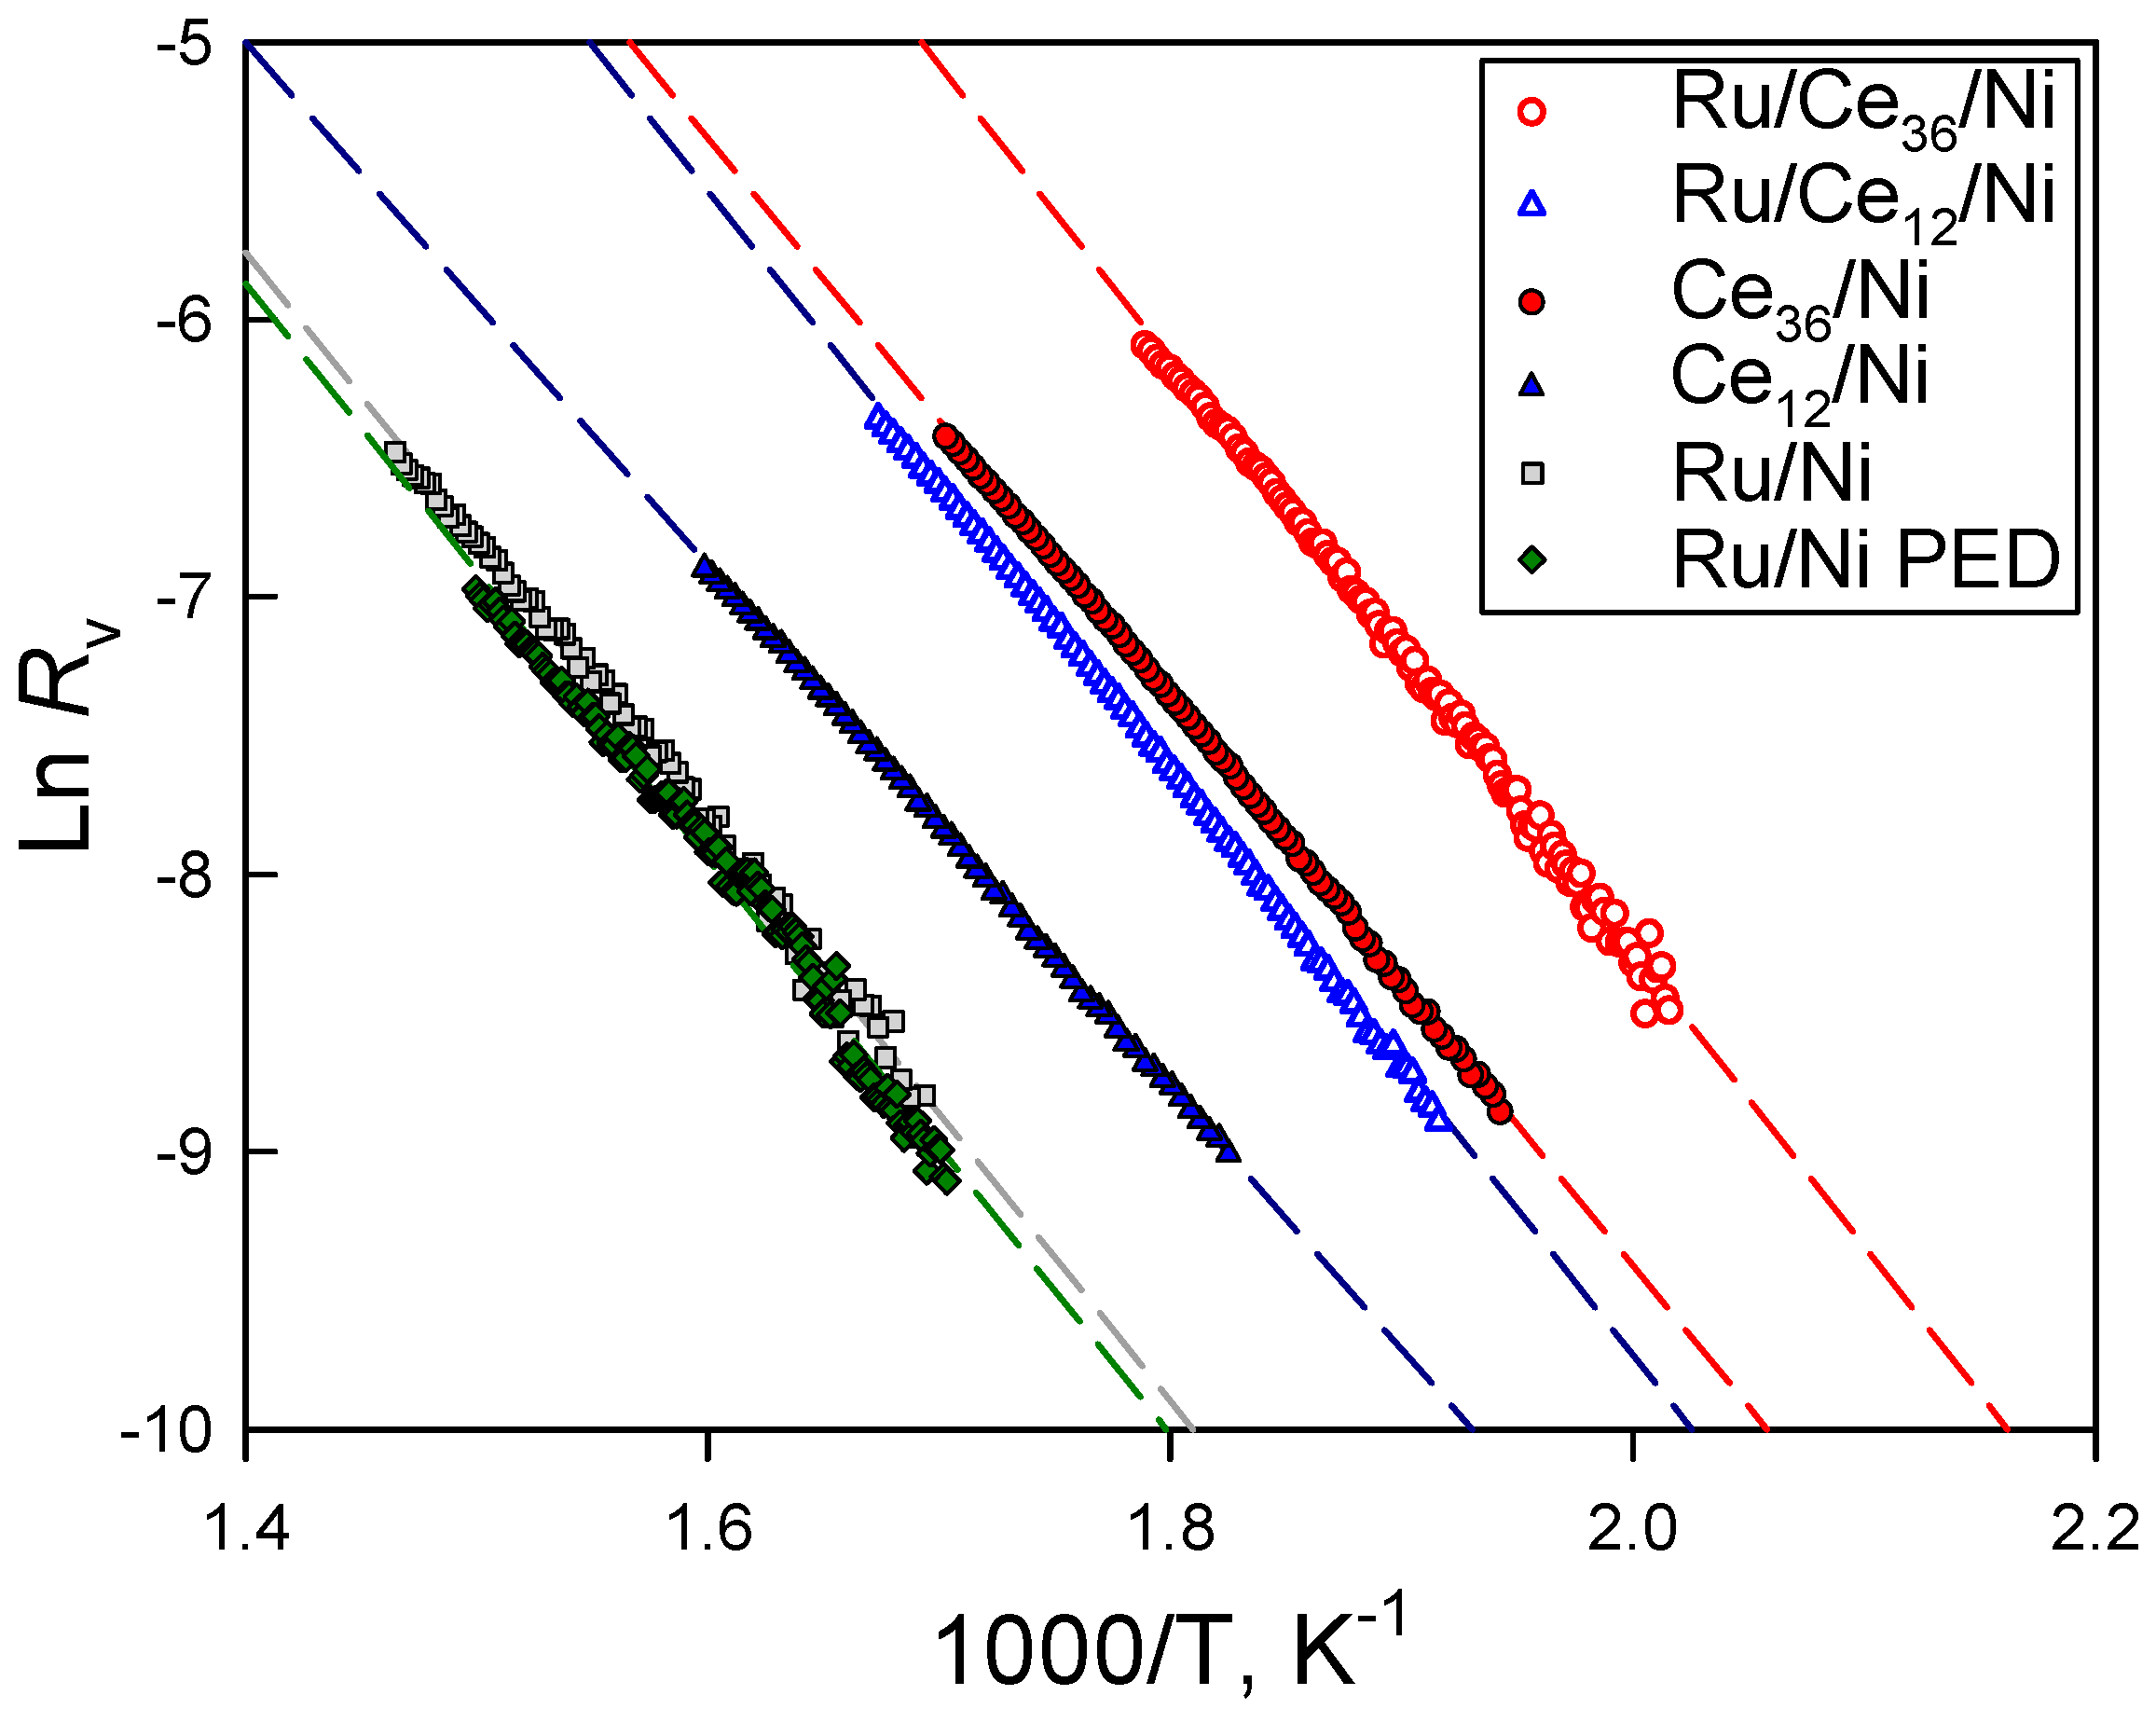
The Arrhenius plots (Figure 6) derived from experimental data at low conversion (<10%) show a linear trend for all samples indicating the dominance of a kinetic regime in the specific temperature range selected for each catalyst. Therefore, Table 2 reports values of the apparent activation energy (Ea) calculated from the slopes of Arrhenius plots, the volumetric CO2 reaction rates measured at 300 °C and the corresponding CH4 process selectivity at the same temperature. However, it should be recalled that two reactions, CO2 methanation and RWGS, run simultaneously under the present conditions. Thus, the estimated values of Ea arise from both reactions, the contribution of which to the activation energy cannot be accurately clarified. Estimates of the intrinsic rates of CO2 consumption at 300 °C per unit of surface area of foam catalysts as well as per gram of Ru (normalized with respect to the reference Ru/Ni foam) are also presented in the same table.
In particular, the apparent activation energy values for CO2 consumption measured for the foam catalysts containing Ru were quite similar to each other (86.3 ± 1.1 kJ mol−1), suggesting that all these catalysts obey the same reaction mechanism and have the same rate limiting step [28,44]. In fact, Cex/Ni catalysts also showed similar values (82.3 ± 3.1 kJ mol−1) of apparent activation energy. This agrees well with previous literature reports on Ru/CeO2 and Ni/CeO2 catalysts suggesting that the activation of CO2 on oxygen vacancies of CeO2 is the common rate determining step for both type of systems [42].
Accordingly, the common value of Ea estimated in this work is very close to what was generally reported for the formation of CO on Ru/Al2O3 (ca. 82 kJ mol−1) that is only slightly higher than the values reported for the production of methane on supported Ru catalysts [45]. However, our data show a high process selectivity towards the production of CO rather than CH4 when Ru was directly deposited on bare Ni foams and the overall activity is low. On the contrary, the presence of CeO2 strongly promoted the reaction route towards methane, without altering the apparent activation energy. The increase of selectivity and yield to CH4 rather than CO along with the increase in the load of CeO2 at fixed inlet gas flow rate agrees with a reaction mechanism involving CO as reaction intermediate [9], and a CH4 formation rate which is controlled by the conversion of CO2 to CO [46,47] under the experimental conditions explored in this study.
After normalization of the reaction rate data for the surface area of Cex/Ni and Ru/Cex/Ni foams (Table 2) it results that both Cex/Ni samples achieve a similar performance, whereas this figure is higher for Ru/Ce12/Ni and Ru/Ce36/Ni by a factor ca. 3 and 6, respectively. It can be argued that relatively high Ce/Ru ratios are required to effectively disperse the noble metal and, in turn, to maximize the number of catalytic active sites at a fixed Ru loading. As a consequence, the CO2 reaction rate scaled with the oxide loading in the catalyst and increased by a factor as high as 42 when referred to the unit mass of the noble metal (Table 2). It also results that Ru nanostructures formed by the PED method displayed a faster CO2 consumption rate per gram of metal (by a factor ca. 2.4) with respect to their counterparts obtained by a simple impregnation method, most probably related to the larger exposed specific surface area of the former.
Comparing (volumetric) reaction rate data for Cex/Ni and Ru/Cex/Ni foams vs. Ni and Ru/Ni foams, it appears clear that the enhanced catalytic activity is caused by the simultaneous development of active sites both at the Ru/CeO2 and CeO2/Ni interfaces. Notably, the order of catalytic performance among foam catalysts follow the same trend of reducibility measured by H2-TPR experiments. This result confirms the key role of a strong interaction between both Ru and Ni with CeO2 in order to provide a large number of easily regenerable oxygen vacancies on the surface of the oxide where CO2 is activated [1,9,44].
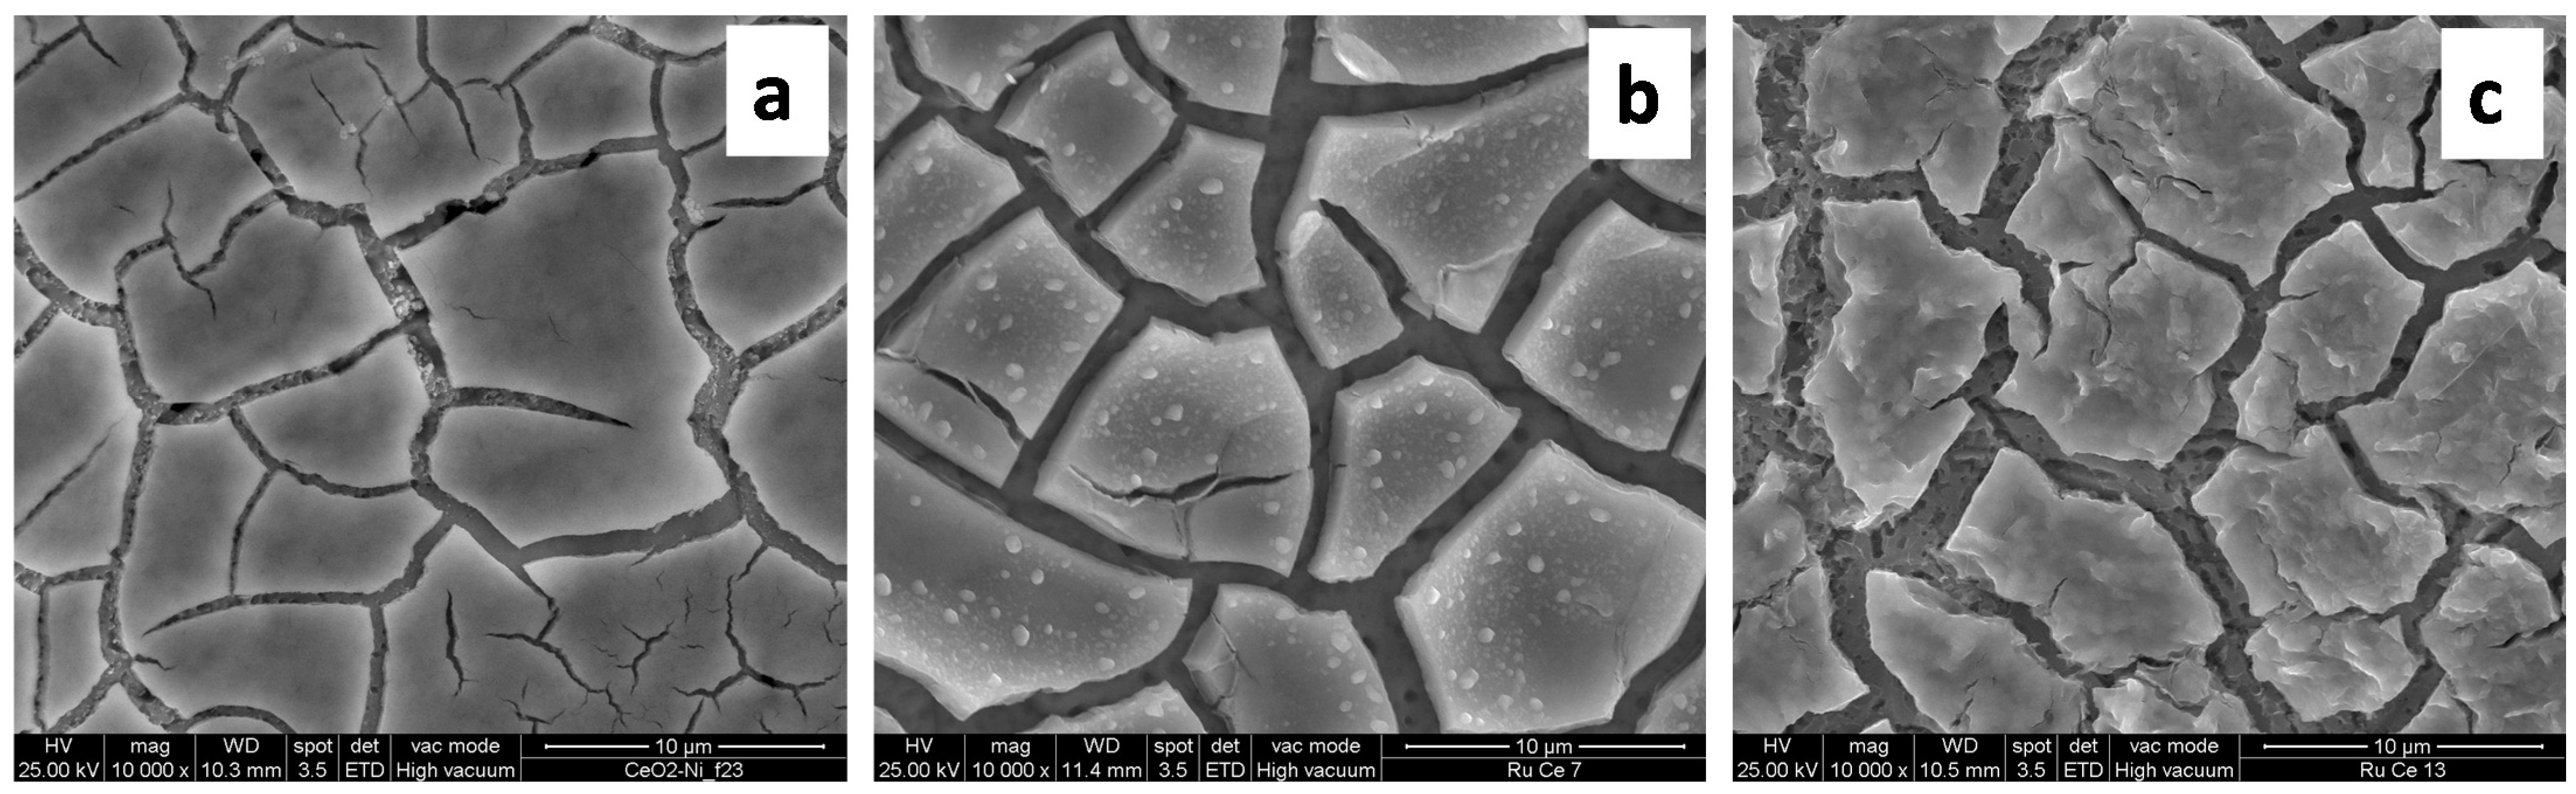
Cex/Ni and Ru/Cex/Ni catalysts were inspected again with SEM after the catalytic tests. Figure 7a shows the formation of many cracks in Ce12/Ni, but an essentially unaltered well-adhered ceria layer on most of the Ni surface. As for Ru/Ce12/Ni, in addition to enhanced cracking, Figure 7b shows the formation of Ru enriched nuclei of various characteristic sizes up to ca. 1 µm wide not detectable for the as-prepared catalyst (Figure 2c). This suggest the occurrence of metal sintering during operation at temperature up to 450 °C that is most probably due to the relatively low Ce/Ru ratio in those catalysts. Indeed, the behavior of Ce36/Ni and Ru/Ce36/Ni (Figure 7c) was similar, but the formation of Ru nuclei was not observed, because in the as-prepared sample Ru was more effectively dispersed in the pores of the thicker CeO2 layer and thus metal sintering was prevented. Nevertheless, the partial detachment of the oxide layer at higher loadings obviously reduced the contact area between Ni and CeO2.
Given the limited adhesion of thick CeO2 overlayers on the struts of the Ni foam precluding high oxide loadings on the catalysts, and considering the evident benefit in terms of intrinsic methanation activity and selectivity deriving from a relatively high dispersion of Ru in the pores of CeO2 as well as from the maximization of the interface between CeO2 and Ni foam, it follows that room is left for the optimization of the catalyst formulation, which, however, is beyond the scope of the present work.
3. Materials and Methods
3.1. Catalysts Preparation
The Ni foams (75 ppi) were purchased from INCOFOAM TM. Their specific surface area was determined by cyclic voltammetry carried out in 1.0 M KOH through the measurement of the charge associated with the Ni(II)/Ni(III) system, as described in [41]. The deposition of CeO2 was carried out in single-compartment cells from 0.100 M Ce(NO3)3 solutions. Counter electrode was a Pt wire and a Saturated Calomel Electrode (SCE) was the reference. Electrolyses were performed at −1.2 V (SCE) constant potential. Two different deposition charges were used (12 C cm−3 and 36 C cm−3) and the actual loading of CeO2 was estimated by the weight increase of the samples. All electrochemical experiments were performed with an Autolab PGSTAT 302 N (Autolab, Utrecht, Netherlands). Ru was deposited by dropwise addition of 0.25 mL of a Ru(III) nitrosyl nitrate water solution (1.4% wt. of Ru, Aldrich) leading to a nominal noble metal loading of 7.3 mgRu cm−3. Impregnated foams were dried at 120 °C for 12 h in air and finally reduced at 450 °C for 1 h under a flow of 20% vol. H2/N2. Ru/Ni catalysts were prepared with a similar procedure by the dropwise addition of the Ru(III) nitrosyl nitrate solution to bare Ni foam samples. In this case, the noble metal load was confirmed to be within ±10% of its nominal value by the weight increase of the samples. Other CeO2-free catalysts, henceforth called Ru/Ni-PED, were prepared by submitting Ni foams to pulsed electrodeposition of Ru. Foam samples were immersed in 0.002 M RuCl3 + 1 M NaCl solutions, at pH 2.0, 25 °C, and their potential was pulsed between E1 = −0.8 V (SCE) and E2 = 0.0 V (SCE) during t1 = 0.1 s and t2 = 0.3 s for 1000 cycles. Unlike Ru/Ni, Ru/Ni-PED catalysts underwent no thermal treatment. For both samples, the surface area of Ru was evaluated the by recording cyclic voltammograms in 1.0 M KOH, measuring the charge associated to H desorption and comparing it with the corresponding charge measured on a quasi-ideally flat Ru electrode [48]. This method requires that the Ru deposits be in electrical contact with the Ni foam. For this reason, it could not be applied to Ru/Cex/Ni samples where the Ru nano-particles were dispersed in the electrically insulating CeO2 layers.
3.2. Catalysts Characterization
Scanning electron microscopy (SEM) images were obtained with a FEI-Quanta 200 FEM ESEM instrument (Thermo Fisher Scientific, Waltham, MA, USA) and a Zeiss-SIGMA instrument (ZEISS, Oberkochen, Germany), both equipped with a field emission gun, operating at an accelerating voltage variable between 10 and 30 kV under high vacuum conditions. Energy Dispersive Spectroscopy analyses (EDS), used to confirm the presence of specific elements (Ru and Ce) in the deposits formed on the Ni foams, were performed with an EDAX Genesis System (Ametek Materials Analysis Division) in the case of FEI-Quanta instrument and with and Oxford X-MAX apparatus (Oxford Instruments, Oxford, UK) in the case of Zeiss-SIGMA instrument.
X-ray diffraction (XRD) patterns were collected by using a Philips X-PERT PW3710 diffractometer (Philips, Amsterdam, the Netherlands) with a Bragg–Brentano geometry, employing a CuKa source (40 kV, 30 mA). Ahead of the XRD analyses, the foams were compressed to obtain flat, ca. 0.5 mm thick samples.
The textural properties of Cex/Ni and Ru/Cex/Ni catalysts were determined by N2 adsorption at −196 °C using a Quantachrome Autosorb 1-C instrument analyzer (Quantachrome Instruments, Boynton Beach, FL, USA). Foam samples were degassed under high vacuum at 150 °C for 3 h ahead of analyses. The BET method (P/P0 range from 0.08 to 0.2) was adopted for the calculation of the specific surface area (S.S.A.); the pore size distribution (PSD) was evaluated via the NL-DFT (cylindrical pore) model applied to the desorption branch of the isotherm.
H2 temperature programmed reduction (TPR) experiments were performed with a Micromeritics AutoChem 2020 (Micromeritics, Norcross, GA, USA) equipped with a TC detector. Samples of foam catalysts (70–100 mg) were pre-oxidized in-situ under an air flow at 300 °C for 1 h, then cooled to room temperature and finally reduced under a 5%H2/Ar flow (50 cm3 min−1) ramping the temperature up to 600 °C at 10 °C min−1.
3.3. Catalytic Testing
The catalytic hydrogenation of CO2 was investigated in a fixed-bed quartz tubular reactor (din = 20 mm) operated under atmospheric pressure and externally heated by an electric oven [13]: 5/6 metal foam disks were stacked together and wrapped with a ceramic tape to prevent the by-pass of gas along the inner walls of the reactor. Two K-type thermocouples were used to measure the reaction temperature of the front and back catalytic foams of the stack. The catalysts were pre-reduced in-situ under a flow of 20% vol. H2/N2 at 450 °C before testing. The feed composition was adjusted to CO2/H2/N2 = 1/4/5 (by vol.) by premixing calibrated fluxes of high-purity gases (CO2, H2, N2) using three independent mass flow controllers (mod. 5850 Brooks Instrument, Veenendaal, the Netherlands): the total inlet flow rate set at 20 SL h−1, corresponding to a Gas Hourly Space Velocity (GHSV) = 6600–7870 h−1 based on the volume of the foams. Reaction tests were run in the temperature programmed mode by ramping the temperature up to 450 °C at 3 °C min−1. The concentrations of CO, CO2, CH4, and H2 were measured in real-time using a gas analyzer with cross-sensitivity corrections (Optima Advance, ABB, Zurich, Switzerland) after removing water through a chiller and a CaCl2 trap [49].
The conversion of CO2 and the corresponding process selectivity to CH4 were calculated according to following definitions based on measured dry molar fractions of CO2, CH4, and CO in the products, considering the eventual formation of traces of higher hydrocarbons negligible [46]:
The Gaseq software was employed to evaluate equilibrium conversion and selectivity values at constant temperature and pressure.
The CO2 consumption rate per unit volume of catalytic foams (RvCO2) was estimated under the assumption of an isothermal plug flow reactor working under differential conditions and constant molar flow rate: low conversion data (<10%, ΔTout-in < 5 °C) far from equilibrium were used for the calculations. Arrhenius plots for RvCO2 were used to estimate the apparent activation energy of the catalytic hydrogenation of CO2 [49].
4. Conclusions
Novel structured catalysts were prepared starting from a commercial 3D open cell Ni foam with high pore density (75 ppi) onto which a CeO2 layer was deposited via electroprecipitation, and, eventually, Ru was added by impregnation.
The mesoporous CeO2 layer, whose thickness was controlled by deposition charge, had specific surface area in the range 45–70 m2 g−1 and covered homogeneously the struts of the Ni foam. The morphology and adherence of the CeO2 layer were preserved under reaction conditions up to 450 °C if the thickness was low (0.3–1 μm), whereas thicker layers (1.5–3.5 μm) cracked and partially detached from the struts.
Discontinuous layers of amorphous Ru formed in Ru/Ni catalysts prepared by direct impregnation, probably via a Ru-Ni galvanic displacement reaction. More continuous Ru layers were produced by pulsed electrodeposition. In both cases, the surface area of Ru remained below that of Ni, since Ru did not form well-dispersed, large-area nanometric deposits. At variance, Ru was well dispersed in the pores of the CeO2 layer.
The close interaction of the CeO2 layer with the underlying Ni foam and the Ru facilitated the reduction process of the oxide via a spill-over effect of H2 from Ni and Ru to CeO2, and promoted the extensive formation of oxygen vacancies and/or surface OH groups on CeO2, which were active sites for the adsorption and activation of CO2.
The direct deposition of Ru on the Ni foams promoted the conversion of CO2 to form mostly CO via the reverse water gas shift reaction. The electrodeposition of the CeO2 layer on the Ni foam effectively promoted the hydrogenation of CO2, with the process selectivity to methane increasing along with the CeO2 loading. The deposition of Ru further enhanced the methanation activity following the same order of reducibility found in H2-TPR experiments.
The presence of CeO2 strongly enhanced the yield and selectivity to methane, without altering the apparent activation energy: this suggests that the activation of CO2 on oxygen vacancies is the rate determining step and CH4 formation proceeds via a CO intermediate route.
Considering their outstanding mass- and heat-transfer features, Ru/Cex/Ni foam catalysts appear to be particularly suited for the intensification of highly exothermic catalytic processes operating under external mass transfer limitations, i.e., when the drawback of a limited volumetric loading of the catalytic active phase does not represent a critical issue.
Supplementary Materials
The following are available online at https://0-www-mdpi-com.brum.beds.ac.uk/2073-4344/11/1/13/s1, Figure S1: SEM images of Ce36/Ni and Ru/Ce36/Ni; Figure S2: SEM images of as-prepared Ru/Ni and Ru/Ni-PED; Figure S3: Cyclic voltammograms recorded with Ru/Ni and Ru/Ni PED catalysts; Figure S4: XRD spectra of Ce32/Ni, Ru/Ce32/Ni, Ru/Ni, Ru/Ni PED, and bare Ni foam.
Author Contributions
Conceptualization: S.C. and L.V.-G.; data curation: S.C., E.M.C., S.F., and L.V.-G.; formal analysis: S.C., L.L., and L.V.-G.; funding acquisition: S.C.; investigation: S.C., E.M.C., and L.V.-G.; project coordination: S.C.; supervision: S.C. and M.M.; writing—original draft: S.C., L.V.-G., and M.M.; writing—review & editing, L.L., M.M., and L.V.-G. All authors have read and agreed to the published version of the manuscript.
Funding
The financial support of the Italian Ministry for Economic Development (MiSE) under MiSE-CNR Agreement on National Electrical System is acknowledged.
Data Availability Statement
The data presented in this study are available on request from the corresponding author.
Conflicts of Interest
The authors declare no conflict of interest.
References
- Ghaib, K.; Ben-Fares, F.Z. Power-to-Methane: A state-of-the-art review. Renew. Sustain. Energy Rev. 2018, 81, 433–446. [Google Scholar] [CrossRef]
- Vogt, C.; Monai, M.; Kramer, G.J.; Weckhuysen, B.M. The renaissance of the Sabatier reaction and its applications on Earth and in space. Nat. Catal. 2019, 2, 188–197. [Google Scholar] [CrossRef]
- Artz, J.; Müller, T.E.; Thenert, K.; Kleinekorte, J.; Meys, R.; Sternberg, A.; Bardow, A.; Leitner, W. Sustainable Conversion of Carbon Dioxide: An Integrated Review of Catalysis and Life Cycle Assessment. Chem. Rev. 2018, 118, 434–504. [Google Scholar] [CrossRef] [PubMed]
- Nguyen, T.T.M.; Wissing, L.; Skjøth-Rasmussen, M.S. High temperature methanation: Catalyst considerations. Catal. Today 2013, 215, 233–238. [Google Scholar] [CrossRef]
- Ricca, A.; Truda, L.; Palma, V. Study of the role of chemical support and structured carrier on the CO2 methanation reaction. Chem. Eng. J. 2018, 377, 120461. [Google Scholar] [CrossRef]
- Fukuhara, C.; Hayakawa, K.; Suzuki, Y.; Kawasaki, W.; Watanabe, R. A novel nickel-based structured catalyst for CO2 methanation: A honeycomb-type Ni/CeO2 catalyst to transform greenhouse gas into useful resources. Appl. Catal. A Gen. 2017, 532, 12–18. [Google Scholar] [CrossRef]
- Li, Y.; Zhang, Q.; Chai, R.; Zhao, G.; Liu, Y.; Lu, Y. Structured Ni-CeO2-Al2O3/Ni-Foam Catalyst with Enhanced Heat Transfer for Substitute Natural Gas Production by Syngas Methanation. ChemCatChem 2015, 7, 1427–1431. [Google Scholar] [CrossRef]
- Nguyen, H.T.T.; Kumabe, Y.; Ueda, S.; Kan, K.; Ohtani, M.; Kobiro, K. Highly durable Ru catalysts supported on CeO2 nanocomposites for CO2 methanation. Appl. Catal. A Gen. 2019, 577, 35–43. [Google Scholar] [CrossRef]
- Lee, S.M.; Lee, Y.H.; Moon, D.H.; Ahn, J.Y.; Nguyen, D.D.; Chang, S.W.; Kim, S.S. Reaction Mechanism and Catalytic Impact of Ni/CeO2–x Catalyst for Low-Temperature CO2 Methanation. Ind. Eng. Chem. Res. 2019, 58, 8656–8662. [Google Scholar] [CrossRef]
- Giani, L.; Groppi, G.; Tronconi, E. Mass-Transfer Characterization of Metallic Foams as Supports for Structured Catalysts. Ind. Eng. Chem. Res. 2005, 44, 4993–5002. [Google Scholar] [CrossRef]
- Lucci, F.; Della Torre, A.; Montenegro, G.; Dimopoulos Eggenschwiler, P. On the catalytic performance of open cell structures versus honeycombs. Chem. Eng. J. 2015, 264, 514–521. [Google Scholar] [CrossRef]
- Cimino, S.; Gambirasi, A.; Lisi, L.; Mancino, G.; Musiani, M.; Vázquez-Gómez, L.; Verlato, E. Catalytic combustion of methanol on Pt-Fecralloy foams prepared by electrodeposition. Chem. Eng. J. 2015, 285, 276–285. [Google Scholar] [CrossRef]
- Verlato, E.; Barison, S.; Cimino, S.; Lisi, L.; Mancino, G.; Musiani, M.; Paolucci, F. Electrochemical preparation of nanostructured CeO2-Pt catalysts on Fe-Cr-Al alloy foams for the low-temperature combustion of methanol. Chem. Eng. J. 2017, 317, 551–560. [Google Scholar] [CrossRef]
- Ho, P.H.; Ambrosetti, M.; Groppi, G.; Tronconi, E.; Jaroszewicz, J.; Ospitali, F.; Rodriguez-Castellon, E.; Fornasari, G.; Vaccari, A.; Benito, P. One-step electrodeposition of Pd-CeO2 on high pore density foams for environmental catalytic processes. Catal. Sci. Technol. 2018, 8, 4678–4689. [Google Scholar] [CrossRef]
- Zhang, Z.; Ding, J.; Chai, R.; Zhao, G.; Liu, Y.; Lu, Y. Oxidative dehydrogenation of ethane to ethylene: A promising CeO2-ZrO2-modified NiO-Al2O3/Ni-foam catalyst. Appl. Catal. A Gen. 2018, 550, 151–159. [Google Scholar] [CrossRef]
- Benito, P.; Nuyts, G.; Monti, M.; De Nolf, W.; Fornasari, G.; Janssens, K.; Scavetta, E.; Vaccari, A. Stable Rh particles in hydrotalcite-derived catalysts coated on FeCrAlloy foams by electrosynthesis. Appl. Catal. B Environ. 2015, 179, 321–332. [Google Scholar] [CrossRef]
- Ho, P.H.; De Nolf, W.; Ospitali, F.; Beton, D.; Torkuhl, L.; Fornasari, G.; Vaccari, A.; Benito, P. Insights into coated NiCrAl open-cell foams for the catalytic partial oxidation of CH4. React. Chem. Eng. 2019, 4, 1768–1778. [Google Scholar] [CrossRef]
- Cimino, S.; Lisi, L.; Mancino, G.; Musiani, M.; Vázquez-Gómez, L.; Verlato, E. Catalytic partial oxidation of CH4–H2 mixtures over Ni foams modified with Rh and Pt. Int. J. Hydrogen Energy 2012, 37, 17040–17051. [Google Scholar] [CrossRef]
- Coleman, L.J.I.; Croiset, E.; Epling, W.; Fowler, M.; Hudgins, R.R. Evaluation of Foam Nickel for the Catalytic Partial Oxidation of Methane. Catal. Lett. 2008, 128, 144–153. [Google Scholar] [CrossRef]
- Verlato, E.; Barison, S.; Cimino, S.; Dergal, F.; Lisi, L.; Mancino, G.; Musiani, M.; Vázquez-Gómez, L. Catalytic partial oxidation of methane over nanosized Rh supported on Fecralloy foams. Int. J. Hydrogen Energy 2014, 39, 11473–11485. [Google Scholar] [CrossRef]
- Frey, M.; Bengaouer, A.; Geffraye, G.; Edouard, D.; Roger, A.C. Aluminum Open Cell Foams as Efficient Supports for Carbon Dioxide Methanation Catalysts: Pilot-Scale Reaction Results. Energy Technol. 2017, 5, 2078–2085. [Google Scholar] [CrossRef]
- Huynh, H.L.; Yu, Z. CO2 Methanation on Hydrotalcite-Derived Catalysts and Structured Reactors: A Review. Energy Technol. 2020, 8, 1901475. [Google Scholar] [CrossRef] [Green Version]
- Li, Y.; Zhang, Q.; Chai, R.; Zhao, G.; Liu, Y.; Lu, Y.; Cao, F. Ni-Al2O3/Ni-foam catalyst with enhanced heat transfer for hydrogenation of CO2 to methane. AIChE J. 2015, 61, 4323–4331. [Google Scholar] [CrossRef]
- Li, Y.; Zhang, Q.; Chai, R.; Zhao, G.; Cao, F.; Liu, Y.; Lu, Y. Metal-foam-structured Ni-Al2O3 catalysts: Wet chemical etching preparation and syngas methanation performance. Appl. Catal. A Gen. 2016, 510, 216–226. [Google Scholar] [CrossRef]
- Montebelli, A.; Visconti, C.G.; Groppi, G.; Tronconi, E.; Kohler, S.; Venvik, H.J.; Myrstad, R. Washcoating and chemical testing of a commercial Cu/ZnO/Al2O3 catalyst for the methanol synthesis over copper open-cell foams. Appl. Catal. A Gen. 2014, 481, 96–103. [Google Scholar] [CrossRef]
- Polanski, J.; Lach, D.; Kapkowski, M.; Bartczak, P.; Siudyga, T.; Smolinski, A. Ru and Ni—Privileged Metal Combination for Environmental Nanocatalysis. Catalysts 2020, 10, 992. [Google Scholar] [CrossRef]
- Le, T.A.; Kim, M.S.; Lee, S.H.; Kim, T.W.; Park, E.D. CO and CO2 methanation over supported Ni catalysts. Catal. Today 2017, 293–294, 89–96. [Google Scholar] [CrossRef]
- Tada, S.; Shimizu, T.; Kameyama, H.; Haneda, T.; Kikuchi, R. Ni/CeO2 catalysts with high CO2 methanation activity and high CH4 selectivity at low temperatures. Int. J. Hydrogen Energy 2012, 37, 5527–5531. [Google Scholar] [CrossRef]
- Zhou, Y.; Switzer, J.A. Growth of cerium(IV) oxide films by the electrochemical generation of base method. J. Alloys Compd. 1996, 237, 1–5. [Google Scholar] [CrossRef]
- Aldykiewicz, A.J., Jr.; Davenport, A.J.; Isaacs, H.S. Studies of the formation of cerium-rich protective films using X-Ray absorption near-edge spectroscopy and rotating disk electrode methods. J. Electrochem. Soc. 1996, 143, 147–154. [Google Scholar] [CrossRef]
- Li, F.-B.; Newman, R.C.; Thompson, G.E. In situ atomic force microscopy studies of electrodeposition mechanism of cerium oxide films: Nucleation and growth out of a gel mass precursor. Electrochim. Acta 1997, 42, 2455–2464. [Google Scholar] [CrossRef]
- Fernandes, V.; Klein, J.J.; Schreiner, W.H.; Mattoso, N.; Mosca, D.H. Electrodeposition of nanocrystalline CeO2 on Si(001). J. Electrochem. Soc. 2009, 156, E199–E204. [Google Scholar] [CrossRef]
- Faisal, F.; Toghan, A.; Khalakhan, I.; Vorokhta, M.; Matolin, V.; Libuda, J. Characterization of thin CeO2 films electrochemically deposited on HOPG. Appl. Surf. Sci. 2015, 350, 142–148. [Google Scholar] [CrossRef]
- Verlato, E.; Barison, S.; Einaga, Y.; Fasolin, S.; Musiani, M.; Nasi, L.; Natsui, K.; Paolucci, F.; Valenti, G. CO2 reduction to formic acid at low overpotential on BDD electrodes modified with nanostructured CeO2. J. Mater. Chem. A 2019, 7, 17896–17905. [Google Scholar] [CrossRef]
- Creus, J.; Brezault, F.; Rebere, C.; Gadouleau, M. Synthesis and characterisation of thin cerium oxide coatings elaborated by cathodic electrolytic deposition on steel substrate. Surf. Coat. Technol. 2006, 200, 4636–4645. [Google Scholar] [CrossRef]
- Hamlaoui, Y.; Pedraza, F.; Tifouti, L. Investigation of electrodeposited cerium oxide based films on carbon steel and of the induced formation of carbonated green rusts. Corros. Sci. 2008, 50, 2182–2188. [Google Scholar] [CrossRef]
- Hamlaoui, Y.; Pedraza, F.; Remazeilles, C.; Cohendoz, S.; Rébéré, C.; Tifouti, L.; Creus, J. Cathodic electrodeposition of cerium-based oxides on carbon steel from concentrated cerium nitrate solutions Part I. Electrochemical and analytical characterization. Mater. Chem. Phys. 2009, 113, 650–657. [Google Scholar] [CrossRef]
- Hamlaoui, Y.; Tifouti, L.; Remazeilles, C.; Pedraza, F. Cathodic electrodeposition of cerium based oxides on carbon steel from concentrated cerium nitrate. Part II: Influence of electrodeposition parameters and of the addition of PEG. Mater. Chem. Phys. 2010, 120, 172–180. [Google Scholar] [CrossRef]
- Bouchaud, B.; Balmain, J.; Bonnet, G.; Pedraza, F. Optimizing structural and compositional properties of electrodeposited ceria coatings for enhanced oxidation resistance of a nickel-based superalloy. Appl. Surf. Sci. 2013, 268, 218–224. [Google Scholar] [CrossRef]
- Bouchaud, B.; Balmain, J.; Bonnet, G.; Pedraza, F. Correlations between electrochemical mechanisms and growth of ceria based coatings onto nickel substrates. Electrochim. Acta 2013, 88, 798–806. [Google Scholar] [CrossRef]
- Verlato, E.; Cattarin, S.; Comisso, N.; Gambirasi, A.; Musiani, M.; Vázquez-Gómez, L. Preparation of Pd-Modified Ni Foam Electrodes and Their Use as Anodes for the Oxidation of Alcohols in Basic Media. Electrocatalysis 2012, 3, 48–58. [Google Scholar] [CrossRef]
- Sakpal, T.; Lefferts, L. Structure-dependent activity of CeO2 supported Ru catalysts for CO2 methanation. J. Catal. 2018, 367, 171–180. [Google Scholar] [CrossRef]
- Atzori, L.; Cutrufello, M.G.; Meloni, D.; Cannas, C.; Gazzoli, D.; Monaci, R.; Sini, M.F.; Rombi, E. Highly active NiO-CeO2 catalysts for synthetic natural gas production by CO2 methanation. Catal. Today 2018, 299, 183–192. [Google Scholar] [CrossRef]
- Wang, F.; Li, C.; Zhang, X.; Wei, M.; Evans, D.G.; Duan, X. Catalytic behavior of supported Ru nanoparticles on the {100}, {110}, and {111} facet of CeO2. J. Catal. 2015, 329, 177–186. [Google Scholar] [CrossRef]
- Kwak, J.H.; Kovarik, L.; Szanyi, J. CO2 Reduction on Supported Ru/Al2O3 Catalysts: Cluster Size Dependence of Product Selectivity. ACS Catal. 2013, 3, 2449–2455. [Google Scholar] [CrossRef]
- Falbo, L.; Martinelli, M.; Visconti, C.G.; Lietti, L.; Bassano, C.; Deiana, P. Kinetics of CO2 methanation on a Ru-based catalyst at process conditions relevant for Power-to-Gas applications. Appl. Catal. B Environ. 2018, 225, 354–363. [Google Scholar] [CrossRef]
- Janke, C.; Duyar, M.S.; Hoskins, M.; Farrauto, R. Catalytic and adsorption studies for the hydrogenation of CO2 to methane. Appl. Catal. B Environ. 2014, 152–153, 184–191. [Google Scholar] [CrossRef]
- Woods, R. Chemisorption at electrodes: Hydrogen and oxygen on noble metals and their alloys. In Electroanalytical Chemistry; Bard, A.J., Ed.; Marcel Dekker: New York, NY, USA, 1976; Volume 9, p. 1. [Google Scholar]
- Cimino, S.; Boccia, F.; Lisi, L. Effect of alkali promoters (Li, Na, K) on the performance of Ru/Al2O3 catalysts for CO2 capture and hydrogenation to methane. J. CO2 Util. 2020, 37, 195–203. [Google Scholar] [CrossRef]
Figure 1.
Images of the structured catalysts prepared starting from commercial Ni open cell foam disks with 75 pores per inch (ppi), via CeO2 electroprecipitation and impregnation with Ru.
Figure 1.
Images of the structured catalysts prepared starting from commercial Ni open cell foam disks with 75 pores per inch (ppi), via CeO2 electroprecipitation and impregnation with Ru.

Figure 2.
SEM images of as-prepared Ce12/Ni (a,b) and Ru/Ce12/Ni (c).

Figure 3.
N2 adsorption isotherm at 77K over Ce12/Ni foam catalyst (the adsorbed volume is referred to total weight). The insert shows the corresponding pore size distribution analysis by the NLDFT method applied to the desorption branch of the isotherm.
Figure 3.
N2 adsorption isotherm at 77K over Ce12/Ni foam catalyst (the adsorbed volume is referred to total weight). The insert shows the corresponding pore size distribution analysis by the NLDFT method applied to the desorption branch of the isotherm.

Figure 4.
H2-TPR plots for Ru/Ni, Cex/Ni and Ru/Cex/Ni foam catalysts and their bare Ni support following a 1 h oxidative pretreatment in air at 300 °C.
Figure 4.
H2-TPR plots for Ru/Ni, Cex/Ni and Ru/Cex/Ni foam catalysts and their bare Ni support following a 1 h oxidative pretreatment in air at 300 °C.

Figure 5.
CO2 conversion (a) and CH4 selectivity (b) as a function of the reaction temperature during the hydrogenation of CO2 over foam catalysts. Feed: CO2/H2/N2 = 1/4/5. Dashed lines represent thermodynamic equilibrium values (at constant T and P).
Figure 5.
CO2 conversion (a) and CH4 selectivity (b) as a function of the reaction temperature during the hydrogenation of CO2 over foam catalysts. Feed: CO2/H2/N2 = 1/4/5. Dashed lines represent thermodynamic equilibrium values (at constant T and P).

Figure 6.
Arrhenius plots for the specific (volumetric) rate of CO2 consumption during its hydrogenation over foam catalysts. Feed CO2/H2/N2 = 1/4/5 by volume.
Figure 6.
Arrhenius plots for the specific (volumetric) rate of CO2 consumption during its hydrogenation over foam catalysts. Feed CO2/H2/N2 = 1/4/5 by volume.

Figure 7.
SEM images of Ce12/Ni (a), Ru/Ce12/Ni (b), and Ru/Ce36/Ni (c) recorded after methanation tests.
Figure 7.
SEM images of Ce12/Ni (a), Ru/Ce12/Ni (b), and Ru/Ce36/Ni (c) recorded after methanation tests.


Table 1.
Composition, specific surface area (S.S.A.), and H2 consumption during temperature programmed reduction (TPR) experiments of the investigated foam catalysts.
Table 1.
Composition, specific surface area (S.S.A.), and H2 consumption during temperature programmed reduction (TPR) experiments of the investigated foam catalysts.
| Catalyst | CeO2 Loading mg cm−3 | Ru Deposition Method | Ru Loading mg cm−3 | S.S.A. a m2 gcatalyst−1 | S.S.A. a,b m2 gCeO2−1 | H2 Consumption d mmol gcatalyst−1 |
|---|---|---|---|---|---|---|
| Ni | --- | --- | --- | 0.085 c | 0.05 ± 0.005 | |
| Ru/Ni-PED | --- | Pulsed Electrodeposition | 2.5 (EDS) | 0.14 ± 0.01 | ||
| Ru/Ni | --- | Impregnation | 7.3 | 0.22 ± 0.02 | ||
| Ce12/Ni | 6.7 ± 1.8 | --- | --- | 1.6 ± 0.1 | 47 ± 12 | 0.14 ± 0.04 |
| Ce36/Ni | 23 ± 2 | --- | --- | 7.3 ± 0.3 | 67 ± 10 | 0.27 ± 0.04 |
| Ru/Ce12/Ni | 6.7 ± 1.8 | Impregnation | 7.3 | 1.8 ± 0.1 | 57 ± 15 | 0.26 ± 0.07 |
| Ru/Ce36/Ni | 23 ± 2 | Impregnation | 7.3 | 3.8 ± 0.2 | 39 ± 6 | 0.39 ± 0.06 |
a Measured by N2 adsorption on foam samples after catalytic testing and referred to the total catalyst mass, including Ni foam, CeO2 and Ru when present. b Based on the nominal CeO2 content of the “as-prepared” foams before the eventual deposition of Ru. c Determined by cyclic voltammetry. d During H2-TPR experiments on foam samples preoxidized in air at 300 °C for 1 h.
Table 2.
Apparent activation energy values for the hydrogenation of CO2 over foam catalysts; process selectivity to CH4 and CO2 reaction rates at 300 °C per unit volume and surface area of foam catalysts and per gram of Ru (normalized w.r.t. the value measured over Ru/Ni at the same temperature).
Table 2.
Apparent activation energy values for the hydrogenation of CO2 over foam catalysts; process selectivity to CH4 and CO2 reaction rates at 300 °C per unit volume and surface area of foam catalysts and per gram of Ru (normalized w.r.t. the value measured over Ru/Ni at the same temperature).
| Catalyst | Ea kJ mol−1 | CH4 Selectivity % | CO2 React. Rate mmol dm−3 s−1 | CO2 React. Rate mmol m−2 s−1 | Normalized CO2 React. Rate per g of Ru |
|---|---|---|---|---|---|
| Ru/Ni | 85.1 | 6.5 | 0.09 | - | 1 |
| Ru/Ni PED | 85.8 | 10.1 | 0.08 | - | 2.4 |
| Ru/Ce12/Ni | 87.0 | 91.6 | 0.86 | 2.1 | 9.2 |
| Ru/Ce36/Ni | 87.5 | 98.2 | 3.80 | 4.1 | 42.3 |
| Ce36/Ni | 84.5 | 90.6 | 1.13 | 0.6 | - |
| Ce12/Ni | 80.1 | 71.9 | 0.26 | 0.7 | - |
Publisher’s Note: MDPI stays neutral with regard to jurisdictional claims in published maps and institutional affiliations. |
© 2020 by the authors. Licensee MDPI, Basel, Switzerland. This article is an open access article distributed under the terms and conditions of the Creative Commons Attribution (CC BY) license (http://creativecommons.org/licenses/by/4.0/).
Share and Cite
MDPI and ACS Style
Cimino, S.; Cepollaro, E.M.; Lisi, L.; Fasolin, S.; Musiani, M.; Vázquez-Gómez, L. Ru/Ce/Ni Metal Foams as Structured Catalysts for the Methanation of CO2. Catalysts 2021, 11, 13. https://0-doi-org.brum.beds.ac.uk/10.3390/catal11010013
AMA Style
Cimino S, Cepollaro EM, Lisi L, Fasolin S, Musiani M, Vázquez-Gómez L. Ru/Ce/Ni Metal Foams as Structured Catalysts for the Methanation of CO2. Catalysts. 2021; 11(1):13. https://0-doi-org.brum.beds.ac.uk/10.3390/catal11010013
Chicago/Turabian StyleCimino, Stefano, Elisabetta Maria Cepollaro, Luciana Lisi, Stefano Fasolin, Marco Musiani, and Lourdes Vázquez-Gómez. 2021. "Ru/Ce/Ni Metal Foams as Structured Catalysts for the Methanation of CO2" Catalysts 11, no. 1: 13. https://0-doi-org.brum.beds.ac.uk/10.3390/catal11010013
Note that from the first issue of 2016, this journal uses article numbers instead of page numbers. See further details here.