
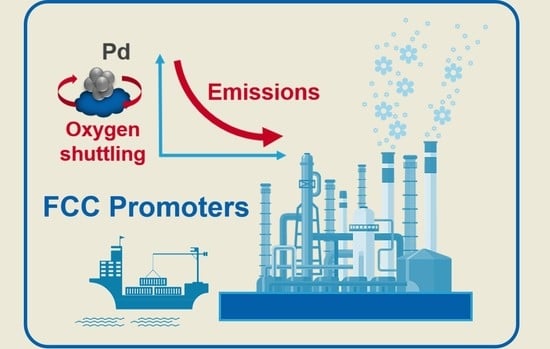
Practical Approaches towards NOx Emission Mitigation from Fluid Catalytic Cracking (FCC) Units


Abstract
:
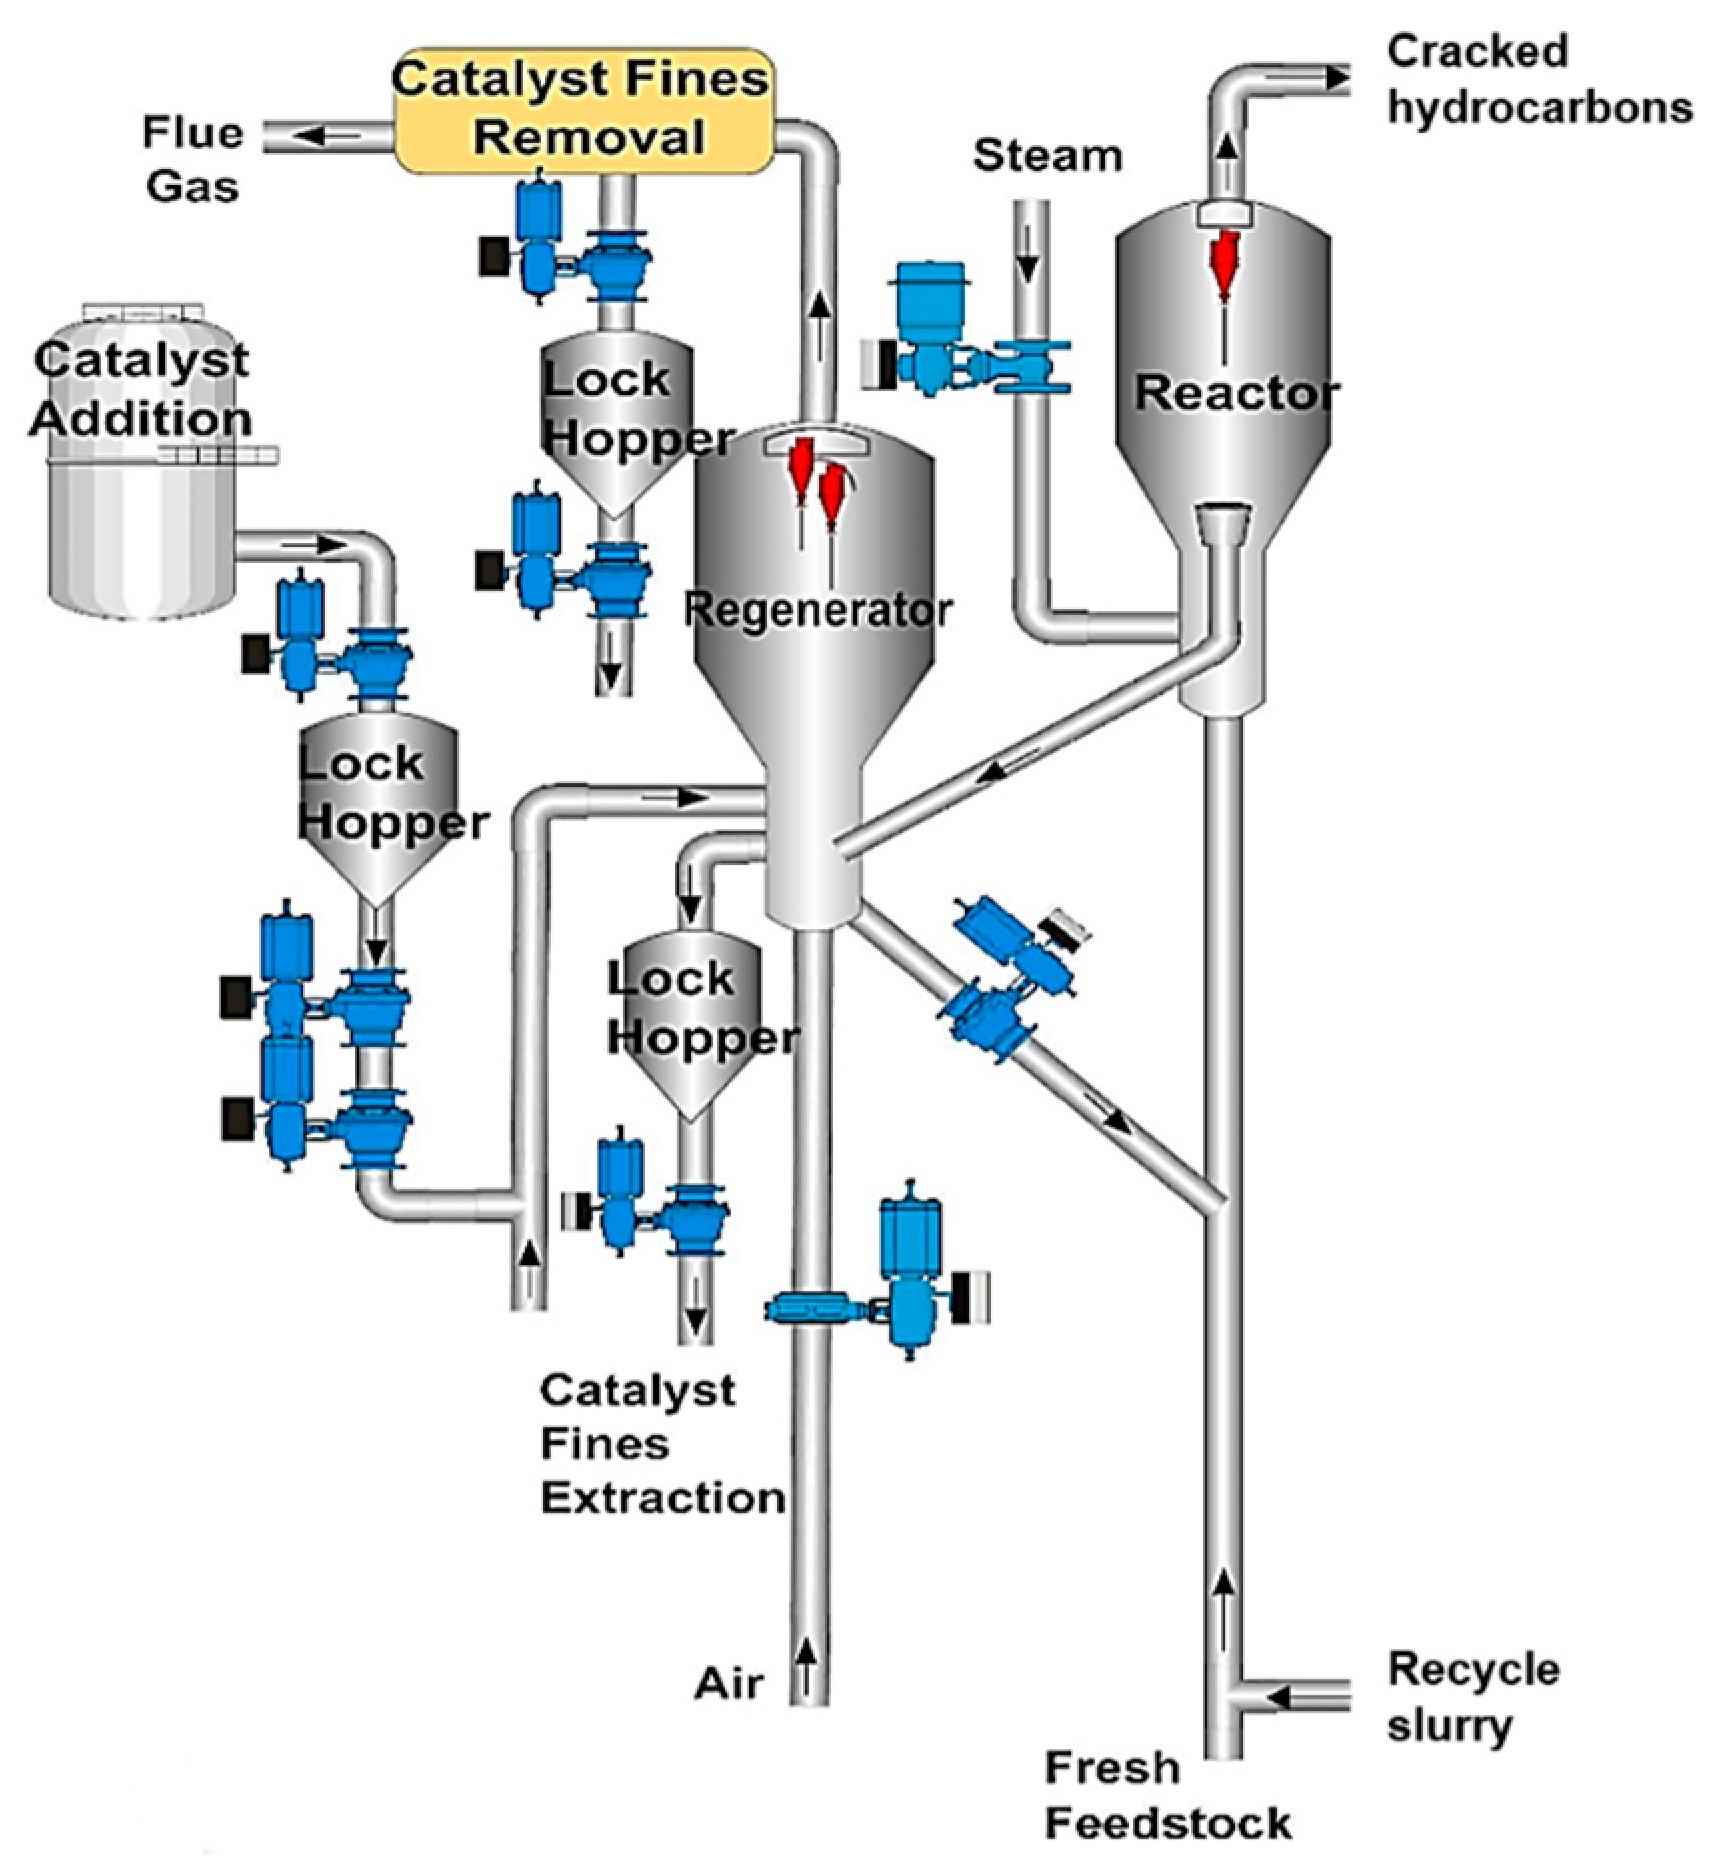
1. Instructions
2. Results and Discussion
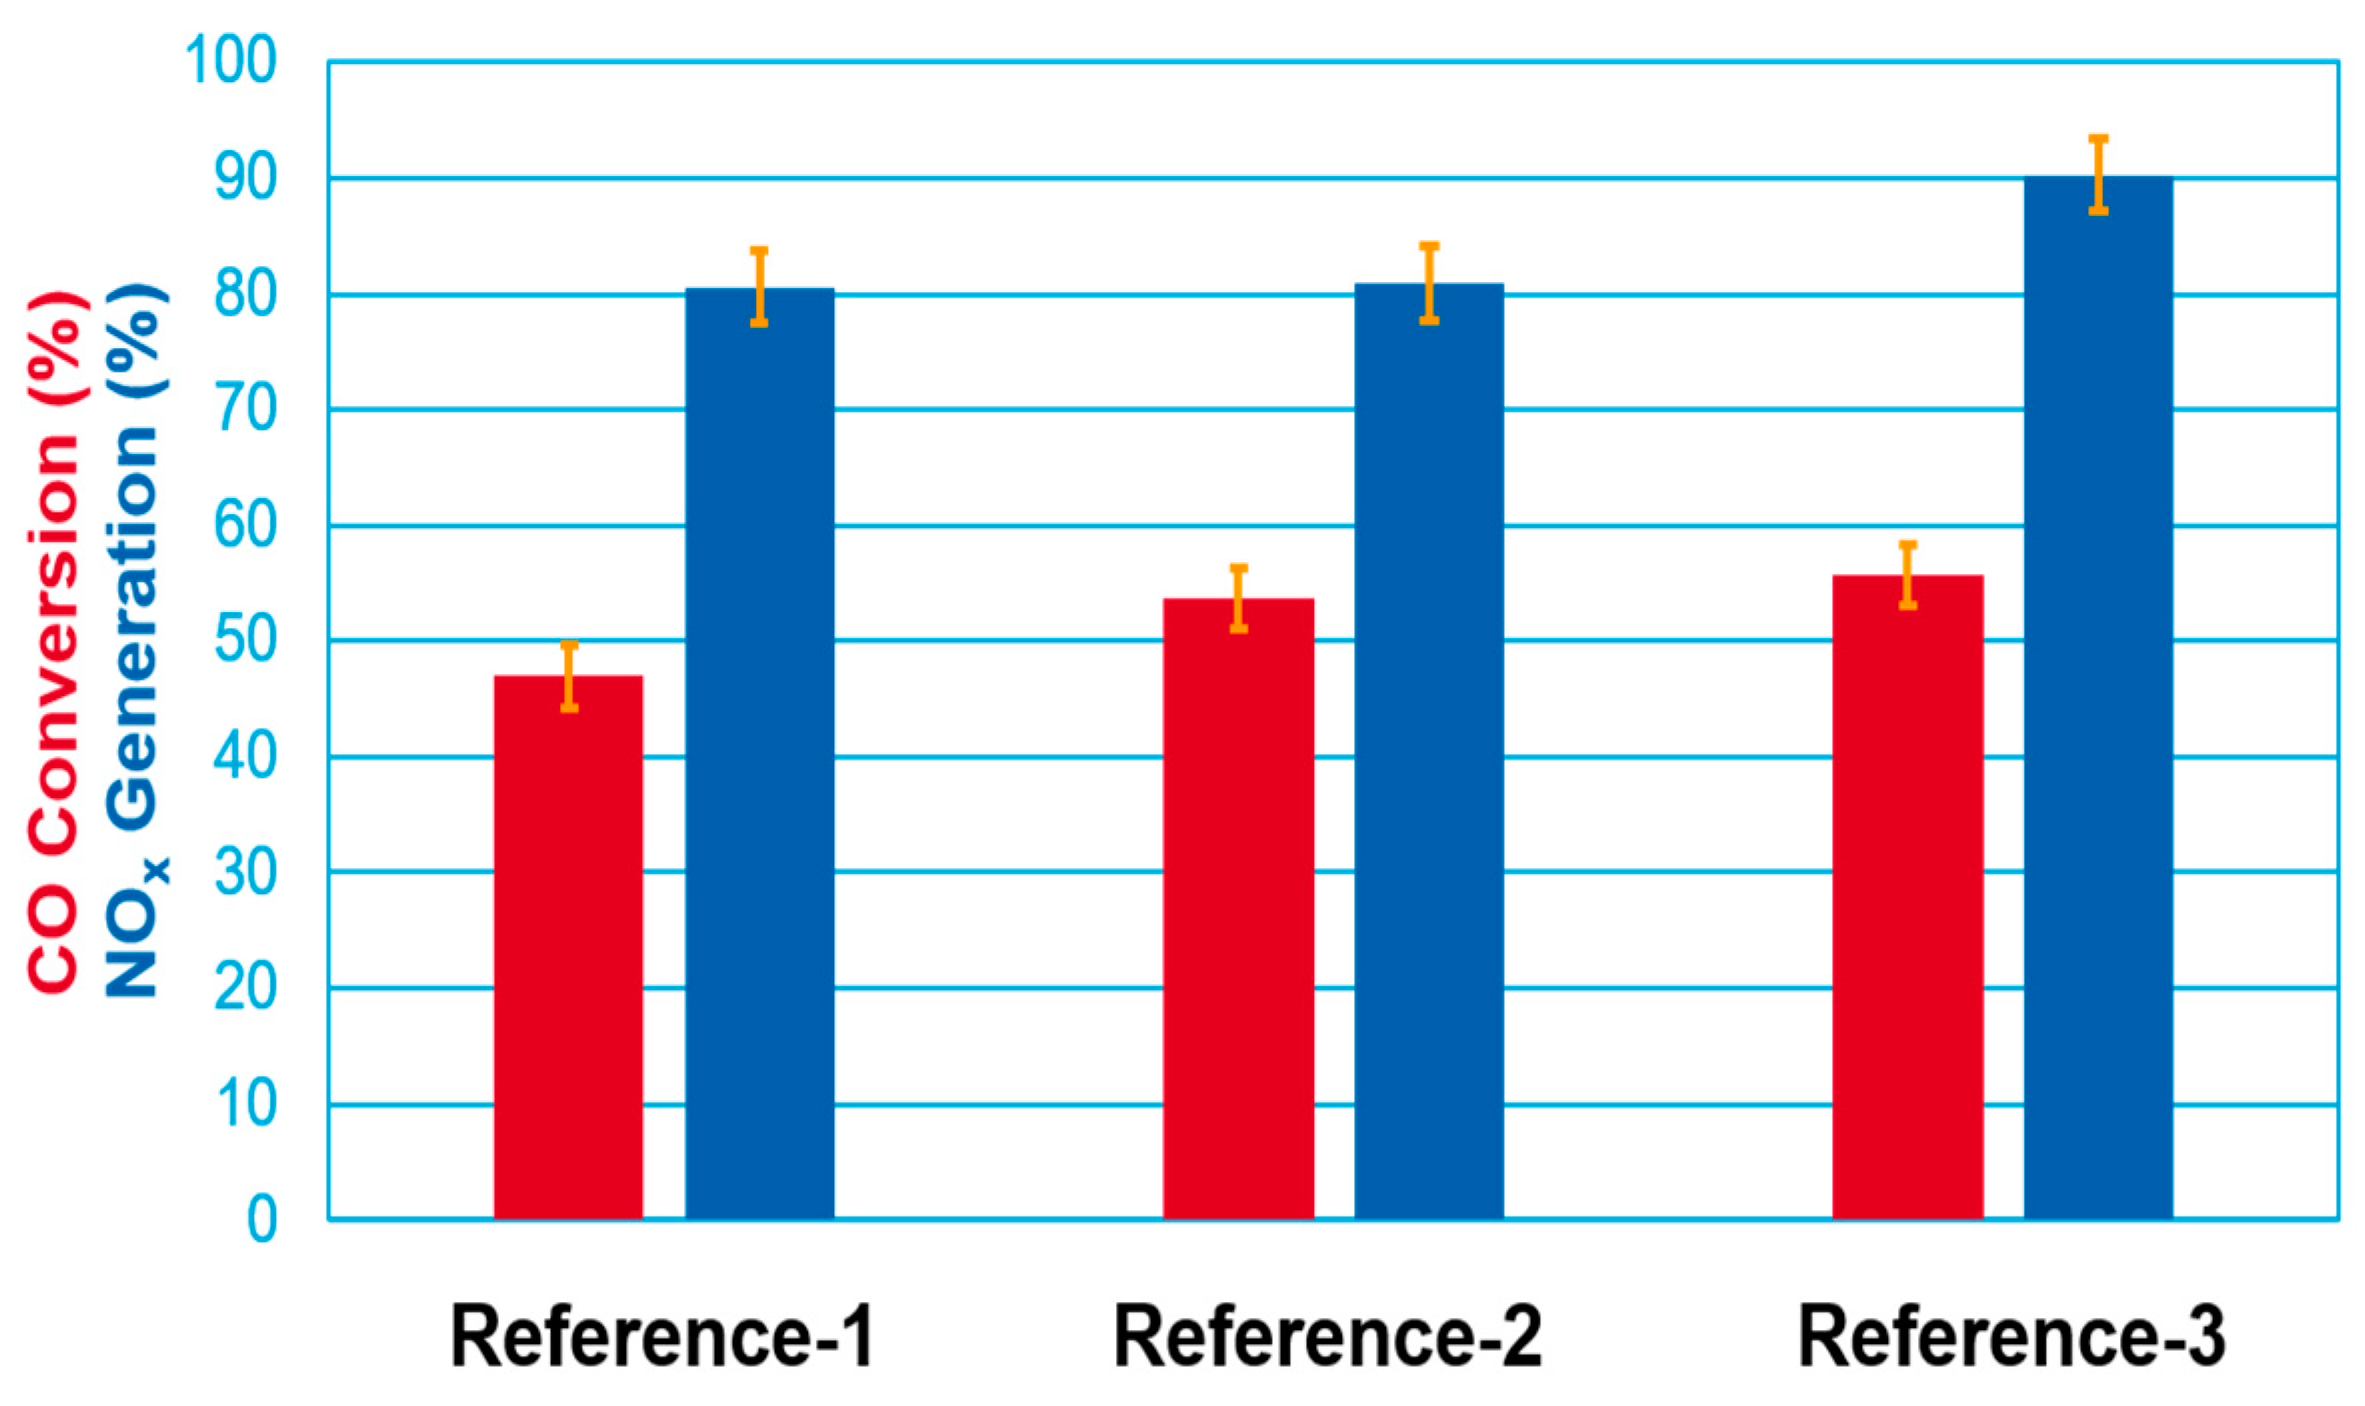
2.1. Promoter Pd-Loading
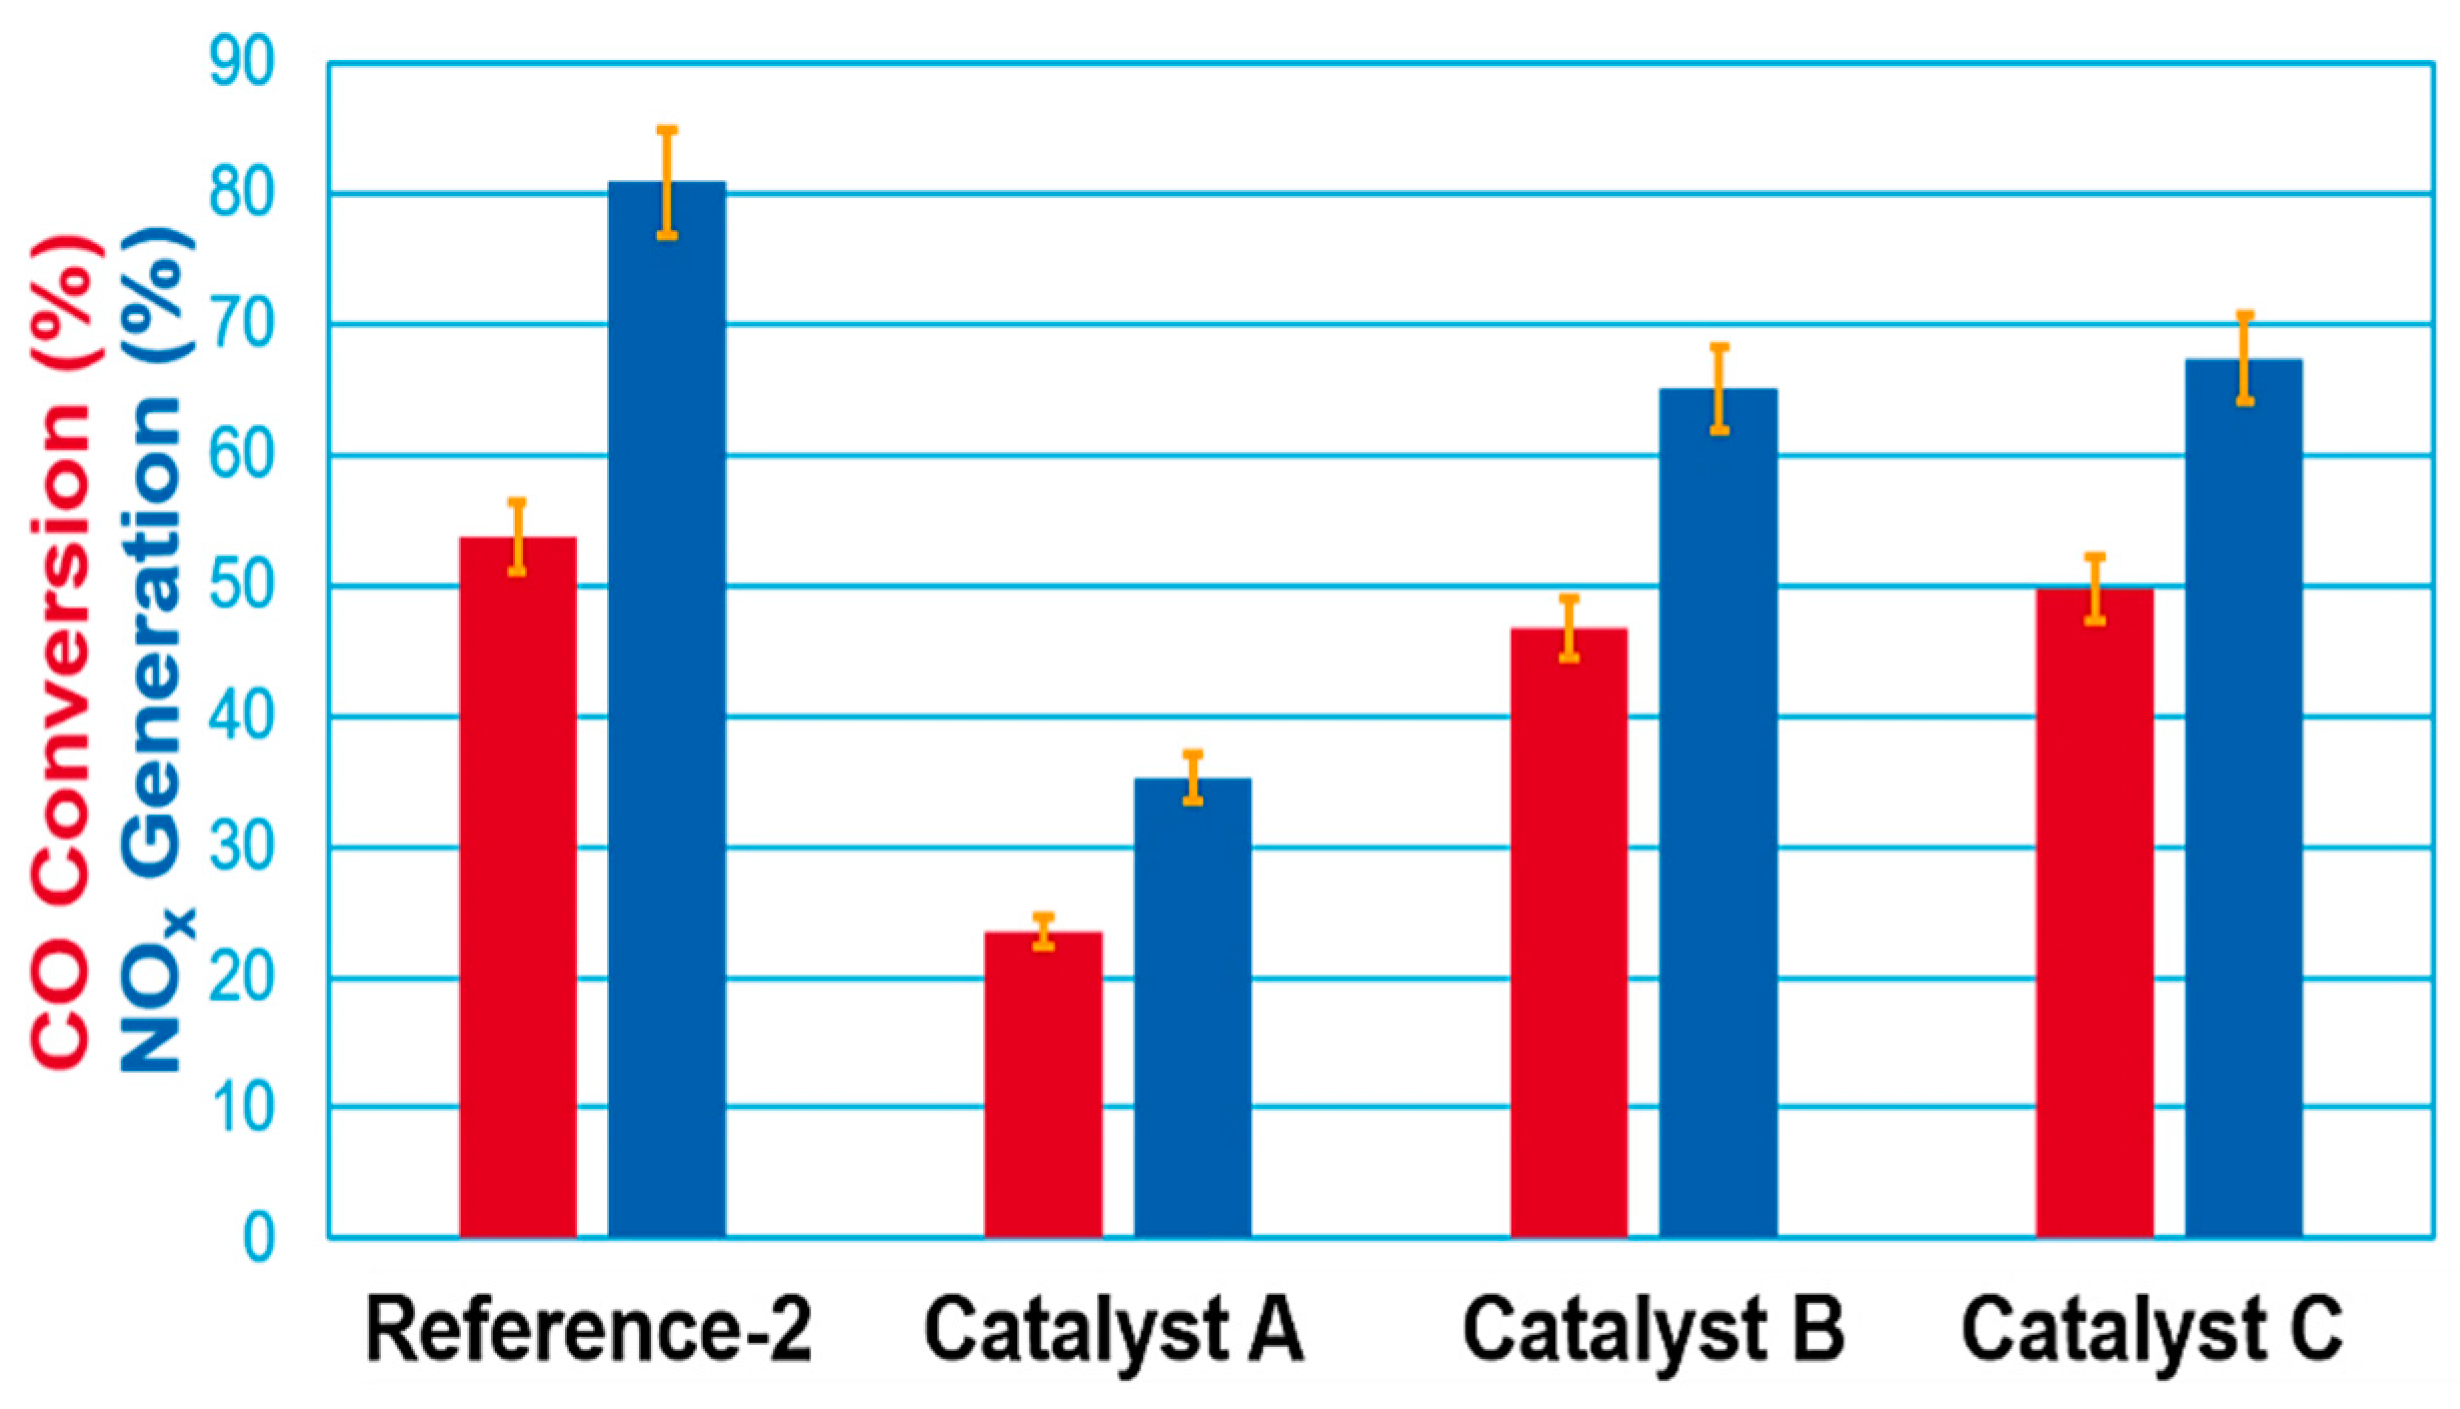
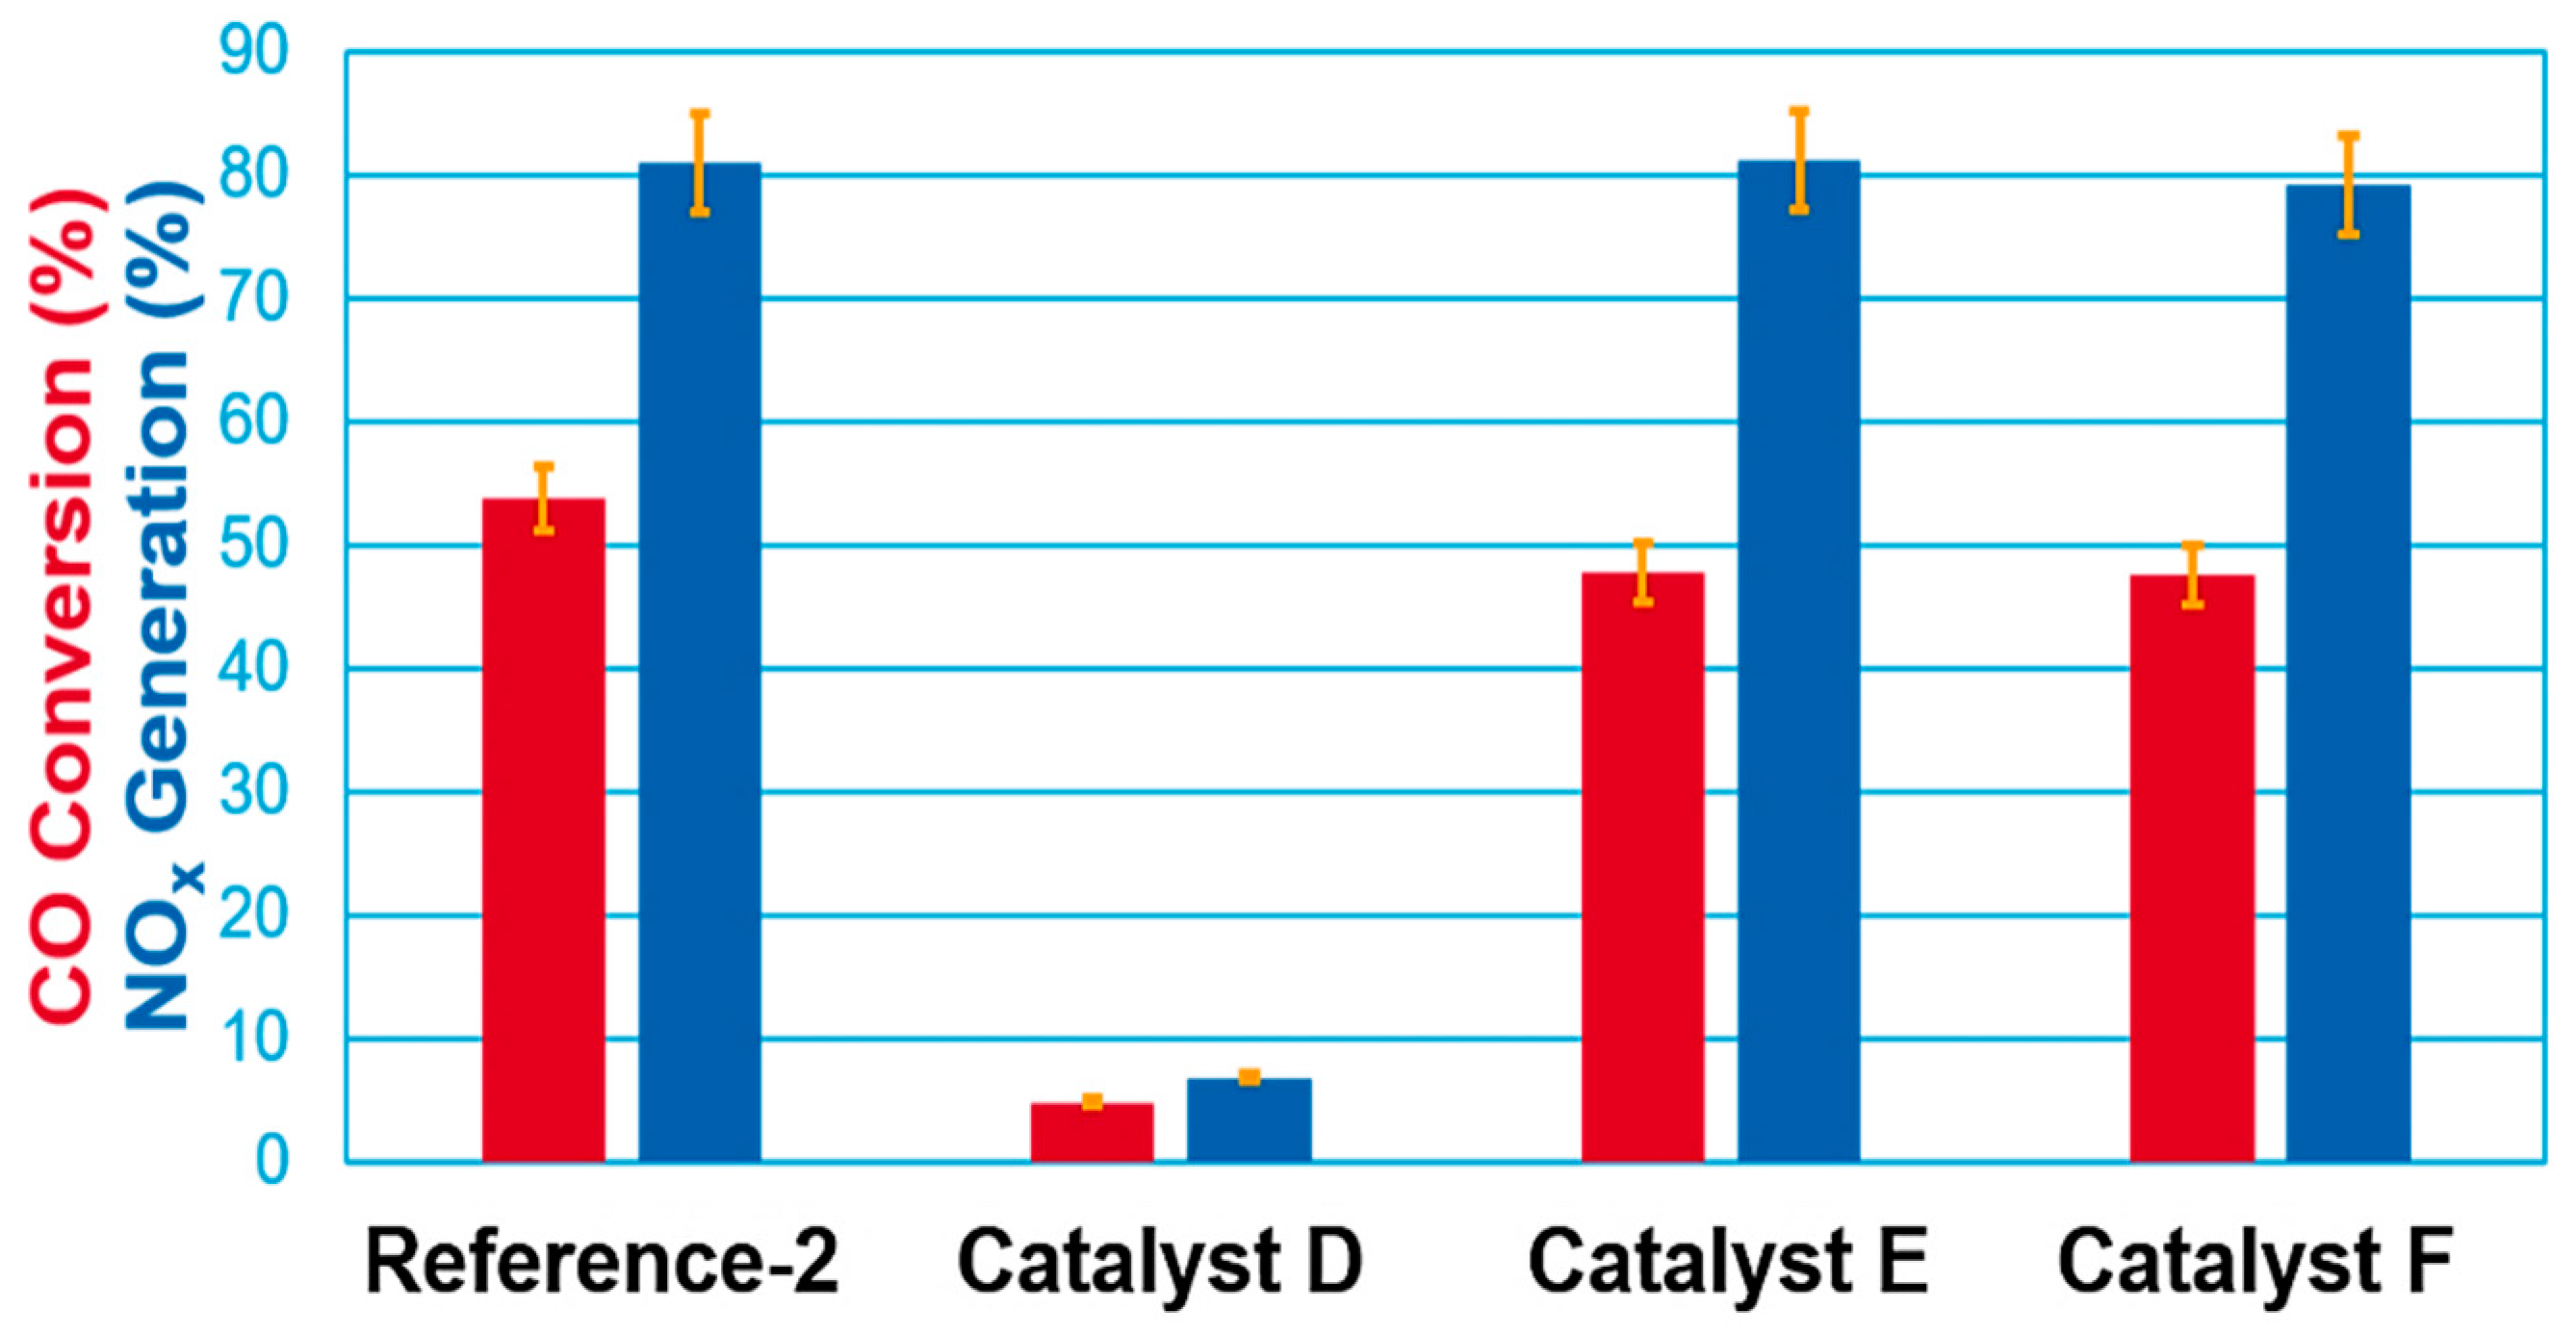
2.2. Impact of Dopant Package
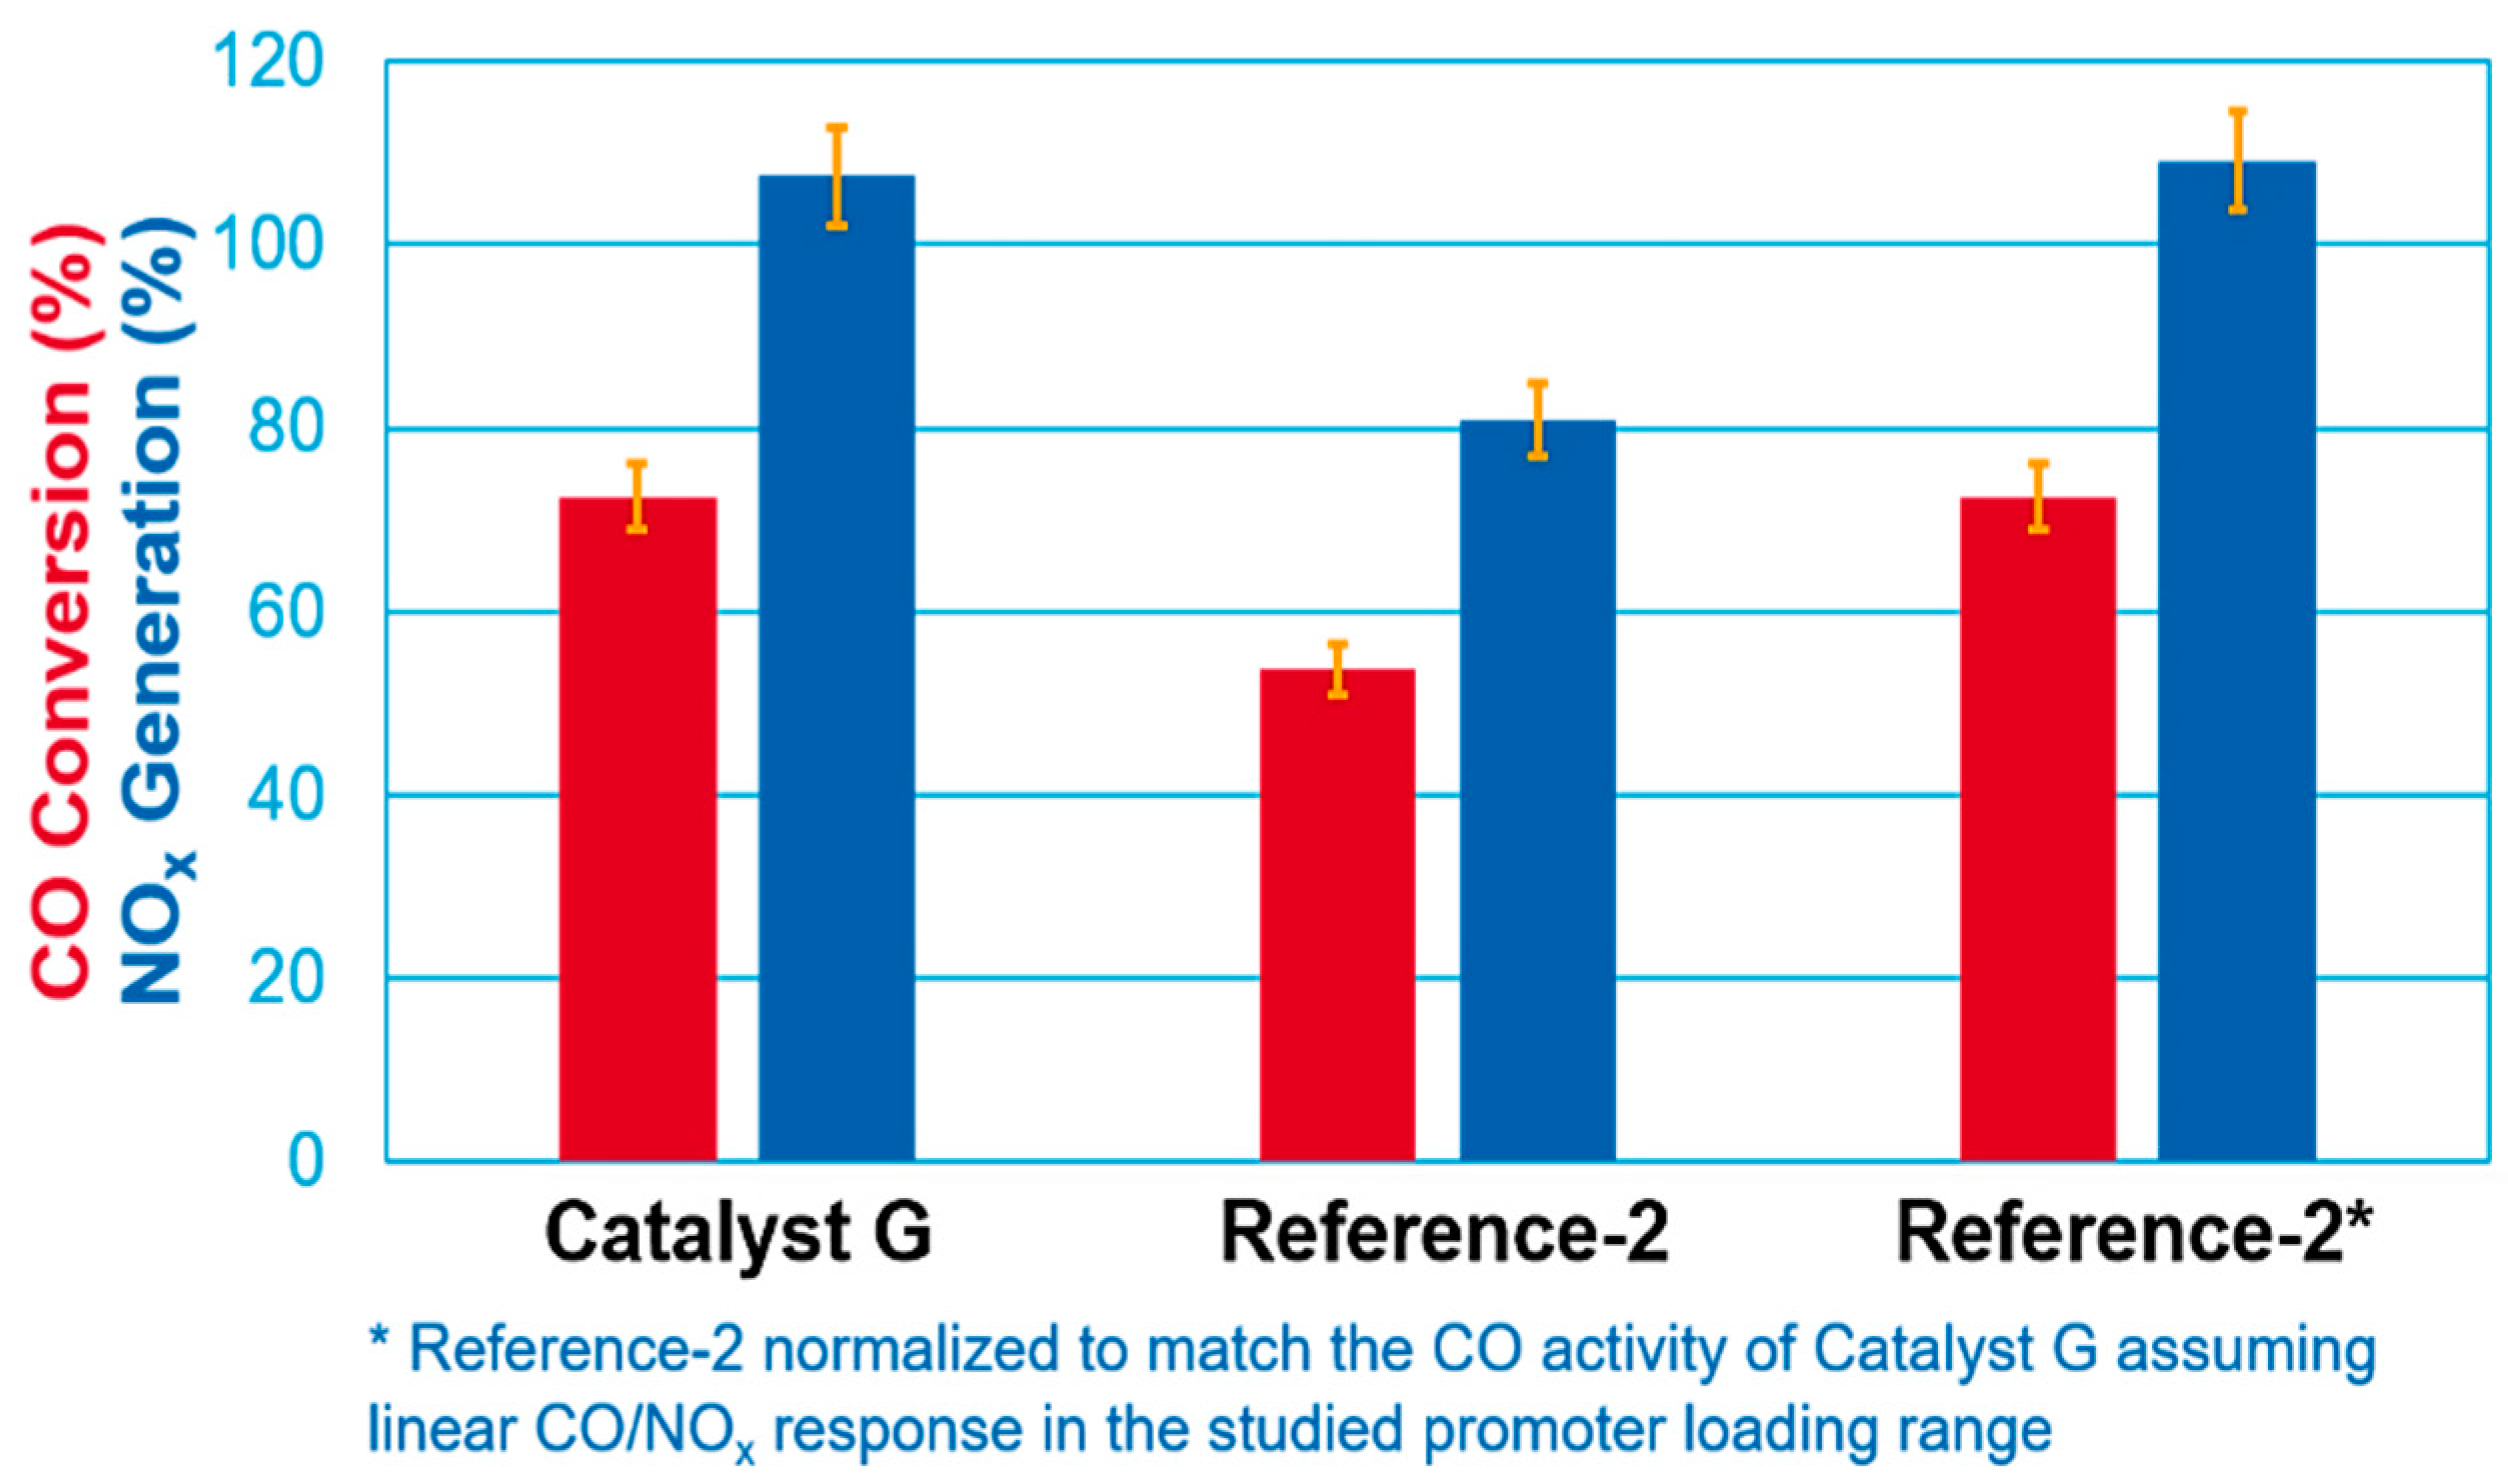
2.3. Pt vs. Pd Comparison
3. Experimental
3.1. Material Synthesis
3.2. Catalyst Ageing and Testing
4. Conclusions
Supplementary Materials
Author Contributions
Funding
Data Availability Statement
Acknowledgments
Conflicts of Interest
Abbreviations
References
- Petroleum Sector (NAICS 324), US EPA. Available online: https://www.epa.gov/regulatory-information-sector/petroleum-sector-naics-324 (accessed on 21 September 2021).
- Vjunov, A.; Kharas, K.C.; Komvokis, V.; Dundee, A.; Zhang, C.C.; Yilmaz, B. Pragmatic Approach toward Catalytic CO Emission Mitigation in Fluid Catalytic Cracking (FCC) Units. Catalysts 2021, 11, 707. [Google Scholar] [CrossRef]
- Air Emissions—Protecting Air Quality, Chevron Sustainability Roadmap. Available online: https://www.chevron.com/sustainability/environment/air-emissions (accessed on 21 September 2021).
- Lin, J.; Wang, X.; Zhang, T. Recent progress in CO oxidation over Pt-group-metal catalysts at low temperatures. Chin. J. Catal. 2016, 37, 1805–1813. [Google Scholar] [CrossRef]
- van Spronsen, M.A.; Frenken, J.W.M.; Groot, I.M.N. Surface science under reaction conditions: CO oxidation on Pt and Pd model catalysts. Chem. Soc. Rev. 2017, 46, 4347–4374. [Google Scholar] [CrossRef] [PubMed] [Green Version]
- BASF USP™ CO Promoter, Ultra Stable Promoter (USP)|BASF Catalysts. Available online: https://catalysts.basf.com/products/ultra-stable-promoter-ups (accessed on 21 September 2021).
- Iliopoulou, E.F.; Efthimiadis, E.A.; Vasalos, I.A.; Barth, J.-O.; Lercher, J.A. Effect of Rh-based additives on NO and CO formed during regeneration of spent FCC catalyst. Appl. Catal. B 2004, 47, 165–175. [Google Scholar] [CrossRef]
- Dishman, K.L.; Doolin, P.K.; Tullock, L.D. NOx Emissions in Fluid Catalytic Cracking Catalyst Regeneration. Ind. Eng. Chem. Res. 1998, 37, 4631–4636. [Google Scholar] [CrossRef]
- Chester, A.W. Chapter 6—CO combustion promoters: Past and present. Stud. Surf. Sci. Cat. 2007, 166, 67–77. [Google Scholar] [CrossRef]
- Stockwell, D.M. Chapter 6—CO combustion promoters: Past and present. Stud. Surf. Sci. Cat. 2007, 166, 79–102. [Google Scholar]
- Cheng, W.-C.; Kim, G.; Peters, A.W.; Zhao, X.; Rajagolapan, K.; Ziebarth, M.S.; Pereira, C.J. Environmental Fluid Catalytic Cracking Technology. Catal. Rev. 1998, 40, 39–79. [Google Scholar] [CrossRef]
- Gary, J.H.; Handwerk, G.E. Petroleum Refining: Technology and Economics, 4th ed.; CRC Press: Boca Raton, FL, USA, 2001; ISBN 0824704827. [Google Scholar]
- Sadeghbeigi, R. Fluid Catalytic Cracking Handbook, 3rd ed.; Chapter 14; Butterworth-Heinemann: Oxford, UK, 2012; ISBN 9780123869654. [Google Scholar]
- Babich, I.V.; Seshan, K.; Lefferts, L. Nature of nitrogen specie in coke and their role in NOx formation during FCC catalyst regeneration. Appl. Catal. B Environ. 2005, 59, 205–211. [Google Scholar] [CrossRef]
- Ye, X.; Schmidt, J.E.; Wang, R.-P.; van Ravenhorst, I.K.; Oord, R.; Chen, T.; de Groot, F.; Meirer, F.; Weckhuysen, B.M. Deactivation of Cu-Exchanged Automotive-Emission NH3-SCR Catalysts Elucidated with Nanoscale Resolution Using Scanning Transmission X-ray Microscopy. Angew. Chem. Int. Ed. 2020, 59, 15610–15617. [Google Scholar] [CrossRef] [Green Version]
- US EPA, Civil Cases and Settlements by Statute. Available online: https://cfpub.epa.gov/enforcement/cases/index.cfm?templatePage=12&ID=1&sortby=TYPE_OF_ORDER (accessed on 21 September 2021).
- Zhao, X.; Peters, A.W.; Weatherbee, G.W. Nitrogen Chemistry and NOx Control in a Fluid Catalytic Cracking Regenerator. Ind. Eng. Chem. Res. 1997, 36, 4535–4542. [Google Scholar] [CrossRef]
- Barth, J.-O.; Jentys, A.; Lercher, J.A. Elementary Reactions and Intermediate Species Formed during the Oxidative Regeneration of Spent Fluid Catalytic Cracking Catalysts. Ind. Eng. Chem. Res. 2004, 43, 3097–3104. [Google Scholar] [CrossRef]
- Heck, R.M.; Farrauto, R.J.; Gulati, S.T. Catalytic Air Pollution Control; John Wiley & Sons: Hoboken, NJ, USA, 2009; ISBN 9781118397749. [Google Scholar] [CrossRef]
- APMEX Precious Metals Trading. Available online: https://www.apmex.com/platinum-price (accessed on 21 September 2021).
- Campbell, L.E.; Danzinger, R.; Guth, E.D.; Padron, S. Process for the Reaction and Absorption of Gaseous Air Pollutants, Apparatus Therefor and Method of Making the Same. U.S. Patent 5,451,558, 19 September 1995. [Google Scholar]
- Theis, J.; Lambert, C. The Effects of CO, C2H4, and H2O on the NOx Storage Performance of Low Temperature NOx Adsorbers for Diesel Applications. SAE Int. J. Engines 2017, 10, 1627–1637. [Google Scholar] [CrossRef]
- Ferré, G.; Aouine, M.; Bosselet, F.; Burel, L.; Cadete Santos Aires, F.J.; Geantet, C.; Ntais, S.; Maurer, F.; Casapu, M.; Grunwaldt, J.-D.; et al. Exploiting the dynamic properties of Pt on ceria for low-temperature CO oxidation. Catal. Sci. Technol. 2020, 10, 3904–3917. [Google Scholar] [CrossRef]
- Soliman, N.K. Factors affecting CO oxidation reaction over nanosized materials: A review. J. Mat. Res. Tech. 2019, 8, 2395–2407. [Google Scholar] [CrossRef]
- Fox, E.B.; Velu, S.; Engelhard, M.H.; Chin, Y.-H.; Miller, J.T.; Kropf, J.; Song, C. Characterization of CeO2-supported Cu–Pd bimetallic catalyst for the oxygen-assisted water–gas shift reaction. J. Catal. 2008, 260, 358–370. [Google Scholar] [CrossRef]
- Koryabkina, N.A.; Phatak, A.A.; Ruettinger, W.F.; Farrauto, R.J.; Ribeiro, F.H. Determination of kinetic parameters for the water–gas shift reaction on copper catalysts under realistic conditions for fuel cell applications. J. Catal. 2003, 217, 233–239. [Google Scholar] [CrossRef]
- Rej, S.; Wang, H.-J.; Huang, M.-X.; Hsu, S.-C.; Tan, C.-S.; Lin, F.-C.; Huang, J.-S.; Huang, M.H. Facet-dependent optical properties of Pd–Cu2O core–shell nanocubes and octahedra. Nanoscale 2015, 7, 11135–11141. [Google Scholar] [CrossRef]
- Alabdullah, M.A.; Rodriguez Gomez, A.; Vittenet, J.; Bendjeriou-Sedjerari, A.; Xu, W.; Abba, I.A.; Gascon, J. A Viewpoint on the Refinery of the Future: Catalyst and Process Challenges. ACS Catal. 2020, 10, 8131–8140. [Google Scholar] [CrossRef]
- US Bureau of Labor Statistics. From the barrel to the pump: The impact of the COVID-19 pandemic on prices for petroleum products, From the Barrel to the Pump: The Impact of the COVID-19 Pandemic on Prices for Petroleum Products. Available online: https://www.bls.gov/opub/mlr/2020/article/from-the-barrel-to-the-pump.htm (accessed on 21 September 2021).
- US Energy Information Administration. COVID-19 Mitigation Efforts Result in the Lowest U.S. Petroleum Consumption in Decades, COVID-19 Mitigation Efforts Result in the Lowest U.S. Petroleum Consumption in Decades. Available online: https://www.eia.gov/todayinenergy/detail.php?id=43455 (accessed on 21 September 2021).
- Mills, G.A. Aging of Cracking Catalysts. Ind. Eng. Chem. 1950, 42, 182–187. [Google Scholar] [CrossRef]
- Venuto, P.B.; Habib, T. Catalyst-Feedstock-Engineering Interactions in Fluid Catalytic Cracking. Catal. Rev. Sci. Eng. 1978, 18, 1–150. [Google Scholar] [CrossRef]
- Kleldsen, P.; Barlaz, M.A.; Rooker, A.P.; Baun, A.; Ledin, A.; Christensen, T.H. Present and Long-Term Composition of MSW Landfill Leachate: A Review. Critic. Rev. Environ. Sci. Technol. 2002, 32, 297–336. [Google Scholar] [CrossRef]
- Kiaune, L.; Singhasemanon, N. Pesticidal Copper(I) Oxide: Environmental Fate and Aquatic Toxicity. Rev. Environ. Contam. Toxicol. 2011, 213, 1–26. [Google Scholar] [CrossRef]
- Wittka, T.; Holderbaum, B.; Dittmann, P.; Pischinger, S. Experimental Investigation of Combined LNT + SCR Diesel Exhaust Aftertreatment. Emiss. Contr. Sci. Technol. 2015, 1, 167–182. [Google Scholar] [CrossRef] [Green Version]
- Onrubia-Calvo, J.A.; Pereda-Ayo, B.; Caravca, A.; De-La-Torre, U.; Vernoux, P.; Gonzalez-Velasco, J.R. Tailoring perovskite surface composition to design efficient lean NOx trap Pd–La1-xAxCoO3/Al2O3-type catalysts (with A = Sr or Ba). Appl. Catal. B Environ. 2020, 266, 118628. [Google Scholar] [CrossRef]
- Zhang, Y.; Liu, D.; Meng, M.; Jiang, Z.; Zhang, S. A Highly Active and Stable Non-Platinic Lean NOx Trap Catalyst MnOx-K2CO3/K2Ti8O17 with Ultra-Low NOx to N2O Selectivity. Ind. Eng. Chem. Res. 2014, 53, 8416–8425. [Google Scholar] [CrossRef]
- Cotton, F.A.; Wilkinson, G.; Gaus, P.L. Basic Inorganic Chemistry, 3rd ed.; John Wiley & Sons: Hoboken, NJ, USA, 1995; ISBN 9780471505327. [Google Scholar] [CrossRef] [Green Version]
- Luther, G.W., III. Inorganic Chemistry for Geochemistry and Environmental Sciences: Fundamentals and Applications; John Wiley & Sons: Hoboken, NJ, USA, 2016; ISBN 978-1-118-85137-1. [Google Scholar] [CrossRef]
- Choi, M.; Song, J.; Lee, E.; Ma, S.; Lee, S.; Seo, J.; Yoo, S.; Lee, J. The Development of a NOx Reduction System during the Fuel Cut Period for Gasoline Vehicles; SAE Technical Paper 2019-01-1292; SAE International: Washington, DC, USA, 2019. [Google Scholar] [CrossRef]
- Hachenberg, B.; Kiesel, F.; Schiereck, D. Dieselgate and its expected consequences on the European auto ABS market. Econom. Lett. 2018, 171, 180–182. [Google Scholar] [CrossRef]
- Efthimiadis, E.A.; Iliopoulou, E.F.; Lappas, A.A.; Iatridis, D.K.; Vasalos, I.A. NO Reduction Studies in the FCC Process. Evaluaiton of NO Reduciton Additives for FCCU in Bench- and Pilot Plant-Scale Reactors. Ind. Eng. Chem. Res. 2002, 41, 5401–5409. [Google Scholar] [CrossRef]


| Promoter | CeO2 (wt. %) | CuO (wt. %) | SrO (wt. %) | Pd (ppm) | Pt (ppm) | Total Surface Area (m2/g) 2 | CO Conversion (%) 1 | NOx Generation (%) 1 | CO/NOx Ratio |
|---|---|---|---|---|---|---|---|---|---|
| Reference-1 | 10 | 0 | 0 | 250 | 0 | 87 | 47.0 | 80.6 | 0.58 |
| Reference-2 | 10 | 0 | 0 | 500 | 0 | 87 | 53.7 | 80.9 | 0.67 |
| Reference-3 | 10 | 0 | 0 | 1000 | 0 | 87 | 55.7 | 90.2 | 0.62 |
| Catalyst A | 10 | 0.6 | 0 | 0 | 0 | 88 | 23.5 | 35.3 | 0.67 |
| Catalyst B | 10 | 0.3 | 0 | 500 | 0 | 86 | 46.8 | 65.1 | 0.72 |
| Catalyst C | 10 | 0.6 | 0 | 500 | 0 | 88 | 49.8 | 67.5 | 0.74 |
| Catalyst D | 10 | 0 | 0.6 | 0 | 0 | 90 | 4.8 | 6.8 | 0.71 |
| Catalyst E | 10 | 0 | 0.6 | 500 | 0 | 90 | 47.7 | 67.5 | 0.71 |
| Catalyst F | 10 | 0 | 1.2 | 500 | 0 | 86 | 47.6 | 79.1 | 0.60 |
| Catalyst G | 10 | 0 | 0 | 0 | 300 | 87 | 72.5 | 107.6 | 0.67 |
| Reactor Type | Fluid Bed |
|---|---|
| Reactor loading | 10 gr |
| Catalyst mixture | 99 wt. % spent FCC catalyst + 1 wt. % CO promoter |
| Inlet gas flow rate | 1 L/min |
| Inlet gas composition | 2 vol. % O2 in N2 |
| Reactor bed temperature | 700 °C |
Publisher’s Note: MDPI stays neutral with regard to jurisdictional claims in published maps and institutional affiliations. |
© 2021 by the authors. Licensee MDPI, Basel, Switzerland. This article is an open access article distributed under the terms and conditions of the Creative Commons Attribution (CC BY) license (https://creativecommons.org/licenses/by/4.0/).
Share and Cite
Vjunov, A.; Kharas, K.C.; Komvokis, V.; Dundee, A.; Yilmaz, B. Practical Approaches towards NOx Emission Mitigation from Fluid Catalytic Cracking (FCC) Units. Catalysts 2021, 11, 1146. https://0-doi-org.brum.beds.ac.uk/10.3390/catal11101146
Vjunov A, Kharas KC, Komvokis V, Dundee A, Yilmaz B. Practical Approaches towards NOx Emission Mitigation from Fluid Catalytic Cracking (FCC) Units. Catalysts. 2021; 11(10):1146. https://0-doi-org.brum.beds.ac.uk/10.3390/catal11101146
Chicago/Turabian StyleVjunov, Aleksei, Karl C. Kharas, Vasileios Komvokis, Amy Dundee, and Bilge Yilmaz. 2021. "Practical Approaches towards NOx Emission Mitigation from Fluid Catalytic Cracking (FCC) Units" Catalysts 11, no. 10: 1146. https://0-doi-org.brum.beds.ac.uk/10.3390/catal11101146