Article

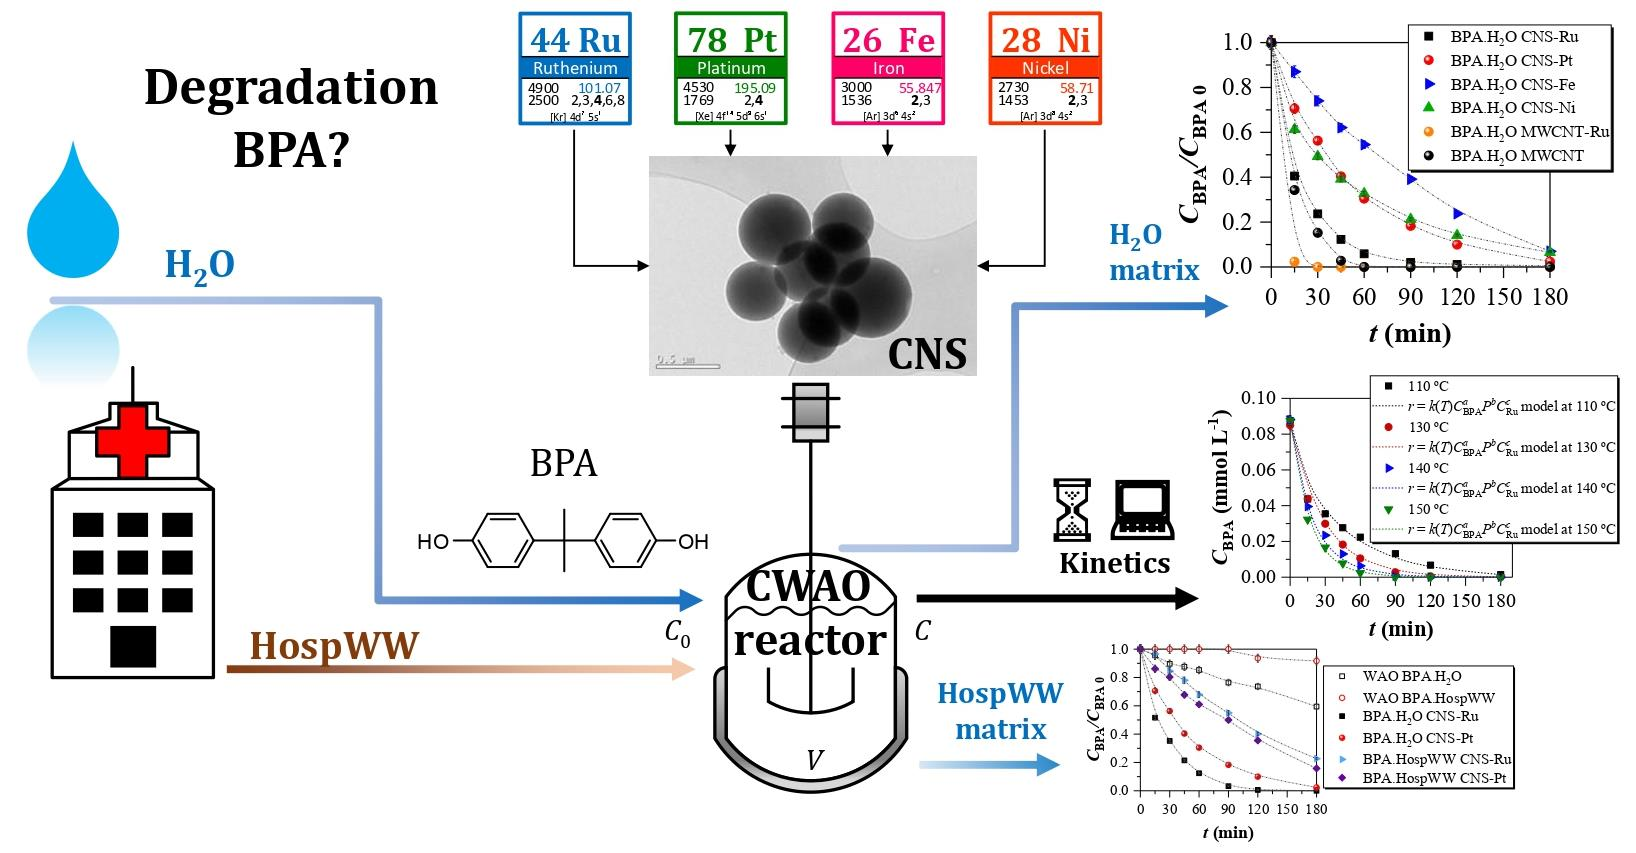
Insights into the Kinetics Degradation of Bisphenol A by Catalytic Wet Air Oxidation with Metals Supported onto Carbon Nanospheres

by
Estrella Serra-Pérez
* and
Juan García Rodríguez
*
Grupo de Catálisis y Procesos de Separación (CyPS), Departamento de Ingeniería Química y de Materiales, Facultad de Ciencias Químicas, Universidad Complutense de Madrid, Avda. Complutense s/n, 28040 Madrid, Spain
*
Authors to whom correspondence should be addressed.
Submission received: 5 October 2021 / Revised: 20 October 2021 / Accepted: 25 October 2021 / Published: 27 October 2021
(This article belongs to the Special Issue Environmental Catalysis for Water Remediation)

Abstract

:
Emerging pollutants are an increasing problem in wastewater globally. Bisphenol A (BPA) is one compound belonging to this group. This work proposes the study of the employment of several metal-supported (2 wt. %) carbon nanospheres (CNS) for BPA degradation by catalytic wet-air oxidation. Several techniques were used for the catalyst characterization: thermogravimetry, X-ray diffractometry (XRD), Fourier transformed infrared spectrometry (FTIR), determination of isoelectric point, elemental analysis, X-ray fluorescence (XRF), scanning electron microscopy (SEM), and N2 adsorption–desorption isotherms. Different loads of Ru in the catalyst were also tested for BPA degradation (1, 2, 5, 7, and 10%), being the first minimum value to achieve a conversion above 97% in 90 min 2 wt. % of Ru in the CNS-Ru catalyst. In the stability test with CNS-Ru and CNS-Pt, CNS-Pt demonstrated less activity and stability. Two potential models were proposed to adjust experimental data with CNS-Ru(2%) at different conditions of BPA initial concentration, catalyst mass, temperature, and pressure of the reaction. Both models showed a high determination coefficient (R2 > 0.98). Finally, the efficiency of CNS-Ru and CNS-Pt was tested in a real hospital wastewater matrix obtaining better results the CNS-Pt(2%) catalyst.

Graphical Abstract

1. Introduction

Emerging pollutants have been defined for the first time in Directive 2013/39/EU. They can be defined as those that are not currently included in the systematic monitoring programs of the European Union but that pose a significant risk, which requires their regulation, depending on their possible ecotoxicological and toxicological effects and their levels in the aquatic environment [1]. Their presence in the environment is not new, but concern about their possible consequences is, which has been increasing, and that is why it has become one of the priority lines of research for the World Organization of the Health (WHO), the European Environment Agency, and the United States Environmental Protection Agency (EPA) [2,3]. The group of additives and industrial products to which bisphenol A (BPA) belongs has been classified as a group of emerging pollutants. BPA is an organic compound formed by two phenolic rings, and it is widely used in the manufacture of polycarbonate plastics and epoxy resins used in almost all industries (Figure 1). Indeed, polycarbonate in particular is a rigid, high-performance, transparent plastic used to make food containers, such as bottles, plates, and cups, while epoxy resins are used to make protective coatings on food and beverage containers.
Humans can be exposed to BPA consumption, because it can migrate in small quantities to food and beverages contained in these containers, especially when not using them correctly. Bisphenol A can cause infertility [4], cancer, genitourinary malformations [5], endometriosis [6], among others. It is considered a disruptor endocrine. For this reason, different countries have proposed some restrictions and laws about BPA, such as Denmark, France, Sweden, Belgium, Austria, and Norway, being wholly forbidden in France and listed on the priority substance list in Norway [7]. Emerging pollutants are also called micropollutants, because they are found in concentrations between μg L−1 and ng L−1 [8,9]. The main problem of the emerging contaminants resides in the fact that they cannot be eliminated by conventional wastewater treatment plants (WWTP) [8]. Different concentrations of bisphenol A have been found in various effluents of WWTP, sludge, sediments, and rivers. For example, in WWTP effluents, in Slovenia and Croatia, the found concentration has been estimated in the range 44.3 to 2620 ng L−1 [10]; in Mexico, it has been detected in concentrations in the range of 20–410 ng L−1 [11]; and in Seville, the concentration was 4000 ng L−1 [12,13].
It is necessary to apply other more severe condition processes than conventional WWTP offers to degrade recalcitrant pollutants similarly to emerging ones. In this context, over the past few decades, advanced oxidation processes (AOP) have been gaining importance, being implanted in some WWTP as a complementary treatment [14]. These include ozonation, peroxidation, ultraviolet light aided ozonation (O3/UV), ultraviolet light aided peroxidation (UV/H2O2), Fenton and Fenton-like oxidation, gamma radiolysis, sonolysis, and catalytic wet air oxidation (CWAO) [15]. Liu et al. (2021) were able to obtain an optimized system of visible light irradiation involving CoCN (Co sites embedded in carbon nitride catalyst) and peroxymonosulfate (CoCN/Vis/PMS system) (λ ≥ 420 nm, [PMS] = 0.2 g L−1, pH = 7.0), where 100% of bisphenol A (20 mg L−1) was removed after 2 min [16]. Chu et al. (2021) studied the reaction activity of H2O2, CF (copper film) in combination with ultrasound (US) irradiation to degrade (BPA) [17]. Li et al. (2021) developed a composite material of CoFe2O4−biochar (CoFe2O4@BC) with high performance of peroxydisulfate activation and catalytic ozonation for BPA degradation with 100 mg L−1, achieving a conversion of 95.8% within 8.0 min [18]. Rathnayake et al. (2020) worked with a bi-functional catalyst (2.5% Pt/Ti0.8Ce0.2O2), combining catalytic wet air oxidation and photocatalysis to reduce the concentration and toxicity of BPA [19].
CWAO supposes an alternative to this AOP, which is also a process capable of degrading phenolic compounds. The selection of the catalytic material for the CWAO process is of significant importance. In recent decades, different materials have been studied to act as support for the catalyst: zeolites [20], clays [21], resins [22], and carbon-based materials [23]. From this classification, carbon support has attracted attention, carbon nanospheres being optimal support for this process. CNS support has been considered an ideal platform due to its good thermal stability under an inert atmosphere, intrinsic hydrophobic nature, presence of vast functional groups facilitating the metal dispersion, and spherical morphology, ensuring a fast mass transfer and minimal viscosity effects. Moreover, in its spherical arrangement, the graphene sheets are not closed shells but instead waving flakes that follow the sphere’s curvature at different depths, creating many open edges at the surface. These unclosed graphitic flakes provide reactive hanging bonds that are proposed to enhance surface reactions, establishing CNS as promising candidates for catalytic applications [24].
This work attempts to analyze BPA degradation by CWAO with catalysts based on carbon nanospheres (CNS) with different metals and loads. This study also addresses the possibility of reuse of Ru and Pt catalysts and the proposal of two kinetic models to determine the CWAO reaction rate for BPA degradation. Finally, a proof of concept will be employed to evaluate the decrease in the BPA degradation due to more compounds in the matrix.

2. Results and Discussion

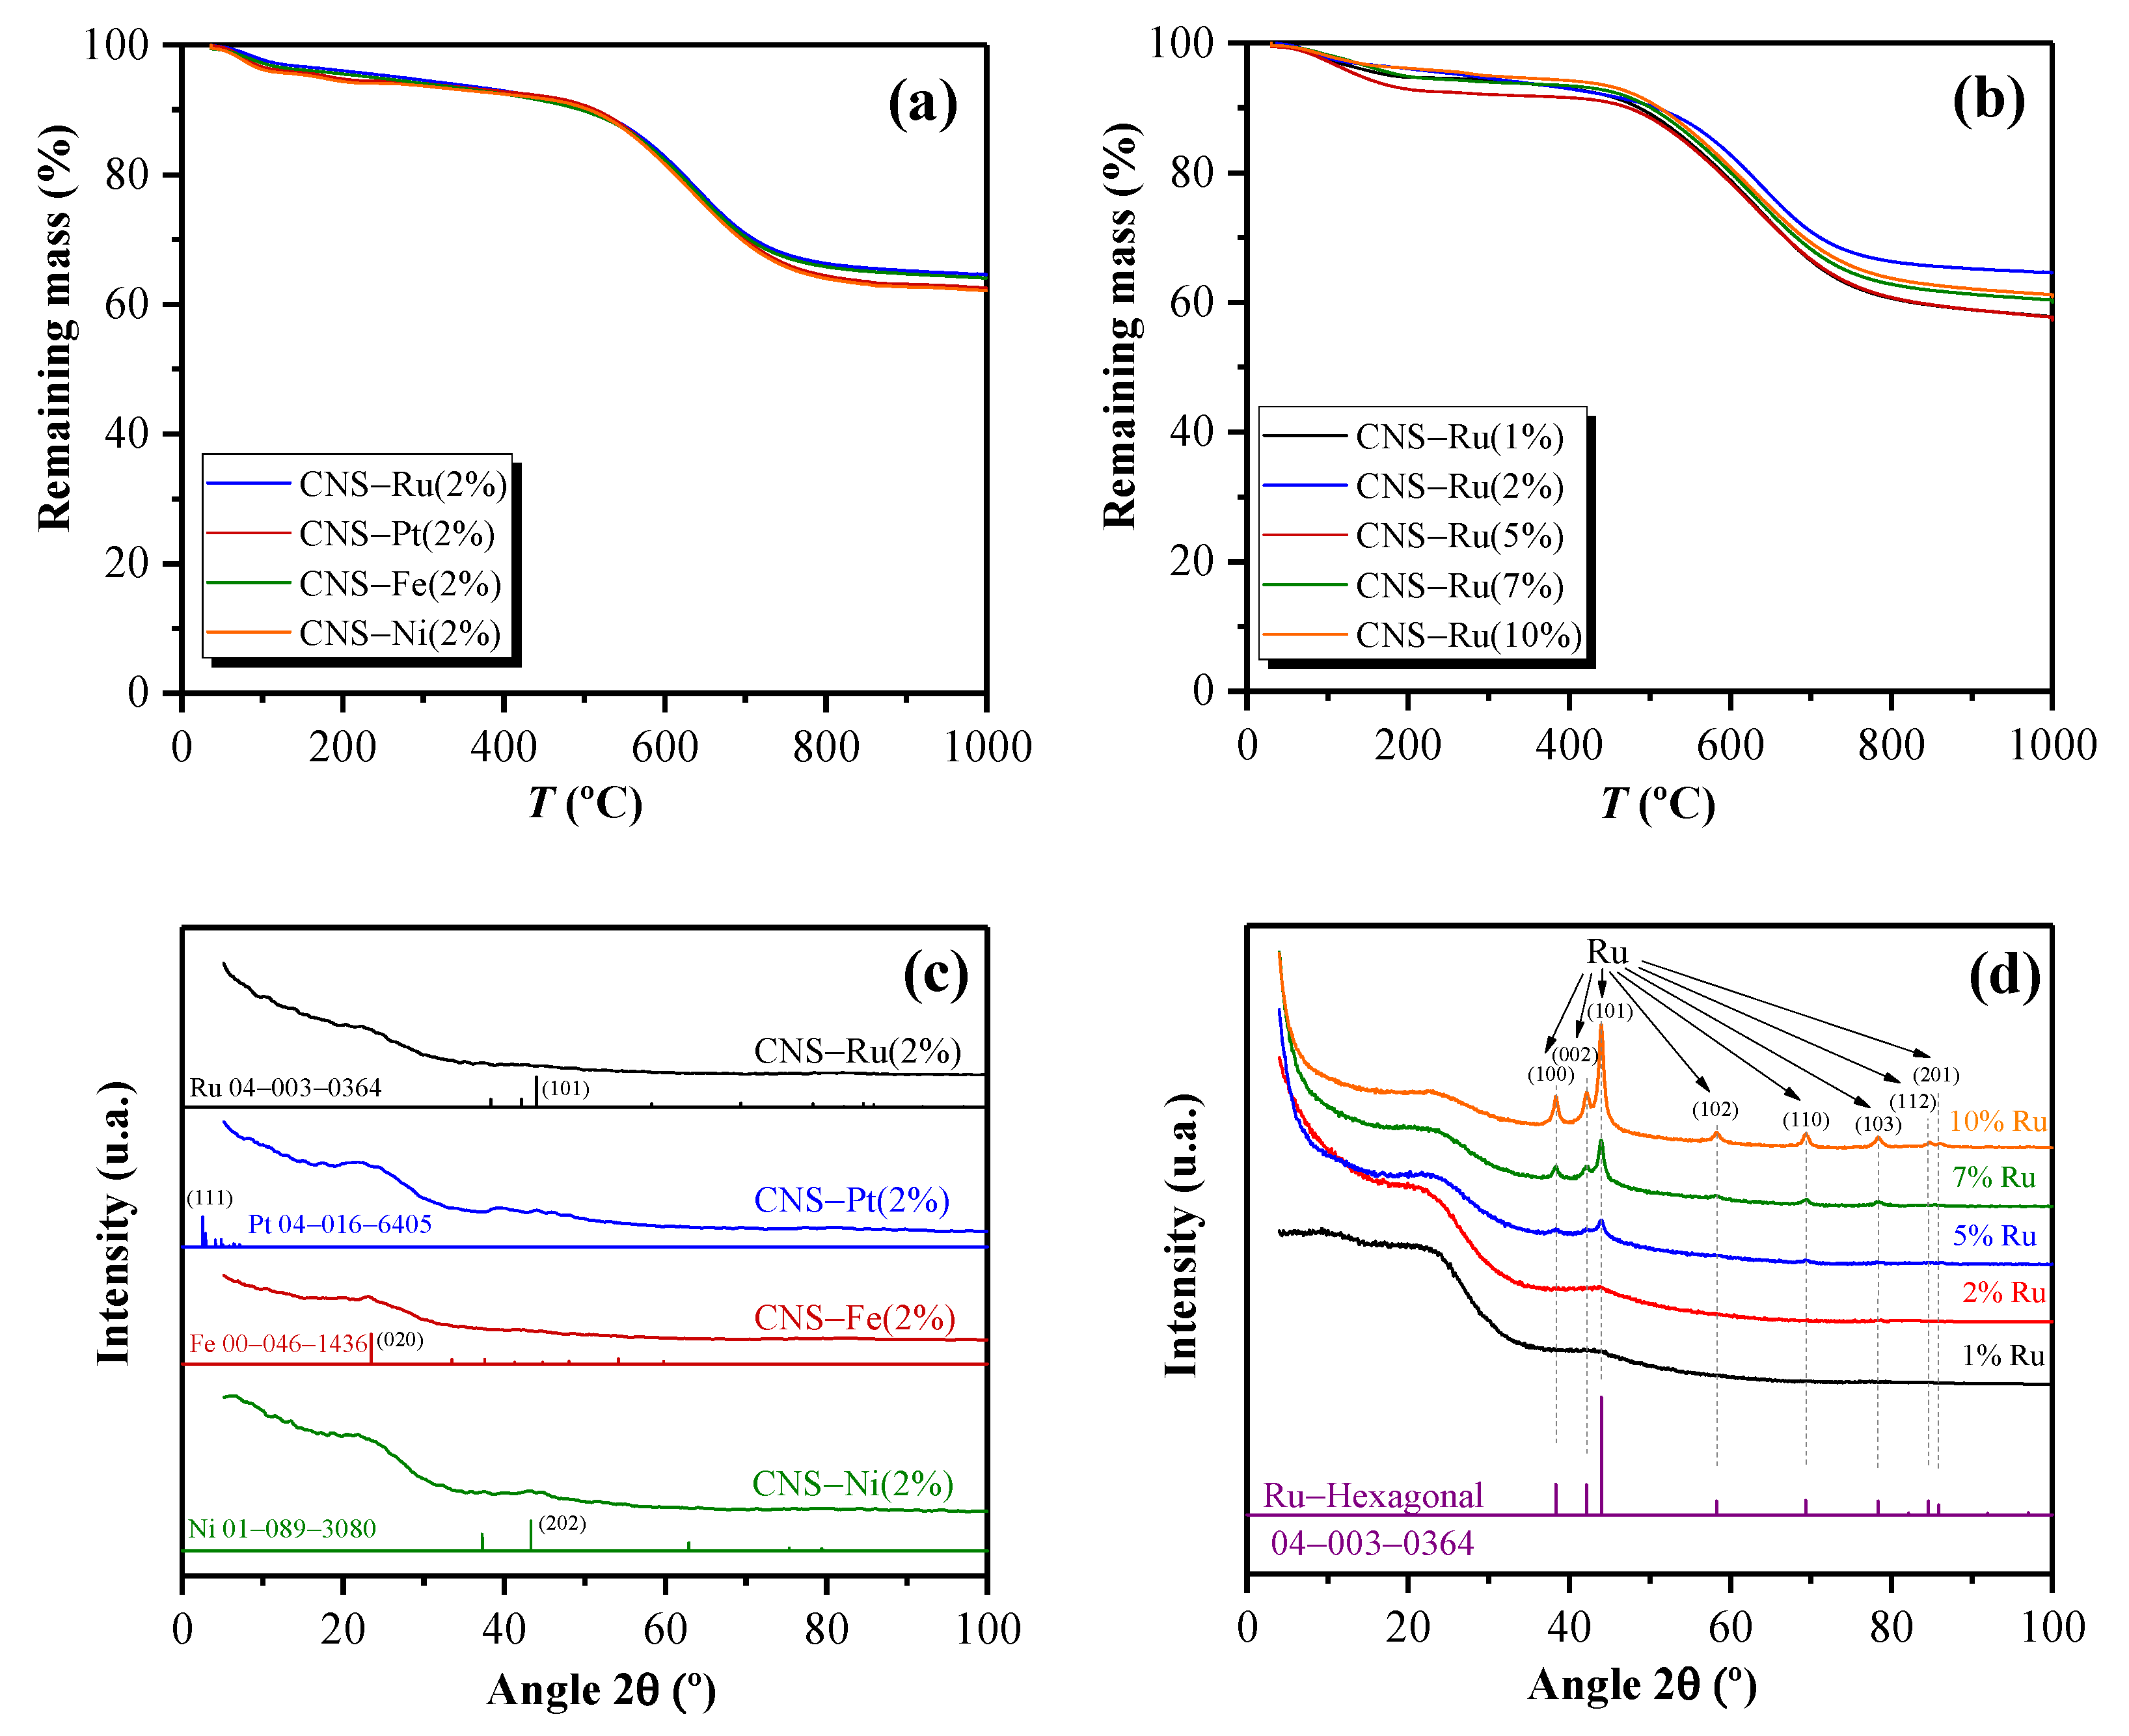
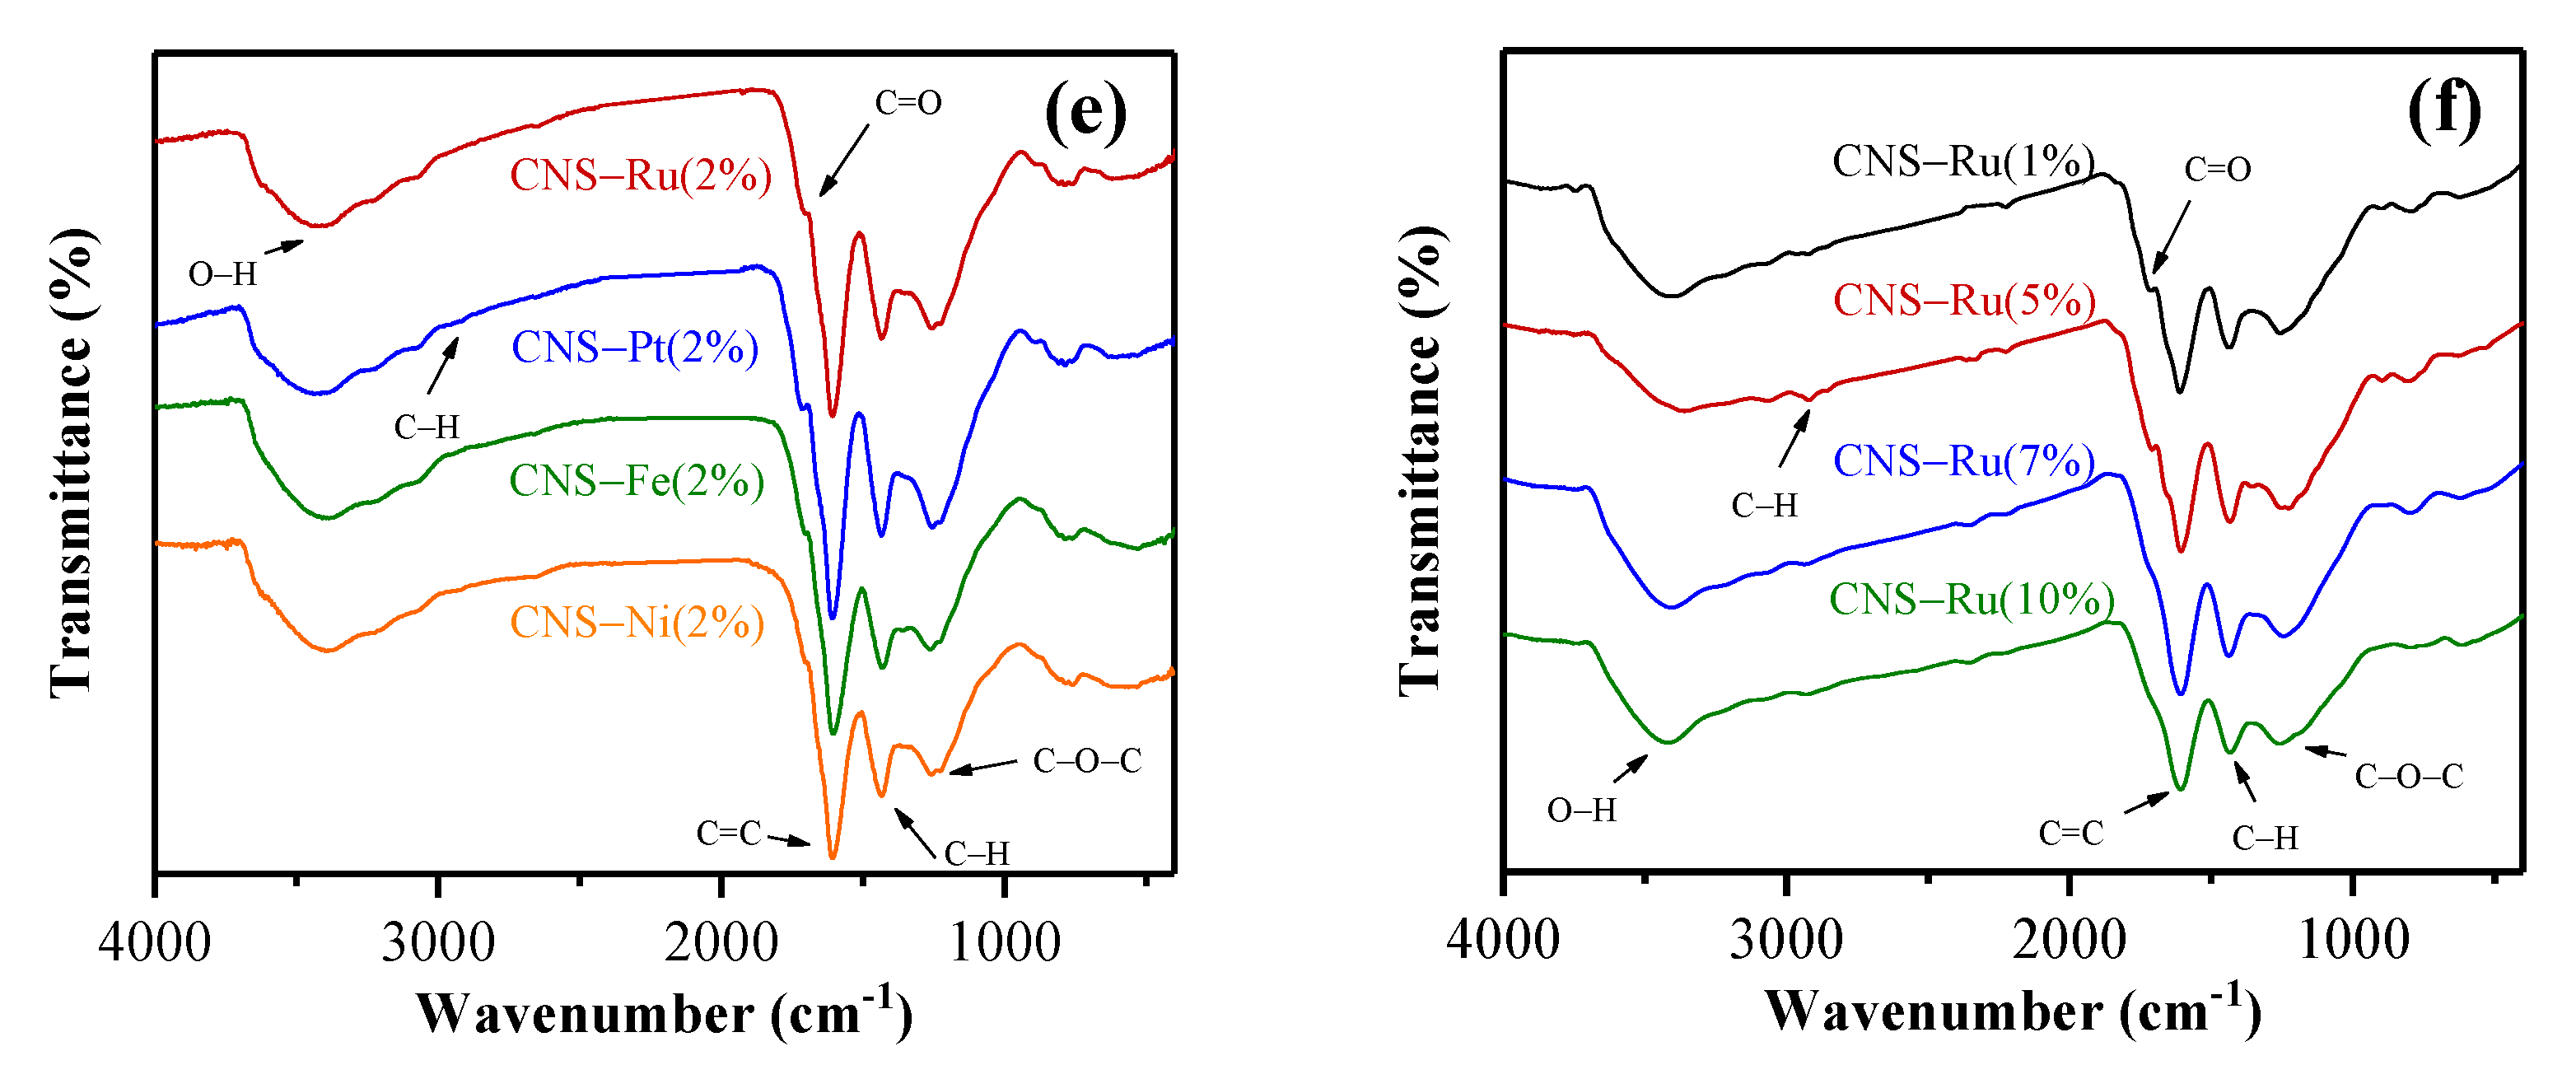
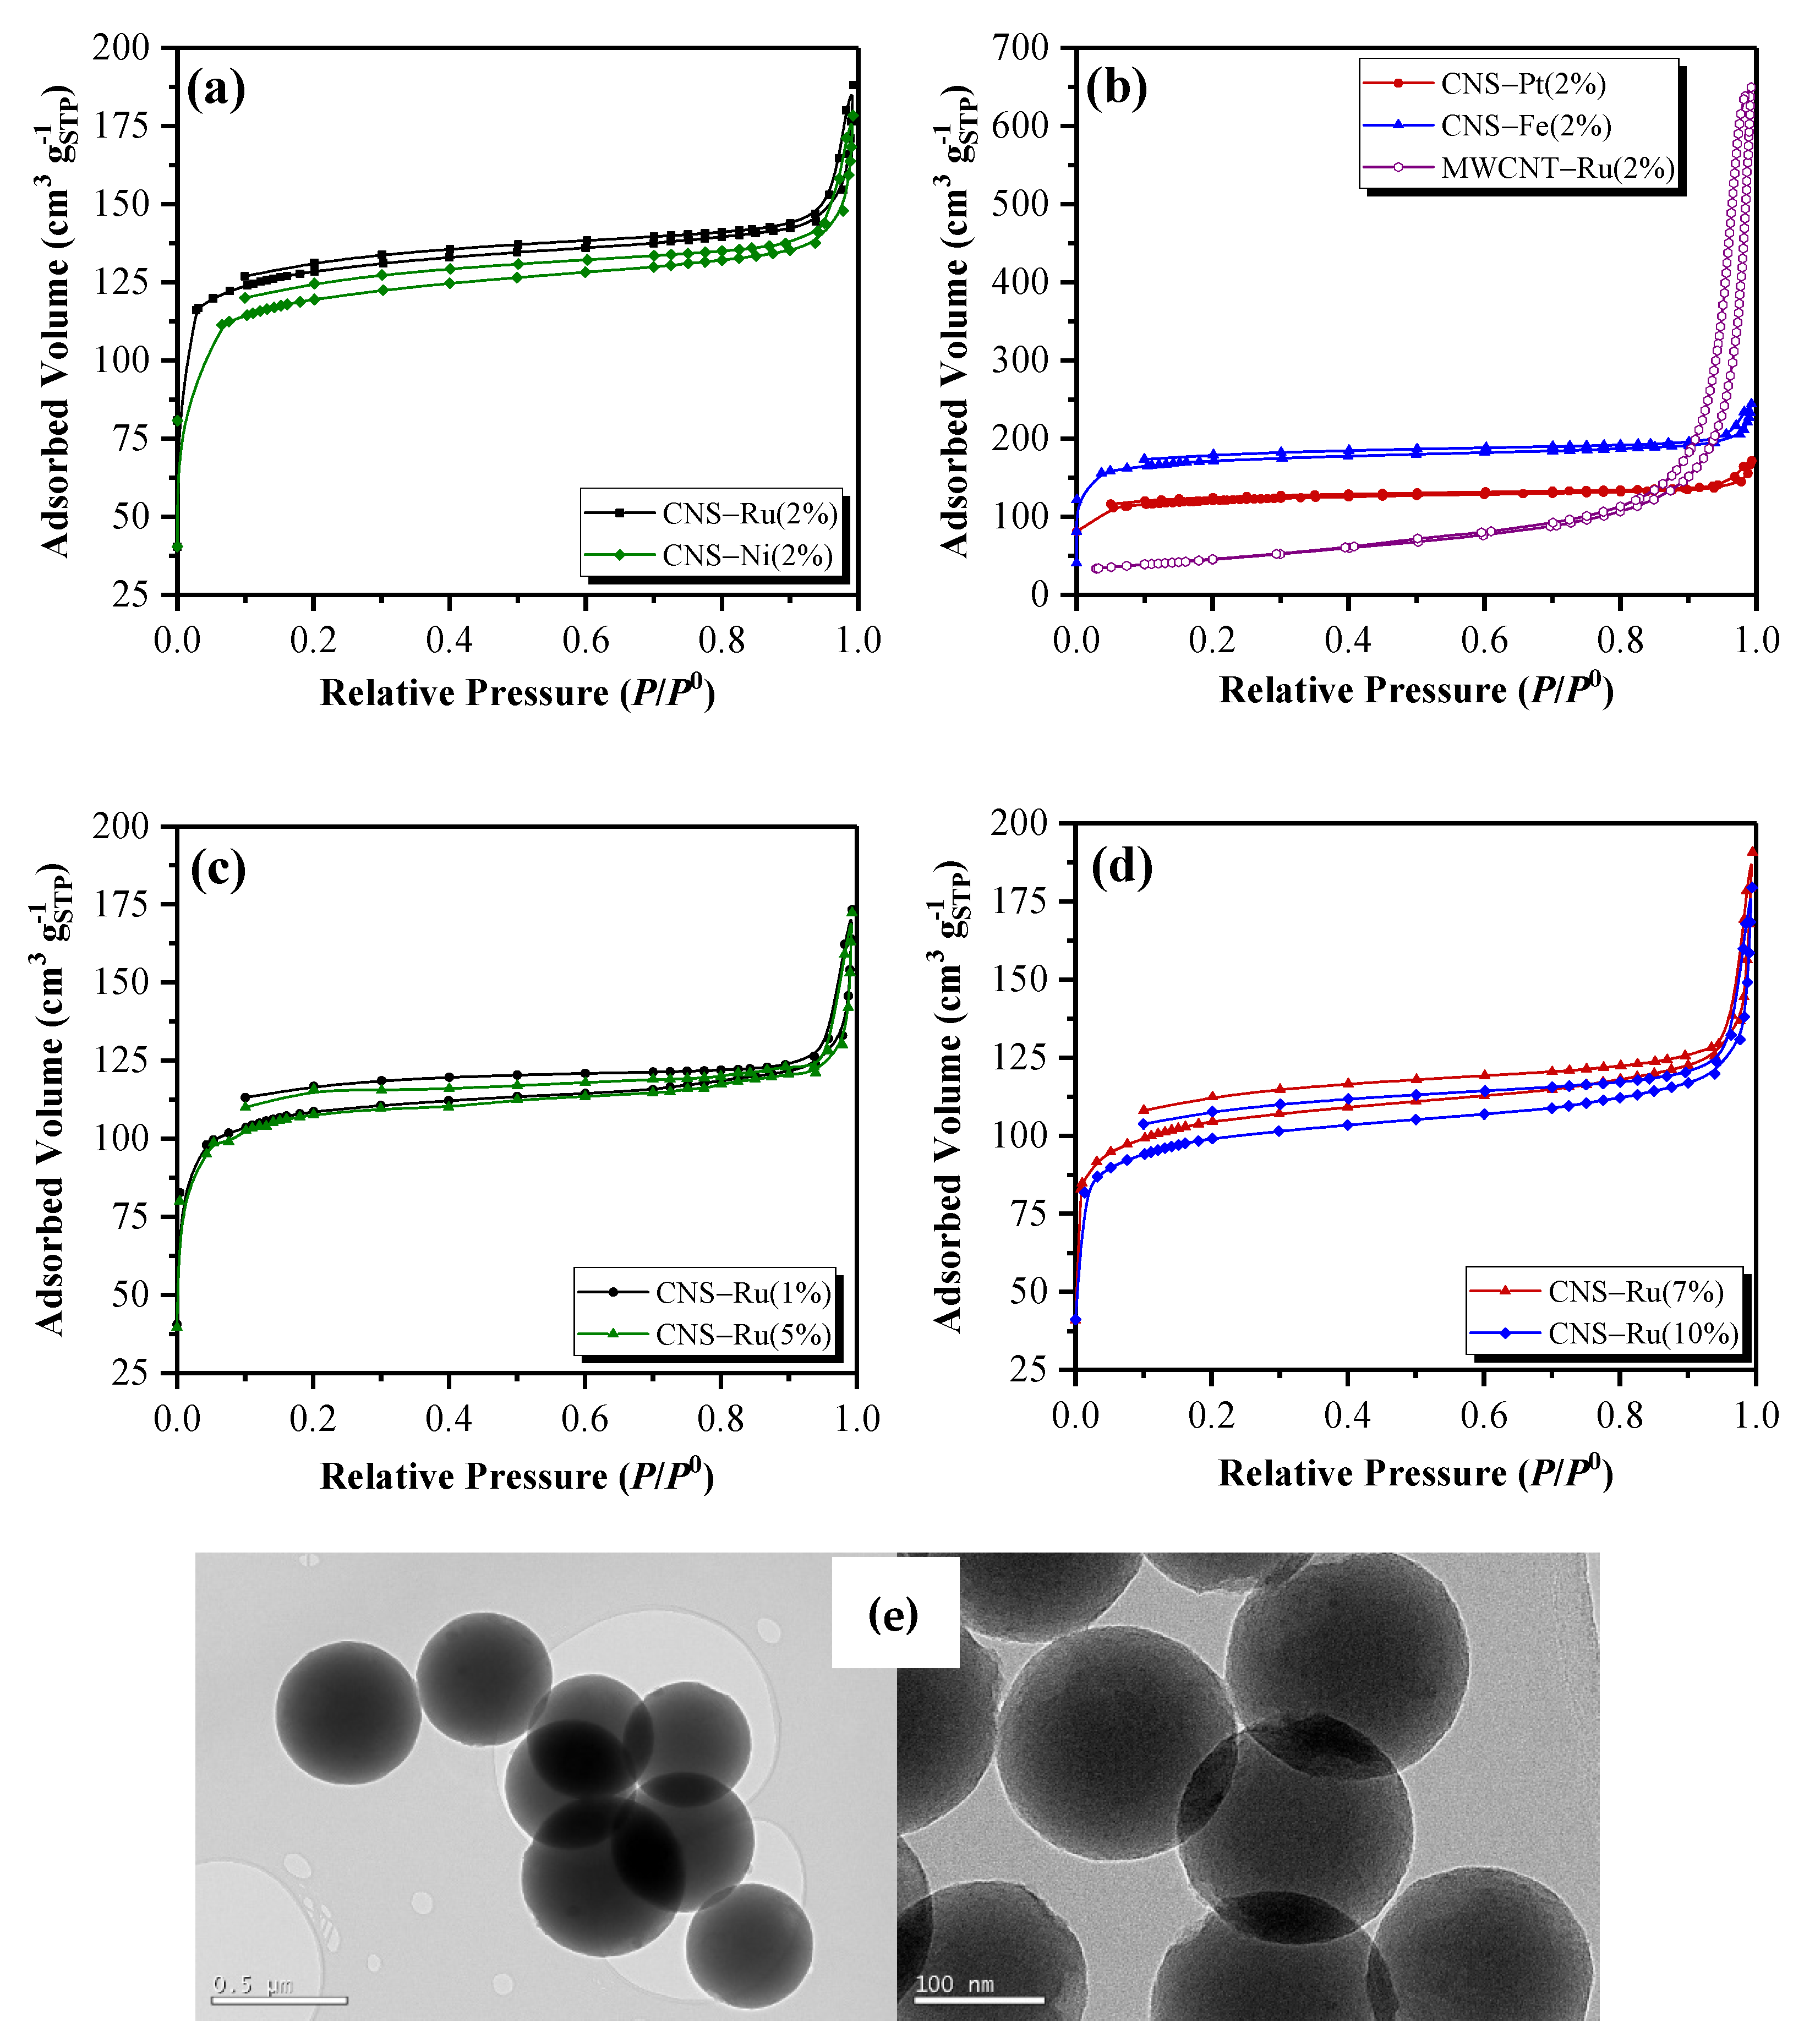
2.1. Catalyst Characterization

Thermogravimetric analysis of CNS-Ru(2%), CNS-Pt(2%), CNS-Fe(2%), and CNS-Ni(2%) (Figure 2a) and CNS-Ru at 1, 2, 5, 7, and 10% (Figure 2b) were performed. The analysis suggested that, at 1000 °C, the catalysts presented degradations between 35.41 for CNS-Ru(2%) catalyst and 37.88% for the CNS-Ni(2%) catalyst. Regarding the stability of the Ru catalysts with different metallic percentages (Figure 2b) it was observed that, except for the CNS-Ru(2%) catalyst, which was the most stable at 1000 °C, the rest showed increasing stability as a function of its Ru content, being the degradation at 1000 °C of CNS-Ru(1%) 42.54% and for CNS-Ru(10%) 39.14%, but the difference is minimal and it can be included within the experimental error. All catalysts showed similar curve trends, implying that, despite containing different metallic percentages of Ru or other metals, their stability was not determined so much by the metal they contained as active phase but by the support on which they were anchored.
X-ray diffraction patterns analysis of CNS-Ru(2%), CNS-Pt(2%), CNS-Fe(2%), and CNS-Ni(2%) (Figure 2c) and CNS-Ru at 1, 2, 5, 7, and 10% (Figure 2d) was carried out. No carbon crystalline phase stood out with a high score according to the database of the ICDD-PDF-4 + 2019 High Score Plus 4.7 program, which may be mainly attributable to the pyrolysis treatment temperature at 430 °C. From the CNS-Ru(2%) catalyst sample, coincidences were found with the Ru ICDD: 04-003-0364, and it was found that it is Ru with a hexagonal crystal system (Figure 2c). This crystal had its peaks located with higher intensities in decreasing order at the 2θ angle values of 43.98, 38.35, and 42.14°, whose planes with Miller indices were (101), (100), and (002), respectively. It should be noted that these coincidences were confirmed with more intense peaks when the percentage in Ru was higher, as the analysis was carried out on the catalysts with different Ru loads (Figure 2d). The CNS-Pt(2%) catalyst (Figure 2c) found that the best-matched element in the database was the Pt corresponding to the ICDD file: 04-016-6405, which has a cubic crystalline system. According to the program’s database, the CNS-Fe(2%) catalyst showed coincidence with the Fe of ICDD: 00-046-1436, with an orthorhombic crystalline form. The CNS-Ni(2%) catalyst could also be compared to one from the database. This was the ICDD: 01-089-3080 with a rhombohedral crystal system.
ATR-FTIR spectra exposed that the absorption bands were identical for the catalysts with different metals (Figure 2e), and the catalyst of Ru with other mass content (Figure 2f). The band corresponding to –OH groups with wavenumbers between 3200 and 3600 cm−1 is the most intense. Then, it can be appreciated that the surface groups do not depend on the metallic anchorage, only the treatment given to the support.
The isoelectric point was determined from the representation of the zeta potential in mV against pH values on the abscissa axis for catalysts with different metal as active phase, being 2.9 for CNS-Ru(2%), 2.7 for CNS-Pt(2%), 3.4 for CNS-Fe(2%), and 3.6 for CNS- Ni(2%). Therefore, all of them presented an acid character.
The elemental analysis of the catalysts with different metals at 2% by mass is shown in Table 1, displaying very similar values in the C content and practically identical ones in the H and N contents. Hence, it is verified that the carbon content does not exclusively depend on the catalyst’s metal, but on other factors such as the pyrolyzed carbon nanospheres treatment.
X-ray fluorescence spectroscopy (XRF) made it possible to determine the content of the active phase in the catalysts. The results are shown in Table 2. It can be seen that the results obtained after the synthesis are quite similar to the theoretical percentages initially proposed for the synthesis. Therefore, we could say that the synthesis of the catalysts was successful.
Figure 3 shows the adsorption–desorption isotherms of the synthesized catalysts. The adsorption isotherms of the CNS catalysts are of type Ib, with the shape of type II for relative pressure values greater than 0.9. This implies that the material is mainly micro- and macroporous, since the strip corresponding to the mesopores is practically horizontal, according to the classification proposed by Brunauer, Deming, Deming and Teller (BDDT), and the IUPAC Technical Report (2015) [25,26,27]. It is appreciated that desorption isotherms at low pressures do not close, suggesting that hysteresis occurred at low pressure, and the type of hysteresis could be classified within the type H4 [26]. The isotherm shape of the MWCNT-Ru(2%) catalyst has type III and type IVb isotherm characteristics.
Textural properties: the specific surface area calculated using the BET equation (ABET), the total specific pore volume (VP), specific volume of micropores (Vm), specific area of micropores (Am), and specific external area (Aext) are presented in Table 3.
The results of the synthetized catalysts by physisorption of N2 are shown in Table 3. It can be seen that the catalyst that presented a higher specific BET surface was the CNS-Fe(2%) catalyst with a value of 586 m2 g−1, also being the one with the highest specific volume of micropores, specific area of micropores, and specific external area, while the catalyst that obtained the lowest BET specific surface value was the MWCNT-Ru(2%) with 160 m2 g−1. It can be highlighted that this last material had the highest value of the total specific volume of pores, with a notable difference compared to the other catalysts, but at the same time, it was the one that obtained the lowest value of the specific volume of micropores. This implies that this material is not microporous, as validated in Figure 3 by the shape of its adsorption isotherm. From the analysis of the samples with different metallic percentages of Ru, it was observed that the value of the specific surface calculated by BET decreased as the content of Ru in the catalyst increased (Figure 3a,c,d). This fact could be produced by a possible plugging of the pores of the surface of carbon nanospheres by anchoring increasing amounts of Ru in them. This trend was also observed in the specific volume of micropores and specific area of micropores.
A spherical morphology was observed in all studied catalyst samples in the nanometer range, confirmed by scanning electronic microscopy (Figure 3e).

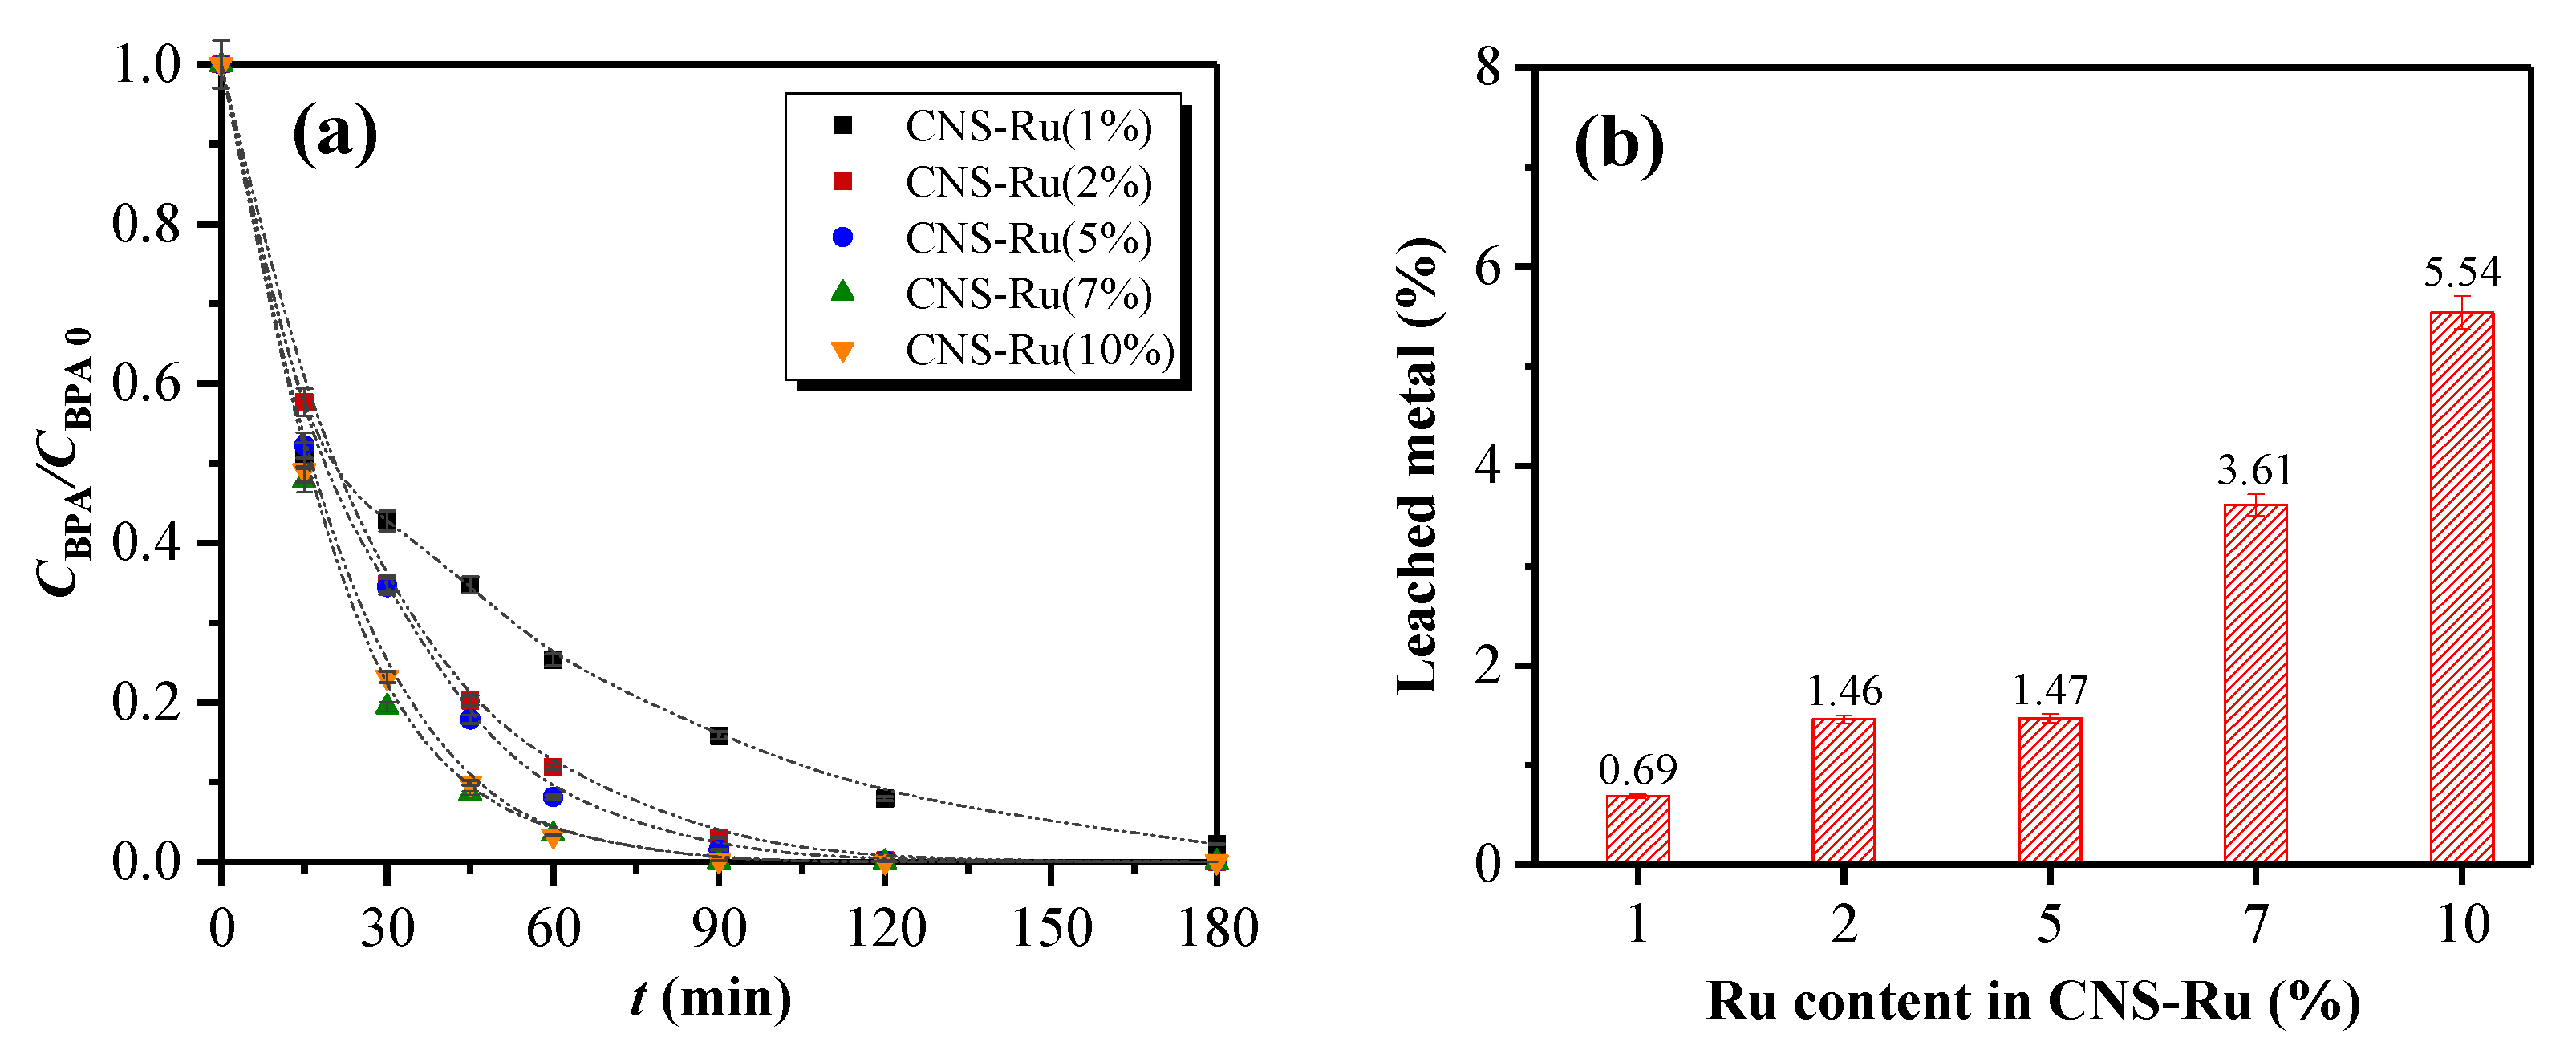
2.2. Influence of the Ruthenium Load in the CNS-Ru Catalyst

Optimal conditions for the BPA degradation by CWAO were established in T = 130 °C, P = 20 bar, [BPA]0 = 20 mg L−1, [CNS-Ru(2%)] = 2.0 g L−1 y pH0 = natural for this type of catalyst, achieving a conversion above 97% in a previous work of Serra-Pérez et al. (2019) [28]. The following set of experiments was performed to determine how the metallic percentage of Ru affected the degradation of bisphenol A in ultrapure water. In Figure 4a, it was observed that an increase in the metallic percentage of Ru decreased the degradation time of BPA from 180 min for CNS-Ru(1%) to 30 min for CNS-Ru (10%) for the same conversion (97%). However, since Ru is a high-cost precious metal, a 150 min decrease in reaction time is not sufficient for selecting the catalyst with a higher percentage of metal, as it would seriously increase operating costs. In the same way, for kinetic studies, it was interesting that the kinetics were not so fast to be able to determine the parameters without problems by very similar conversions at various times. Therefore, a mass percentage of 2% in Ru was selected as optimal to continue working with the catalyst for more experiments. It was the first minimum value to achieve a conversion above 97% in 90 min of reaction time. The leaching of ruthenium was also determined, and the highest value was for the CNS-Ru(10%), while the lowest was for the CNS-Ru(1%) catalyst (Figure 4b).

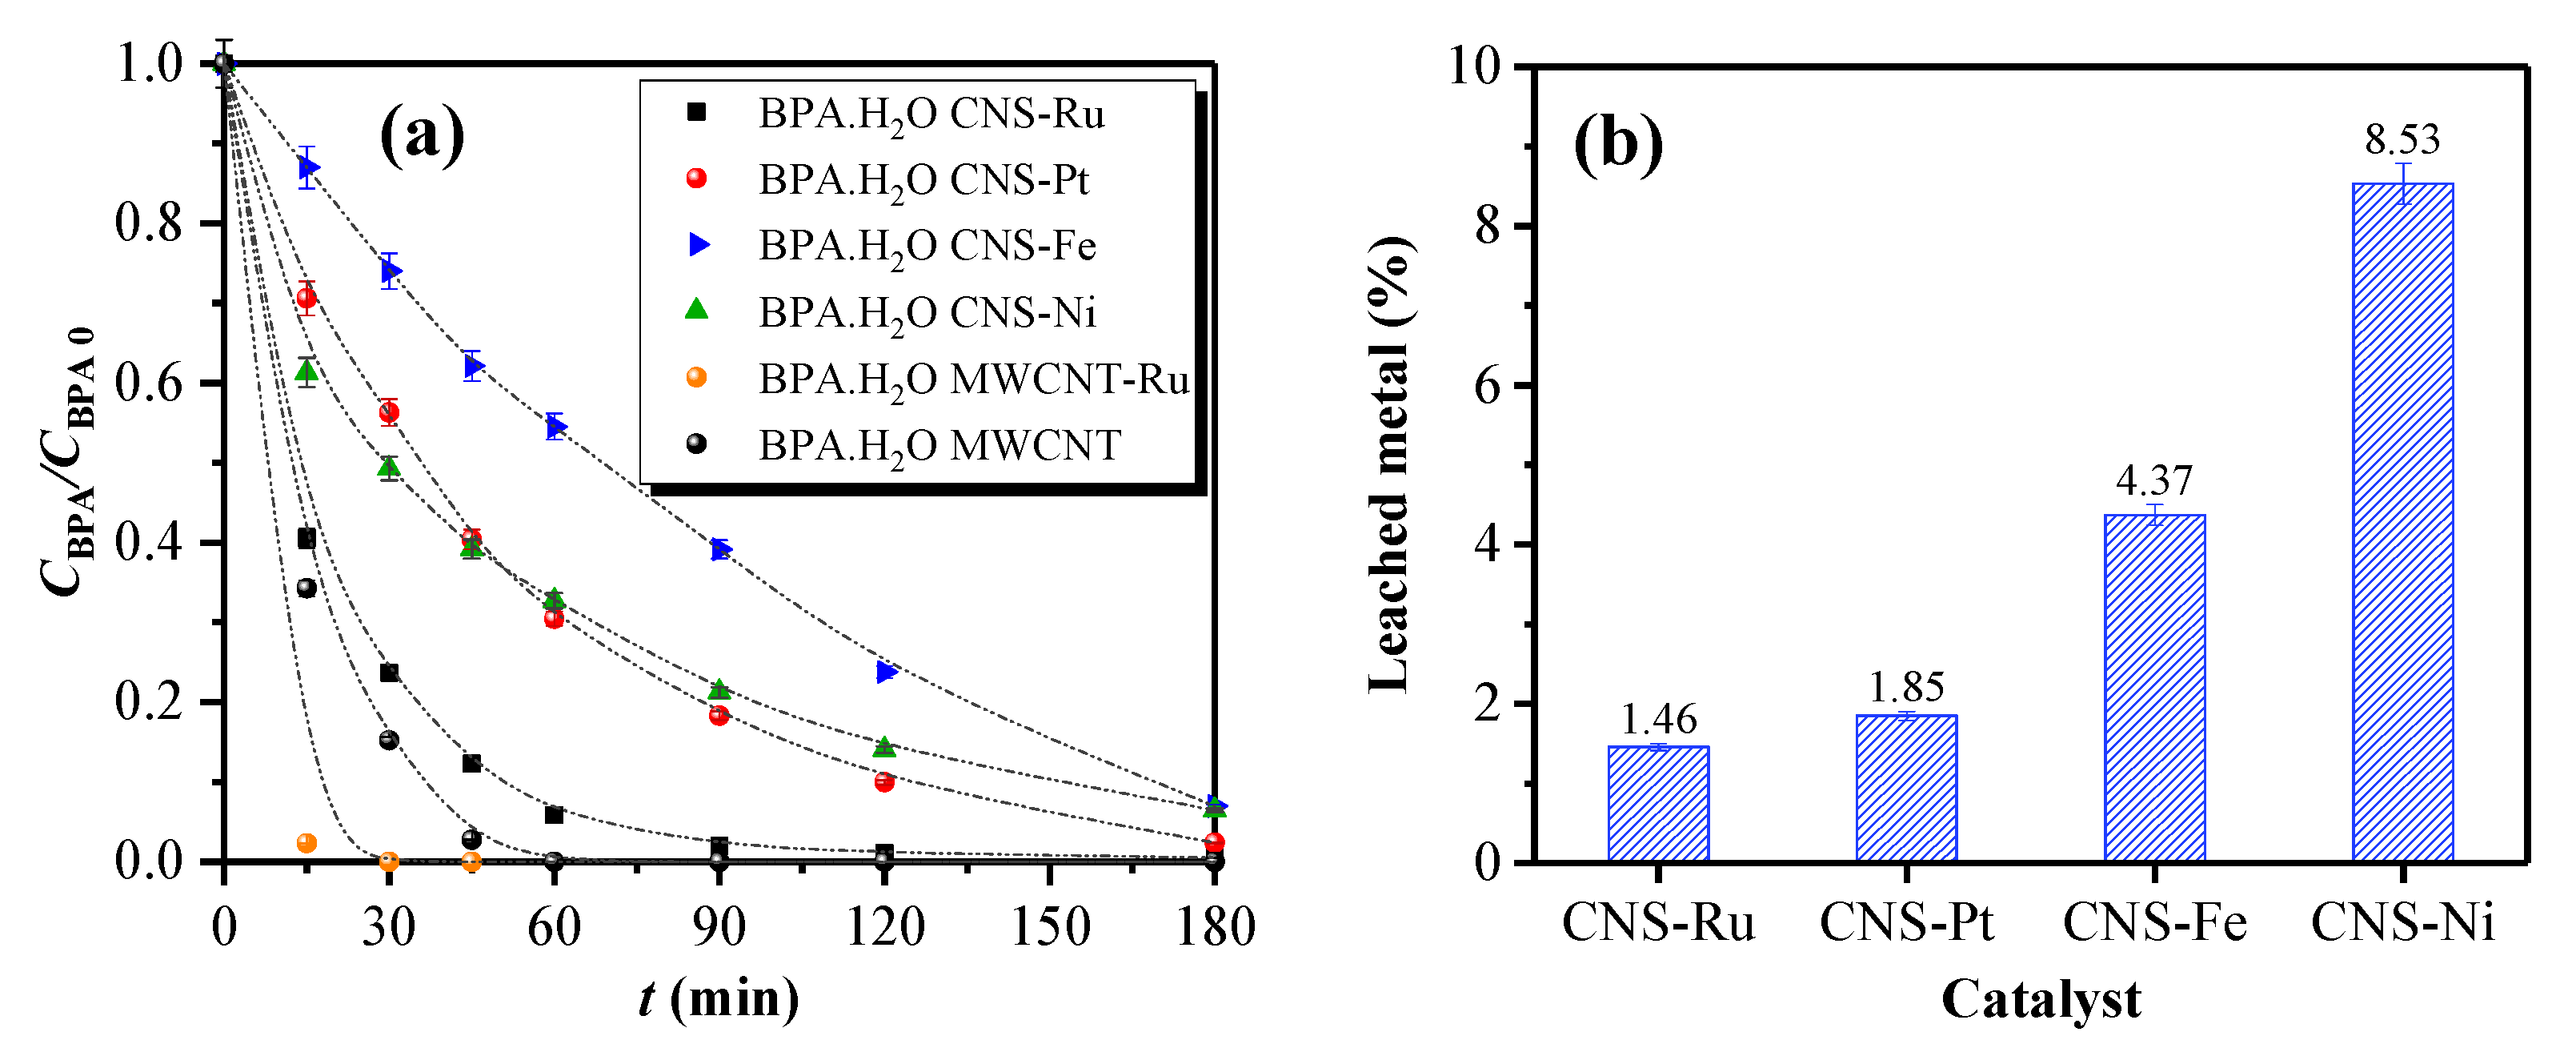
2.3. Influence of the Metal in the Catalyst for the BPA Degradation

Different metals were tested to determine if the BPA conversion was enhanced when employing a transition metal different from noble type ones. These experiments were carried out at the optimal conditions previously established and with 2 wt.% of the metal with BPA solutions in ultrapure water. Figure 5a depicted that the slowest degradation occurred when the Fe catalyst was used (93% degradation in 3 h of reaction time), followed by the degradation with the CNS-Ni (93.5%) and Pt catalyst (98%); the fastest degradation occurred with the CNS-Ru catalyst (100%).
Then, the tested catalyst was formed from the support of commercial multi-walled carbon nanotubes with ruthenium to compare with its corresponding carbon nanospheres. The BPA degradation for the MWCNT-Ru was complete in 30 min of reaction time. However, the experiments showed that this support is not a recommended option for synthesizing catalysts by the proposed synthesis method due to the high adsorption capacity they presented: 97% adsorption for bisphenol A in 45 min. It is for this reason that the rest of the metals were not tested with this support. The produced leaching of the metal concerning the initial metal content is also very variable (Figure 5b). The catalyst that had the lowest leaching was CNS-Ru(2%), and that with the highest leaching was the corresponding Ni catalyst. Toxicity tests of the final effluent revealed that leaching was linked to toxicity, as the effluent corresponding to the CNS-Ru catalyst reaction was 1.38 TU, and that corresponding to the CNS-Pt reaction was 2.66 TU. This toxicity was recorded at 5 min of exposure to compare with the value of the solution of bisphenol A in ultrapure water previously quantified (3.37 TU [28]).

2.4. Reusability and Stability Tests with CNS-Ru and CNS-Pt

Reuse experiments of the CNS-Pt(2%) catalyst in the degradation of bisphenol A in ultrapure water were carried out to compare them with those obtained with the CNS-Ru(2%) catalyst. The experiments were performed at the established optimal conditions (T = 130 °C, P = 20 bar, [BPA]0 = 20 mg·L−1, [CNS-Ru] = 2.0 g·L−1, pH0 = 7.0) [28]. It is observed in Figure 6 that the degradation of bisphenol A with CNS-Pt was slower than the degradation obtained with CNS-Ru, since, for a reaction time of 90 min with the CNS-Ru catalyst, this obtained a conversion higher than 97%. In contrast, with the CNS-Pt catalyst, the degradation was 82%. In 180 min of reaction time, the achieved conversion with CNS-Pt was 98%, while for the third run, it was 91% in the same time and 69% in 90 min of reaction time. It can be said that the activity of CNS-Pt in the reuse reactions decreased. This reduction could be due to the plugging of the catalyst pores and the formation of oxides, as has been reported in previous work for the CNS-Ru catalyst [28]. Therefore, the degradation of bisphenol A in ultrapure water is higher than 98% with the CNS-Ru catalyst. Degradations of 98% can only be achieved in 180 min with the CNS-Pt catalyst. Final effluent toxicity increased due to the increase in the metal leaching, from 1.38 (1st run) to 1.53 TU (3rd run) in the CNS-Ru experiments and from 2.66 to 3.78 TU from the first to third runs in the CNS-Pt experiments.

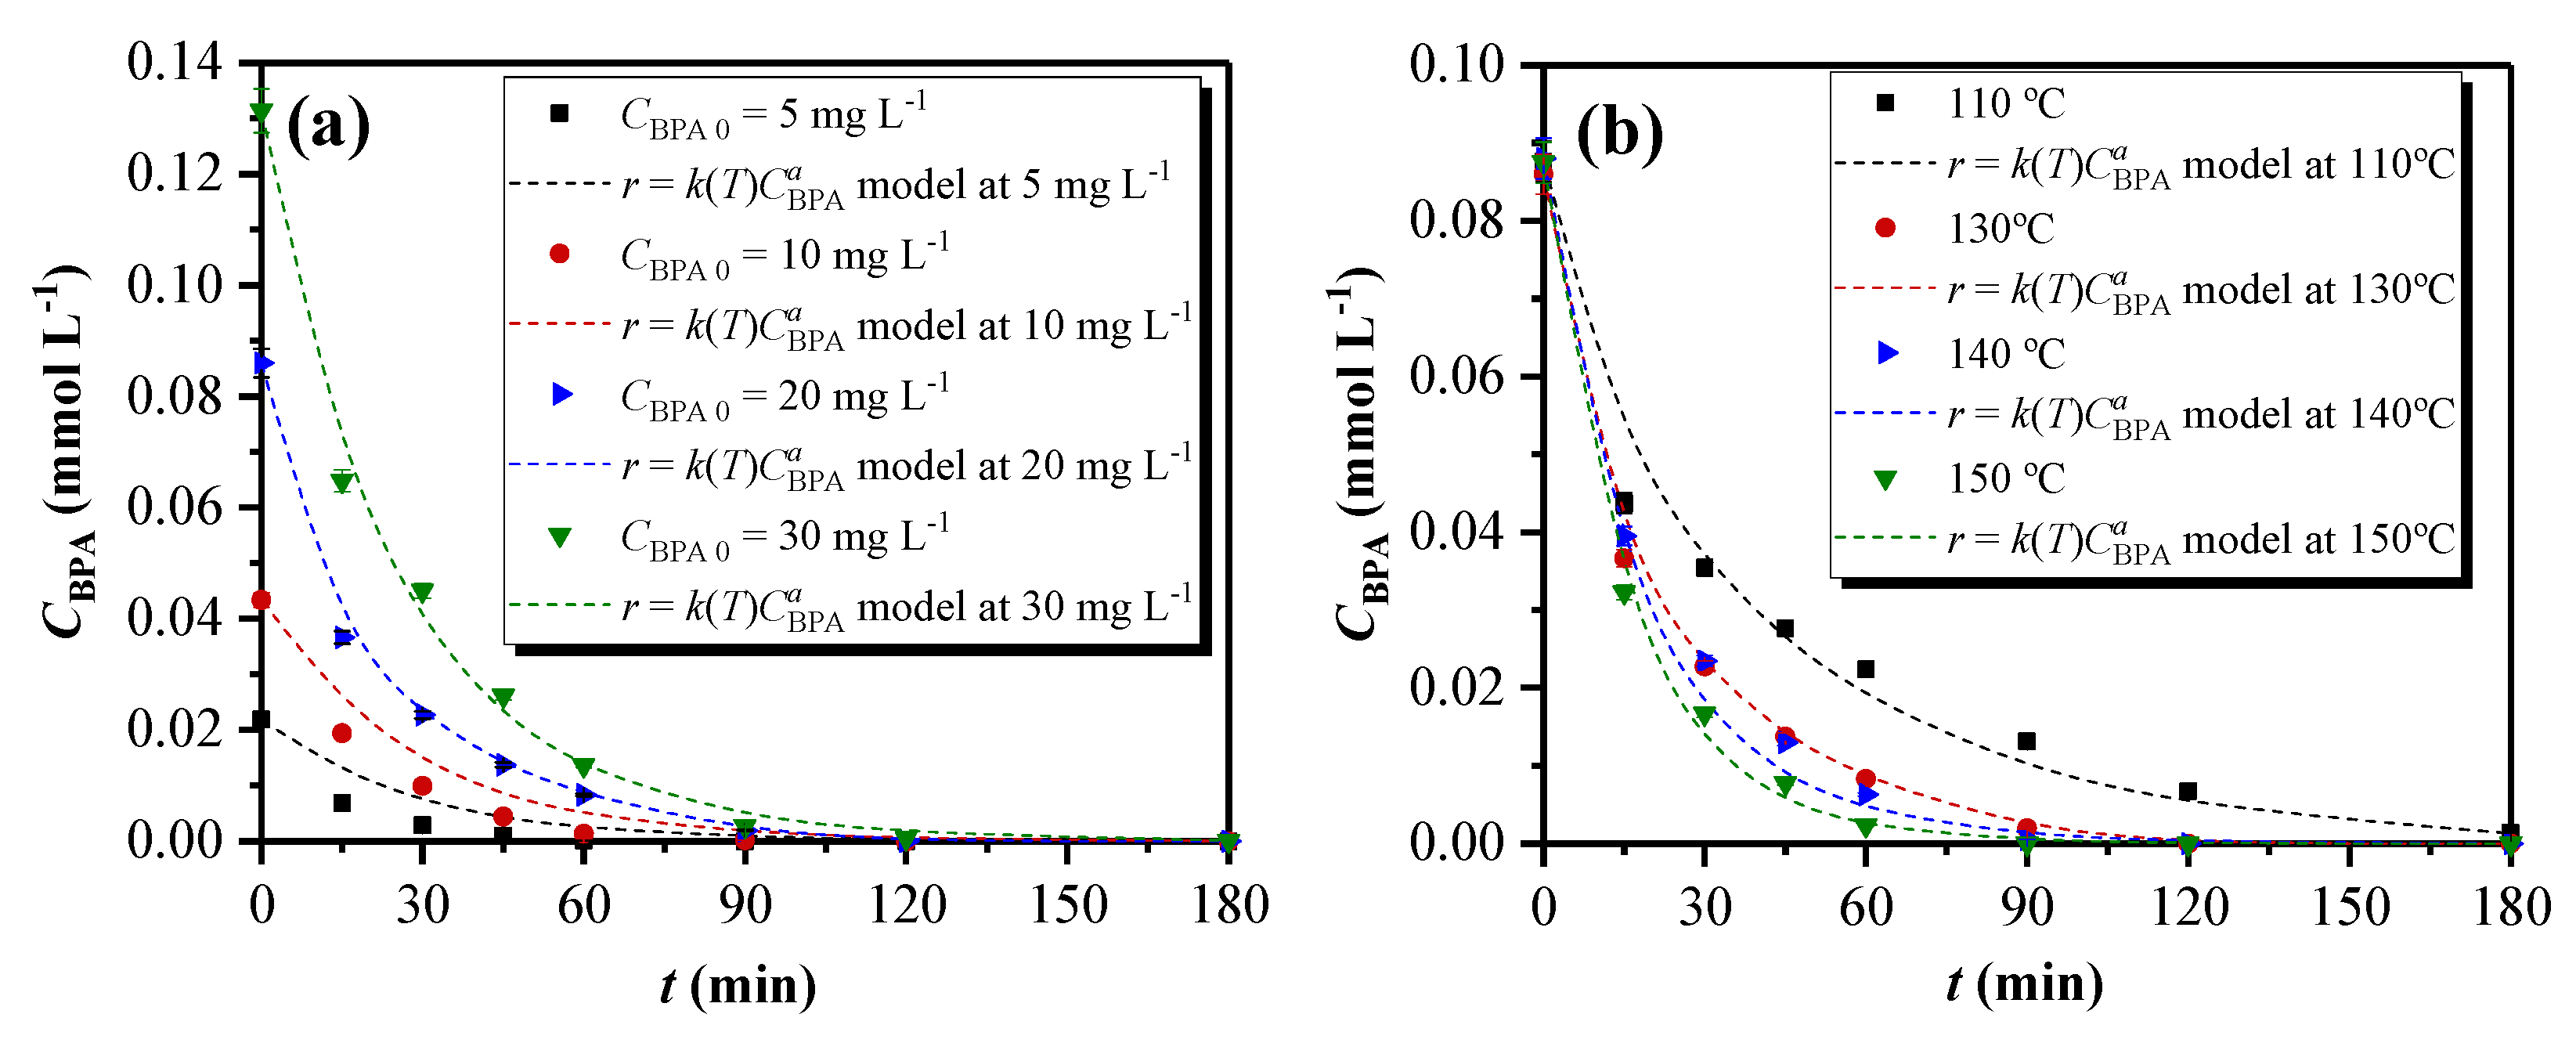
2.5. Kinetics Models Determination

Some assumptions were considered to apply the kinetics models: the volume and the catalyst mass is constant, and the reaction system is heterogeneous (Equation (1)).
r = R BPA ν BPA = d n BPA ν BPA W d t = V W ( d C BPA d t ) ,
where r (mmol gRu−1 min−1) is the reaction rate, RBPA is the BPA consumption rate, νBPA is the BPA stoichiometric coefficient, CBPA (mmol L−1) is the BPA concentration at any time, V is the reaction volume, and W (gRu) is the mass of the contained metal in the used catalyst.

2.5.1. Simple Potential Model

A one-factor potential model was proposed to adjust the results of the reactions with different reaction temperatures and initial BPA concentration (experiments 1–4 and 11–13 from Table 6) [29]. These data were adjusted to a nonlinear potential model for BPA concentration (Equation (2)):
r = k ( T ) C BPA   a ,
where k (mmol1−a La gRu—1 min−1) is the kinetic constant, which is described as a function of the temperature following the Arrhenius equation, Equation (3), and a is the order for the BPA concentration and the total order of the reaction.
k = k 0   e ( E a R   T )
In Equation (3), k0 (same units of k) is the pre-exponential factor, Ea (kJ mol−1) is the activation energy, R the gas constant (8.314·10−3 kJ mol−1 K−1), and T (K) the temperature.
The result of analytically integrating Equations (1) and (2) was a non-linear equation (Equation (4)):
C BPA = ( C BPA   0   1 a W V k   t ( 1 a ) ) 1 1 a ,
where CBPA 0 (mmol L−1) are the BPA concentrations at initial time, respectively, and t (min) is the reaction time.
The fitting of the experiments was analyzed through Origin 2017, employing the Levenberg–Marquardt iteration algorithm [30]. Reaction time, initial concentration of BPA, and temperature were considered independent variables. The model showed a high determination coefficient (R2 > 0.98). The activation energy of the reaction was 31.03 kJ·mol−1 (see Table 4). Ovejero et al. [31] found similar values for the degradation of the non-azo dye Basic Yellow 11 from aqueous solution by CWAO process.
After applying the model to the experimental data, Equation (2) can be written as Equation (5), and the calculation of the simulated concentration was possible by substitution of the values from Table 4 in Equation (4). Then, it was possible to compare the experimental data to the simulated concentration (Figure 7).
r = 8606   e ( 31.03   ±   2.55 R   T )   C BPA   0.97 ± 0.05
In Figure 7, it was observed that 20 mg L−1 of BPA initial concentration experiments were fitted better by the model because the different temperatures experiments were performed using an initial concentration of BPA of 20 mg L−1; hence, this concentration value had more weight in the model. Equation (5) validity was restricted to the range of the operating conditions used for the adjustment of the experimental data: CBPA 0 = 5–30 mg∙L−1, T = 383.15–433.15 K, [CNS-Ru] = 2.0 g∙L−1, and 20 bar.

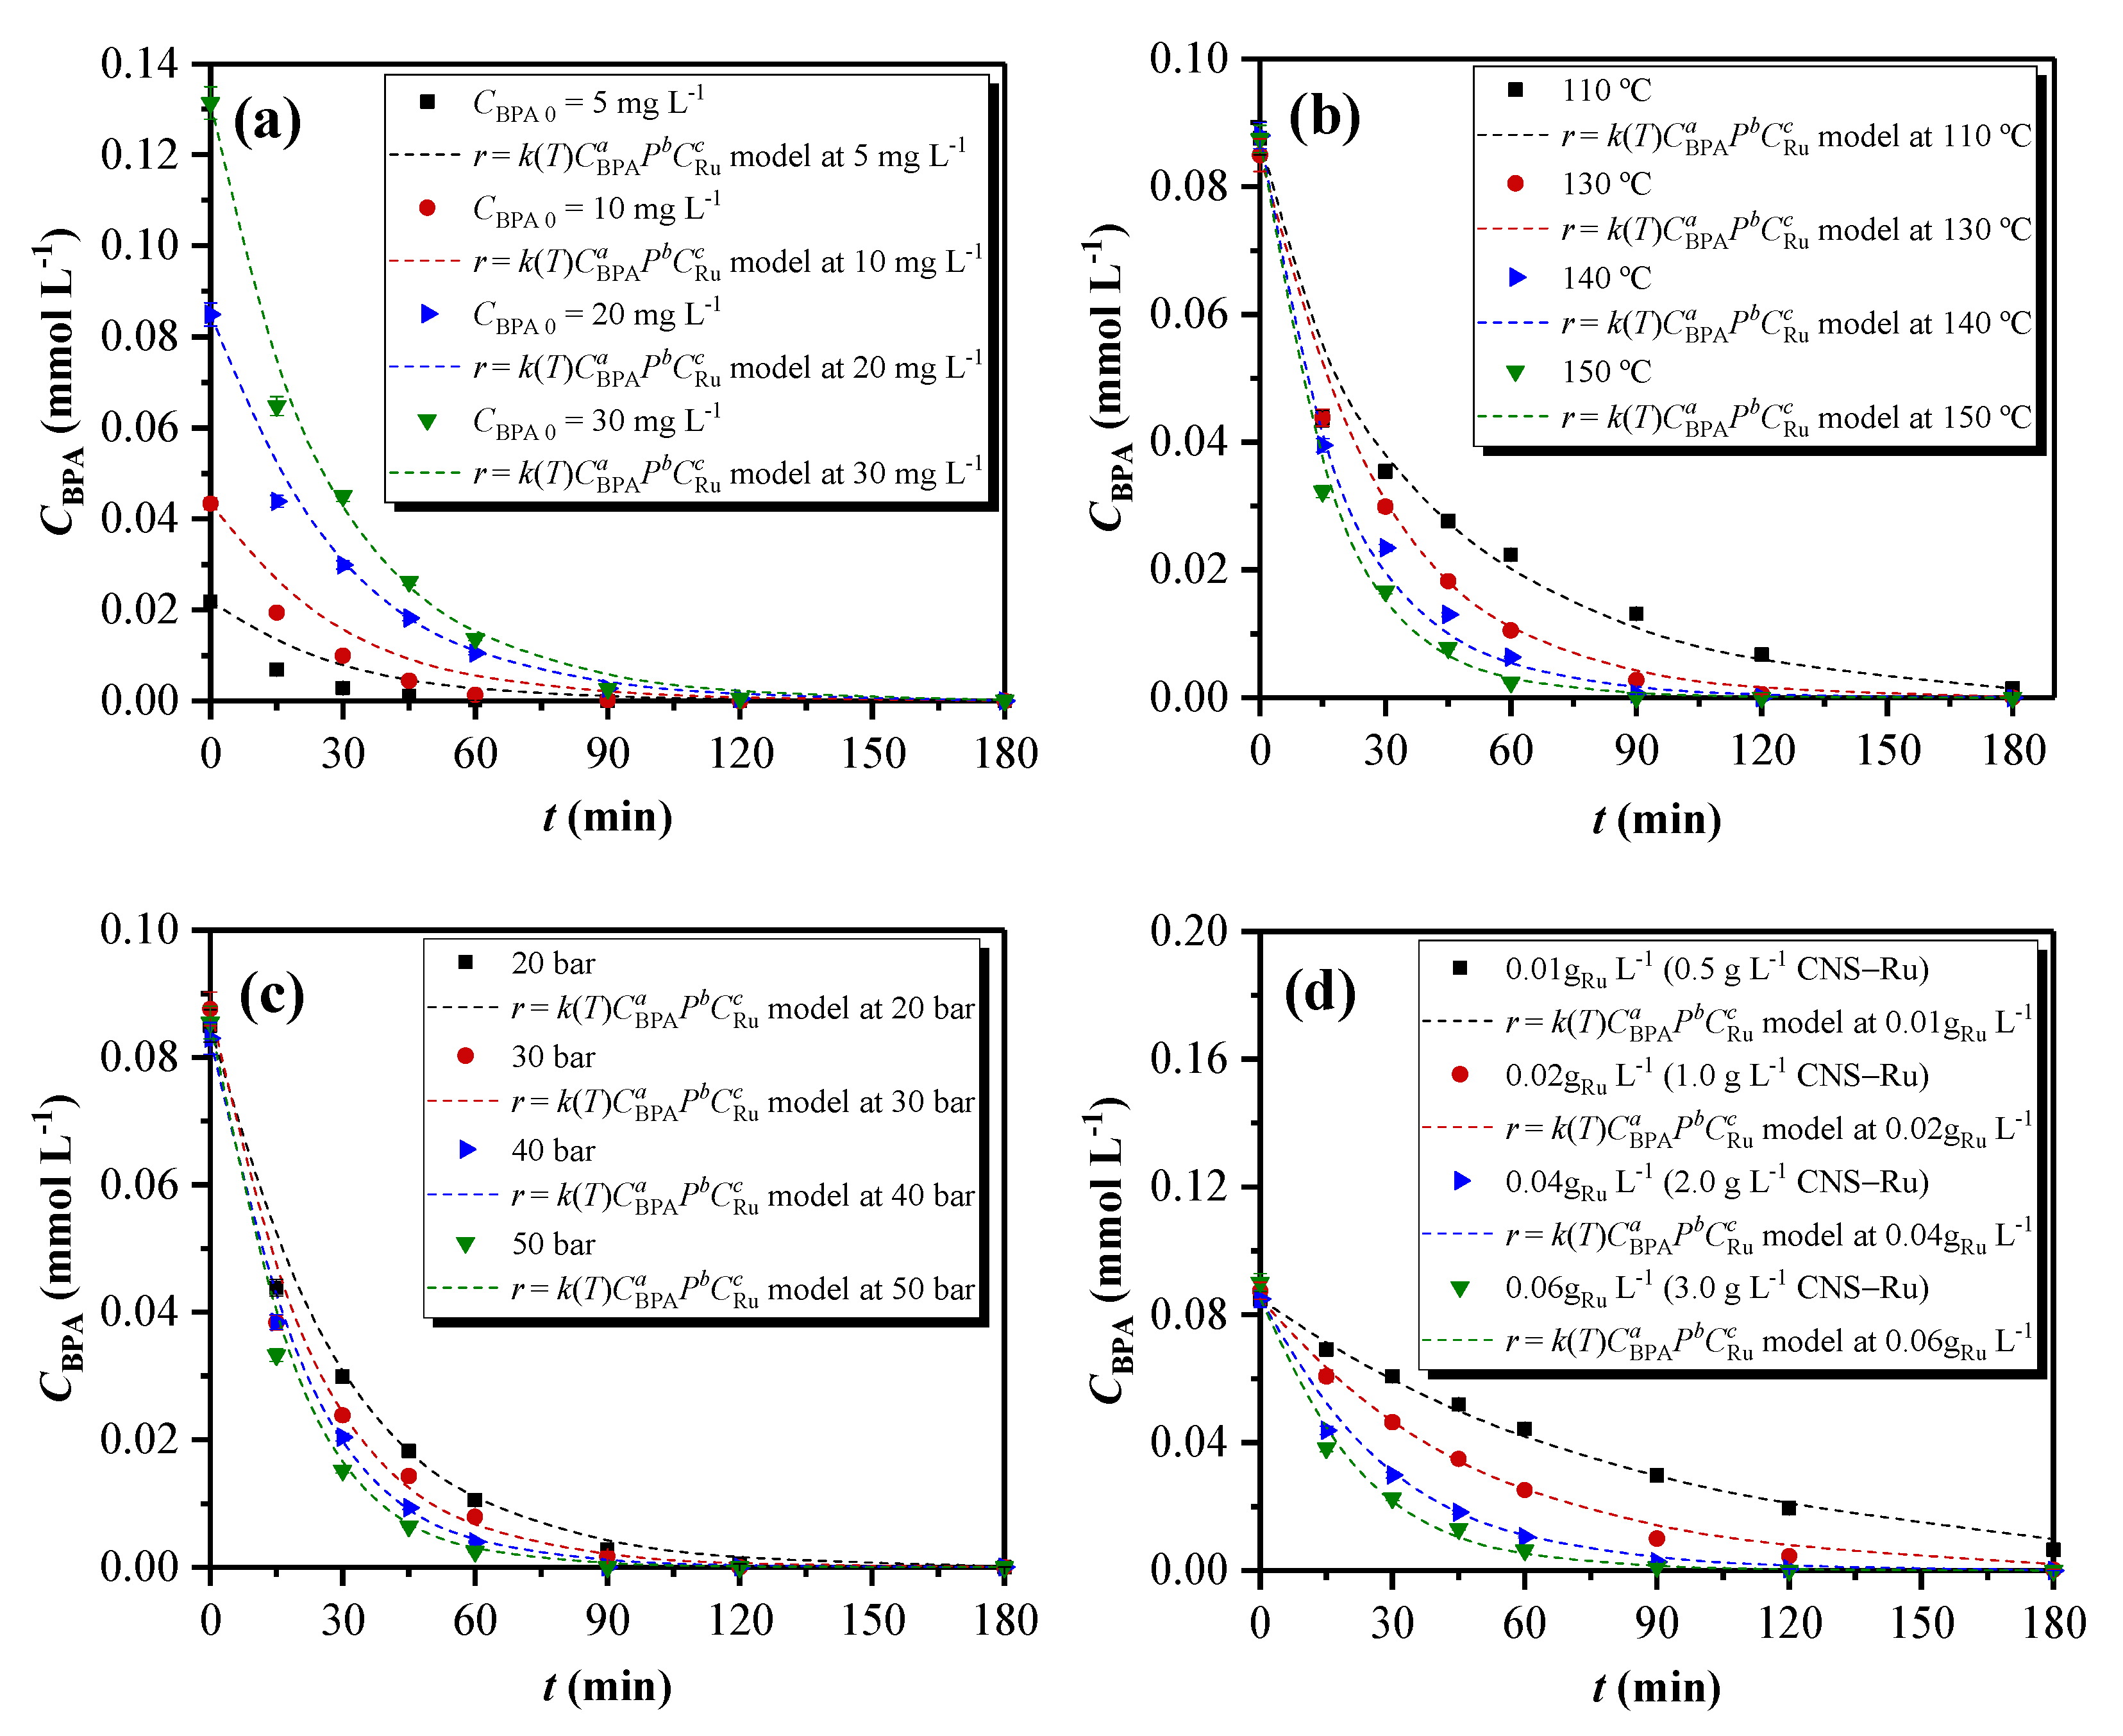
2.5.2. Complex Potential Model

Another potential model found in the literature was employed [32]. In this case, experiments with different reaction temperatures, initial concentration of BPA, and pressures and concentrations of catalyst (all experiments from Table 5) were considered for the model, Equation (6):
r = k ( T )   C BPA   a   P   b   C Ru   c ,
where some variables have been previously explained, k (mmol1−a·La+c·gRu−1−c·min−1·bar−b) has different units with respect to the previous model, P (bar) is the total pressure in the system, and CRu (gRu·L−1) is the ruthenium concentration in the used CNS-Ru catalyst.
The integration of Equations (1), (3), and (6) was analytically carried out, and the final expression for the adjustment of the CWAO reaction data is the following (Equation (7)):
C BPA = ( C BPA 0   1 a k   P   b   C Ru   c   t   ( 1 a ) )   1 1 a
Origin 2017 software was also used with the Levenberg–Marquardt algorithm. Reaction time, initial concentration of BPA, temperature, oxygen pressure, and concentration of Ru were considered independent variables. This model showed a high determination coefficient (R2 > 0.98). The activation energy of the reaction was 31.60 kJ·mol−1 (see Table 5). Similar values were found by those obtained by Gomes et al. [32].
By combining these parameters, the reaction rate (in mmol·gRu−1·min−1) can be expressed according to Equation (8):
r = 1014   e ( 31.60   ±   2.85 R   T )   C BPA   0.99 ± 0.05   P O 2   0.55 ± 0.06   C Ru   0.78 ± 0.03
As in the previous case, the applicability of this equation was restricted to this installation and the range of operating conditions employed for the fitting of the experimental data: CBPA 0 = 5–30 mg∙L−1, T = 383.15–433.15 K, P = 20–50 bar, [CNS-Ru] = 0.50–1.50 g∙L−1, and 20 bar.
In Figure 8, it was observed that the model better fitted the experiment developed with 20 mg L−1 of BPA initial concentration, because the experiments at different temperatures were performed using an initial concentration of BPA of 20 mg L−1; hence, this concentration value had more weight in the model.

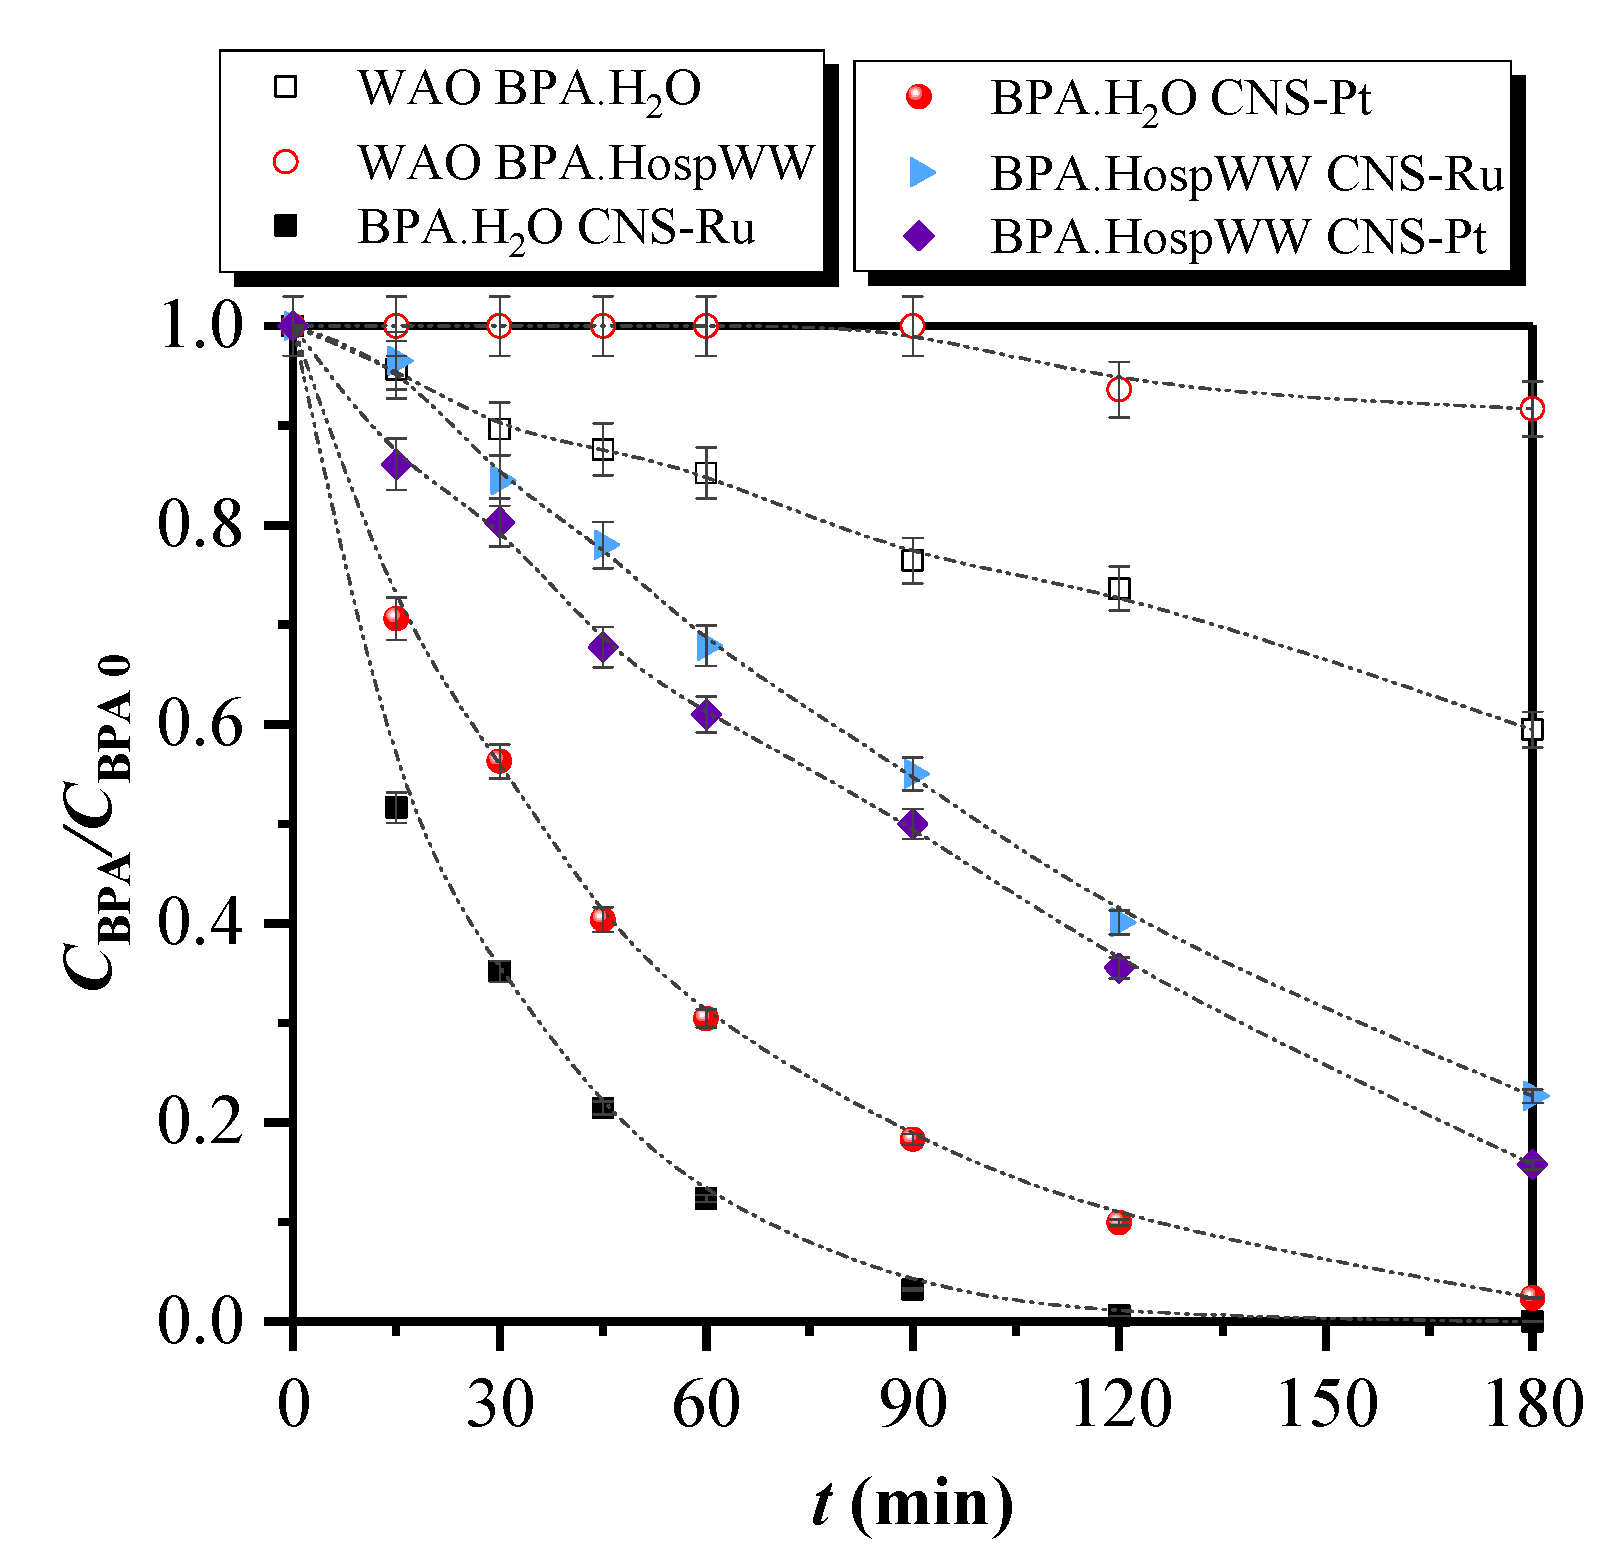
2.6. Proof of Concept: Treatment of a Real Hospital Wastewater Effluent with CNS-Ru and CNS-Pt

The previous work until this section is the preliminary study that must be carried out before application in a real matrix. In this work, a hospital wastewater effluent (HospWW) was considered to accomplish the CWAO reactions with the same synthesized catalyst (CNS-Ru(2%) and CNS-Pt(2%) and the established optimal conditions (130 °C, 20 bar, [BPA]0 = 20 mg L−1 and 2.0 g·L−1 CNS-Ru). The matrix did not contain BPA. Thus, the HospWW matrix was doped with this compound in 20 mg·L−1 for the reactions. In Figure 9, it can be appreciated that the degradation in ultrapure water with both catalysts (BPA.HospWW CNS-Ru and BPA.HospWW CNS-Pt) was higher than those values from the degradation in hospital wastewater. However, it can be observed that, while the degradation was better in the case of CNS-Ru catalyst in BPA solved in ultrapure water, the behavior is the opposite in hospital wastewater. BPA degradation is reached in 90 min for CNS-Ru in ultrapure water and 180 min, while in hospital wastewater, the BPA degradation was 78% for CNS-Ru and 85% for CNS-Pt in 180 min of reaction time. This could be due to the presence of other compounds in this matrix that are also competing for the formed OH groups during CWAO reactions [33]. It can be said that CNS-Pt catalyst has higher efficiency for BPA degradation in the case of matrices from hospital wastewater. The employment of this process could be considered to degrade BPA in hospital wastewater matrices.

3. Materials and Methods

3.1. Materials

Bisphenol A (BPA) with CAS 80-05-7 was supplied by Sigma-Aldrich (St. Louis, MI, USA) with high purity (>99.99%) and employed in the experiments. BPA was diluted in both ultrapure water and the real hospital wastewater effluent.
Formaldehyde solution (37 wt% in water, stabilized with 15 wt% methanol), resorcinol (99 wt%), Pluronic F127 powder, NaOH, RuCl3⋅H2O and H2PtCl6⋅6H2O, and H3PO4 were purchased from Sigma-Aldrich. Iron (III) nitrate nonahydrate and nickel (II) nitrate hexahydrate were obtained from Panreac. Absolute ethanol and acetonitrile were purchased from Fischer Chemical, HNO3 solution (69.5 wt. %.) was supplied by Carlo Erba, and HCl solution (37% wt.) by Honeywell Fluka. Sun Nanotech Co Ltd. (Jiangxi, China) provided multi-walled carbon nanotubes (MWCNT-L-P) with a purity higher than 90% and a diameter between 10 and 30 nm.

3.2. Synthesis of the Catalyst

The carbon nanospheres (CNS) synthesis was carried out by the mixture of resorcinol and formaldehyde in a polycondensation reaction with Pluronic F127 as a template. The synthesis of the CNS-Ru, CNS-Pt, CNS-Fe and CNS-Ni catalysts was executed by incipient wetness impregnation method and a thermal activation with hydrogen and nitrogen following the practices described by Serra-Pérez et al. [28]. All the catalysts were prepared with a metal content of 2% in weight, except for the Ru load catlayst experiments (1, 2, 5, 7 and 10 wt. %). Multi-walled carbon nanotubes were only employed with ruthenium as active phase (MWNT-Ru). The steps to obtain the catalyst with this nanotube support were functionalization, impregnation and activation, following the same synthesis method used with carbon nanospheres. Ru was also impregnated in 2% in weight in this support as a comparative study.

3.3. Catalyst Characterization

Thermogravimetric analysis was performed in a Perkin Elmer STAR 6000 thermal analyzer from 30 °C to 1000 °C, with a 10 °C min−1 heating ramp and a volumetric flow rate of 50 mL min−1 N2. XRD patterns were obtainedin a Siemens D501 diffractometer. XRD classic analyses were carried out from 5 to 100° (2θ), with a 0.105° step of measurement and 1.0 s∙step−1. With a continuous scan mode, a fixed anti-scattering slit of 5.70 mm in the diffracted beam and a fixed divergent slit of 0.25° in the incident beam was possible to carry out the analysis. The anode was Cu, and different wavelengths were emitted: K alpha1 (1.540598 Å), K alpha 2 (1.544426 Å), and K beta (1.392250 Å). A Nicolet iS50 with ATR SpectraTech Performer in the range of 400–4000 cm−1 allowed us to obtain Fourier-transformed infrared (FTIR) spectra. The maximum resolution was 0.09 cm−1, and the measurement surface was 2 mm in diameter. ATR-FTIR method was preferred because it could remove the interferences caused by humidity that the KBr pill can have. The equipment used for the isoelectric point measurements was Malvern’s Zetasizer Nano ZS. The sample was sieved between 10 and 20 µm, and 50 mg was weighed and added to 20 mL of water. The solutions used to adjust the pH were NaOH and HCl from 0.1 M to 0.001 M.
The samples’ elemental analyses were performed in LECO CHNS-932 equipment with a detection limit of 0.53, 2.75, 0.45, and 0.57% for C, H, N, and S, respectively. The required sample mass was less than 5 mg. X-ray fluorescence spectroscopy (XRF) made it possible to determine the percentage of Ru contained in the catalyst samples, for which equipment calibration was performed with different solutions of the Ru precursor being used. The catalysts of Pt, Fe, and Ni, with their previous calibrations, were also analyzed. The equipment used was an Aχios PANalytical spectrometer with excitation wavelength dispersion of up to 4 kW. The equipment is a wavelength dispersion measurement system. The gas used was He.
The materials’ morphology was analyzed using scanning electron microscopy (SEM) (JEOL JSM 6335F with 1–15 kV, 1.5–5.0 nm of resolution). The textural properties of catalysts were analyzed in a Micromeritics ASAP 2020 apparatus, obtaining N2 adsorption–desorption isotherms of the solids. For the sample analysis, approximately 150 mg of the dry sample was weighed, which was subjected to a degassing process for 4 h at 350 °C to clean the surface and the pores of the impurities that they contained. Next, the sample was cooled by the liquid nitrogen temperature to 77 K and subjected to a controlled pressure ramp. °

3.4. Characterization of the Wastewater Matrix

The hospital wastewater effluent (HospWW) was taken directly from the output current of a hospital in Madrid (Spain). A sampling campaign was performed between 20 and 26 April 2015. The employed samples in this work are those corresponding to 26 April 2015. Before collecting samples, each bottle was thoroughly washed out with ultrapure water at the laboratory and swilled out with the sample. Wastewater samples were stored in new polypropylene bottles simultaneously (10–11 a.m.). The samples were refrigerated (±4 °C) during the transport to the laboratory. Once in the lab, they were filtered through filter paper to remove sand and large solids and stored at −20 °C until being used.
The real-water aqueous matrix was characterized with the determination of the total carbon (TC) and the total nitrogen (TN) concentrations with a TOC analyzer (Shimadzu TOC), and the conductivity, aromaticity, nitrate (NO3−) and ammonia (NH4+) ions, chemical oxygen demand (COD-photometer Macherey-Nagel PF-11), suspended solids concentration, and phenolic compounds were analyzed according to the standard methods [34]. The macroscopic parameters of the hospital wastewater are exposed in Table S1 of the Supplementary Material. This hospital wastewater was doped with a BPA concentration of 20 mg∙L−1 (BPA.HospWW) for the CWAO experiments.

3.5. WAO and CWAO Experiments

The experiments were performed in a 100 mL batch reactor made of Hastelloy high-pressure equipped with a stirrer at 700 rpm to avoid any external mass transfer resistance in the liquid body and an electrical jacket. The reactor also included a cooling system for precise temperature control when the air was introduced. It was joined to the bottles of nitrogen and air. The gas and cooling water input current, a pressure gauge, and a rupture disk were positioned on top of the reactor. A thermocouple measured the temperature inside the reactor and another one was placed inside the jacket. First, 100 mL of BPA solution was introduced into the reactor in an experiment, without or with catalyst (WAO or CWAO, respectively). After purging with nitrogen to remove any trace of air, the reactor was heated to the desired temperature (110–150 °C), while the agitator was already working. The air was introduced until the work pressure was achieved when the desired temperature had been reached. The first withdrawn sample was taken when the pressure was introduced, which was considered reaction zero time. Samples were collected at regular time intervals and after were cooled in water. Once they were filtered through 0.45 μm PTFE filters and centrifuged for 10 min at 4500 rpm, they were immediately analyzed in duplicate. After each sample was taken, the reactor pressure had to adjust to its set up value to maintain the pressure constant throughout the experiment. After 180 min of reaction, the reactor was cooled down, and the catalyst was collected, filtered, and analyzed. All the reaction tests were repeated three times, obtaining a 3% of experimental error.
The ruthenium load effect reactions were carried out at the optimal conditions determined in previous work for the BPA degradation in 90 min of reaction time (T = 130 °C, P = 20 bar, [BPA]0 = 20 mg L−1, [CNS-Ru(2%)] = 2,0 g L−1 y pH0 = natural) [28]. The type-metal effect reactions were also performed at the same optimal conditions. For the reuse reactions, the catalyst was washed with ultrapure water at the end of each reaction and dried overnight in an oven at 100 °C.
Different reaction variables were modified in the oxidation experiments with the CNS-Ru(2%) catalyst for the kinetics determination. The sequence of experiments is shown in Table 6, which is the same sequence of experiments employed for the determination of the reaction optimal conditions with CNS-Ru(2%). Finally, at the optimum conditions, the hospital wastewater was doped with a BPA concentration of 20 mg L−1 to test the degradation of this compound in this real aqueous matrix using CNS-Ru and CNS-Pt.

3.6. Sample Analysis

BPA concentration was determined using a stationary mobile phase by high-performance liquid chromatography (HPLC) using a Varian ProStar chromatograph with a Perkin Elmer C18 column (220 mm × 4.6 mm; 5 μm). It is a chromatographic column filled with silica particles. The calibration method was carried out employing solutions from 40 to 0.2 mg L−1 of BPA. The obtained signal and the concentration were adjusted to a linear equation, bringing a regression coefficient (R2) value 0.997. The used mobile phase consisted of a mixture of acetonitrile-water (0.1% H3PO4) (45:55, v:v) with a volumetric flow rate of 0.40 mL min−1, and the wavelength for compound detection was established at 275 nm, utilizing an injection volume of 20 μL. Inductively coupled plasma mass spectrometry (ICP-MS) allowed to determine the metal leaching from the catalysts in some final liquid solutions. A Bruker Aurora Elite coupled with a mass spectrometer was employed to detect concentrations up to ng g−1.
Reaction final liquid samples were submitted to toxicity tests that were carried out employing an internationally standardized aquatic ecotoxicity test in a Microtox M500 analyzer. Tests were developed following the standard measurement procedure of inhibiting bioluminescence in the marine bacterium Vibrio fischeri with Biotox testing kit according to the norm ISO 11348-3, 2009. The sensitivity, cost-effectiveness, and reproducibility of this test were the characteristics on which we based our choice [35]. The toxicity of each sample was determined as the percentage of the inhibition of the luminescence relative to a non-contaminated blank (ultrapure water). All samples were determined at 15 °C, adjusting the pH between 6 and 8 and the osmotic pressure to 2% NaCl. In accordance to the standards, bioluminescence was measured after 5 and 15 min, and the results were given in toxicity units (TU) after 5 min of exposure to the bacteria [36,37].

4. Conclusions

Some important sentences can be concluded from this work.
  • The first minimum value to achieve a conversion above 97% in 90 min of reaction time was a 2 wt. % of Ru in the CNS-Ru catalyst. Leaching increased when metal content in the catalyst increased.
  • The better metal of those tested was Ru against Fe and Ni, which suffered more leaching. MWCNT as support adsorbed a significant amount of BPA.
  • Reusability of CNS-Ru was possible, while the activity of the CNS-Pt in the reuse reactions decreased.
  • Experimental data were adjusted to a potential model to reproduce the kinetics behavior of the reactions. Another more complex potential model was employed for CWAO reactions, considering the variety of different parameters, such as temperature, pollutant concentration, total pressure, and catalyst concentration. This model was successfully proposed to imitate the experimental data of CWAO process.
  • Achieved BPA degradation in the hospital wastewater was higher with CNS-Pt (85%), followed by CNS-Ru (78%) in 180 min of reaction time.

Supplementary Materials

The following are available online at https://0-www-mdpi-com.brum.beds.ac.uk/article/10.3390/catal11111293/s1, Table S1: Representative macroscopic parameters of the hospital wastewater.

Author Contributions

E.S.-P.: software, validation, formal analysis, investigation, data curation, writing—original draft preparation, writing—review and editing, visualization. J.G.R.: conceptualization, methodology, validation, resources, writing—review and editing, supervision, project administration, and funding acquisition. All authors have read and agreed to the published version of the manuscript.

Funding

This research was funded by Madrid Comunity, grant number P2018/EMT-4341 and FPU2015/04075.

Acknowledgments

The authors gratefully acknowledge the financial support from the Regional Government of Madrid provided through Project REMTAVARES (S2018/EMT-4341) and the European Social Fund. Estrella Serra-Pérez thanks the Ministerio de Ciencia, Innovación y Universidades for a PhD Grant (FPU2015/04075).

Conflicts of Interest

The authors declare no conflict of interest.

References

  1. The European Parliament and the Council of the European Union Directive 2013/39/EU of the European Parliament and of the Council of 12 August 2013 amending Directives 2000/60/EC and 2008/105/EC as regards priority substances in the field of water policy. Off. J. Eur. Union. L Ser. 2013, 226, 1–17.
  2. Rathi, B.S.; Kumar, P.S. Application of adsorption process for effective removal of emerging contaminants from water and wastewater. Environ. Pollut. 2021, 280, 116995. [Google Scholar] [CrossRef] [PubMed]
  3. Ahamad, A.; Madhav, S.; Singh, A.K.; Kumar, A.; Singh, P. Types of Water Pollutants: Conventional and Emerging. In Sensors in Water Pollutants Monitoring: Role of Material; Pooja, D., Kumar, P., Singh, P., Patil, S., Eds.; Springer: Singapore, 2020; pp. 21–41. ISBN 978-981-15-0671-0. [Google Scholar]
  4. Sèdes, L.; Desdoits-Lethimonier, C.; Rouaisnel, B.; Holota, H.; Thirouard, L.; Lesne, L.; Damon-Soubeyrand, C.; Martinot, E.; Saru, J.P.; Mazaud-Guittot, S.; et al. Crosstalk between BPA and FXRα signaling pathways lead to alterations of undifferentiated germ cell homeostasis and male fertility disorders. Stem Cell Rep. 2018, 11, 944–958. [Google Scholar] [CrossRef] [Green Version]
  5. Rubin, B.S. Bisphenol A: An endocrine disruptor with widespread exposure and multiple effects. J. Steroid Biochem. Mol. Biol. 2011, 127, 27–34. [Google Scholar] [CrossRef] [PubMed]
  6. Helmestam, M.; Davey, E.; Stavreus-Evers, A.; Olovsson, M. Bisphenol A affects human endometrial endothelial cell angiogenic activity in vitro. Reprod. Toxicol. 2014, 46, 69–76. [Google Scholar] [CrossRef]
  7. Norwegian Environment Agency List of Priority Substances; Norwegian Environment Agency: Oslo, Norway, 2017; pp. 1–16.
  8. Lancheros, J.C.; Madera-Parra, C.A.; Caselles-Osorio, A.; Torres-López, W.A.; Vargas-Ramírez, X.M. Ibuprofen and Naproxen removal from domestic wastewater using a horizontal subsurface flow constructed wetland coupled to ozonation. Ecol. Eng. 2019, 135, 89–97. [Google Scholar] [CrossRef]
  9. Tran, N.H.; Reinhard, M.; Gin, K.Y. Occurrence and fate of emerging contaminants in municipal wastewater treatment plants from different geographical regions—A review. Water Res. 2018, 133, 182–207. [Google Scholar] [CrossRef] [PubMed]
  10. Česen, M.; Ahel, M.; Terzić, S.; Heath, D.J.; Heath, E. The occurrence of contaminants of emerging concern in Slovenian and Croatian wastewaters and receiving Sava river. Sci. Total Environ. 2019, 650, 2446–2453. [Google Scholar] [CrossRef] [PubMed]
  11. Peña-Álvarez, A.; Castillo-Alanís, A. Identificación y cuantificación de contaminantes emergentes en aguas residuales por microextracción en fase sólida-cromatografía de gases-espectrometría de masas (MEFS-CG-EM). TIP Rev. Espec. Cienc. Químico-Biológicas 2015, 18, 29–42. [Google Scholar] [CrossRef] [Green Version]
  12. Corrales, J.; Kristofco, L.A.; Baylor Steele, W.; Yates, B.S.; Breed, C.S.; Spencer Williams, E.; Brooks, B.W. Global assessment of bisphenol a in the environment: Review and analysis of its occurrence and bioaccumulation. Dose-Response An Int. J. 2015, 13, 1559325815598308. [Google Scholar] [CrossRef] [PubMed] [Green Version]
  13. Martín, J.; Camacho-Muñoz, D.; Santos, J.L.; Aparicio, I.; Alonso, E. Determination of emerging and priority industrial pollutants in surface water and wastewater by liquid chromatography-negative electrospray ionization tandem mass spectrometry. Anal. Bioanal. Chem. 2014, 406, 3709–3716. [Google Scholar] [CrossRef] [PubMed]
  14. Oluwole, A.O.; Omotola, E.O.; Olatunji, O.S. Pharmaceuticals and personal care products in water and wastewater: A review of treatment processes and use of photocatalyst immobilized on functionalized carbon in AOP degradation. BMC Chem. 2020, 14, 62. [Google Scholar] [CrossRef] [PubMed]
  15. Oliveira, A.S.; Baeza, J.A.; Saenz de Miera, B.; Calvo, L.; Rodriguez, J.J.; Gilarranz, M.A. Aqueous phase reforming coupled to catalytic wet air oxidation for the removal and valorisation of phenolic compounds in wastewater. J. Environ. Manag. 2020, 274, 111199. [Google Scholar] [CrossRef] [PubMed]
  16. Liu, N.; Lu, N.; Yu, H.; Chen, S.; Quan, X. Degradation of aqueous bisphenol A in the CoCN/Vis/PMS system: Catalyst design, reaction kinetic and mechanism analysis. Chem. Eng. J. 2021, 407, 127228. [Google Scholar] [CrossRef]
  17. Chu, J.H.; Kang, J.K.; Park, S.J.; Lee, C.G. Bisphenol A degradation using waste antivirus copper film with enhanced sono-Fenton-like catalytic oxidation. Chemosphere 2021, 276, 130218. [Google Scholar] [CrossRef]
  18. Li, S.; Wu, Y.; Zheng, Y.; Jing, T.; Tian, J.; Zheng, H.; Wang, N.; Nan, J.; Ma, J. Free-radical and surface electron transfer dominated bisphenol A degradation in system of ozone and peroxydisulfate co-activated by CoFe2O4-biochar. Appl. Surf. Sci. 2021, 541, 147887. [Google Scholar] [CrossRef]
  19. Rathnayake, B.; Heponiemi, A.; Huovinen, M.; Ojala, S.; Pirilä, M.; Loikkanen, J.; Azalim, S.; Saouabe, M.; Brahmi, R.; Vähäkangas, K.; et al. Photocatalysis and catalytic wet air oxidation: Degradation and toxicity of bisphenol A containing wastewaters. Environ. Technol. 2020, 41, 3272–3283. [Google Scholar] [CrossRef]
  20. Rashid, T.; Iqbal, D.; Hazafa, A.; Hussain, S.; Sher, F.; Sher, F. Formulation of zeolite supported nano-metallic catalyst and applications in textile effluent treatment. J. Environ. Chem. Eng. 2020, 8, 104023. [Google Scholar] [CrossRef]
  21. Baloyi, J.; Ntho, T.; Moma, J. Synthesis of highly active and stable Al/Zr pillared clay as catalyst for catalytic wet oxidation of phenol. J. Porous Mater. 2019, 26, 583–597. [Google Scholar] [CrossRef]
  22. Sun, W.; Wei, H.; yang An, L.; Jin, C.; Wu, H.; Xiong, Z.; Pu, C.; Sun, C. Oxygen vacancy mediated La1-xCexFeO3-δ perovskite oxides as efficient catalysts for CWAO of acrylic acid by A-site Ce doping. Appl. Catal. B Environ. 2019, 245, 20–28. [Google Scholar] [CrossRef]
  23. Soares, O.S.; Rocha, R.P.; Órfão, J.J.; Pereira, M.F.; Figueiredo, J.L. Mechanothermal Approach for N-, S-, P-, and B-Doping of Carbon Nanotubes: Methodology and Catalytic Performance in Wet Air Oxidation. C 2019, 5, 30. [Google Scholar] [CrossRef] [Green Version]
  24. Nieto-Márquez, A.; Romero, R.; Romero, A.; Valverde, J.L. Carbon nanospheres: Synthesis, physicochemical properties and applications. J. Mater. Chem. 2011, 21, 1664–1672. [Google Scholar] [CrossRef]
  25. Brunauer, S.; Deming, L.S.; Deming, W.E.; Teller, E. On a Theory of the van der Waals Adsorption of Gases. J. Am. Chem. Soc. 1940, 62, 1723–1732. [Google Scholar] [CrossRef]
  26. Thommes, M.; Kaneko, K.; Neimark, A.V.; Olivier, J.P.; Rodriguez-Reinoso, F.; Rouquerol, J.; Sing, K.S. Physisorption of gases, with special reference to the evaluation of surface area and pore size distribution (IUPAC Technical Report). Pure Appl. Chem. 2015, 87, 1051–1069. [Google Scholar] [CrossRef] [Green Version]
  27. Martín Martínez, J.M. Adsorción Física de Gases y Vapores por Carbones; Secretariado de Publicaciones de la Universidad de Alicante: Alicante, Spain, 1990; ISBN 8486809339. [Google Scholar]
  28. Serra-Pérez, E.; Álvarez-Torrellas, S.; Águeda, V.I.; Delgado, J.A.; Ovejero, G.; García, J. Insights into the removal of Bisphenol A by catalytic wet air oxidation upon carbon nanospheres-based catalysts: Key operating parameters, degradation intermediates and reaction pathway. Appl. Surf. Sci. 2019, 473, 726–737. [Google Scholar] [CrossRef]
  29. Levenspiel, O. Chemical Reaction Engineering, 3rd ed.; John Wiley & Sons: New York, NY, USA, 1999; ISBN 047125424X. [Google Scholar]
  30. Eftaxias, A.; Font, J.; Fortunyb, A.; Giralt, J.; Fabregat, A.; Stüber, F. Kinetic modelling of catalytic wet air oxidation of phenol by simulated annealing. Appl. Catal. B Environ. 2001, 33, 175–190. [Google Scholar] [CrossRef] [Green Version]
  31. Ovejero, G.; Rodríguez, A.; Vallet, A.; García, J. Catalytic wet air oxidation of a non-azo dye with Ni/MgAlO catalyst. Chem. Eng. J. 2013, 215–216, 168–173. [Google Scholar] [CrossRef]
  32. Gomes, H.T.; Figueiredo, J.L.; Faria, J.L.; Serp, P.; Kalck, P. Carbon-supported iridium catalysts in the catalytic wet air oxidation of carboxylic acids: Kinetics and mechanistic interpretation. J. Mol. Catal. A Chem. 2002, 182–183, 47–60. [Google Scholar] [CrossRef]
  33. Filip, J.; Cajthaml, T.; Najmanová, P.; Černík, M.; Zbořil, R. (Eds.) Advanced Nano-Bio Technologies for Water and Soil Treatment; Springer: New York, NY, USA, 2020; ISBN 978-3-030-29839-5. [Google Scholar]
  34. Rice, E.W.; Baird, R.B.; Eaton, A.D. (Eds.) Standard Methods for the Examination of Water and Wastewater, 23rd ed.; American Public Health Association, American Water Works Association, Water Environment Federation: Washington, DC, USA, 2017; ISBN 9780875532875. [Google Scholar]
  35. Ortiz de García, S.A.; Pinto Pinto, G.; García-Encina, P.A.; Irusta-Mata, R. Ecotoxicity and environmental risk assessment of pharmaceuticals and personal care products in aquatic environments and wastewater treatment plants. Ecotoxicology 2014, 23, 1517–1533. [Google Scholar] [CrossRef]
  36. Abbas, M.; Adil, M.; Ehtisham-ul-Haque, S.; Munir, B.; Yameen, M.; Ghaffar, A.; Shar, G.A.; Asif Tahir, M.; Iqbal, M. Vibrio fischeri bioluminescence inhibition assay for ecotoxicity assessment: A review. Sci. Total Environ. 2018, 626, 1295–1309. [Google Scholar] [CrossRef]
  37. Donner, E.; Kosjek, T.; Qualmann, S.; Kusk, K.O.; Heath, E.; Revitt, D.M.; Ledin, A.; Andersen, H.R. Ecotoxicity of carbamazepine and its UV photolysis transformation products. Sci. Total Environ. 2013, 443, 870–876. [Google Scholar] [CrossRef] [PubMed] [Green Version]
Figure 1. Molecular structure of bisphenol A (4,4′-(propane-2,2-diyl)diphenol).
Catalysts 11 01293 g001
Figure 2. (a,b) Thermogravimetric analysis of CNS-Ru, CNS-Pt, CNS-Fe, CNS-Ni, and CNS-Ru catalyst with different load of Ru; (c,d) XRD patterns of CNS-Ru, CNS-Pt, CNS-Fe, CNS-Ni, and CNS-Ru catalyst with different loads of Ru; (e,f) ATR-FTIR spectra of CNS-Ru, CNS-Pt, CNS-Fe, CNS-Ni, and CNS-Ru catalyst with a different load of Ru.
Catalysts 11 01293 g002aCatalysts 11 01293 g002b
Figure 3. (a,b) N2 adsorption–desorption isotherms of CNS-Ru, CNS-Pt, CNS-Fe, CNS-Ni; (c,d) CNS-Ru catalyst with a different load of Ru; (e) catalyst SEM images.
Catalysts 11 01293 g003
Figure 4. (a) Influence of the load of Ru in the BPA degradation (T = 130 °C, P = 20 bar, [BPA]0 = 20 mg·L−1, [CNS-Ru] = 2.0 g·L−1, pH0 = 7.0); (b) Percentage of leached ruthenium in the final reaction effluent measured at optimal conditions (T = 130 °C, P = 20 bar, [BPA]0 = 20 mg·L−1, [catalyst] = 2.0 g·L−1, pH0 = 7.0).
Catalysts 11 01293 g004
Figure 5. (a) Influence of the metal type (2 wt. %) in the catalyst for the BPA degradation and support MWCNT at optimal conditions; (b) percentage of leached metal in the final reaction effluent measured at optimal conditions (T = 130 °C, P = 20 bar, [BPA]0 = 20 mg·L−1, [catalyst] = 2.0 g·L−1, pH0 = 7.0).
Catalysts 11 01293 g005
Figure 6. (a) Reusability of CNS-Ru and CNS-Pt for the BPA degradation at optimal conditions; (b) percentage of leached metal in the final reaction effluent measured at optimal conditions (T = 130 °C, P = 20 bar, [BPA]0 = 20 mg·L−1, [catalyst] = 2.0 g·L−1, pH0 = 7.0).
Catalysts 11 01293 g006
Figure 7. Simulation of Equation (5) for (a) different initial BPA concentrations in the CWAO process (130 °C, 20 bar, 2.0 g L−1 CNS-Ru); (b) different reaction temperatures (20 bar, 2.0 g L−1 CNS-Ru, [BPA]0 = 20 mg·L−1).
Catalysts 11 01293 g007
Figure 8. Simulation of Equation (7) for (a) different initial BPA concentrations (130 °C, 20 bar, 2.0 g L−1 CNS-Ru); (b) different temperatures (20 bar, 2.0 g L−1 CNS-Ru, [BPA]0 = 20 mg·L−1); (c) different pressures (130 °C, [BPA]0 = 20 mg·L−1, 2.0 g·L−1 CNS-Ru); and (d) different Ru concentration values (130 °C, 20 bar, [BPA]0 = 20 mg L−1).
Catalysts 11 01293 g008
Figure 9. Degradation of BPA by WAO and CWAO solved in H2O and HospWW at optimal conditions (130 °C, 20 bar, [BPA]0 = 20 mg L−1 and 2.0 g·L−1 CNS-Ru).
Catalysts 11 01293 g009
Table 1. Elemental microanalysis of catalysts with metals at 2% in weight.
Catalyst%C%H%N
CNS-Ru(2%)69.502.963.51
CNS-Pt(2%)68.133.103.34
CNS-Fe(2%)63.033.103.43
CNS-Ni(2%)65.983.393.16
Table 2. X-ray fluorescence spectroscopy of the synthesized catalysts.
CatalystMetal—Active Phase Weight Content (%)
CNS-Ru(2%)Ru1.95
CNS-Pt(2%)Pt2.05
CNS-Fe(2%)Fe2.07
CNS-Ni(2%)Ni2.03
CNS-Ru(1%)Ru0.97
CNS-Ru(5%)Ru4.86
CNS-Ru(7%)Ru6.93
CNS-Ru(10%)Ru10.2
Table 3. Elemental microanalysis of catalysts with different metal at 2% in weight.
CatalystMetalwt. (%)ABET (m2 g−1)VP (cm3 g−1)Vm (cm3 g−1)Am (m2 g−1)Aext (m2 g−1)
CNSRu2340 ± 60.3260.102335119
Pt2330 ± 60.3310.15024882
Fe2586 ± 90.3610.199433153
Ni2406 ± 60.2600.134290116
MWCNTRu2160 ± 0.30.9160.00921138
CNSRu1372 ± 50.2380.119258114
Ru5367 ± 50.2800.113245118
Ru7358 ± 50.2770.109238120
Ru10340 ± 50.2450.104227113
Table 4. Results of the fitting to Equation (4).
ParameterValue
k0 (mmol1−a·La·gRu−1·min−1)8606
Ea (kJ·mol−1)31.03 ± 2.55
a0.97 ± 0.05
R20.988
Table 5. Results of the fitting to Equation (7).
ParameterValue
k0 (mmol1−a·La+c·gRu−1−c·min−1·bar−b)1014
Ea (kJ·mol−1)31.60 ± 2.85
a0.99 ± 0.05
b0.55 ± 0.06
c0.78 ± 0.03
R20.988
Table 6. Sequence of experiments for kinetics determination.
ExperimentT (°C)P (bar)[CNS-Ru(2%)] (gRu L−1)CBPA 0 (mg L−1)
1110200.0420
2130200.0420
3140200.0420
4150200.0420
5130300.0420
6130400.0420
7130500.0420
8130200.0120
9130200.0220
10130200.0620
11130200.045
12130200.0410
13130200.0430
Publisher’s Note: MDPI stays neutral with regard to jurisdictional claims in published maps and institutional affiliations.

