
Crystal Imperfections of Industrial Vanadium Phosphorous Oxide Catalysts
by
Isabella Kappel
1,†, 
Sebastian Böcklein
2,
SoHyun Park
1,
Michael Wharmby
3,
Gerhard Mestl
2,* and
Wolfgang W. Schmahl
1 1
Department of Geo- and Environmental Sciences, Section of Crystallography, Ludwig-Maximilians-Universität München (LMU), Theresienstr. 41C, 80333 Munich, Germany
2
Clariant AG, Waldheimer Str. 13, 83052 Bruckmühl, Germany
3
Beamline P02.1, PETRA III, DESY, Notkestr. 85, 22607 Hamburg, Germany
*
Author to whom correspondence should be addressed.
†
Current affiliation: Max-Planck-Institut für Kohlenforschung, Kaiser-Wilhelm-Platz 1, 45470 Mülheim, Germany.
Catalysts 2021, 11(11), 1325; https://0-doi-org.brum.beds.ac.uk/10.3390/catal11111325
Submission received: 9 October 2021
/
Revised: 27 October 2021
/
Accepted: 27 October 2021
/
Published: 31 October 2021
(This article belongs to the Special Issue Commemorative Issue in Honor of Professor Gerhard Ertl on the Occasion of His 85th Birthday)
Abstract
:This study presents information about crystal imperfections in the main phase of industrial vanadium phosphorous oxide catalysts that are used to catalyze the oxidation of n-butane to maleic anhydride, being an important intermediate in the chemical industry. The mechanism of this reaction is still debated, and the catalytically active and selective surface centers have not yet been identified. The results presented are based on X-ray diffraction data obtained by both laboratory-scale and synchrotron powder diffraction experiments, as well as laboratory-scale single-crystal diffraction experiments. It has been proven that pronounced Bragg reflection broadening effects found in laboratory-scale powder diffraction patterns of industrial VPO catalysts are real and not due to an insufficient 2-θ resolution of the apparatus. In the framework of this work, a powder diffraction full profile fitting strategy was developed using the TOPAS software, which was applied to analyze the X-ray diffraction data of four differently activated industrial catalyst samples, originating from one batch after they had been catalytically tested. It was found that the reflection broadening is mainly caused by an anisotropic crystal size, which results in platelet-shaped crystallites of vanadyl pyrophosphate. A further contribution to the reflex broadening, especially for (111), was found to be a result of stacking faults perpendicular to the a direction in the crystal structure of vanadyl pyrophosphate. These results were used to elaborate on possible correlations between structural proxies and catalytic performance. A direct correlation between the extension of coherently scattering domains in the z direction and the catalyst’s selectivity could be proven, whereas the activity turned out to be dependent on the crystallite shape. Regarding the phase contents, it could be shown that sample catalysts containing a higher amount of β-VO(PO3)2 showed increased catalytic activity.
1. Introduction
Maleic anhydride is a key component in the chemical industry of high demand, usage, and value. Its application areas cover an extraordinarily diverse field of chemical applications. It is an important component for polymers and coatings for construction, automotive, ship building and energy industries. The best material currently known to catalyze the selective oxidation from n-butane to maleic anhydride is vanadium phosphorous oxide (VPO). However, the VPO system is rather complex as it is characterized by the formation and interconversion of many crystalline and amorphous V3+, V4+ and V5+ phases [1]. In the literature, it is widely accepted that vanadyl pyrophosphate (VPP), (VO)2P2O7, is considered the main bulk phase in industrial VPO catalysts [2].
VPP is built up by double V-O chains along the a axis. These represent the basic structural feature. The chains are linked together via P2O7 groups. Vanadium is not exactly octahedrally coordinated to oxygen since the V-O distance along the a axis alternates [3]. Thus, distorted octahedra describe the environment around vanadium. The distorted octahedra are connected via a corner and form edge-sharing pairs along the c direction. Phosphorous is tetrahedrally coordinated by oxygen and these tetrahedra are connected to each other via a corner along a, too. The known space group at room temperature is reported to be Pca21. Furthermore, it was discovered that vanadyl pyrophosphate shows a second-order phase transition at Tc = 214.1 °C and, therefore, a high-temperature form exists with the space group Pcab [4].
VPP is known to be formed by thermal dehydration via a topotactic reaction from its V4+ precursor vanadyl hydrogen phosphate hemihydrate VOHPO4·0.5H2O (VHP), which has a layered structure and, therefore, a platy morphology [5]. Both phases have similar crystal structures in which the VOHPO4 layers are hydrogen-bonded via HPO42− groups in the precursor phase and they become covalently bonded via pyrophosphate P2O74− groups during activation to VPP [6]. According to Torardi et al., electron microscopy and X-ray diffraction clearly showed that size and shape during the transformation do not change, indicating that the morphology of the precursor is very important since it determines the morphology of the final catalyst [7]. The so-called organic synthesis route seems to result in the most active and selective catalyst [8]. Precursors produced by this route showed less crystallinity and preferential exposure of the (001) planes.
Weng et al. reported that the typical precursor to industrial catalysts forms a rosette-type agglomerate after a reduction of VOPO4·2H2O using 1-butanol [9]. In contrast, the simultaneous reduction with 1-butanol and n-octane results in rosette-type aggregations of angular VOHPO4·0.5H2O platelets. The reaction of VOPO4·2H2O with n-octane followed by reaction with 1-butanol, led to nano-scale rhomboidal VOHPO4·0.5H2O [9]. It is well known that both VOHPO4·0.5H2O and VOPO4·2H2O exhibit a layer-type morphology having basal planes along the platelet normal [9]. The sheets in the final precursor structure are characterized by pairs of face sharing VO6 octahedra that are interlinked by PO4 tetrahedra. Residual interlayer water molecules hold these layers along the [100] direction. Only the catalyst generated from the nanoscale rhomboidal precursor platelets showed poor activity and selectivity [9]. It is suggested by the authors that this may be due to poorer crystallinity and more limited exposure of the active (100) (VO)2P2O7 plane.
Sithamparappilai et al. reported that besides VOHPO4·0.5H2O, also VO(H2PO4)2 with characteristic block-shaped crystallites can be formed by standard preparation methods if an alkane is added [10]. The activation of VO(H2PO4)2 forms VO(PO3)2 which is reported to have a poor selectivity for maleic anhydride. It is also reported that the presence of β-VO(PO3)2 leads to a decrease in activity since it creates low-surface area catalysts [11]. On the other hand, F.K Hannour et al. have shown in their studies that the rate per area of MA formation of β-VO(PO3)2 is comparable to that of VPP [11].
Today, scientists seem to agree that the principal component of the catalyst, VPP, is the active phase. However, a theory is vividly discussed which suggests that various VPO phases form a highly dynamic surface on the VPP phase under reaction conditions [12], which could be seen as a precursor to the real catalyst. More recent in situ studies stated that the surface composition and catalytic performance vary as a function of the P/V ratio and reaction conditions [13]. VPP can be oxidized to a variety of V5+ vanadyl orthophosphate polymorphs, which may partially interconvert. Among these, α-, β-, γ-, δ-, and XI-VOPO4 could all be observed on the catalyst surface in previous works and they might all contribute to the development of different active surfaces, which would further increase the complexity of the VPO system [2].
In 2005, Guliants et al. published a summary of key issues regarding the fundamentals of n-butane oxidation over VPO, which were discussed in early reviews. According to this paper, a catalyst’s performance depends on the method of precursor synthesis, the procedure for activation and conditioning at high temperatures, and the nature of the metal promoters [8]. Regarding the synthesis conditions, they point out that the preferential exposure of the (001) basal planes, the presence of defects in the stacking of the (001) planes, and a slight excess of phosphorous are necessary to obtain an optimal catalyst [8]. Furthermore, Nguyen et al. mention that catalysts are routinely prepared with an excess of phosphorus, which may likely be found on the surface of the final catalyst and that the vanadium oxidation state is slightly higher than 4 when it has come to a steady state in a reactor [3]. According to them, the non-stoichiometry might be explained by assuming defects in the VPO structure which are likely to occur during the topotactic dehydration where layers get bound to each other by the formation of V-O and P-O bonds.
It has been discussed that V5+/V4+ redox pairs and V=O bonds on the catalyst surface might be the active sites to cleave the C-H bonds of n-butane. This is considered to be the rate-limiting step in the activation reaction [14]. The importance of P=O bonds was also discussed [15,16]. Since the surfaces of materials with an imperfect structural order, such as amorphous phases and defect-rich nanoparticles, typically show a larger number of such bonds, they are present in industrial VPO catalysts [17].
Still, despite decades of research, the reaction mechanism from n-butane to maleic anhydride over a VPO catalyst is not yet fully understood. No agreement has been reached about the roles of the different species found in catalysts in the reaction mechanism. Seeing that carbon monoxide and carbon dioxide are major reaction by-products, it is not only important from an economic but also from an environmental point of view to gain more knowledge about catalytic pathways in order to be able to improve catalyst productivity and optimize the production process of this highly important and valuable catalytic system. Similarly, a better understanding of the bulk structure and its relation to performance will in the end lead to a better fundamental understanding of the decisive real catalyst structure. Therefore, this study aims at a better comprehension of the catalyst bulk structure—performance relationship for the n-butane partial oxidation over VPO.
2. Results
2.1. Changing the Catalyst Preparation Conditions
A series of four specimens (A–D) of Clariant’s industrially produced CLARIANT’s SynDane® catalyst, for which the conditions in the activation procedure were varied (see Table 1), was used in this study. The aim was to understand which changes in the real structure of the catalyst might relate to the observed differences in catalyst performance as a function of the activation procedure.
As Table 1 shows, these variations in the activation step impact the performance of the catalysts after more than 200 h equilibration with respect to both activity and selectivity. The activity seems to be much more sensitive to varying activation conditions with values ranging from between 100% to only 52.4%. The selectivity values however only vary between 100% and 95.6%.
2.2. Results of the Powder Diffraction Full Profile Analysis
In addition to their varying performance, these catalysts also show subtle differences in their powder X-ray diffraction patterns recorded after the performance test (Figure 1). After the test which spans about 200 h, the catalysts are fully equilibrated. In this state, they have reached a real structure that might correlate to the observed steady-state catalyst performance. Phase identification was conducted prior to starting the full profile analysis. For the given set of four VPO catalysts, three phases are required to describe their diffraction patterns. These are vanadyl pyrophosphate, β-VO(PO3)2, and graphite, which stems from the tableting process.
Despite having the same main crystalline phases, there are differences between these samples, which become visible as changes in reflex position, broadening, and intensity. These differences between the X-ray powder diffraction patterns imply that the catalyst’s real structure after equilibration in the catalytic test varies as a function of the initial preparation conditions, as the catalytic test conditions and procedure were identical for all four catalysts (see Materials and Methods Section 4). This is an important finding and the question arises, whether there is a relation between a catalyst’s performance and its real structure as predefined by details of the activation procedures.
To this end, a full profile analysis was performed to extract the real structural information. Reflection broadening effects, which confirm the presence of crystal imperfections, the contribution of defects and microstructural properties such as size and strain effects to the observed reflection broadening, must be evaluated in order to gain insight into the real structure of industrial VPO catalysts and shed some light on its relation to catalytic performance.
2.2.1. Phase Identification
Since technical graphite is used for tableting the catalyst, its Rietveld analysis had to be adapted. Hence, own refined graphite lattice parameters were used in this analysis obtained by laboratory X-ray powder diffraction experiments. This analysis yielded the space group P 63/mmc and the lattice parameters a = b = 2.4624(3) Å and c = 6.7081(2) Å. As expected for Bragg–Brentano geometry, the preferred orientation of (002) must be applied too for a significant improvement of the refinement. In addition to graphite, and VPP, β-VO(PO3)2 was the best matching phase to decrease the Rwp value during phase analysis (for an example case, see Figure 2), and therefore was included in all subsequent refinements.
Figure 2 shows as an example the contribution of VPP to the diffraction pattern of catalyst C. Single crystal diffraction was conducted to confirm the literature structural models and to have an ideal reference structure for further defect and microstructure property discussions. The acentric space group Pca21, which is widely accepted in the literature, was used for a subsequent crystal structure refinement since it showed a very good agreement with the analyzed single-crystal diffraction data using the CrysAlis Pro software. The resulting R1 of 0.0402 for the refinement indicates a high degree of agreement between the calculated crystal structure model and measured data. The unit cell dimensions from the structure refinement using SHELXL can be found in Table 2, along with published data from Pearson’s crystallographic and ICSD databases. The refined unit cell has a volume of 1230.05(5) Å3, a density of 3.324 , and an absorption coefficient of 3.585. These values are in good accordance with the literature [19]; with these refined values, our own structure model can be used for the following full profile analysis approaches.
Considering the main phase of vanadyl pyrophosphate, discrepancies between measured and calculated data can be observed especially for the (111) reflection as shown in Figure 1. The measured data show strong reflex broadening compared to the calculated VPP diffraction pattern. Differences in integrated intensities, shifts, and profiles of the (012), (020), (200), (024), and (032) reflections are prominent and need to be understood for real structure analysis. The significant reflex broadening could, in principle, arise from crystal imperfections or from overlapping with reflections from another phase.
To prove the latter hypothesis, powder X-ray diffraction experiments with a much higher resolution than that of the laboratory XRD were conducted at the beamline P02, PETRAIII, DESY Hamburg, with two of the four catalysts. X-ray diffraction at the synchroton confirmed that the extensive reflection broadening of the (111) reflex of VPP is real and does not stem from overlapping reflections. Further information on the measurements carried out at the synchrotron and are to be published separately. Because the broadening of reflections, especially the (111) reflection, was confirmed, different full profile fitting strategies assuming certain microstructural properties have been tested in the following in order to find the root cause of the mismatch between the calculated and measured diffraction patterns.
2.2.2. Refinement with Isotropic Particle Size Effect
In a first attempt to minimize the discrepancies between calculated and measured data, small crystallite sizes were assumed. The term crystallite size, hereinafter, shall refer to the size of coherently scattering domains. Rietveld refinements showed that an isotropic crystallite size of 10 nm results in high accordance with the measured and simulated curve for the (111) reflection. Unfortunately, it also leads also to an extensive reflex broadening of all other reflections, and, therefore, to a decrease in the overall quality of the simulation. Isotropic crystallite size effects, thus, can be ruled out as being the reason for the peak broadening.
2.2.3. Refinement with Anisotropic Particle Size Effect
The next attempt to improve the refinement was to assume anisotropic crystallite sizes. In their publication, Ectors et al. [25] have discussed three different geometrical shapes to calculate the apparent crystallite size: a triaxial ellipsoid (model 1), an elliptic cylinder (model 2), and a cuboid (model 3). In the present work, it could unambiguously be shown that the anisotropic crystallite size simulation reduced the mismatch between calculated and measured diffraction patterns, especially with respect to the (012), (020), (200), (024), and (032) reflections. The calculations also proved that a crystal model based on a cuboid shape (model 3) yielded the best results for the VPO catalysts. A summary of the resulting main dimensions, based on the three considered geometrical shapes, as well as the corresponding Rwp values, are given in Table 3.
Still, the implementation of the best anisotropic crystallite size model did not improve the mismatch between measured and calculated diffraction patterns for the (111) reflection. Thus, further crystal imperfections must be present in the real structure of VPO catalysts in addition to the anisotropic crystallite size.
2.2.4. Refinement with Stacking Faults
To estimate the contribution of stacking fault parameters on the calculated powder diffraction patterns alone and, hence, the corresponding Rwp value, the optimized anisotropic crystallite size parameters were kept fixed as evaluated in the refinement step before. To screen how the presence of ab- as well as bc-stacking faults in VPP will impact the quality of the full profile simulation, the stacking-fault probability, pa, was systematically varied from 0.1 to 0.9 in steps of 0.1 for different displacements between 0.1 and 0.9 unit cell lengths in each direction. Details on the implementation of stacking faults with TOPAS 6 and the corresponding stacking fault nomenclature can be found in Section 4.4.
The ab-fault investigation gave the clear minimum Rwp-value of 7.101 of all the combinations tested and it was found for a displacement of x = 0.5 in the a (0.5[100](110)) direction with a probability of pa = 0.7. The lowest Rwp-value of 7.813 was achieved for ab-faults with a displacement in the b direction of x = 0.6 and a probability of 0.9. A Rietveld refinement with simultaneous displacements in both directions was performed too, but it did not result in improvements of the Rwp values. Such stacking defaults were discarded accordingly.
Analyzing bc-stacking faults in detail, clearly lower Rwp-values were found for displacements in the c direction as compared to those in the b direction. Displacements in b direction, hence, were disregarded. Of all displacements in c direction, that with a displacement vector of x = 0.5 (0.5 [001](011)) showed the lowest Rwp-value. Investigating the probabilities of stacking faults, both probabilities, pa = 0.8 and 0.9, showed almost identical low Rwp-values of 6.228 and 6.246, respectively. However, a closer look at simulated diffraction patterns compared to the experimental data reveals that the fault probability of 0.8 results in a decreased match between the calculated and measured (111) reflex profile, even though the overall Rwp-value is slightly lower. The lowest reached an Rwp value of 6.931 achieved for a bc-fault with a displacement in the b direction was found for a displacement of x = 0.4 at a probability of pa = 0.9 and is, therefore, higher than the lowest reached Rwp value for bc-faults with a displacement in the c direction. Correspondingly, among all tested combinations for bc-stacking faults with respect to displacements x and probabilities pa, the best Rwp value was found for a displacement of 0.5 in the c direction and a probability of 0.9.
After the stacking fault probability of pa = 0.9 was identified to fit best, it was simulated more precisely in steps of 0.01 in the attempt to more precisely identify differences in stacking fault probabilities between the investigated catalysts. For an unbiased analysis, combinations of both ab- and bc-faulted structures were investigated again in one given refinement calculation. To this end, stacking fault parameters, which yielded the lowest Rwp values for the single ab- and bc-fault simulations were chosen and two differently disordered VPP structures were included in one refinement. However, such combinations of ab- and bc-faults did not result in improved refinements with lower Rwp values than the bc-fault simulation alone.
In summary, it can be concluded from the detailed simulations of the different stacking faults that the experimental diffraction patterns can be calculated best by a real crystal structure of VPP with the presence of bc-stacking faults that have a displacement in the c direction of 0.5 and a probability, pa, between 0.90 and 0.94. The results of the full profile Rietveld refinements of all samples are summarized in Table 4. Figure 2 shows an example of the good accordance between measured and calculated diffraction pattern of catalyst C.
Table 5 summarizes the achieved improvements during the stepwise Rietveld refinements of the VPO real structure, as described in the sections above including the refinement attempts using an isotropic crystallite size, anisotropic crystallite size, ab-stacking faults, and bc-stacking faults.
3. Discussion
It was found that the XRD patterns collected after the catalytic test show clear differences with respect to their Bragg reflection positions, intensities, and shapes. Since corresponding catalysts show varying catalytic properties, there might be a valuable connection. Thus, the XRD data collected after the catalytic test can be used to elaborate possible correlations between the phase contents, the crystal imperfections, and the catalytic properties of the material.
In general, the structure–performance correlation analysis included the comparison of the material properties given in Table 4, such as anisotropic crystallite size parameters of VPP rx, ry, rz, and the calculated phase contents of VPP and β-VO(PO3)2 with the normalized activity and selectivity of the sample catalysts A–D as shown in Table 1. The stacking fault probability pa was found almost identical for all samples, this parameter does not appear appropriate for a correlational analysis. These structure performance investigations shall be discussed in the following paragraph.
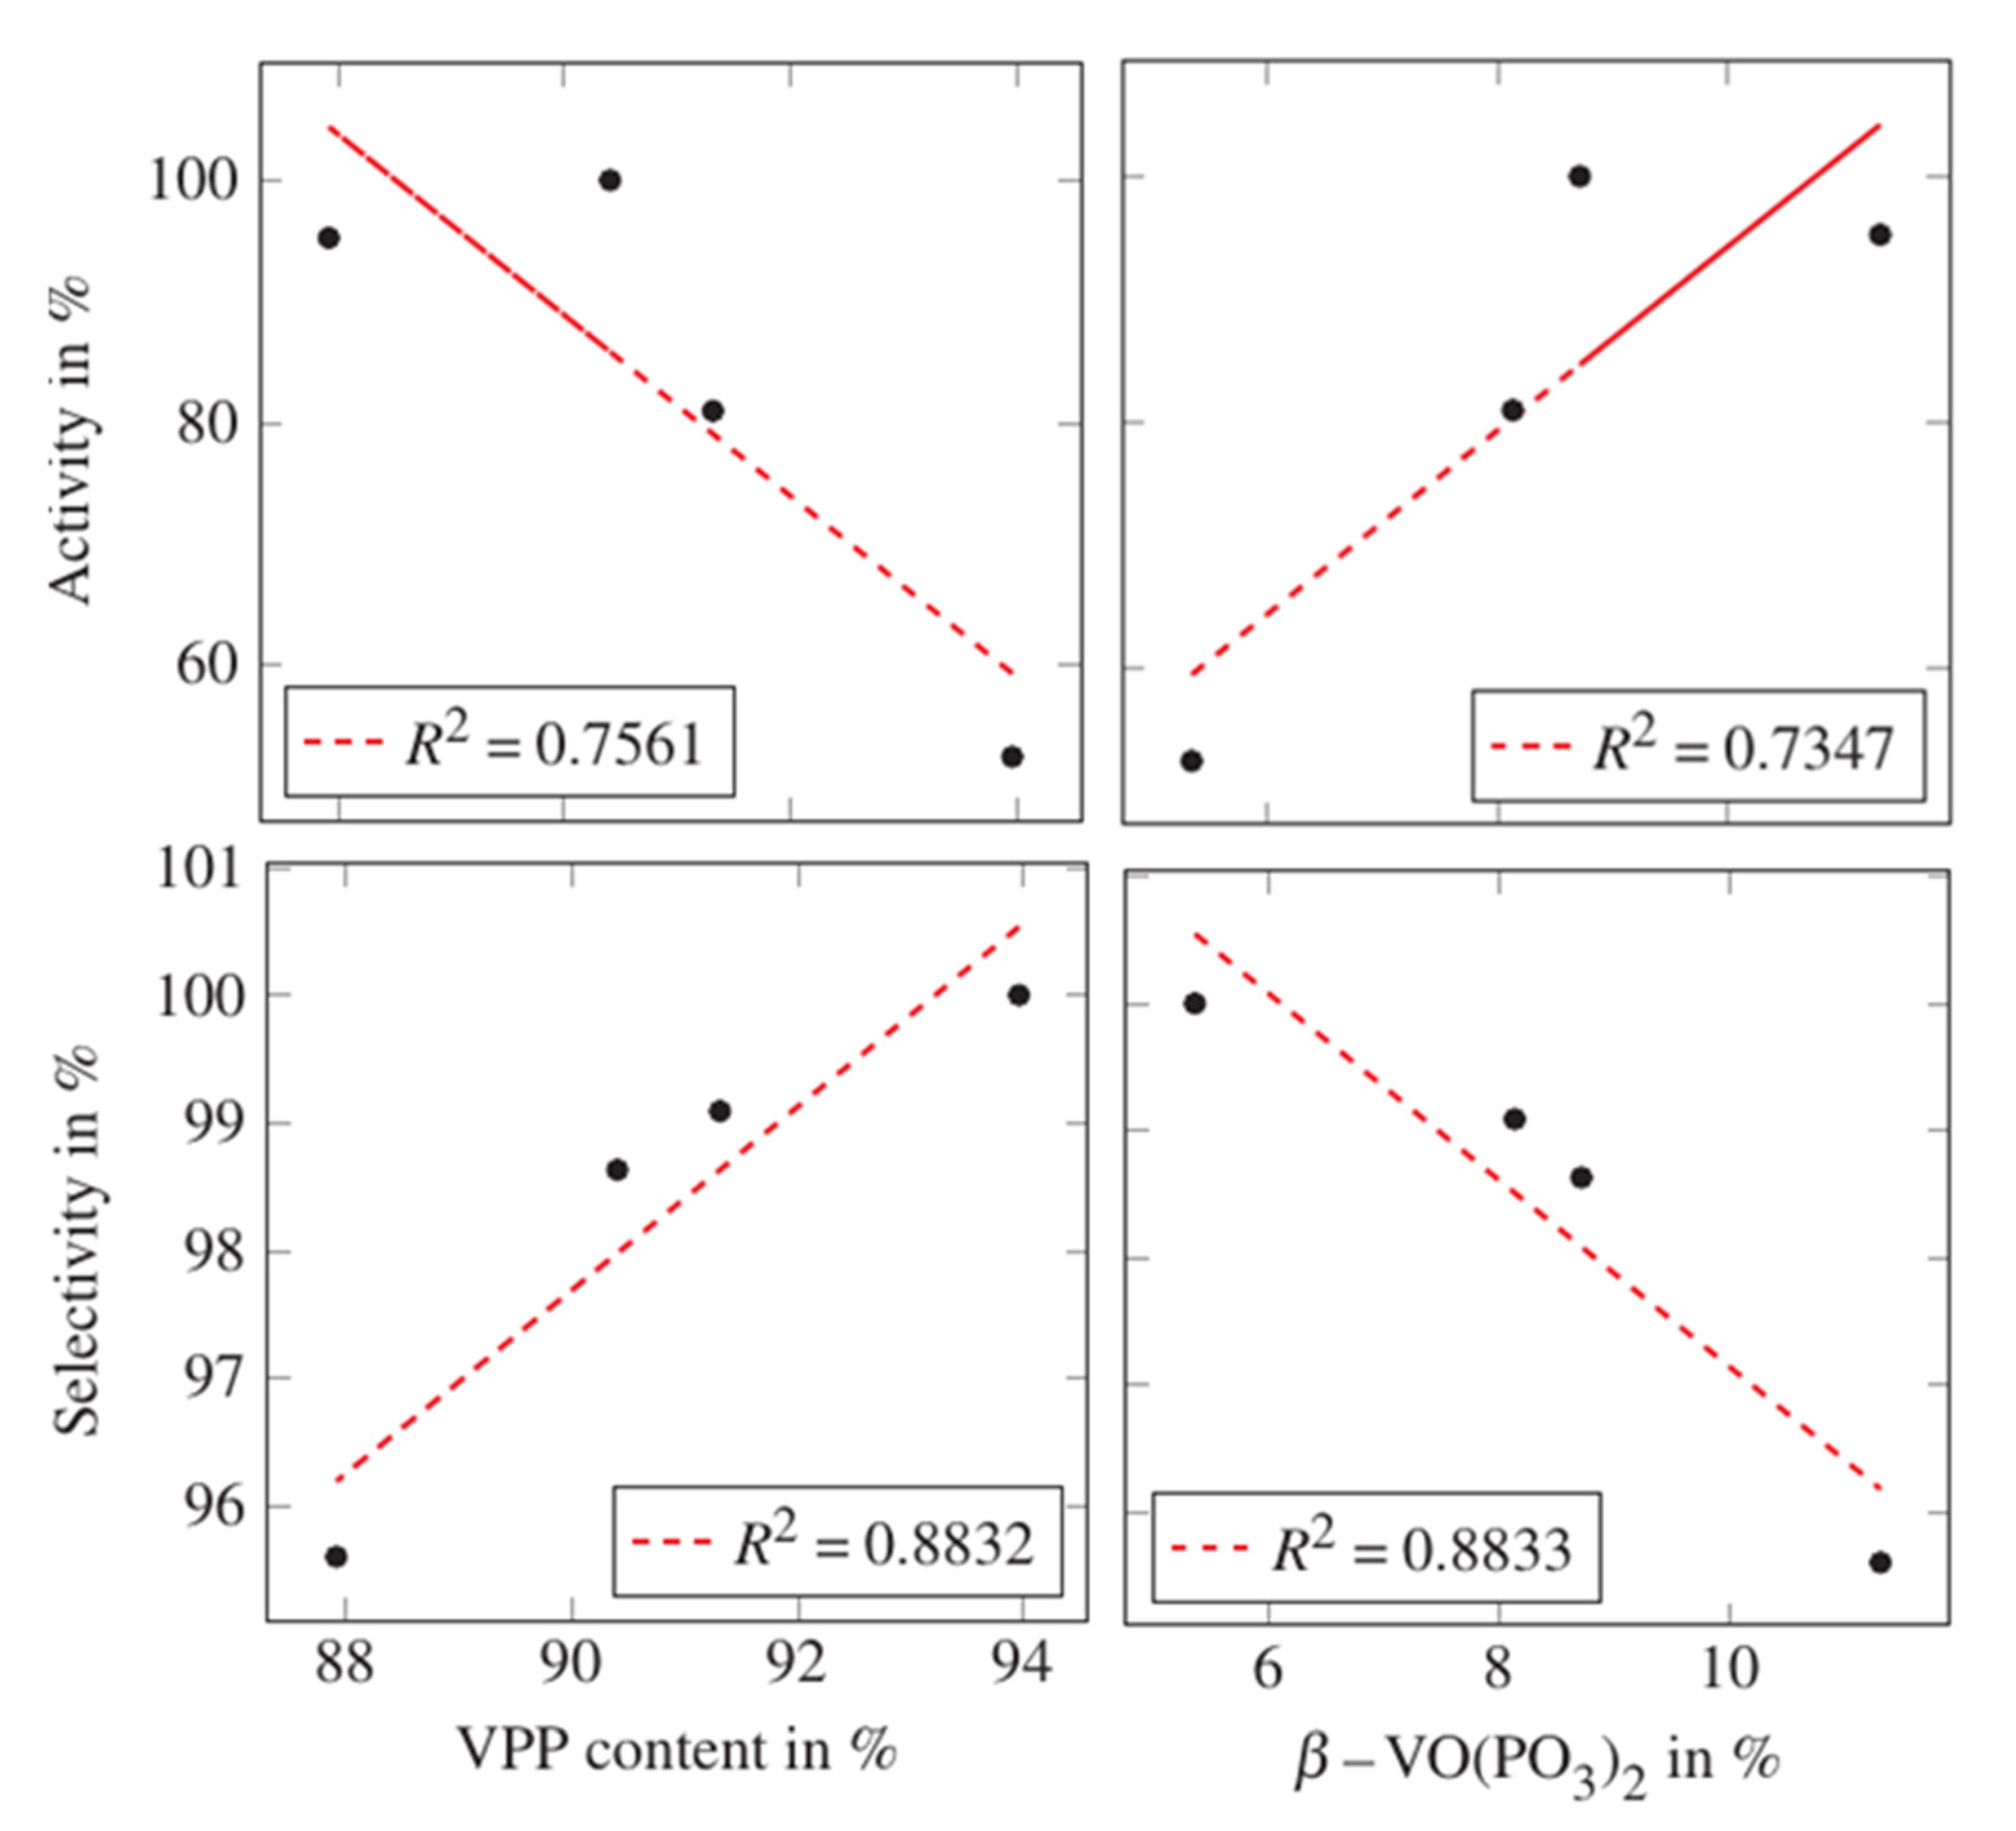
As was expected, the main constituent of the sample catalysts A–D after the catalytic test is VPP. Additionally, all samples contained varying amounts of β-VO(PO3)2. Reasonable structure–performance correlations could be found with respect to the calculated phase contents of VPP and β-VO(PO3)2 as shown in Figure 3.
While a low VPP content and, consequently, a high β-VO(PO3)2 content results in a high activity, the opposite applies to selectivity. That β-VO(PO3)2 shows a poor selectivity for maleic anhydride concurs with the results that have been published by Sithamparappillai et al. [10]. The findings of Hannour et al. [11], that β-VO(PO3)2 leads to catalysts with low activity, since this phase might lead to a decrease in surface area, cannot be supported by the present results.
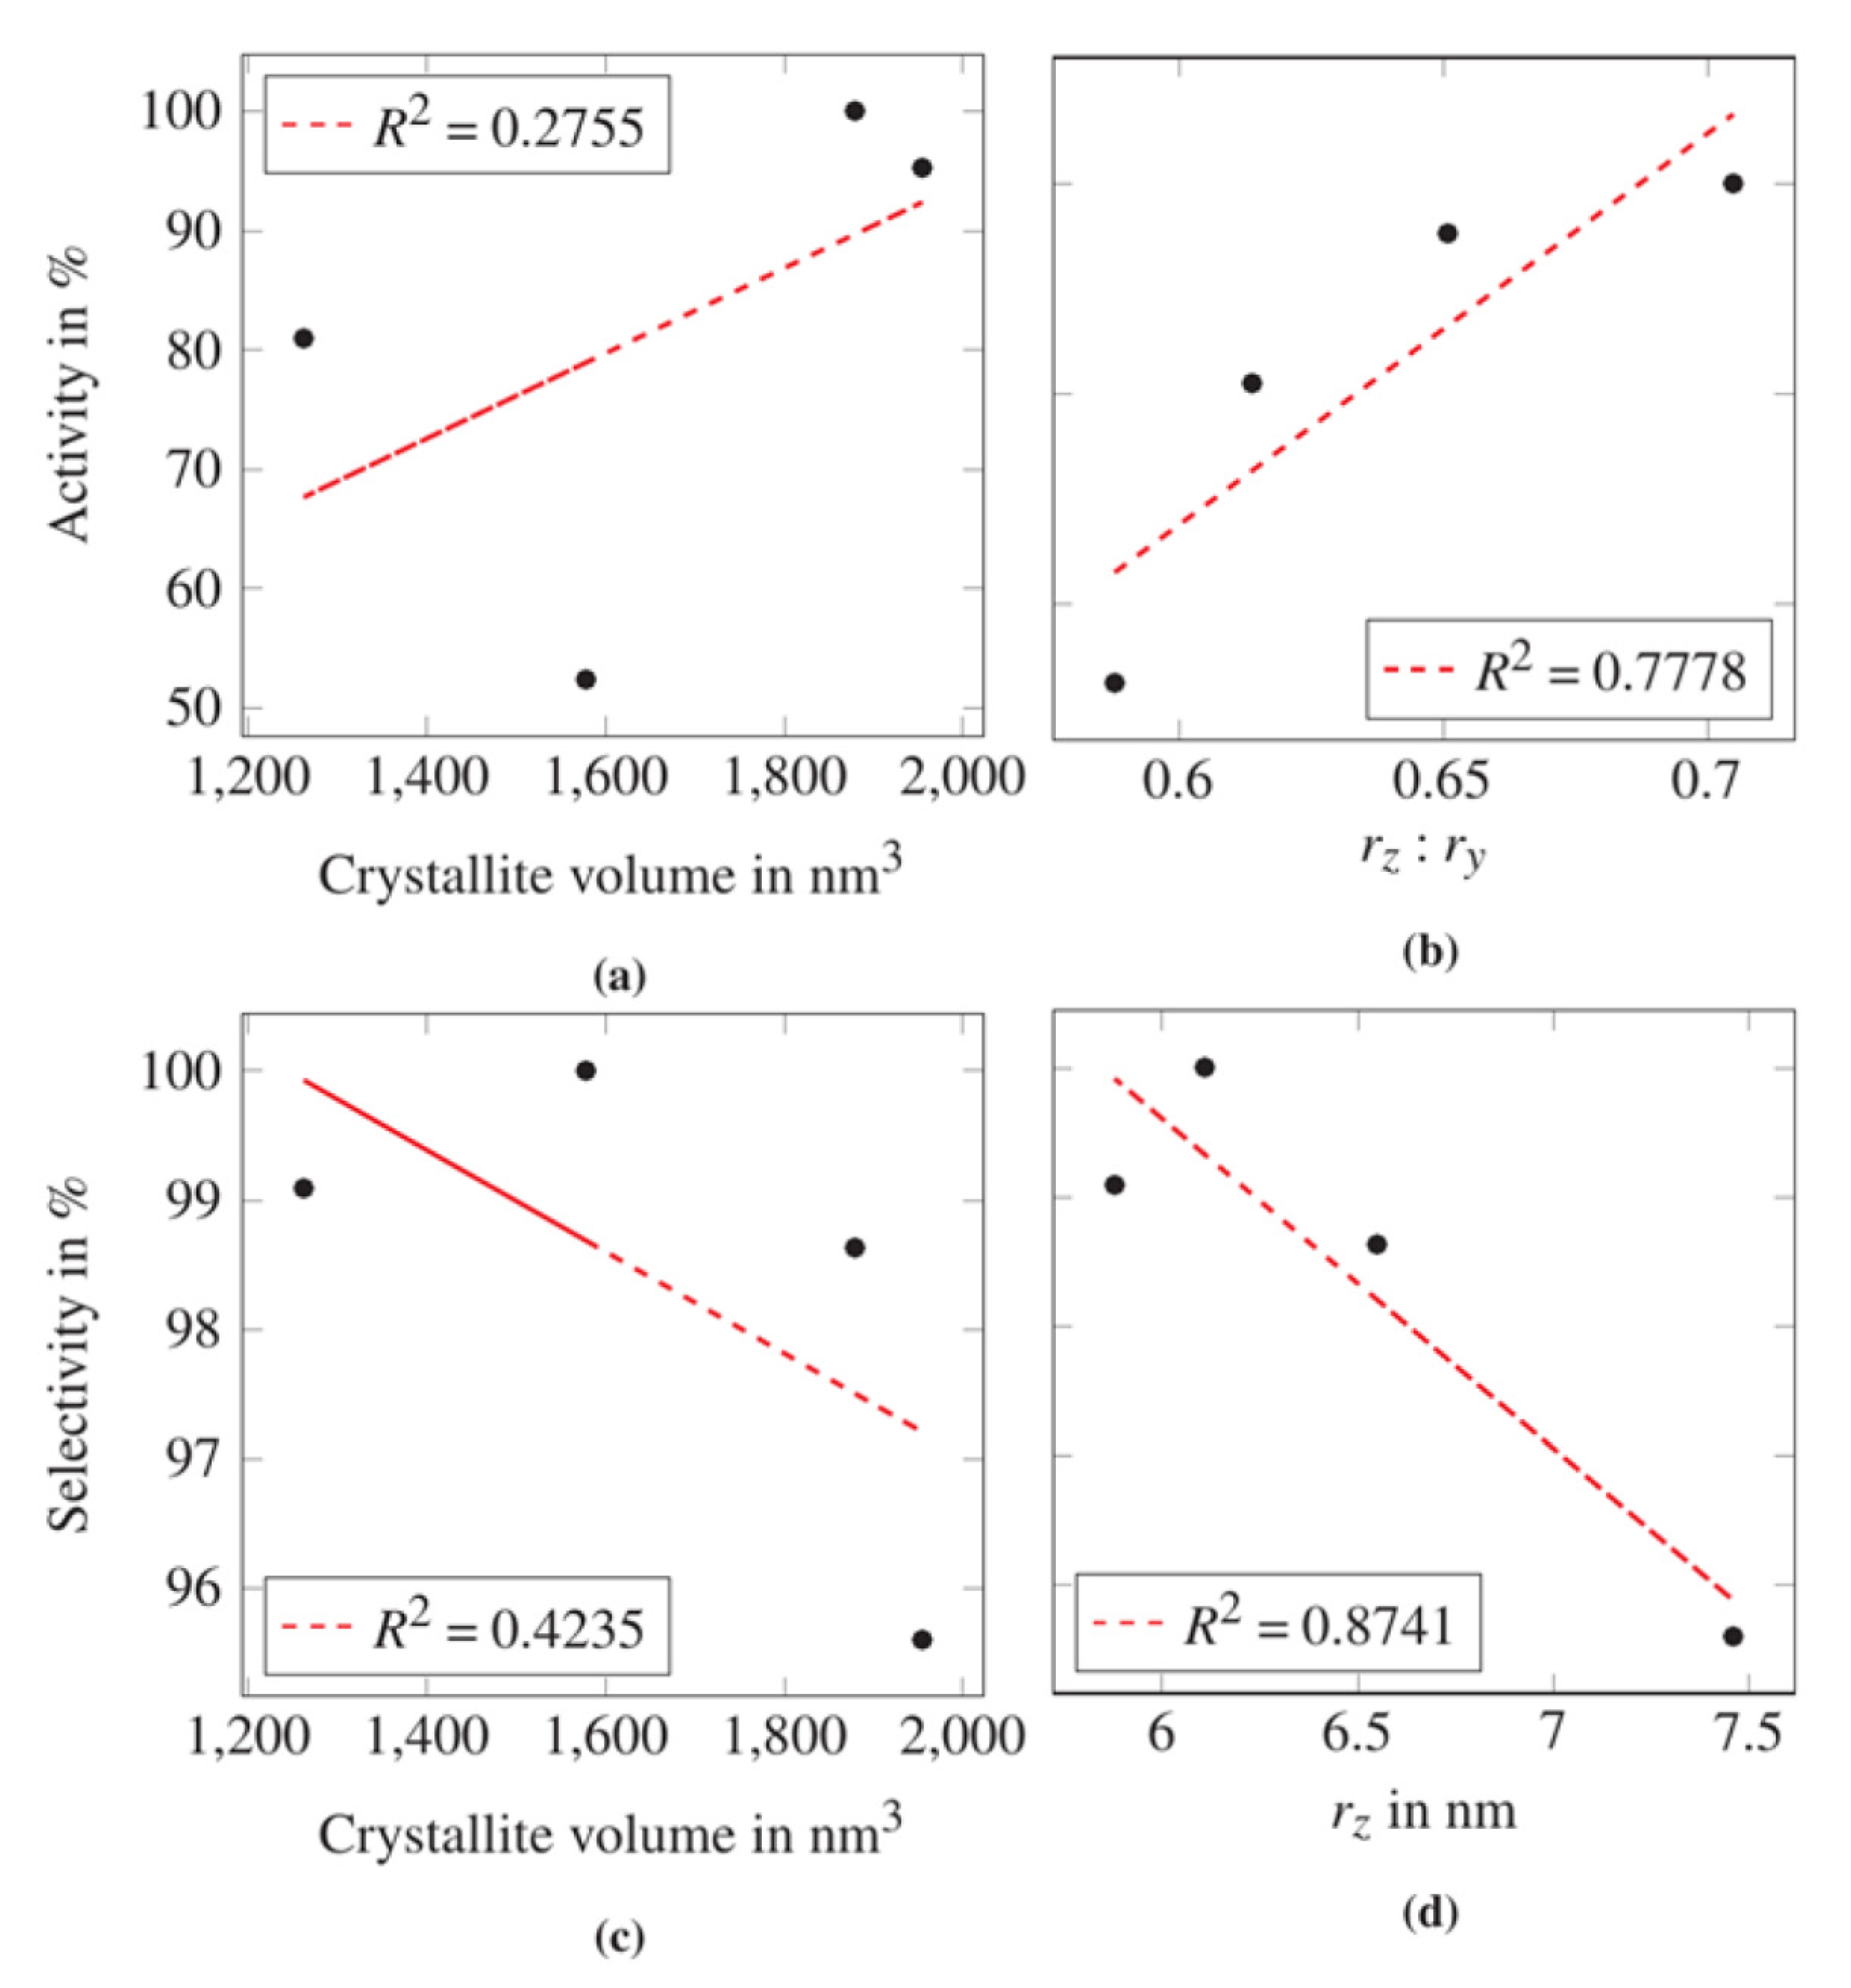
It is frequently discussed if the size of coherently scattering domains and/or the presence of crystal imperfections correlates with a catalyst’s performance. Such a question requires an accurate quantitative analysis of the real structure of the crystalline catalyst phases. As a first step, a correlational analysis of the total volume of the coherently scattering domains in VPP after the catalytic test was evaluated. For this purpose, the anisotropic crystal volume was calculated from the main radii rx, ry, and rz. A cuboid shape was assumed, resembling the description of Ectors et al. [25]. Figure 4a,c shows the comparison of the calculated volumes with both activity and selectivity of the catalyst samples A–D.
Figure 4a,c shows that there is only a poor linear correlation between the volume of coherently scattering domains in VPP after the catalytic test and the catalysts’ activity and selectivity, respectively. Still, it appears that catalysts with rather big crystallite volumes tend to show a higher activity and the opposite applies to catalysts showing a high selectivity.
To identify possible correlations between the anisotropic crystallite sizes and catalyst performances, each of the main radii rx, ry, rz of the coherently scattering domains of VPP was analyzed regarding its impact on the normalized selectivity and activity of the corresponding catalysts. As Figure 4d shows, a good coefficient of determination was found for the absolute values of rz and the catalysts’ selectivity. The catalysts’ selectivity seems to increase with decreasing values of rz. Consequently, it appears that flat crystallites positively influence the selectivity of the VPO catalyst. A direct correlation between the directions rx and ry and catalysts performance could not be observed.
While the absolute height rz impacts the catalysts´ selectivity, the crystal shape may also have an influence. An analysis of the anisotropic size ratios yielded interesting results: Even though the catalysts’ activity does not seem to be influenced by the absolute values of the anisotropic coherently scattering domain sizes, a correlation between the shape of the coherently scattering domains and the activity seems to exist. Figure 4b shows that a rising ratio of rz to ry is related to an increase of the catalysts’ activity. Thus, there appears to be a relation between the real crystallographic structure of industrial VPP catalysts and their activities and selectivities.
This detailed XRD study of differently activated, fully equilibrated industrial MA catalysts revealing relations between the real structure of the catalysts and their activity and selectivity needs to be understood and discussed in the context of two recently published studies on spent industrial VPP catalyst after 4 years of operation [26,27]. Ihli et al. applied scanning X-ray diffraction combined with spatially resolved elemental analysis to investigate how the long-term reactor operation changed the structure of the commercial porous catalyst pellets [27]. They examined a fresh, and two catalyst pellets from two different zones in an industrial reactor after 4 years of operation. One catalyst was from the reactor hotspot, the other one from a zone closer to the reactor exit where the catalyst experienced much lower temperatures. The use of scanning X-ray diffraction combined with spatially resolved elemental analysis with a resolution of 4 × 4 μm² revealed how drastically the location of a catalyst pellet in an industrial reactor and hence the intensity of its use changed its elemental and, hence, phase composition, as well as its textural integrity, e.g., different ratios of VPP and VOPO4 certainly affecting the overall catalyst performance in light of the presented study. Gao et al. used a newly developed sparsity technique combined with NEXAFS, and ptychographic X-ray computed nanotomography to investigate the changes of industrial VPP catalysts from different zones in an industrial reactor upon long-term industrial use as compared to the pristine material with a full-period resolution of sub–60 nm [28]. The authors discussed that the highly stable, long-term catalyst productivity was completely unexpected in terms of surface area or the presence of active phases but derived from a significantly increased density and accessibility of active sites on vanadyl-deficient as well as crystalline VPP crystallites. In addition, the authors identified unsaturated P=O bonds which might contribute to the catalyst’s productivity.
4. Materials and Methods
4.1. Bench-Scale Performance Test
The samples were tested in a fixed-bed bench-scale reactor under constant feed composition. Residence times were modified. The reactor consisted of 21 mm reaction tubes in a molten salt bath for heating/cooling purposes. The salt bath temperature (SBT), monitored by thermocouples (type K), was kept between 410 and 430 °C. The actual temperatures of the catalyst beds were registered with centered eightfold multipoint thermocouples. The reactor inlet and outlet were analyzed by an IR detector for n-butane, CO, and CO2 (Emerson NGA 2000 MLT 2) and a GC (Agilent 6850 GC with JAS Unis 500 inlet system). About 35 g of the VPO catalyst rings was diluted with inert rings at a mass ratio of about 1:9 to avoid the development of hotspots in the approximately 920 mm long catalyst bed. For performance tests, the feed compositions were kept constant at 1.5 vol% n-butane (Air Liquide, ≥99.0 vol%) in air at ambient pressure; no additional organic phosphorous moderator nor steam was fed. To warrant comparable modified residence times (τmod) during testing, gas flows at the inlets were adjusted according to the slightly varying catalyst mass in the tubes.
The test program consisted of an equilibration phase at 430 °C, and a GHSVm of 2500 L/kg/h for 42 h, followed by a variation of eight different GHSVm values at 410 °C. From the performance test data, conversion levels of n-butane were calculated, as well as the molar yields and selectivities for the product and by-products. Conversion, X, molar selectivities, S, and yields, Y, were calculated from the molar flows as derived from IR and GC data.
4.2. Single Crystal Diffraction
A fragment of the vanadyl pyrophosphate single crystal was fixed via a glass thread to the goniometer head. The goniometer head was then very carefully mounted to the Rigaku Oxford Gemini A Ultra 4-circle kappa single crystal diffractometer. Afterwards, the crystal was centered. The X-ray source was run at 40 kV and 40 mA. The measurement was conducted at room temperature with a molybdenum radiation source and a resulting wavelength of 0.71073 Å. The diffractometer was equipped with a 0.8 mm collimator and an Atlas CCD detector, which was connected to the Rigaku data collection and processing software CrysAlis Pro. The measurement took approximately 18 h for 11 runs with different angles for omega scans.
4.3. Powder Crystal Diffraction
For this publication, four powdered SynDane® catalyst samples were analyzed by X-ray diffraction experiments after they had been catalytically tested. Therefore, the powdered catalyst sample had to be pressed into the sample holder showing an even surface. Laboratory-scale X-ray powder diffraction experiments were conducted with a Bruker D4 Endeavor powder diffractometer. The diffractometer was connected to a Lynxeye detector and equipped with a copper radiation source (λ = 1.5406 Å) without a monochromator. Experiments were conducted in the range of 5–50° of 2θ with a steps size of 0.02° for 2θ at room temperature. The device ran at 40 kV and samples were rotated with 30 r/s during measurements. Two catalyst powder samples (A and B) were analyzed at the powder diffraction beamline P02.1 at PetraIII, DESY. Powder diffraction experiments were conducted at room temperature in Debye-Scherrer geometry on a 3-circle Huber diffractometer in the range of 0.8–10° 2θ with a 2θ resolution of 0.005°. The source of synchrotron radiation was a U23 undulator. The resulting radiation source had a wavelength of λ = 0.2071 Å (60 kV). The diffractometer was connected to a Perkin Elmer XRD1621 (200 × 200 µm2 pixels) detector. The sample detector distance was 2000 mm. Powder samples were prepared in a glass capillary with an outer diameter of 1 mm.
For this investigation, VESTA version 3.3.0 was used for the 3D visualization of structural models, volumetric data, and crystal morphologies [29]. CrysAlis Pro from Rigaku is designed for single-crystal X-ray diffraction data collection and reduction [30]. SHELXL was used for VPP single-crystal refinement [31]. A full profile refinement of data obtained by laboratory-scale X-ray powder diffraction experiments and stacking fault simulation was conducted using TOPAS Version 6 from Bruker [28].
4.4. Stacking Fault Simulation
Layered structures are known to easily form stacking faults, i.e., planar disorder in a lattice plane due to a slight shift of identical sequentially stacked layers. The following nomenclature shall be defined to avoid ambiguities. To create disorder in the stacking of the ab planes along the c direction in VPP, the elemental cell can be shifted in either a, b, or both directions simultaneously as compared to the ideal stacking sequence. The displacement vector x in each direction will be given as a fraction of the corresponding unit cell dimension. For instance, a stacking fault characterized by a disorder in the ab plane caused by the displacement of a layer shifted by 1/3 in the a direction will be named by 1/3 [100](110). The same principle also applies to the description of the disorder in the ac, and bc planes (see Figure 5).
Besides the type of planar defects, also their densities or concentrations must be considered in a full profile analysis [32]. In the first step, two layers were defined as VPP unit cells which will be shifted with respect to each other, according to a given transition matrix. The number of layers, Nv, as well as the number of differently generated structures, Nstr, for the generated stacking sequence, or supercell, were defined. Moreover, the probability, pa, to observe an ideal stacking within the defined number of layers had to be set [31]. Accordingly, the probability to observe a stacking fault was determined by pa-1.
5. Conclusions
This study aimed at the understanding of industrial VPO catalysts, especially with respect to their real structures. Therefore, a series of differently activated catalysts was prepared, and performance tested after their complete equilibration. Decisive differences in the performances of the equilibrated catalysts were induced by the changed activation procedures. Since significant reflection broadening especially of the (111) reflection of VPP was found in the X-ray diffraction patterns, the contribution of crystal imperfections, such as defects and size and strain effects was evaluated with respect to catalytic performance.
The main effect contributing to the broadening of the (111) reflection of VPP is due to small, clearly anisotropic crystallite sizes, giving the best fit quality by assuming a cuboid shape model. The remaining reflection broadening, not attributed to anisotropic nature, could be simulated by stacking faults perpendicular to the a direction in VPP.
High activity in n-butane conversion is related to catalysts containing higher amounts of β-VO(PO3)2. However, an increase in β-VO(PO3)2 above 8.72% does not lead to a further improvement in the activity and overall catalytic performance. This is because higher amounts of VPP and low amounts of β-VO(PO3)2, accordingly, result in a high MA selectivity. An increasing ratio of rz:ry of the VPP crystallites also correlates with high catalytic activity. In addition, the selectivity also correlates with the absolute value of rz of the VPP crystallites. Highly selective catalysts show smaller absolute values of rz and, therefore, have a more flattened crystallite morphology. In other words, the crystallite shape as a proxy parameter of the structure of the real active centers seems to be decisive for the catalytic performance.
In summary, even decade-old, fully optimized industrial mixed metal oxide catalysts, such as the present VPP catalyst, are not yet fully understood at a reasonable atomic level. Further detailed studies are needed exploiting all the new, highly exciting spatially and temporally resolved spectromicroscopic techniques on real-world, industrial catalysts. It is obvious that the catalytic performance developing in operation is intertwined with changing structural and textural properties on all length scales, which themselves are also changing, as function a of location in the industrial reactor and with time on stream.
Author Contributions
Conceptualization, G.M. and S.B.; methodology, S.B. and W.W.S.; validation, S.B., G.M. and W.W.S.; investigation, I.K., M.W. and S.P.; resources, G.M.; writing—original draft preparation, I.K., S.B. and G.M.; writing—review and editing, I.K., S.B., W.W.S. and G.M.; visualization, I.K. and S.B.; supervision, S.B., W.W.S. and G.M.; project administration, S.B. and G.M. All authors have read and agreed to the published version of the manuscript.
Funding
This research received no external funding.
Acknowledgments
The vanadyl pyrophosphate single crystal was kindly provided by Andrej Prokofiev from the University of Vienna. Clariant AG is gratefully acknowledged for providing the opportunity to execute this study.
Conflicts of Interest
The authors declare no conflict of interest.
References
- Centi, G.; Trifiro, F.; Ebner, J.R.; Franchetti, V.M. Mechanistic aspects of maleic anhydride synthesis from C4 hydrocarbons over phosphorus vanadium oxide. Chem. Rev. 1988, 88, 55–80. [Google Scholar] [CrossRef]
- Lesser, D.; Mestl, G.; Turek, T. Transient behavior of vanadyl pyrophosphate catalysts during the partial oxidation of n-butane in industrial-sized, fixed bed reactors. Appl. Catal. A Gen. 2016, 510, 1–10. [Google Scholar] [CrossRef]
- Nguyen, P.; Sleight, A.; Roberts, N.; Warren, W. Modeling of extended defects in the vanadium phosphate catalyst for butane oxidation, (VO)2P2O7. J. Solid State Chem. 1996, 122, 259–265. [Google Scholar] [CrossRef]
- van Smaalen, S.; Dinnebier, R.; Hanson, J.; Gollwitzer, J.; Büllesfeld, F.; Prokofiev, A.; Assmus, W. High-temperature behavior of vanadyl pyrophosphate (VO)2P2O7. J. Solid State Chem. 2005, 178, 2225–2230. [Google Scholar] [CrossRef]
- Bordes, E.; Courtine, P.; Johnson, J. On the topotactic dehydration of VOHPO4·0.5H2O into vanadyl pyrophosphate. J. Solid State Chem. 1984, 55, 270–279. [Google Scholar] [CrossRef]
- Guliants, V.; Holmes, S.; Benziger, J.; Heaney, P.; Yates, D.; Wachs, I. In situ studies of atomic, nano-and macroscale order during VOHPO4·0.5 H2O transformation to (VO)2P2O7. J. Mol. Catal. A Chem. 2001, 172, 265–276. [Google Scholar] [CrossRef]
- Torardi, C.; Li, Z.; Horowitz, H.; Liang, W.; Whangbo, M.-H. Transformation of VOHPO4·1/2H2O to (VO)2P2O7: Crystallographic, microstructural, and mechanistic aspects. J. Solid State Chem. 1995, 119, 349–358. [Google Scholar] [CrossRef]
- Guliants, V.V.; Carreon, M.A. Vanadium-Phosphorus-Oxides: From Fundamentals of n-Butane Oxidation to Synthesis of New Phases; The Royal Society of Chemistry: Cambridge, UK, 2005. [Google Scholar]
- Weng, W.; Al Otaibi, R.; Alhumaimess, M.; Conte, M.; Bartley, J.K.; Dummer, N.F.; Hutchings, G.J.; Kiely, C.J. Controlling vanadium phosphate catalyst precursor morphology by adding alkane solvents in the reduction step of VOPO4·2H2O to VOHPO4·0.5H2O. J. Mater. Chem. 2011, 21, 16136–16146. [Google Scholar] [CrossRef] [Green Version]
- Sithamparappillai, U.; Nuno, J.L.; Dummer, N.F.; Weng, W.; Kiely, C.J.; Bartley, J.K.; Hutchings, G.J. Effect on the structure and morphology of vanadium phosphates of the addition of alkanes during the alcohol reduction of VOPO4·2H2O. J. Mater. Chem. 2010, 20, 5310–5318. [Google Scholar] [CrossRef] [Green Version]
- Hannour, F.; Martin, A.; Kubias, B.; Lücke, B.; Bordes, E.; Courtine, P. Vanadium phosphorus oxides with P/V = 2 used as oxidation and ammoxidation catalysts. Catal. Today 1998, 40, 263–272. [Google Scholar] [CrossRef]
- Cavani, F.; Luciani, S.; Esposti, E.D.; Cortelli, C.; Leanza, R. Surface Dynamics of A Vanadyl Pyrophosphate Catalyst for n-Butane Oxidation to Maleic Anhydride: An In Situ Raman and Reactivity Study of the Effect of the P/V Atomic Ratio. Chem. Eur. J. 2010, 16, 1646–1655. [Google Scholar] [CrossRef] [PubMed]
- Cavani, F.; De Santi, D.; Luciani, S.; Löfberg, A.; Bordes-Richard, E.; Cortelli, C.; Leanza, R. Transient reactivity of vanadyl pyrophosphate, the catalyst for n-butane oxidation to maleic anhydride, in response to in-situ treatments. Appl. Catal. A Gen. 2010, 376, 66–75. [Google Scholar] [CrossRef]
- Böcklein, S.; Mestl, G.; Auras, S.V.; Wintterlin, J. On the correlation of structure and catalytic performance of VPO catalysts. Top. Catal. 2017, 60, 1682–1697. [Google Scholar] [CrossRef]
- Thompson, D.J.; Fanning, M.; Hodnett, B. Modelling the active sites in vanadyl pyrophosphate. J. Mol. Catal. A Chem. 2003, 198, 125–137. [Google Scholar] [CrossRef]
- Cheng, M.-J.; Goddard, W.A.; Fu, R. The reduction-coupled oxo activation (ROA) mechanism responsible for the catalytic selective activation and functionalization of n-butane to maleic anhydride by vanadium phosphate oxide. Top. Catal. 2014, 57, 1171–1187. [Google Scholar] [CrossRef]
- Gai, P.L.; Kourtakis, K. Solid-state defect mechanism in vanadyl pyrophosphate catalysts: Implications for selective oxidation. Science 1995, 267, 661–663. [Google Scholar] [CrossRef]
- Cotter, T.; Reitzmann, A.; Mestl, G.; Donabauer, G.; Röhrer, S. Alkali Metal-Modified Vanadium-Phosphorus Oxide (VPO) Catalyst. U.S. Patent No. 9,931,618, 3 April 2018. [Google Scholar]
- Hiroi, Z.; Azuma, M.; Fujishiro, Y.; Saito, T.; Takano, M.; Izumi, F.; Kamiyama, T.; Ikeda, T. Structural study of the quantum-spin chain compound (VO)2P2O7. J. Solid State Chem. 1999, 146, 369–379. [Google Scholar] [CrossRef]
- Geupel, S.; Pilz, K.; Smaalen, S.v.; Büllesfeld, F.; Prokofiev, A.; Assmus, W. Synchrotron-radiation study of the two-leg spin-ladder (VO)2P2O7 at 120 K. Acta Crystallogr. Sect. C Cryst. Struct. Commun. 2002, 58, i9–i13. [Google Scholar] [CrossRef] [Green Version]
- Koo, H.-J.; Whangbo, M.-H.; VerNooy, P.D.; Torardi, C.C.; Marshall, W.J. Flux Growth of Vanadyl Pyrophosphate, (VO)P2O7, and Spin Dimer Analysis of the Spin Exchange Interactions of (VO)2P2O7 and Vanadyl Hydrogen Phosphate, VO(HPO4)·0.5H2O. Inorg. Chem. 2002, 41, 4664–4672. [Google Scholar] [CrossRef]
- Saito, T.; Terashima, T.; Azuma, M.; Takano, M.; Goto, T.; Ohta, H.; Utsumi, W.; Bordet, P.; Johnston, D. Single crystal growth of the high pressure phase of (VO)2P2O7 at 3 GPa. J. Solid State Chem. 2000, 153, 124–131. [Google Scholar] [CrossRef]
- Nguyen, P.; Hoffman, R.; Sleight, A. Structure of (VO)2P2O7. Mater. Res. Bull. 1995, 30, 1055–1063. [Google Scholar] [CrossRef]
- Gorbunova, Y.E.; Linde, S. Structure of crystals of vanadyl pyrophosphate (VO)2P2O7. Dokl. Akad. Nauk SSSR 1979, 245, 584–588. [Google Scholar]
- Ectors, D.; Goetz-Neunhoeffer, F.; Neubauer, J. A generalized geometric approach to anisotropic peak broadening due to domain morphology. J. Appl. Crystallogr. 2015, 48, 189–194. [Google Scholar] [CrossRef]
- Gao, Z.; Odstrcil, M.; Böcklein, S.; Palagin, D.; Holler, M.; Sanchez, D.F.; Krumreich, F.; Menzel, A.; Stampanoni, M.; Mestl, G.; et al. Sparse ab initio x-ray transmission spectrotomography for nanoscopic compositional analysis of functional materials. Sci. Adv. 2021, 7, eabf6971. [Google Scholar] [CrossRef] [PubMed]
- Ihli, J.; Bloch, L.; Böcklein, S.; Rzepka, P.; Burghammer, M.; da Silva, J.C.; Mestl, G.; van Bokhoven, J.A. Evolution of Heterogeneity in Industrial Selective Oxidation Catalyst Pellets. ACS Catal. 2021, 11, 8274–8283. [Google Scholar] [CrossRef]
- Coelho, A.A. TOPAS and TOPAS-Academic: An optimization program integrating computer algebra and crystallographic objects written in C++. J. Appl. Crystallogr. 2018, 51, 210–218. [Google Scholar] [CrossRef] [Green Version]
- Momma, K. VESTA, ver. 3.4.6. 27 January 2019. Available online: https://jp-minerals.org/vesta/en/ (accessed on 18 February 2019).
- Rigaku, Matsubara-cho, 3-9-12 Akishima-shi, Tokyo, Japan. CrysAlis Pro. Available online: https://www.rigaku.com/products/crystallography/crysalis (accessed on 18 February 2019).
- Herbst-Irmer, R.; Spek, A.; Schneider, T.; Sawaya, M. Crystal Structure Refinement: A Crystallographer’s Guide to SHELXL; Oxford University Press: Oxford, UK, 2006; Volume 8. [Google Scholar]
- Coelho, A.A.; Evans, J.S.; Lewis, J.W. Averaging the intensity of many-layered structures for accurate stacking-fault analysis using Rietveld refinement. J. Appl. Crystallogr. 2016, 49, 1740–1749. [Google Scholar] [CrossRef] [Green Version]
Figure 1.
X-ray powder diffraction patterns of the catalyst samples (A–D) with increasing catalytic performance measured in the range of 10–50° 2Θ with CuKα radiation. The inset displays the broadening of the VPP (111) reflection of the measured diffractograms and a calculated pattern (dark grey) for comparison.

Figure 2.
Measured (black dots) and calculated (different grey shaded areas) diffraction patterns of the sample catalyst C after the catalytic test. Calculated phase contents yielded: 90.41% (VO)2P2O7 (grey), 8.72% β-VO(PO3)2 (black) and 0.87% graphite (dashed).
Figure 2.
Measured (black dots) and calculated (different grey shaded areas) diffraction patterns of the sample catalyst C after the catalytic test. Calculated phase contents yielded: 90.41% (VO)2P2O7 (grey), 8.72% β-VO(PO3)2 (black) and 0.87% graphite (dashed).

Figure 3.
Correlation plots based on values gained by full profile refinement of XRD data collected after the catalytic test showing the correlation between the catalysts’ normalized activity and selectivity and the phase contents of VPP and β-VO(PO3)2. The broken red line is the calculated linear regression line with R2 being the corresponding coefficient of determination.

Figure 4.
Correlation plots based on values gained by full profile refinement of XRD data collected after the catalytic test showing the correlation between the (a) catalysts’ normalized activity and the volume of coherently scattering domains, (b) catalysts’ normalized activity and the ratio of rz to ry, (c) catalysts’ normalized selectivity and the volume of coherently scattering domains and (d) catalysts’ normalized activity and the absolute value of rz. The broken red line is the calculated linear regression line with R2 as the corresponding coefficient of determination.

Figure 5.
Schematic sketch showing two displacement possibilities of consecutive unit cells in VPP for each ab- and bc-faults.
Figure 5.
Schematic sketch showing two displacement possibilities of consecutive unit cells in VPP for each ab- and bc-faults.


Table 1.
Summary of the varied preparation conditions during the activation process (values are given relative to the values stated in [18]) and of normalized catalytic performance data of the sample catalysts.
Table 1.
Summary of the varied preparation conditions during the activation process (values are given relative to the values stated in [18]) and of normalized catalytic performance data of the sample catalysts.
| Sample | Temperature | Steam Content | Oxygen Content | Normalized Activity [%] | Normalized Selectivity [%] |
|---|---|---|---|---|---|
| A | hot | medium | medium | 95.2 | 95.6 |
| B | medium | low | high | 81.0 | 99.1 |
| C | medium | medium | high | 100.0 | 98.6 |
| D | medium | medium | low | 52.4 | 100.0 |
Table 2.
Comparison of vanadyl pyrophosphate structure models extracted from Pearson’s crystallographic database, ICSD, and own single-crystal X-ray diffraction structure refinement.
Table 2.
Comparison of vanadyl pyrophosphate structure models extracted from Pearson’s crystallographic database, ICSD, and own single-crystal X-ray diffraction structure refinement.
| Publication Pearson’s Crystallographic Database | Space Group | Lattice Parameter a [Å] | Lattice Parameter b [Å] | Lattice Parameter c [Å] |
|---|---|---|---|---|
| [4] | Pca21 | 7.7288 | 9.5787 | 16.5873 |
| [20] | Pca21 | 7.7004 | 9.5777 | 16.5825 |
| [21] | Pca21 | 7.729 | 9.583 | 16.581 |
| [19] | Pca21 | 7.7381 | 9.587 | 16.5895 |
| [22] | Pbcn | 8.362 | 9.536 | 7.571 |
| [23] * | P1211 | 7.7276 | 16.5885 | 9.5796 |
| [24] | Pca21 | 7.725 | 9.572 | 16.576 |
| Publication ICSD Database | ||||
| [20] | Pca21 | 7.7004 | 9.5777 | 16.5825 |
| [21] | Pca21 | 7.729 | 9.583 | 16.581 |
| [19] | Pca21 | 7.73808 | 9.58698 | 16.58949 |
| [23] * | P1211 | 7.7276 | 16.58849 | 9.5796 |
| [24] | Pb21a | 7.725 | 16.5760 | 9.573 |
| Own single crystal structure | Pca21 | 7.7362(2) | 9.5842(2) | 16.5897(4) |
* the β angle of the monoclinic space group is 89.975 Å.
Table 3.
Anisotropic crystallite size refinement values in nanometers.
| rx [nm] | ry [nm] | rz [nm] | Rwp | |
|---|---|---|---|---|
| model 1 | 6.655(8) | 10.652(7) | 5.409(1) | 10.338(1) |
| model 2 | 4.7789(9) | 13.3614(6) | 5.6058(6) | 9.820(8) |
| model 3 | 3.888(4) | 8.9027(7) | 6.354(3) | 9.301(3) |
Table 4.
Summary of the yielded laboratory-scale X-ray powder diffraction results after applying the developed full profile fitting strategy.
Table 4.
Summary of the yielded laboratory-scale X-ray powder diffraction results after applying the developed full profile fitting strategy.
| A | B | C | D | |
|---|---|---|---|---|
| VPP [%] | 87.92 | 91.32 | 90.41 | 94.10 |
| β-VO(PO3)2 [%] | 11.32 | 8.14 | 8.72 | 5.23 |
| Graphite [%] | 0.77 | 0.54 | 0.78 | 0.68 |
| Model | 3 | 3 | 3 | 3 |
| rx [nm] | 2.928(7) | 2.802(5) | 3.870(3) | 3.095(3) |
| ry [nm] | 11.252(4) | 9.576(1) | 9.272(8) | 10.437(7) |
| rz [nm] | 7.527(3) | 5.881(4) | 6.546(4) | 6.085(5) |
| pa [%] | 0.94 | 0.94 | 0.90 | 0.94 |
| Rwp | 6.128 | 5.538 | 5.710 | 5.652 |
Table 5.
Rwp-values of the final full profile fitting on the example of the sample catalyst C depending on the applied refinement strategy.
Table 5.
Rwp-values of the final full profile fitting on the example of the sample catalyst C depending on the applied refinement strategy.
| Refinement Strategy | Rwp Value |
|---|---|
| Isotropic crystallite size (10 nm) | 23.827 |
| Anisotropic crystallite size (mod3) | 9.301 |
| ab-stacking fault | 7.101 |
| bc-stacking fault | 5.710 |
Publisher’s Note: MDPI stays neutral with regard to jurisdictional claims in published maps and institutional affiliations. |
© 2021 by the authors. Licensee MDPI, Basel, Switzerland. This article is an open access article distributed under the terms and conditions of the Creative Commons Attribution (CC BY) license (https://creativecommons.org/licenses/by/4.0/).
Share and Cite
MDPI and ACS Style
Kappel, I.; Böcklein, S.; Park, S.; Wharmby, M.; Mestl, G.; Schmahl, W.W. Crystal Imperfections of Industrial Vanadium Phosphorous Oxide Catalysts. Catalysts 2021, 11, 1325. https://0-doi-org.brum.beds.ac.uk/10.3390/catal11111325
AMA Style
Kappel I, Böcklein S, Park S, Wharmby M, Mestl G, Schmahl WW. Crystal Imperfections of Industrial Vanadium Phosphorous Oxide Catalysts. Catalysts. 2021; 11(11):1325. https://0-doi-org.brum.beds.ac.uk/10.3390/catal11111325
Chicago/Turabian StyleKappel, Isabella, Sebastian Böcklein, SoHyun Park, Michael Wharmby, Gerhard Mestl, and Wolfgang W. Schmahl. 2021. "Crystal Imperfections of Industrial Vanadium Phosphorous Oxide Catalysts" Catalysts 11, no. 11: 1325. https://0-doi-org.brum.beds.ac.uk/10.3390/catal11111325
Note that from the first issue of 2016, this journal uses article numbers instead of page numbers. See further details here.