
Infrared Thermography as an Operando Tool for the Analysis of Catalytic Processes: How to Use it?


1
Urban Energy Systems Laboratory, Swiss Federal Laboratories for Materials Science and Technology (Empa), CH-8600 Dübendorf, Switzerland
2
Thermo-Chemical Processes Group, Energy and Environment Division, Paul Scherrer Institute (PSI), Forschungsstrasse 111, CH-5232 Villigen, Switzerland
*
Author to whom correspondence should be addressed.
†
Equally contributed to this work.
Catalysts 2021, 11(3), 311; https://0-doi-org.brum.beds.ac.uk/10.3390/catal11030311
Submission received: 31 January 2021
/
Revised: 22 February 2021
/
Accepted: 23 February 2021
/
Published: 26 February 2021
(This article belongs to the Special Issue Engineering Materials for Catalysis)
Abstract
:Infrared (IR) thermography is a powerful tool to measure temperature with high space and time resolution. A particularly interesting application of this technology is in the field of catalysis, where the method can provide new insights into dynamic surface reactions. This paper presents guidelines for the development of a reactor cell that can aid in the efficient exploitation of infrared thermography for the investigation of catalytic and other surface reactions. Firstly, the necessary properties of the catalytic reactor are described. Secondly, we analyze the requirements towards the catalytic system to be directly observable by IR thermography. This includes the need for a catalyst that provides a sufficiently high heat production (or absorption) rate. To achieve true operando investigation conditions, some dedicated equipment must be developed. Here, we provide the guidelines to assemble a chemical reactor with an IR transmitting window through which the reaction can be studied with the infrared camera along with other best practice tips to achieve results. Furthermore, we present selected examples of catalytic reactions that can be monitored by IR thermography, showing the potential of the technology in revealing transient and steady state chemical phenomena.
1. Introduction
Over the last decades, operando spectroscopy—i.e., spectroscopy coupled simultaneously with measurements of catalytic activity—significantly improved the knowledge of catalytic systems in industrially relevant conditions [1]. Operando spectroscopy aims at the determination of the variation of a wide range of catalyst properties during chemical reactions, including catalyst structure, oxidation state and reactivity. A particular example of operando spectroscopic tool is infrared (IR) thermography. As a measurement technique, IR thermography operating principle is based on the detection of the IR radiation emitted by every object with a temperature above 0 K [2]. Infrared radiation is typically in the wavelength range of 0.7 (near IR) to 1000 (far IR) micrometers. For thermal measurements the wavelength range of 3 micrometers to 15 micrometers is particularly interesting since a favorable radiance emission is detectable for these wavelength for thermal detection of earth surface emissions, everyday objects and relevant chemical reaction operation temperatures as discussed in the paper. The measured radiation can be directly correlated with the temperature of the object, allowing for a precise and fast determination of the temperature [3]. The methodology is widely employed outside the field of catalysis, for example for the determination of temperature in medical applications or for the analysis of heat losses in buildings [4,5,6]. The main advantages of IR thermography are the relatively high resolution (each pixel fundamentally equals one temperature sensor) and high measurement rate which modern IR cameras offer. Commonly, an IR camera can provide several thousands of data points in its field view, with a measurement frequency of dozens of Hz [7]. In particular, cooled IR cameras can achieve a very high sampling rate (above 100 Hz), while uncooled cameras, although cheaper, can record images with lower frequency [8]. Therefore, the main advantage of IR thermography over other temperature measurements, such as thermocouples and pyrometers, is the high spatial resolution and contactless investigation of reactions [9,10]. Furthermore, the temperature measurement with devices placed inside the reactor (i.e., with thermocouples) inevitably interferes with the experiments [11]. Despite these evident advantages, the examples in literature of systems for the systematic use of IR thermography as an operando tool for the study of chemical reactions are scarce. The main limitation to the development of the technique is related to the need of apposite reactors for this scope. In particular, the installation of an appropriate IR transmitting window in a chemical reactor may be challenging. Significant examples of application of IR thermography as operando method include the study of exothermic reactions, the determination of the temperature rise in structured catalysts and the utilization in high-throughput experimentation [9,12,13,14,15,16,17].
In this paper, we propose a systematic approach to apply IR thermography in operando studies. This kind of systematic experimental layout is currently lacking in literature and therefore we mainly aim at filling this gap in the scientific literature. We offer an overview of the main advantages and limitations of the methodology, showing how the selection of the reaction to investigate and the design of an appropriate experimental setup are interconnected based on the lessons learned from our operando investigation of a heterogeneously catalyzed reaction by means of IR thermography [18]. First, we define the requirements of the IR thermography system and elucidate the main possibilities to manufacture a reaction cell that allow the observation of the reaction without influence of parasitic phenomena. Furthermore, we discuss the selection of a suitable IR transmitting window, which can depend on the camera system selected (detection wavelengths) and the expected reaction conditions. Secondly, we define appropriate methods to systematically extract the significant information from the IR thermography experiments. In particular, we underline some general rules for the selection of the catalytic system, with respect to heat emissions and the reaction phenomena expected. Additionally, we derive some additional considerations about how to handle the experiments and to avoid contamination of the results by side effects (e.g., by mismanagement of the external heating). This involves the selection of appropriate additional analytical tools to correctly integrate the thermal images with concentration profiles and further information concerning the catalyst. Finally, we expose selected experimental case studies to validate the application of the methodology and to elucidate the additional information IR thermography can bring to operando studies. These examples involve the catalytic CO2 hydrogenation to methane, which proved to be an ideal case study for the development of IR thermography as operando tool for the investigation of heterogeneously catalyzed chemical reactions. In fact, the CO2 methanation, or Sabatier reaction, is a highly exothermal reaction following the stoichiometry:
The Sabatier reaction is enabled and kinetically enhanced by different metallic catalysts [19]. Literature reports Ru/Al2O3 at temperatures between 200 and 400 °C as one of the highest performing catalysts in the Sabatier reaction in terms of CO2 conversion and selectivity towards CH4 [20,21,22]. During the activation and steady state operation of the Sabatier reaction, highly localized phenomena can occur. Such phenomena include, for example, rapidly moving reaction hotspots during the reaction activation or heat gradients due to gas concentration and reaction rate differences in steady state operation. In catalysis, reaction hotspots are defined as localized higher temperatures due to excess heat emissions due to localized higher reaction rate at the catalyst surface. IR thermography proved to be a potent method to investigate these phenomena, which would be difficult to identify with the standard temperature measurement devices [23]. The results elucidated here can be compared with several other studies available in literature that applied IR spectroscopy in the analysis of the Sabatier reaction [9,15,17,23,24,25].
2. Design of the Cell for Operando IR Thermography
2.1. Selection of the IR Camera
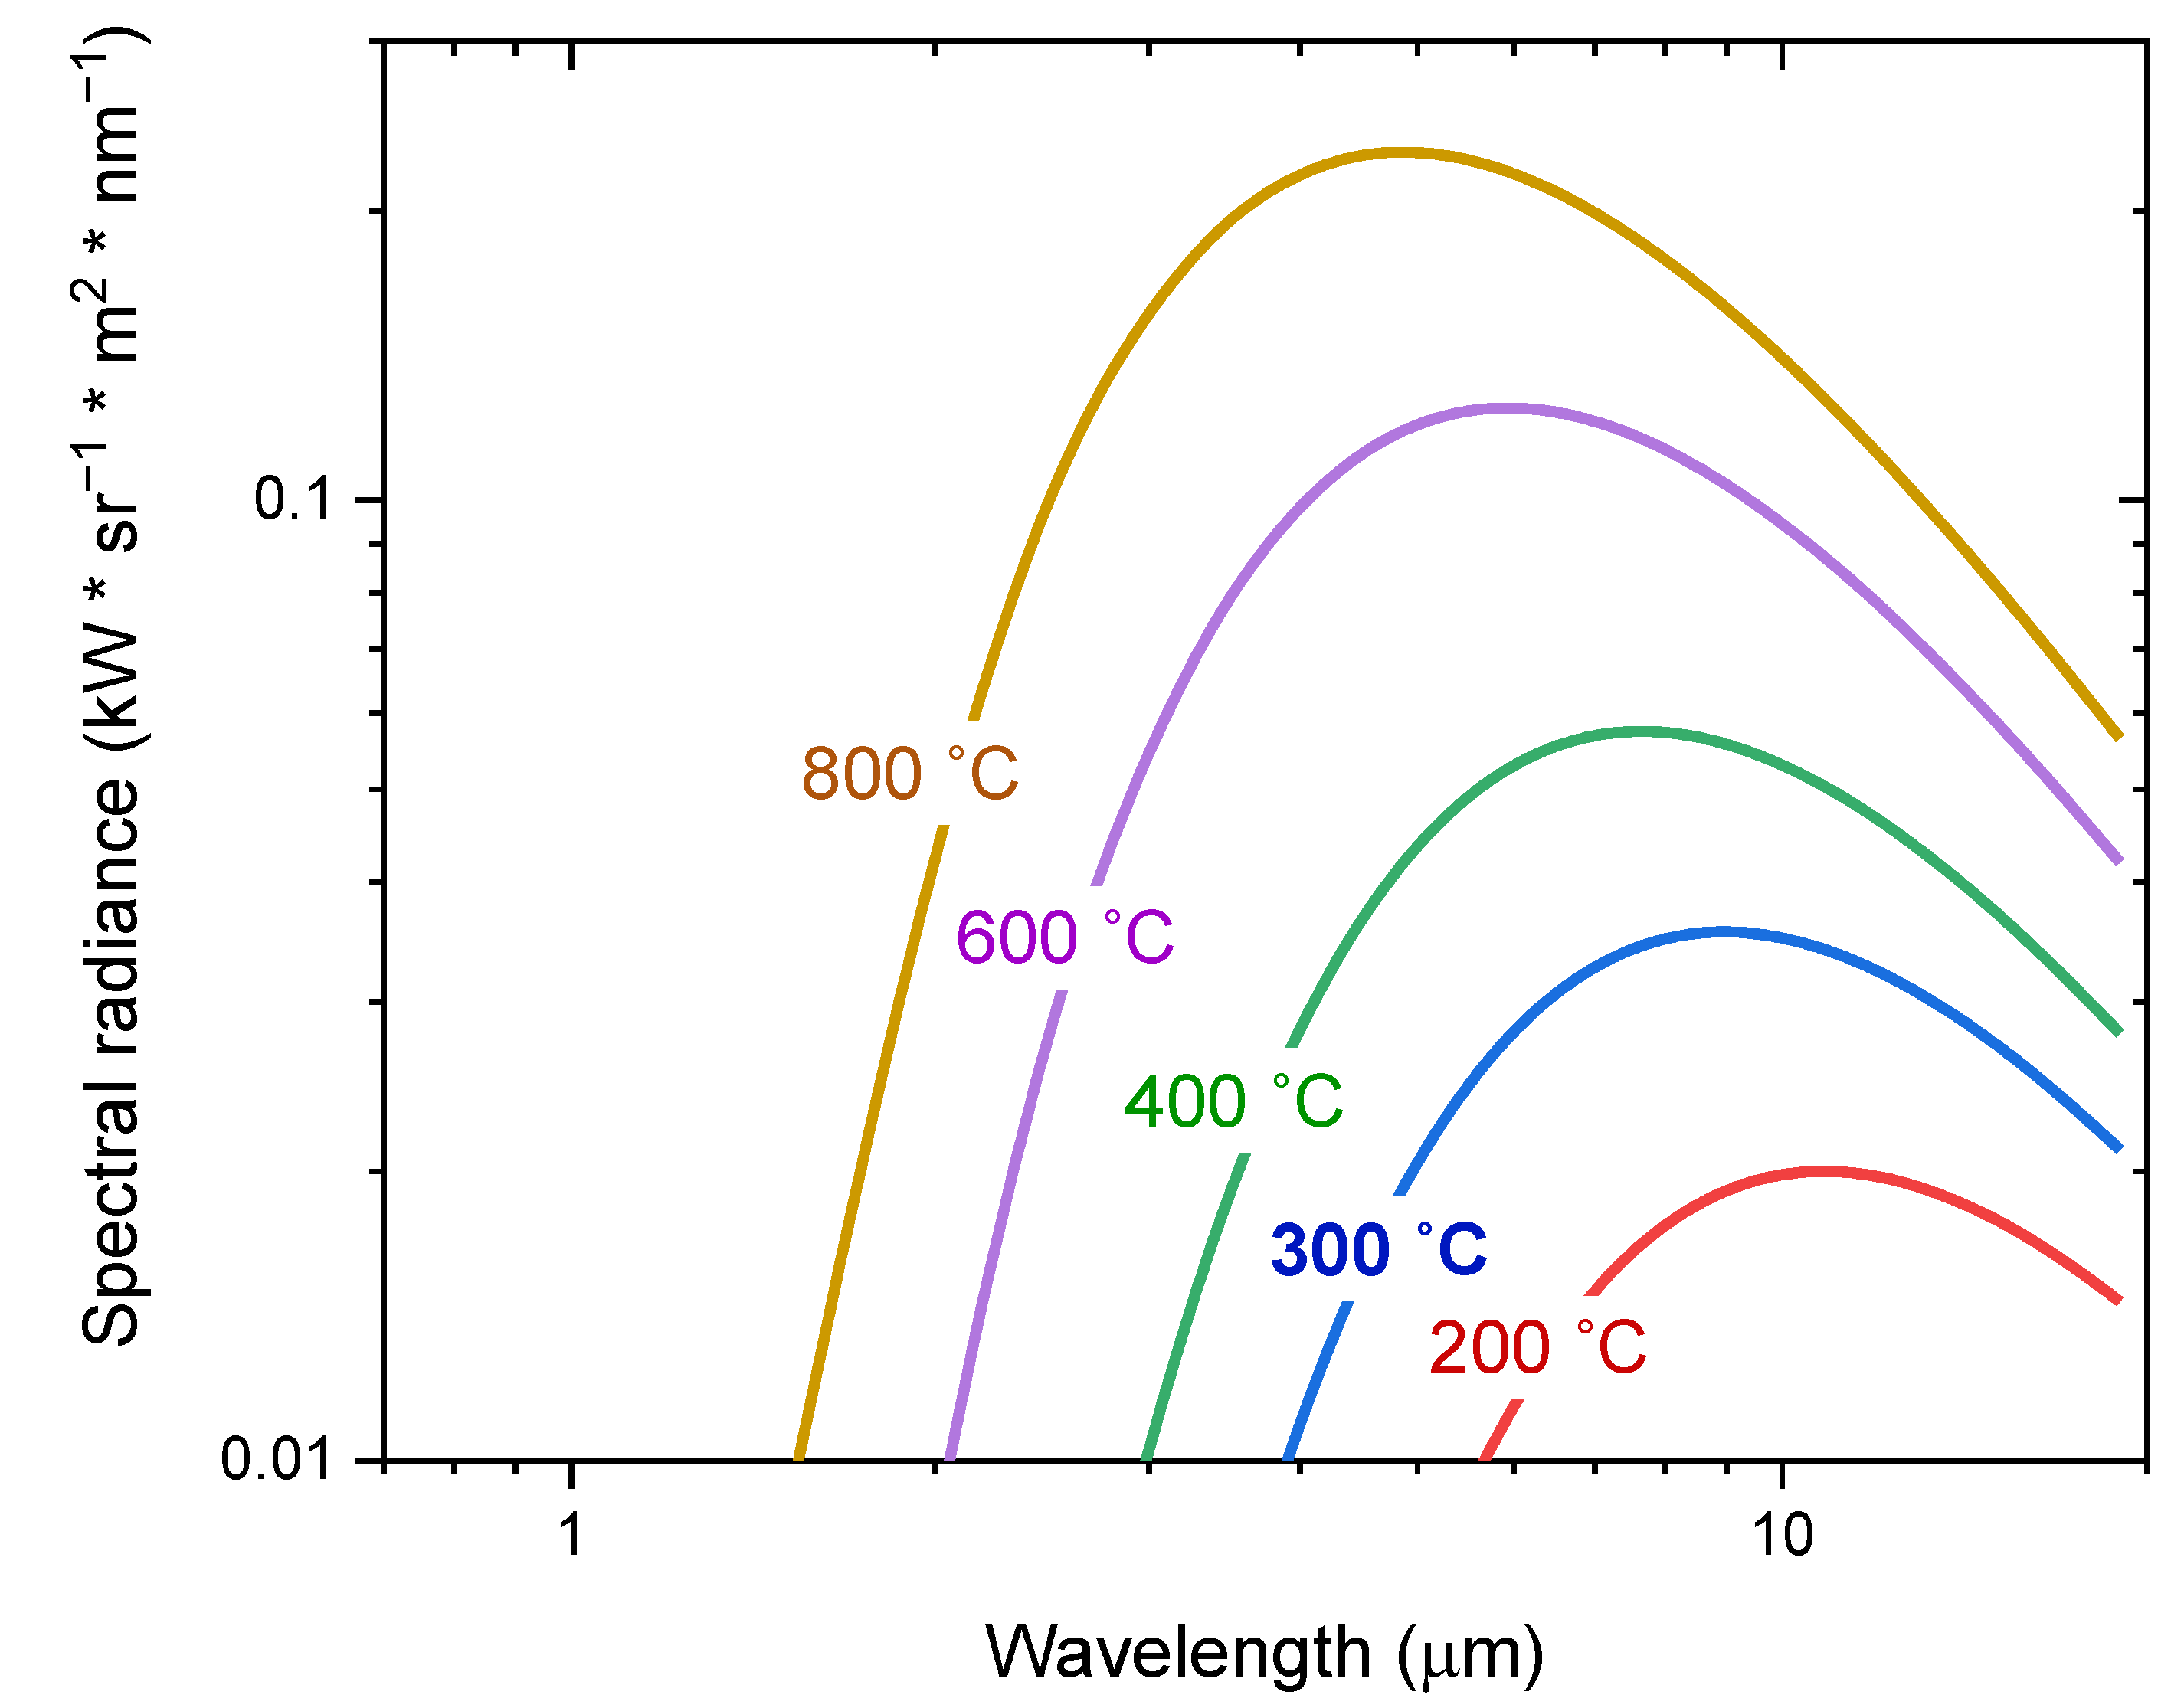
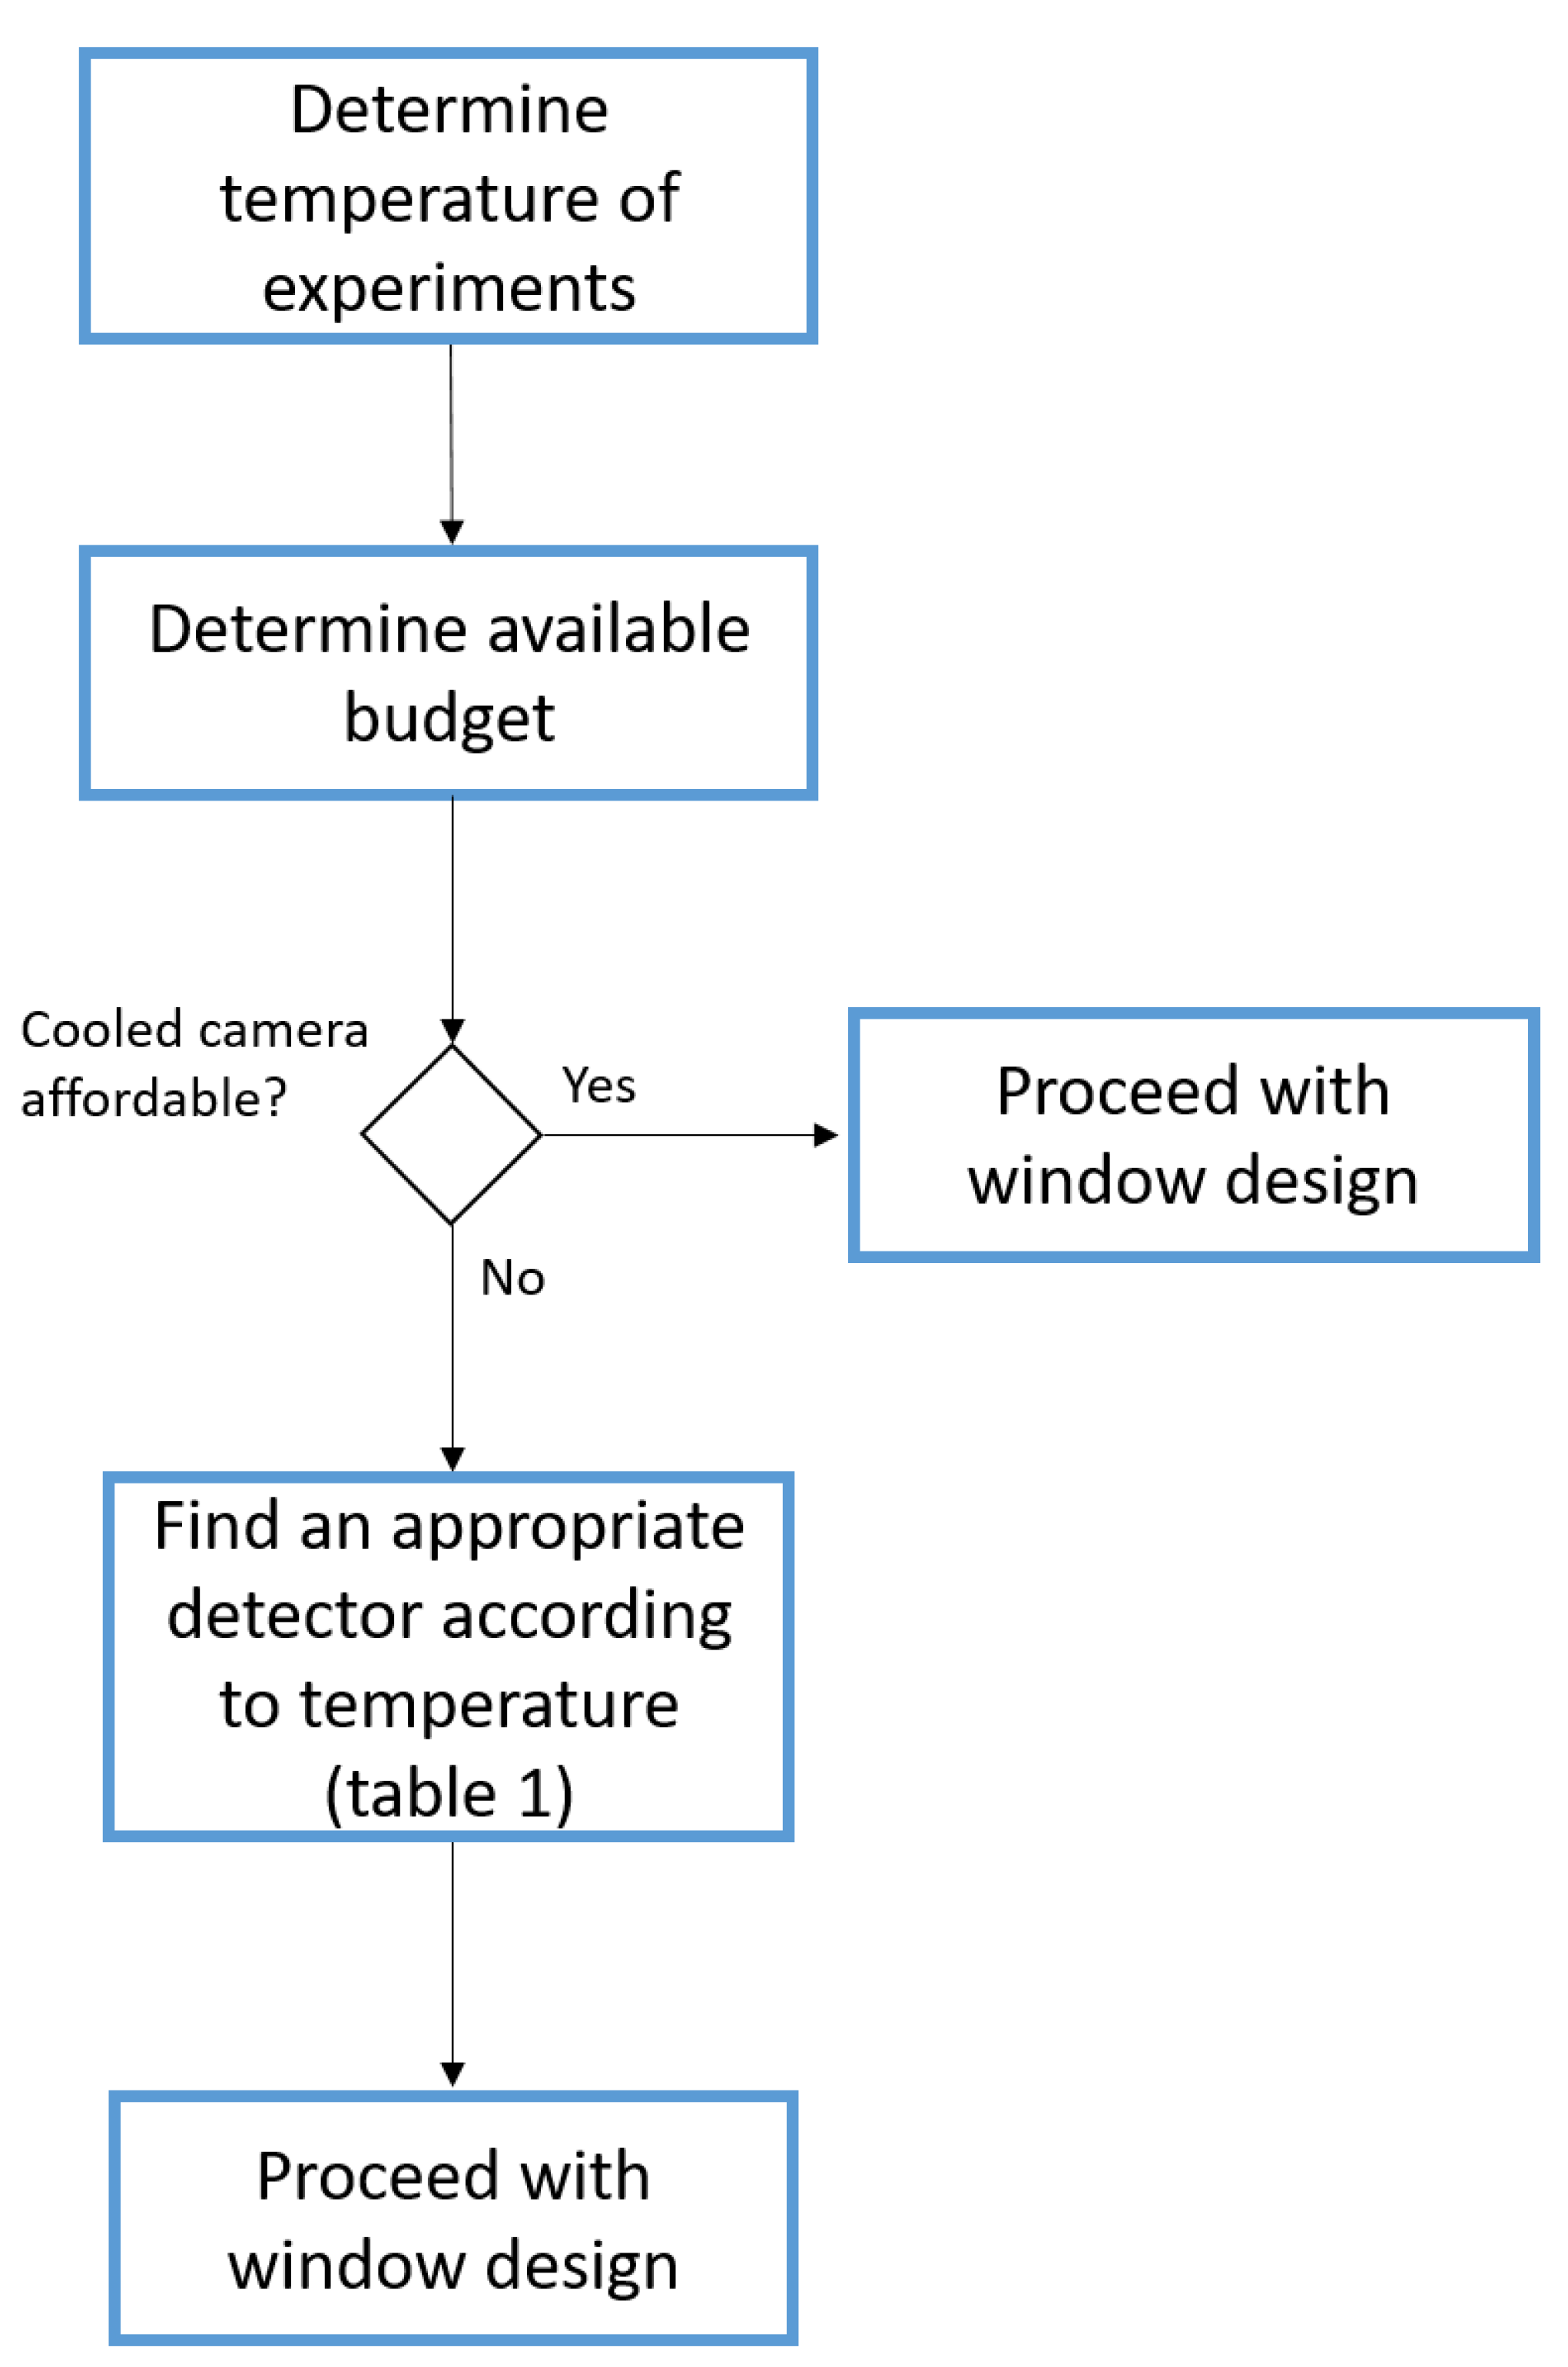
IR thermography cameras are commercially available and typically record in two different IR spectra ranges: 3 to 5 for cooled detectors such as Indium antimonide (InSb) and 7 to 17 for uncooled detectors such as Microbolometer Focal Plane Arrays [26,27]. According to the black body spectral emittance diagram, reported in Figure 1, we can correlate the temperature of a body with the wavelength of the emitted radiation and calculate the intensity of the IR radiation. Therefore, in catalysis applications, the characteristics of the experimental apparatus must be chosen according to the properties of the system to investigate. A decision tree for the selection of the experimental apparatus is shown in Figure 2. Budget also plays a significant role in the selection of the IR camera since cooled systems are typically a multiple of ten thousand Euro in price, while non-cooled systems, depending on the other specifications such as sensor resolution and lenses, are available at a fraction of the price (still typically around several thousand Euro, mainly depending on the sensor resolution). Therefore, the price of the IR camera depends on the detector installed. The bolometer detectors are generally cheaper than the semiconductor detectors and higher resolving sensors are more expensive than sensors with a lower resolution. The cooled systems, operating at low IR spectra ranges, are more flexible, since they are suitable for operation at low and high temperature. The expected reaction conditions will strongly influence the choice of the materials and of the dimension of the reaction cell and the required type of IR camera to utilize. In Figure 1, we underline the curve at 300 °C, which is the optimal temperature for our target application (Sabatier reaction). At this temperature, we can observe that the maximum of the spectral emittance curve lies around 6–7 . The IR camera must therefore be selected according to this fundamental parameter. Some of the available detectors are reported in Table 1. The micro bolometer and the indium antimonide (InSb) detectors are suitable for applications up to 350 °C. InSb detectors can be employed also at higher temperature, but additional equipment is required in this case, such as damping filters. Hence, their applicability in catalysis is limited to reactions occurring at low temperature, or with limited heat production. The QWIP (quantum-well infrared photodetector) is instead suitable for the investigation of emissions at lower wavelength, which means higher temperature. Therefore, this detector is the best choice for the investigation of reactions requiring high temperature. Furthermore, the QWIP detector allows recording a larger number of frames per second compared to the other systems presented. For catalysis applications, a stationary IR camera is generally sufficient to provide satisfactory results. In addition, in most of the practical situations investigated the use of cooled cameras is not required. However, these latter cameras undoubtedly show a better performance, simplifying the data collection. Furthermore, the lens is a critical parameter when choosing the camera since the lens will ultimately determine the field of view (FOV) of the camera. The lenses are typically made from GaAs which becomes opaque for IR radiation at elevated temperatures (above around 200 °C) and therefore the right focal length has to be chosen to keep the required distance from the reaction cell (heat emitter). The resolution of the sensor has to be chosen based on the spatial resolution required in the experiment and available budget (typically, the higher the resolution, the better). Further design properties of a working cell are provided in our previous work, to which this tutorial paper refers [18].
2.2. Design of the Reaction Cell
The core of a system dedicated to the operando investigation of chemical reactions is the reaction cell. Once the IR camera has been selected, an appropriate system for the performance of the target reaction must be designed. Main elements to be considered are the window, the heating/cooling system and the shape of the reaction cell. These elements will be analyzed separately in the following subsections.
2.2.1. Selection of the Cell Window
As the target of thermography experiments is the investigation of the IR emission of a catalyst in operation, the reaction cell must be equipped with an IR transmitting window. The window is selected mainly based on the spectral detection range of the camera and the reaction conditions, or vice versa. An overview on IR transmitting materials is listed in Table 2.
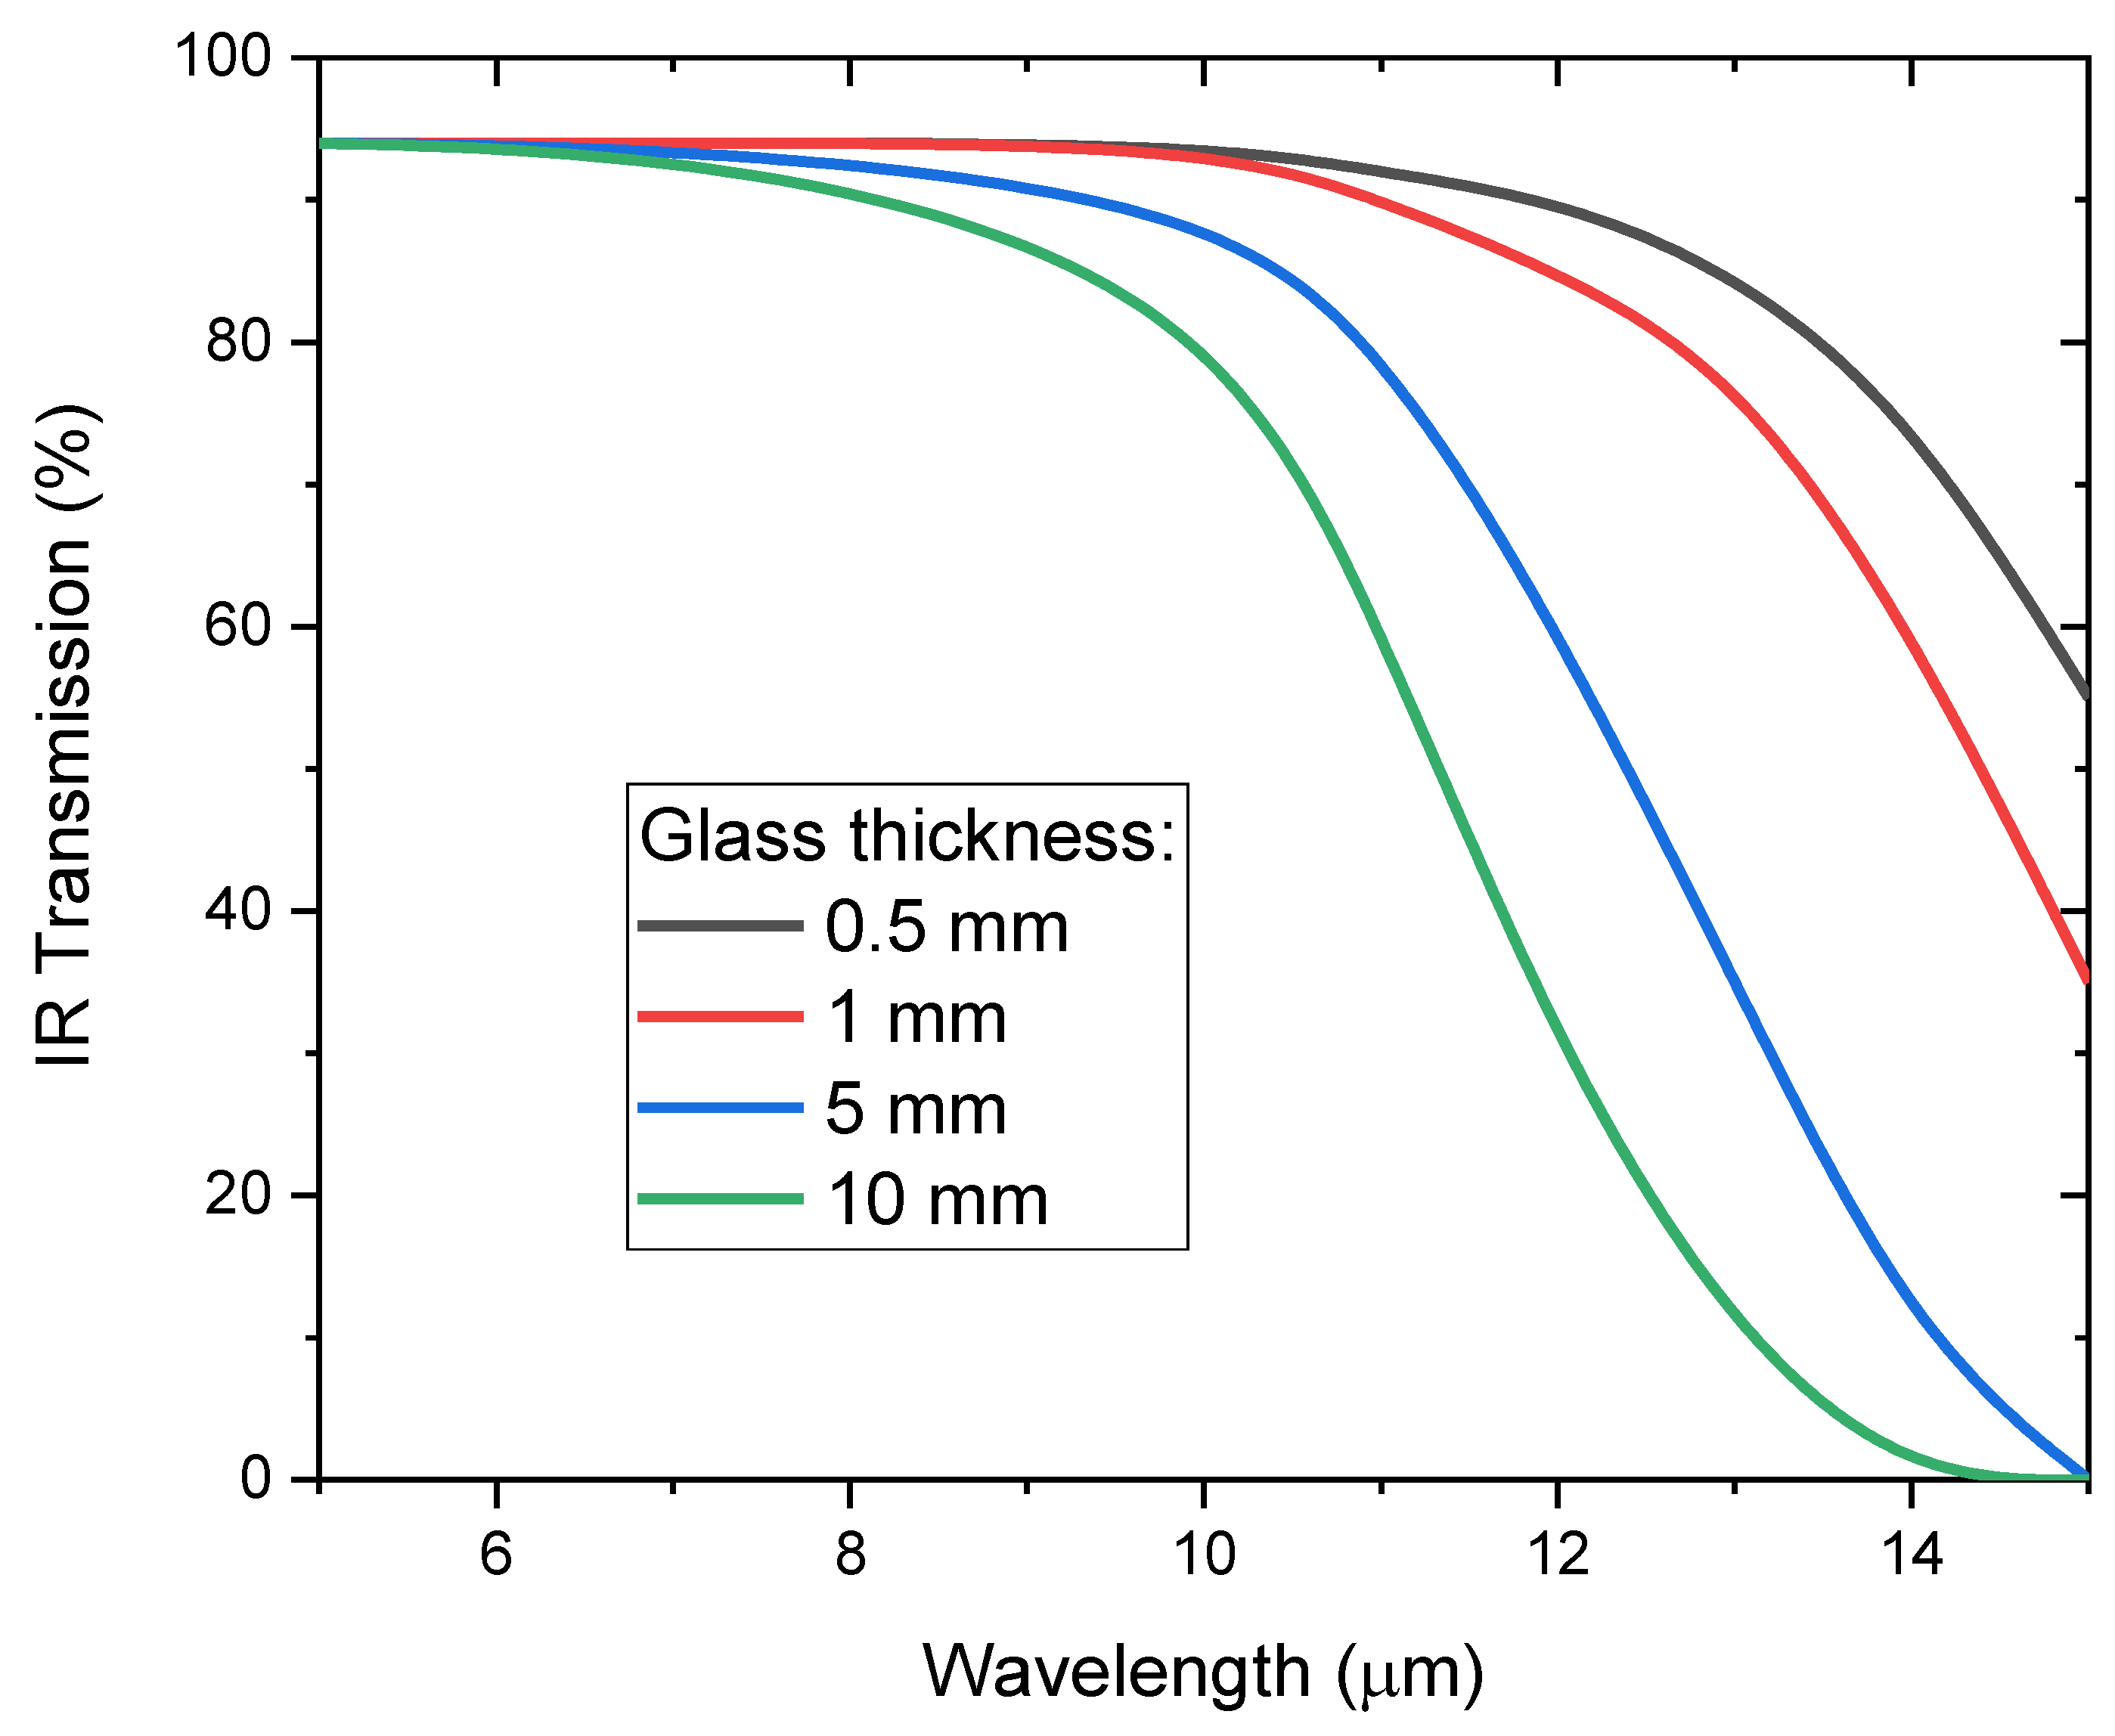
Every material listed is almost completely transparent for radiation with low wavelength (i.e., below 5). At higher wavelength, the transmittance of the material can decrease rapidly with the wavelength, until becoming absorbing for lower frequency IR wavelengths and therefore no longer suitable for IR investigations since the window becomes opaque for the detectable IR radiation. The temperature at which the material becomes opaque is a main limitation for thermography experiments and must therefore checked with care when designing the reaction cell. The transmission plot for BaF2 (first material selected as case study in this paper) is reported in Figure 3. We can observe that the positioning of the decreasing curve is also influenced by the thickness of the window. Thicker windows become non-transparent at lower wavelengths, as the transmission path is longer. However, the window must withstand the process pressure; hence, the window must have a minimum thickness. The window thickness (t) required to withstand a certain pressure can be calculated from the properties of the material and from the reaction pressure as follows:
where PF is the pressure factor, R is the window radius, SF is the safety factor (in our case 4), is the pressure difference between the two sides of the window and RM is the module of rupture of the material. The safety factor is set to 4 according to the forecasted risk of overpressure in the planned experiments. It may be set to a higher value according to the requirements of the user. The properties required for the calculation for various window materials are reported in Table 2. The knowledge of the required material thickness, together with the information on the reaction temperature, allows for the final selection of the window material.
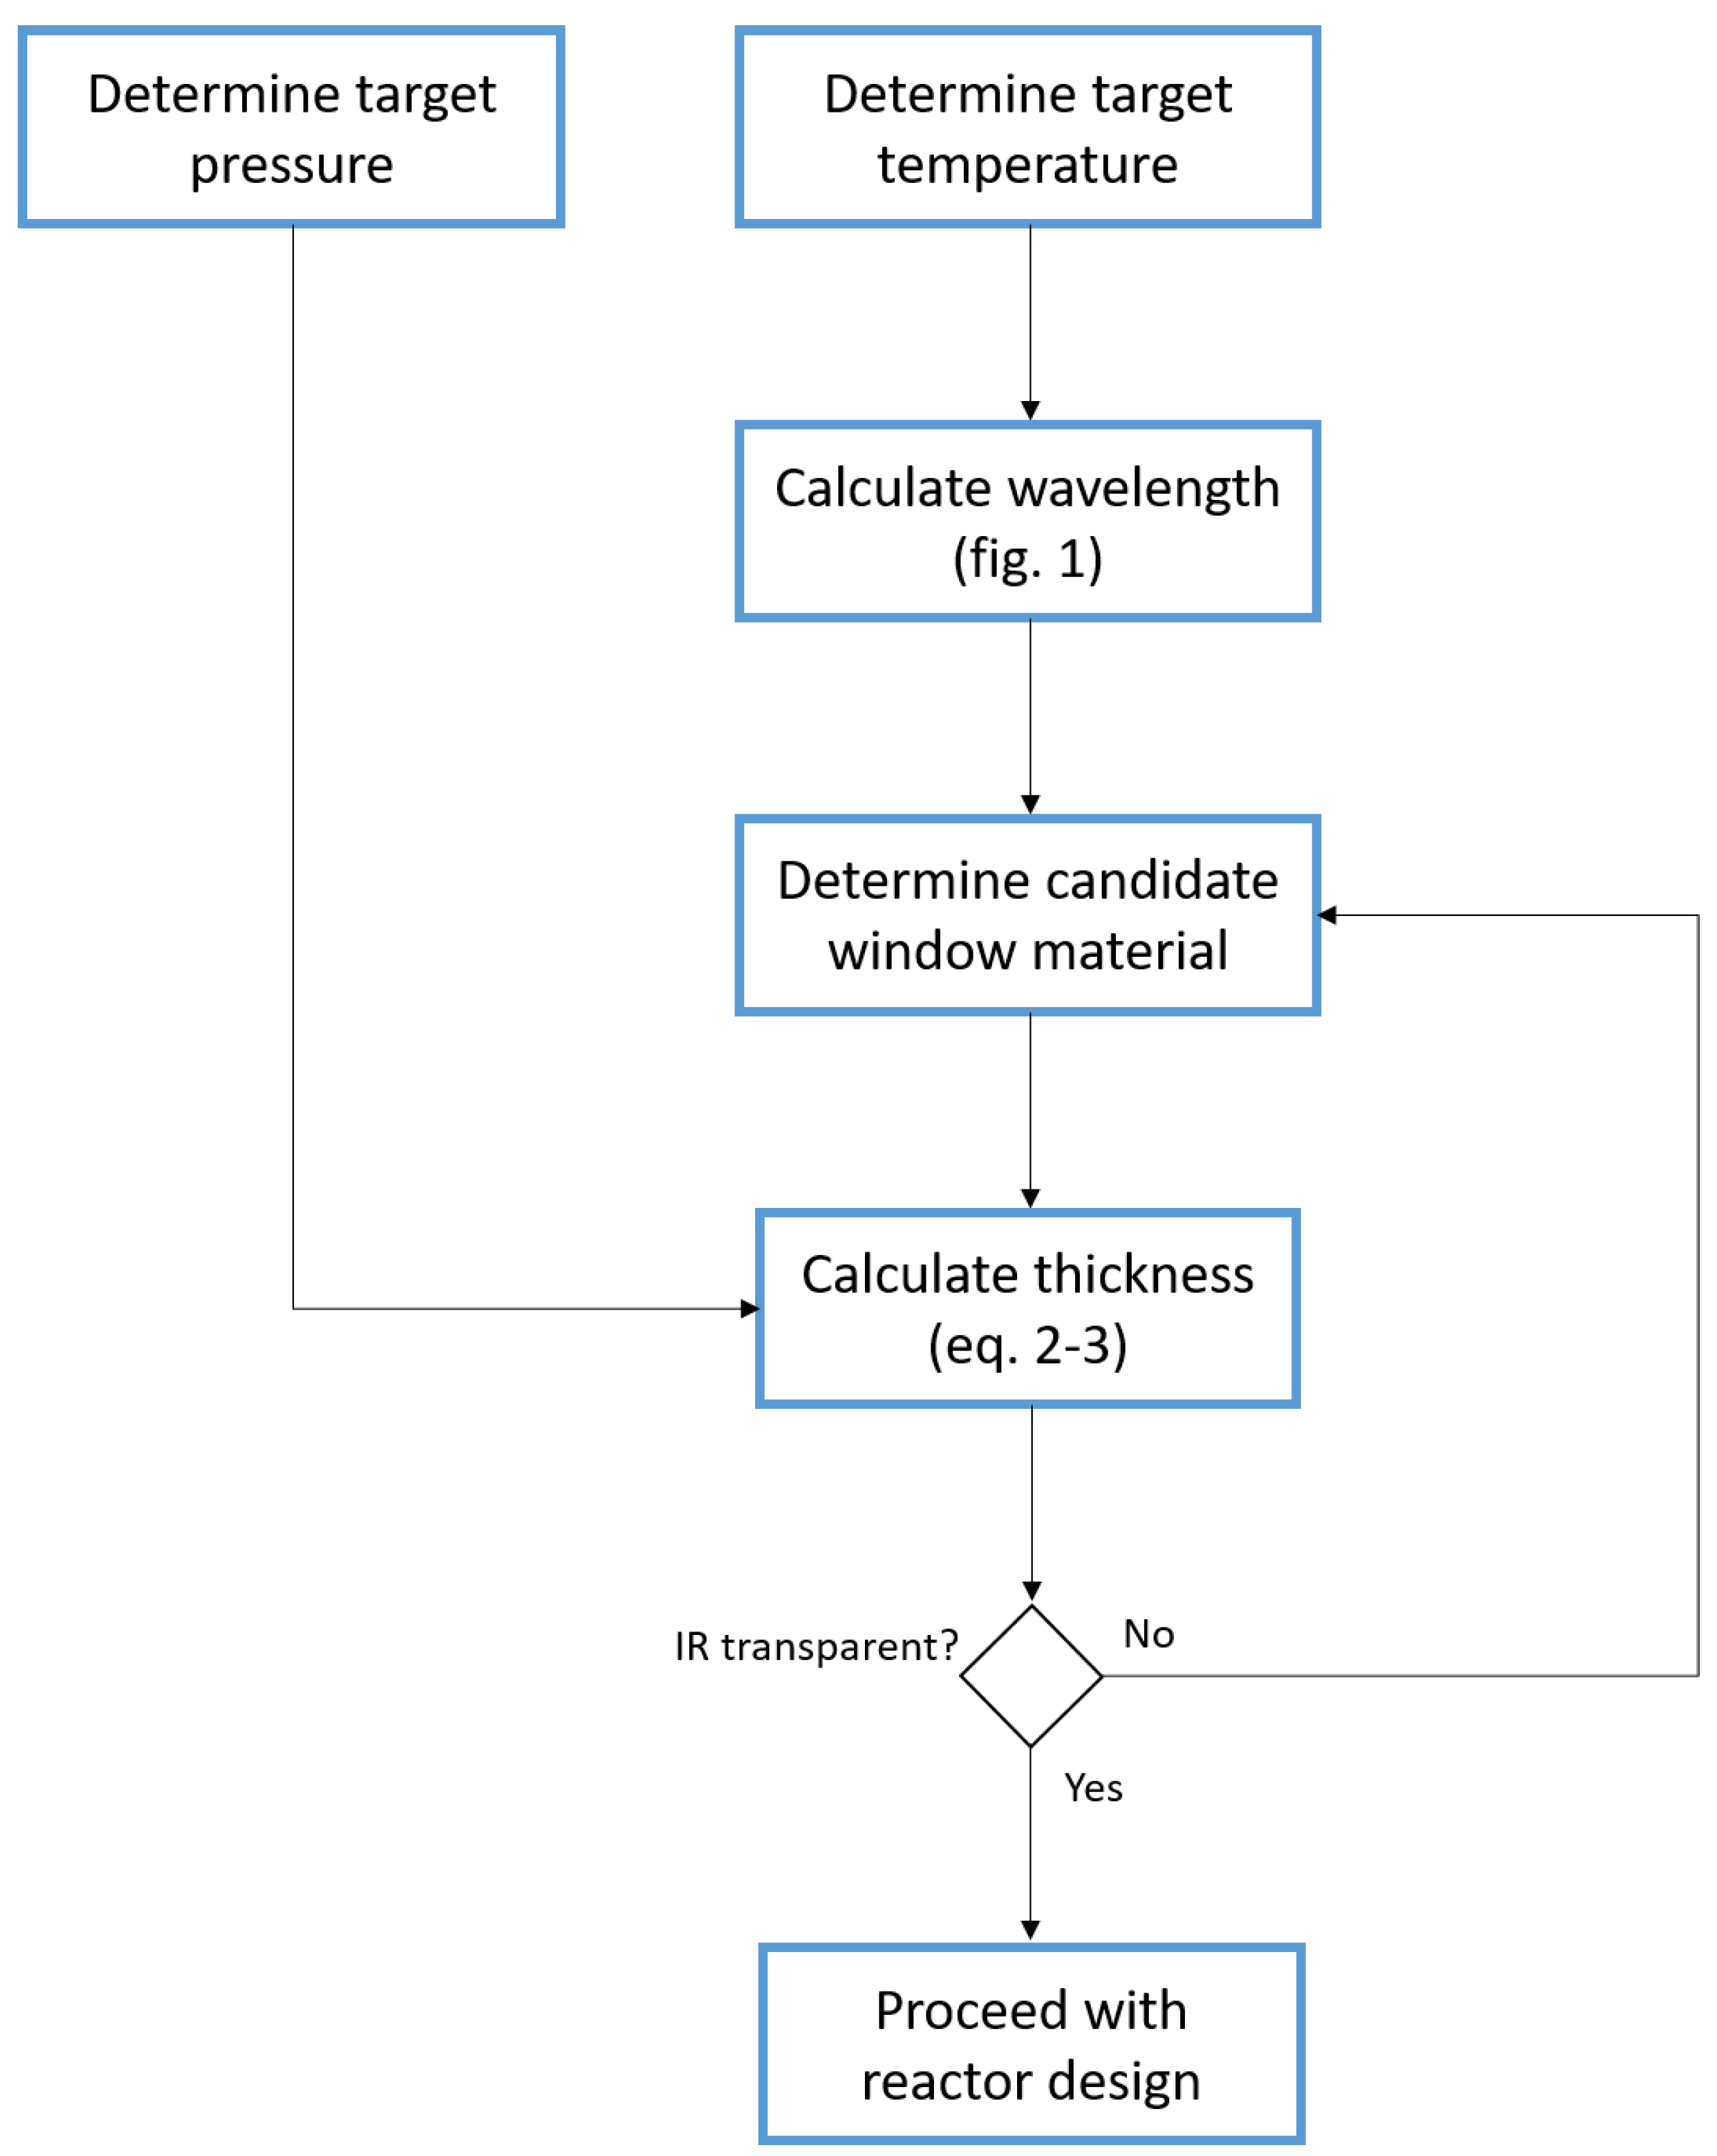
According to the principles described above, we derived a systematic decision tree for the determination of the ideal window material for an IR thermography reaction cell, which we report in Figure 4. Firstly, temperature and pressure of the reactive phenomenon to investigate are determined. These are the key parameters for any further decision. Depending on the reaction temperature, the wavelength of the emitted IR radiation can be determined and therefore a first candidate material can be selected, among the possible IR transmitting materials in Table 2. The information on material properties, together with the target process pressure, allow the calculation of the necessary window thickness to safely operate the IR thermography experiments. The combination of window thickness and IR wavelength are then utilized to determine the expected transmittance of the reaction cell at the target temperature. If a sufficient fraction of IR radiation is transmitted outside the reaction cell, the material is suitable for the thermography experiments and the system can be designed following the guidelines of the next section. If the transmission rate is not sufficient, the calculations must be repeated with another candidate material until it reaches a satisfactory solution.
2.2.2. Selection of the Heating System
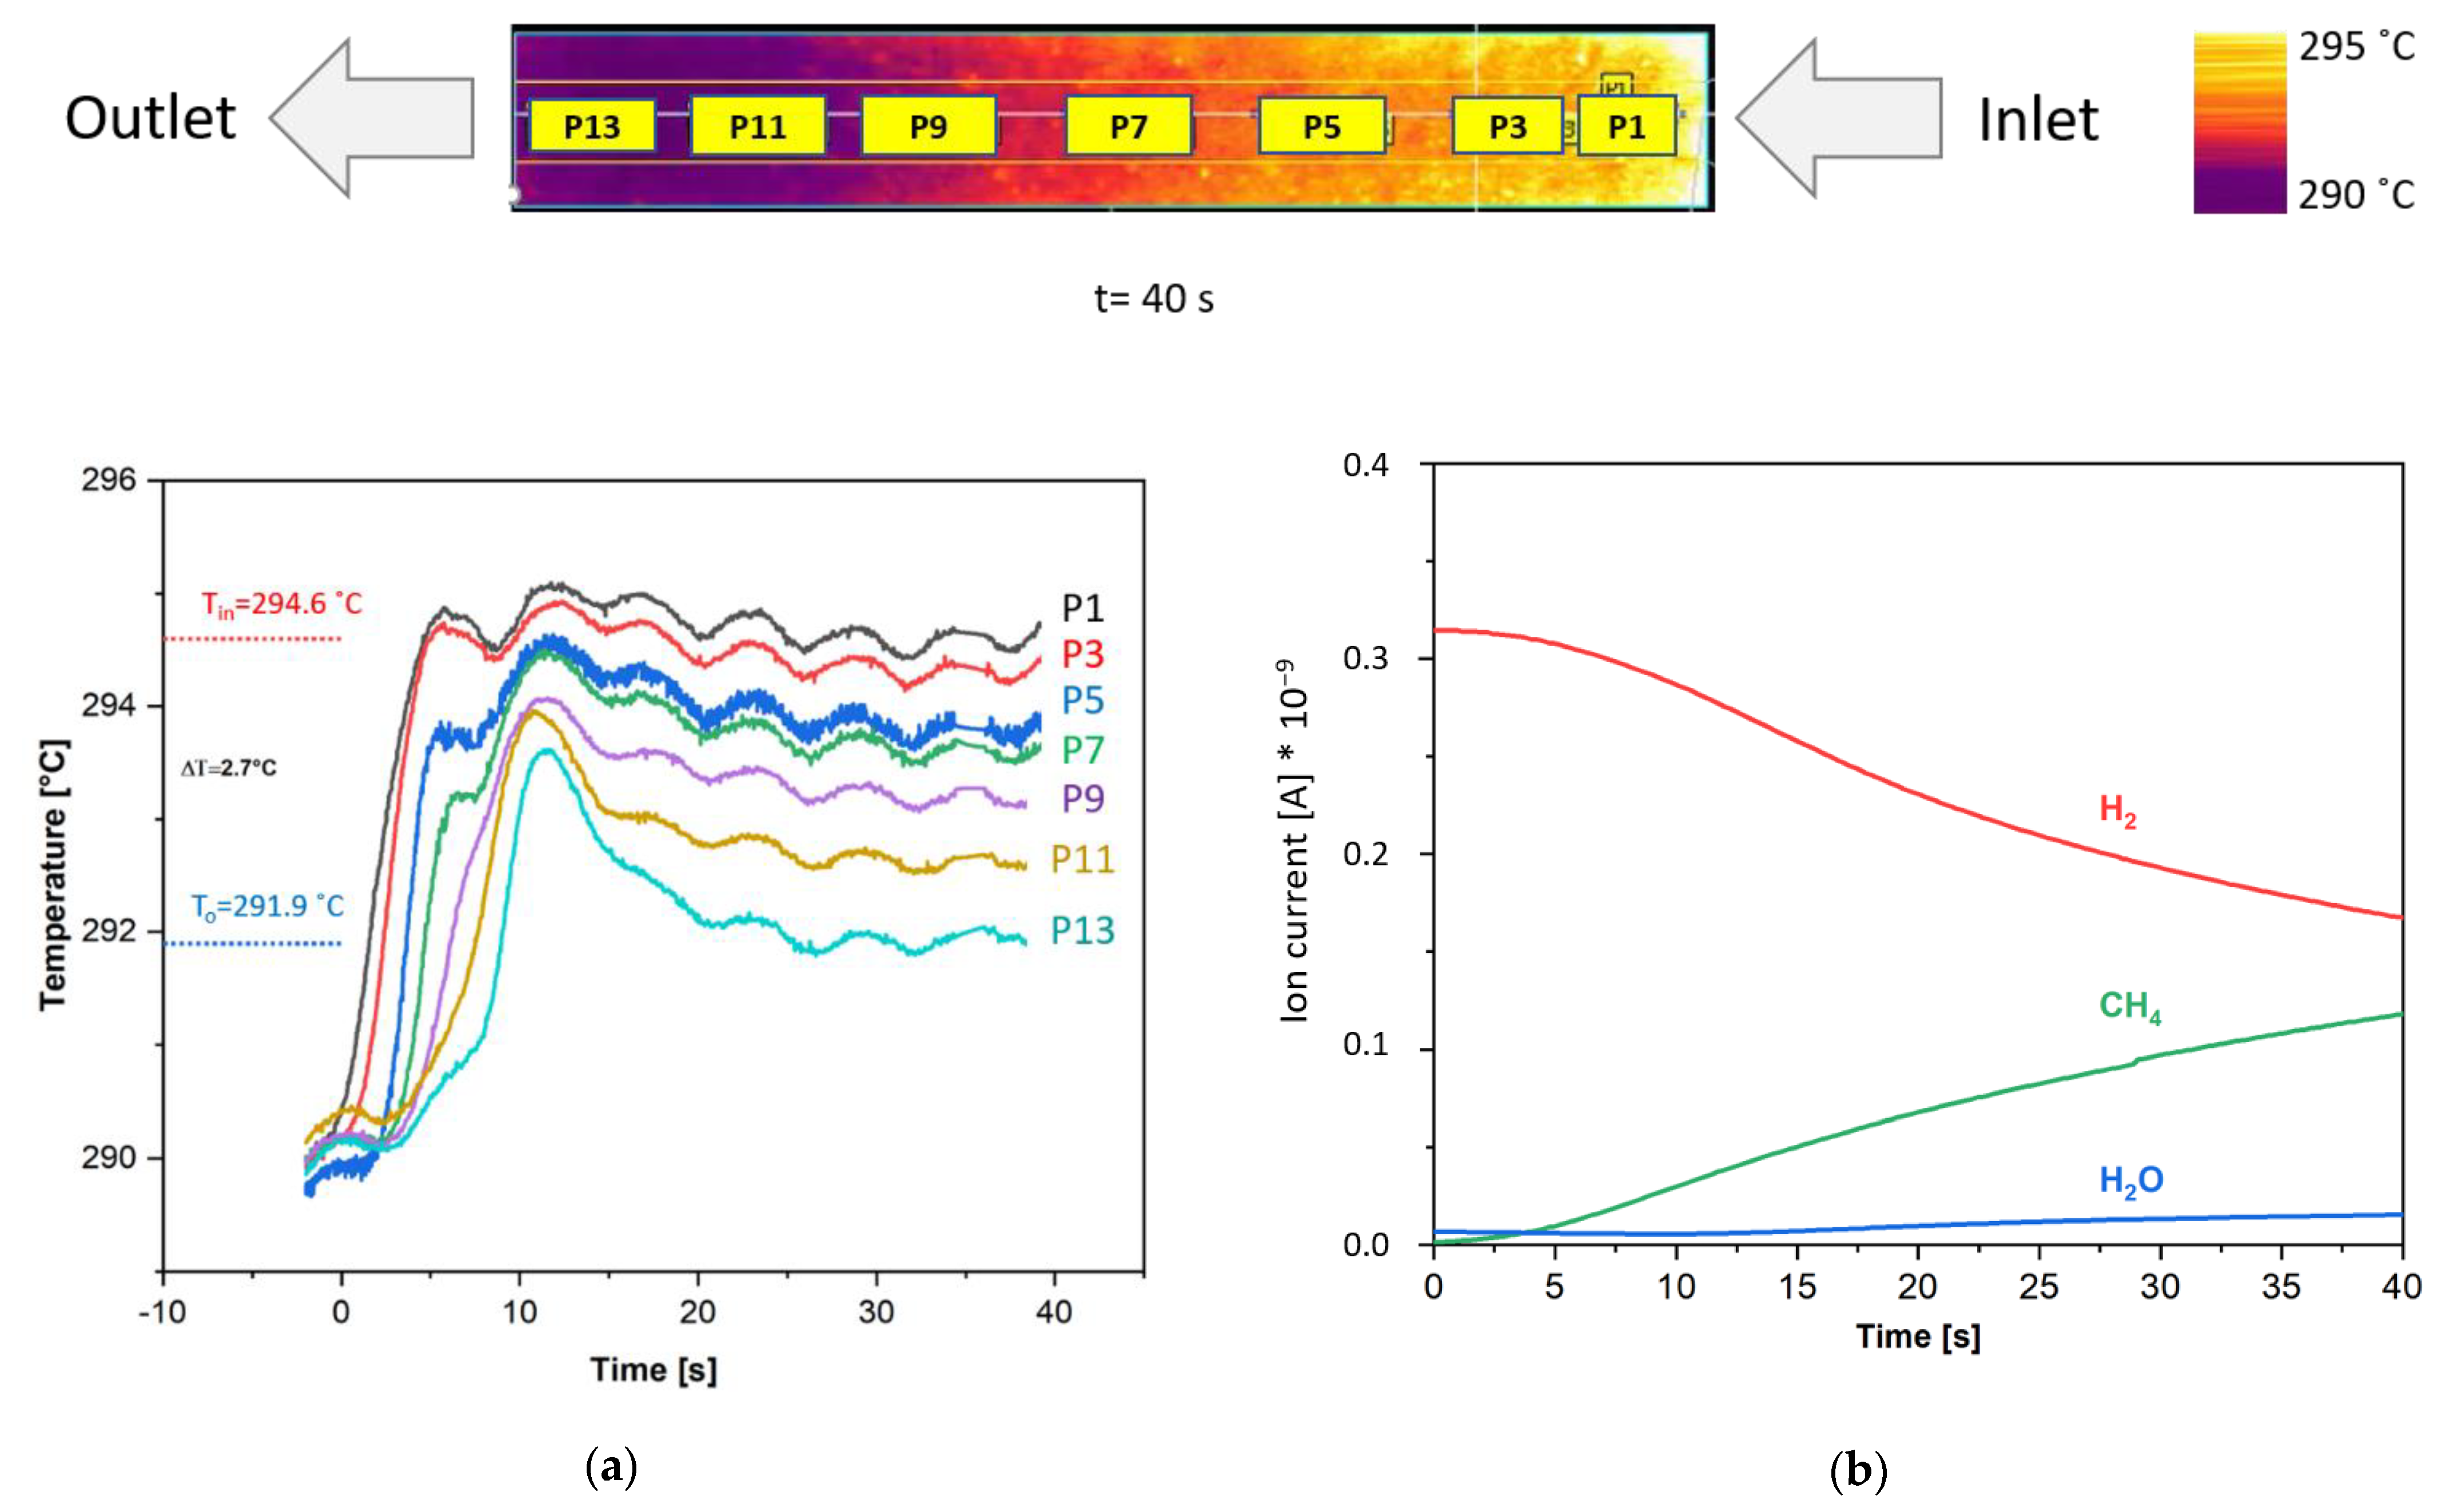
In most of the practical uses of IR thermography for catalytic investigations, the reaction is conducted in a laboratory environment, using diluted gas. These conditions are necessary to avoid the influence of mass and heat transfer phenomena on the experimental results. For this reason, the reaction operates rarely in a self-sustaining way and an appropriate heating for the reaction cell is necessary to maintain the reaction temperature. Furthermore, the external heating allows testing the catalyst at various temperatures, to investigate kinetic reaction phenomena. However, the installation of an appropriate heating system is challenging in the case of IR thermography experiments since the system must allow the clear distinction between the temperature changes due to heating and the contribution of the chemical reaction to the thermal emission change. We designed a reaction cell in which heat is provided by a heating cartridge placed immediately below the reaction plane. In this way, the entire reaction cell is heated at the same temperature thanks to the rapid heat transfer through the metal walls. Furthermore, the heat is transferred to the catalyst almost instantly, which quickly reaches the target temperature upon activation of the heating system. According to the dimension of the reaction cell, it may be convenient to install more than one heating cartridge, to ensure a uniform temperature (circular heating plates or multiple heating cartridges). During the experiments, we observed that special attention had to be posed to the control system of the heating system. In fact, the standard temperature control of the heating cartridge (feedback loop controller) compensates for the temperature increase due to the chemical reaction (this is what the controller is designed for), thus strongly interfering with the experimental observations. To avoid this feedback loop, the heat controller or heating system has to be set to a constant power output rather than a temperature set point. In this case, the aimed reaction base temperature has to be found manually with power set point iterations and the environmental factor have to be kept constant (room temperature, ventilation) to not alter the result. In Figure 5, we show the result of a test run of the Sabatier reaction with a fixed power output set point for the heating cartridge. The temperature is measured in several points on the axial direction of the reactor. Each point is denoted with a progressive p value (from P1 to P13). We can observe two main phenomena: the transient hotspot due to the activation of the reaction and a steady-state hotspot due to the uneven distribution of the CO2 conversion over the axial direction (see Section 4 for further details). Here, we refer the term hotspot not to a single point in the reactor, but rather to a specific area of the catalyst where the extent of reaction causes the increase of temperature. For an in depth analysis of these observation we refer to our previous study “Imaging Catalysis: Operando Investigation of the CO2 Hydrogenation Reaction Dynamics by Means of Infrared Thermography” [18]. In this work the focus is on the measurement procedure. In the thermograph in Figure 5, some background noise in sinusoidal waveform is visible due to the external heating. This is likely due to the regulation of the power, which is not constant but probably set via on/off in certain time steps, which results in the reported waveform of the baseline. However, the wave amplitude is less than 1 °C and therefore the baseline is suitable for experiments where the heat increase/decrease is clearly above 1 °C from the baseline. The signal to noise ratio has to be sufficiently high to recover data from occurring reactions. In the specific case of Figure 5, the interference of the background noise does not influence both the observation of a steady state temperature gradient (2.7 °C difference between reactor inlet and outlet) and a transient hotspot (ca. 1.8 °C for the point at the reactor outlet, P13 in Figure 5). These results validate the appropriateness of the power set point method for the IR thermography experiments, showing that it is possible to achieve a limited interference between the reaction effects and the external heating. However, this creates a larger effort in the experimental design phase, as the system has to be calibrated in all the condition tested, to ensure that the right power is fed to the heating system and the target temperature is reached and maintained. Additional attention should be posed towards the formation of temperature gradients between the catalyst surface and the reactor window. In fact, the temperature outside of the window may be significantly lower than the temperature of the catalytic bed, resulting in a temperature gradient within the height of the channel. This phenomenon must be compensated to avoid mistakes in the temperature measurements, due to the heat absorption by the window and the system. A proposed solution to this issue involves the use of a heated blower to supply hot air on the external face of the window, thus reducing the temperature gradients [18]. Otherwise, it is possible avoid this problem by installing the entire setup in a temperature-controlled environment (e.g., oven with an IR transmitting window).
2.2.3. Coupled Concentration Measurements
In order to obtain a full picture of the chemical phenomena occurring during IR thermography experiments, it is necessary to couple the detailed temperature analysis with the determination of timely resolved concentration curves. These must be exactly timed with the IR temperature profiles to enable a correlation between temperature and concentration profiles. Considering the example of Figure 5, we can observe that the transient hotspot recorded by the IR camera takes place in the first 20 s of the experiment. Therefore, the concentration profiles at the reactor outlet (and ideally also along the axial coordinate of the reactor [23]) must be recovered with a similar frequency (several points during these 20 s). Due to this strict requirement, only few concentration analysis tools are suitable. Such a rapid sampling rate can be achieved only with spectroscopic methods (to the best of our knowledge), such as mass spectroscopy (MS) or Fourier transform infrared spectroscopy (FTIR). A standard method like gas chromatography (GC) typically offers instead a too low sampling rate to be coupled with IR thermography for fast reactions. In order to achieve a faster sampling rate, the measurement method can be optimized to include only information about the gas species or measured ion mass of interest. This is the case of Figure 5b, where the mass spectrometer has been employed only to the ion mass peaks occurring in the Sabatier reaction (i.e., CO2, H2, H2O and CH4). In this way, the sampling rate can be significantly increased. For the specific case of Figure 5b, 50 spectra per second were recorded. This frequency integrates well the IR thermography results, indicating that the initial hotspot is generated by water adsorption on the catalyst surface, as pointed out by the delay in the observation of water at the reactor outlet compared to the first appearance of methane. To ensure the selection of the correct ion masses in the MS, a screening measurement with a large range of m/z must be carried out and additionally the MS can be calibrated to enable quantification of the gas species following the method provided by Mutschler et al. [34]. Additionally, the use of a spatially resolved technique, such as the analysis in multiple positions of the catalyst bed by use of a movable capillary, can integrate a large amount of temperature data points with a large amount of concentration data points, creating an ideal dataset for kinetic modeling and model-based reactor optimization.
3. Design of the IR Thermography Experiments
IR camera, reactor window and heating system are the most critical aspects to be addressed when designing an experimental system for IR thermography measurements. In the previous sections, we defined a systematic procedure for the design of these elements and determined the characteristics that a system must contain to provide significant experimental results. However, a crucial point for the recovery of experimental evidences about transient and steady state chemical phenomena is the appropriate design of the thermography experiments, in order to avoid the influence of undesired side effects, caused by heat and mass transfer limitations or by the non-ideality of the system. In this section, we define some general guidelines to correctly design IR thermography experiments. These involve the determination of the optimal procedures to perform the selected chemical reaction, in terms of adaptation of the reaction kinetics and feed sequence of the reactants.
3.1. Formulation of Heat Balances
As IR thermography is aimed at the analysis of the temperature of solid and/or of the gas phase in a chemical reaction, the reaction conditions must be selected with care. In this sense, the most common reaction engineering tools are greatly helpful for the experimental design of IR thermography experiments. Primarily, a fundamental parameter to be determined for designing the experimental procedure is the catalyst emissivity. This parameter can be evaluated by performing calibration experiments with the IR camera, exposing the catalyst to an inert gas such as He. The most common calibration method involve the comparison of IR thermographs with the temperature measured by a thermocouple [24]. Emissivity is dependent on the temperature; therefore, a calibration curve must be determined by evaluating the results collected over the entire temperature range of interest. Detailed calibration curves may consider also the influence of focal distance and humidity [35]. Additionally, special attention must be posed to the oxidation state of the catalyst, as a change in the emissivity may occur in the modification of the active side from oxidized to reduced state. Therefore, when observing a catalyst whose composition changes significantly during the reaction, it is convenient to repeat the calibration for various states of the catalyst and account for this phenomenon in the analysis of the experimental results.
Once the emissivity of the catalyst in relevant conditions is determined, the heat losses by convection and irradiation can be calculated via Equations (4) and (5). The radiative heat flow is calculated as:
where is the emissivity, the Stefan-Boltzmann constant, is the exchange surface, the process temperature and the external temperature.
The convective heat flow is calculated with Formula (5):
where is the heat transfer coefficient, obtained from appropriate correlations for the Nusselt number. In most of the micro reactors used for laboratory applications, the flow regime is laminar; therefore, the contribution of convective heat transfer is limited [36].
3.2. Reaction Engineering Considerations
The heat balance considers the heat losses by convection and irradiation (conduction can be neglected in almost all the practical cases) and the heat provided by reaction and external heating. These elements can be implemented in an appropriate reactor model to estimate the temperature profile on the reactor and verify whether IR thermography is a suitable method for the analysis of the reaction. For this preliminary assessment, a simple 1D pseudo-homogeneous model can be sufficient, providing some general information on the expected extent of the reaction hotspot (i.e., of the local formation of specific zones with higher temperature on the catalyst). A simple model to this purpose is reported in the Supplementary Information.
Estimation of Temperature Profiles in the Sabatier Reaction
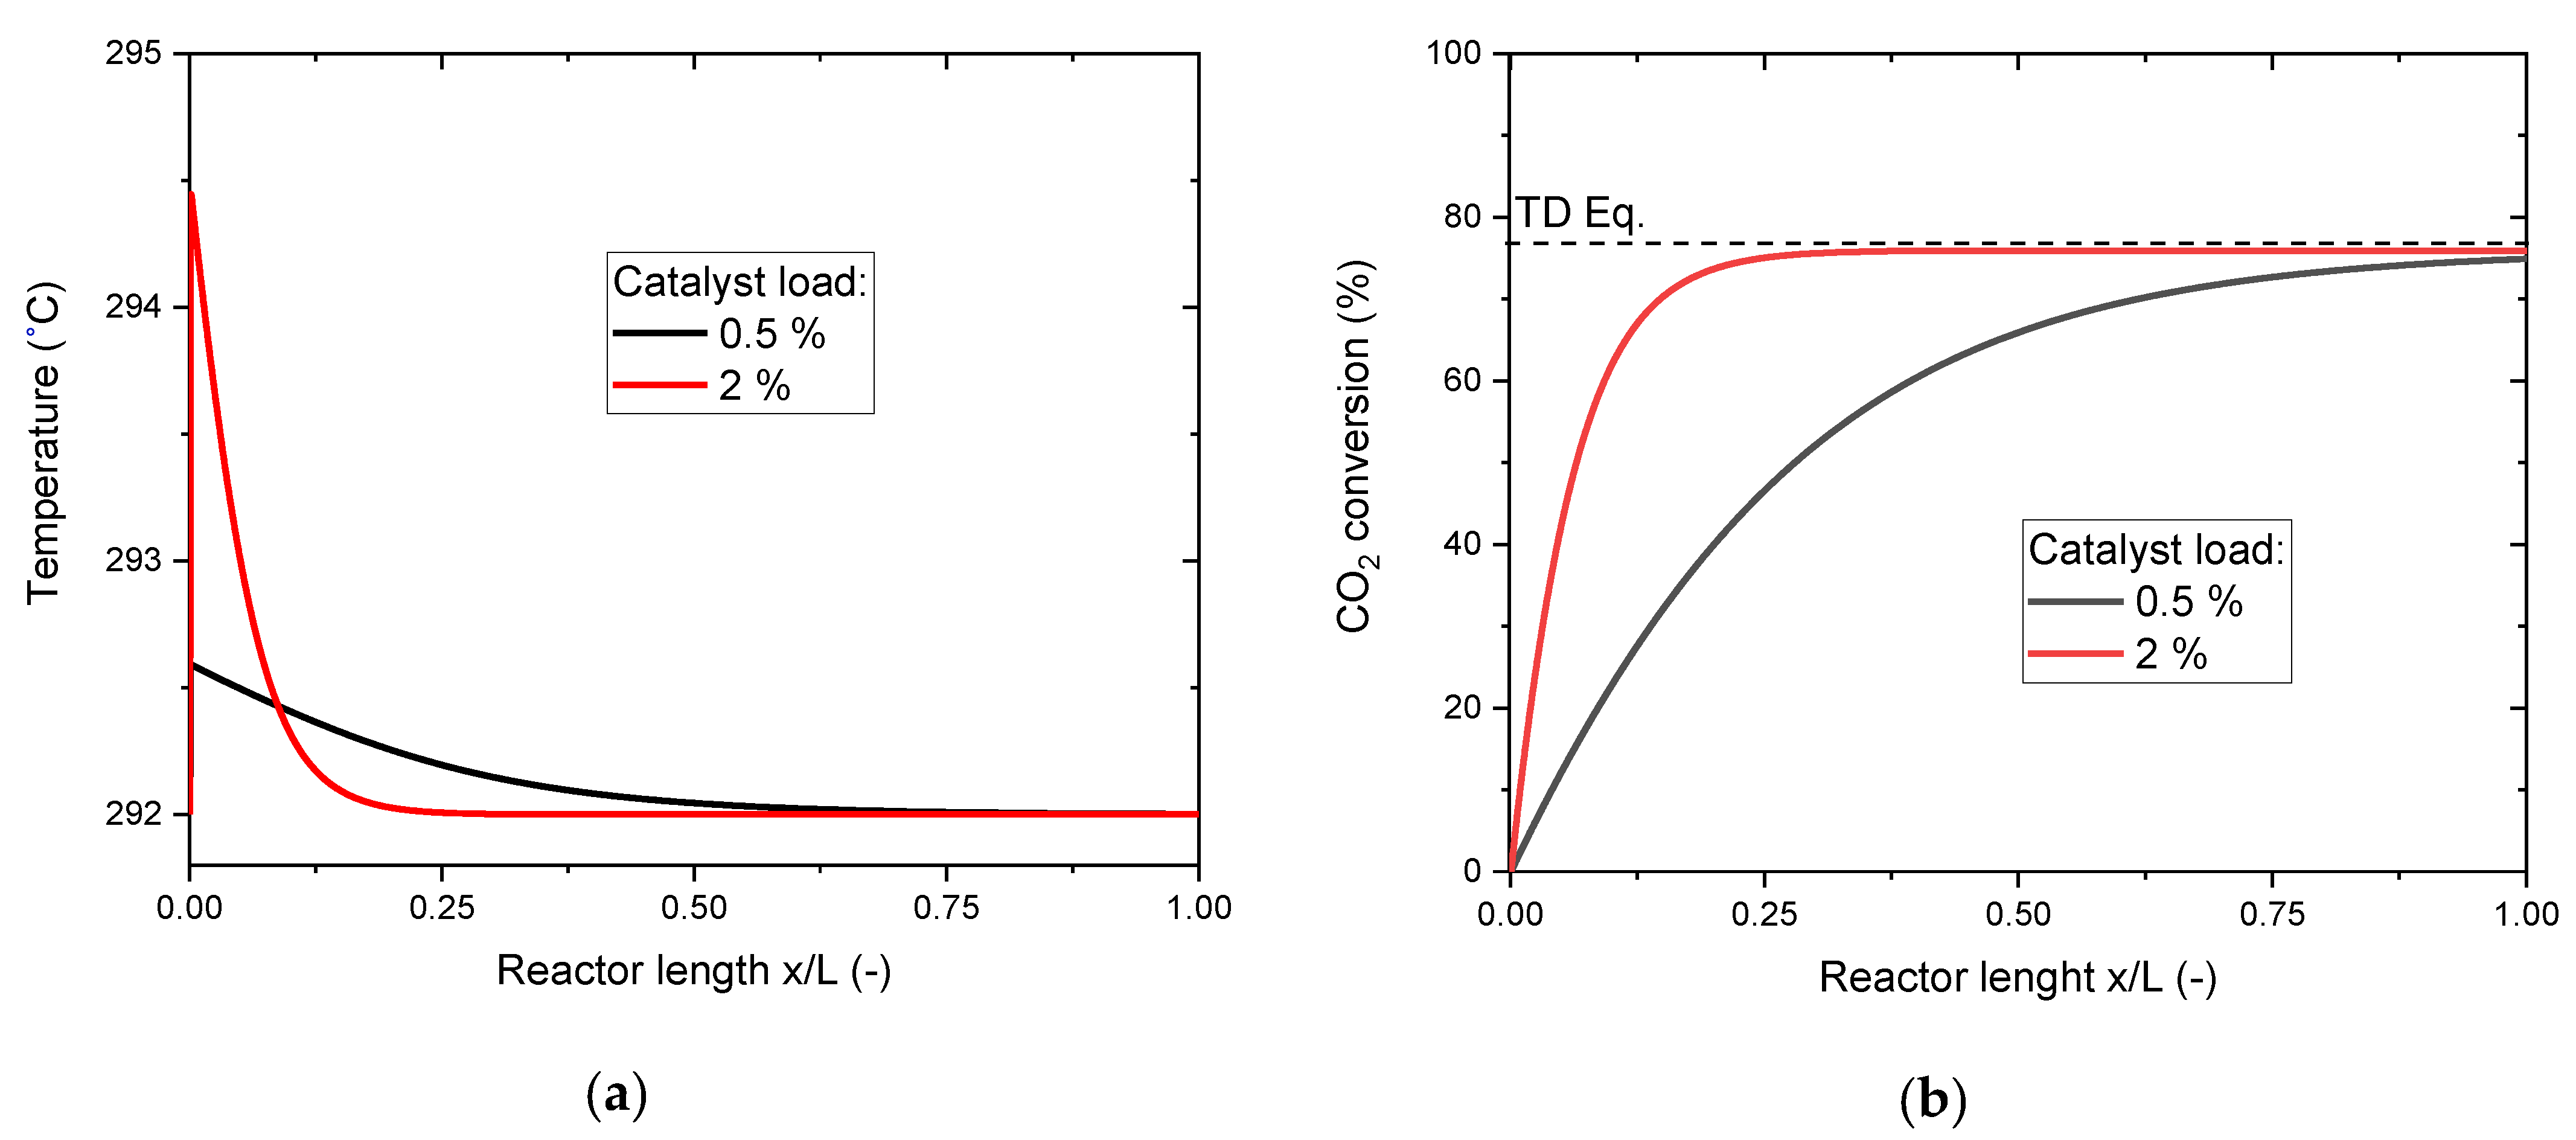
In our case study, we used a 1D pseudo-homogeneous reactor model, simulating the Sabatier reaction over a 0.5% Ru/Al2O3 catalyst (modeling details are reported in the Supplementary Information). The results of the simulations, which show the predicted steady state profiles, are reported in Figure 6. Surprisingly, we observed that the reaction occurring on this catalyst would generate a limited reaction hotspot (ca. 1.5 °C) and that the CO2 conversion would be distributed over the entire reaction length. Hence, in this reaction system, it would be difficult to distinguish the reaction-generated hotspot from the natural background noise originated from the heating system (see Figure 5a). Thermography experiments in this specific system would not allow a reliable determination of dynamic effects in the reaction, but the practically isothermal reactor would be an ideal solution for the kinetic analysis of the system since this would minimize the influence of non-ideal conditions on the experimental results. In this latter case, the system should be complemented with spatially resolved concentration profiles, to obtain a large and consistent dataset of temperature and partial pressure measurements for the kinetic modeling phase. In order to design a system suitable for the experimental analysis of transient phenomena, the heat production of the system should be increased or the heat losses should be decreased. In our case, we decided to increase the heat production of the system by using a catalyst with higher Ru load. The red curves of Figure 6 show the calculated temperature and CO2 conversion profiles for the 2% Ru/Al2O3 catalyst. We can observe that the Sabatier reaction is faster on this catalyst, resulting in a different distribution of the heat production. Most of the CO2 conversion occurs in the first third of the reaction chamber, causing stabilization of the catalyst at a higher temperature than the baseline of the external heater, thus producing a remarkable hotspot at the reactor inlet (ca. 5.5 °C). In these conditions, it is possible to distinguish between the heat originated from the reaction and the contribution of the heating system. We expose the experimental validation of these calculations in Section 4. According to these simulations, this reactive system is ideal for the determination of the dynamic effects of the Sabatier reaction. On the contrary, the presence of a remarkable hotspot in this configuration makes the system unsuitable for the kinetic analysis of the system. If the target of the study is the kinetic modeling of the reaction over the 2% Ru/Al2O3 catalyst, this hotspot should be removed, for example by diluting the catalyst with inert material. Another possibility would involve the dilution of reactant with inert gas, but the influence of this addition on IR transmittance must be verified to avoid undesired effects.
3.3. Experimental Design Routine for IR Thermography Tests
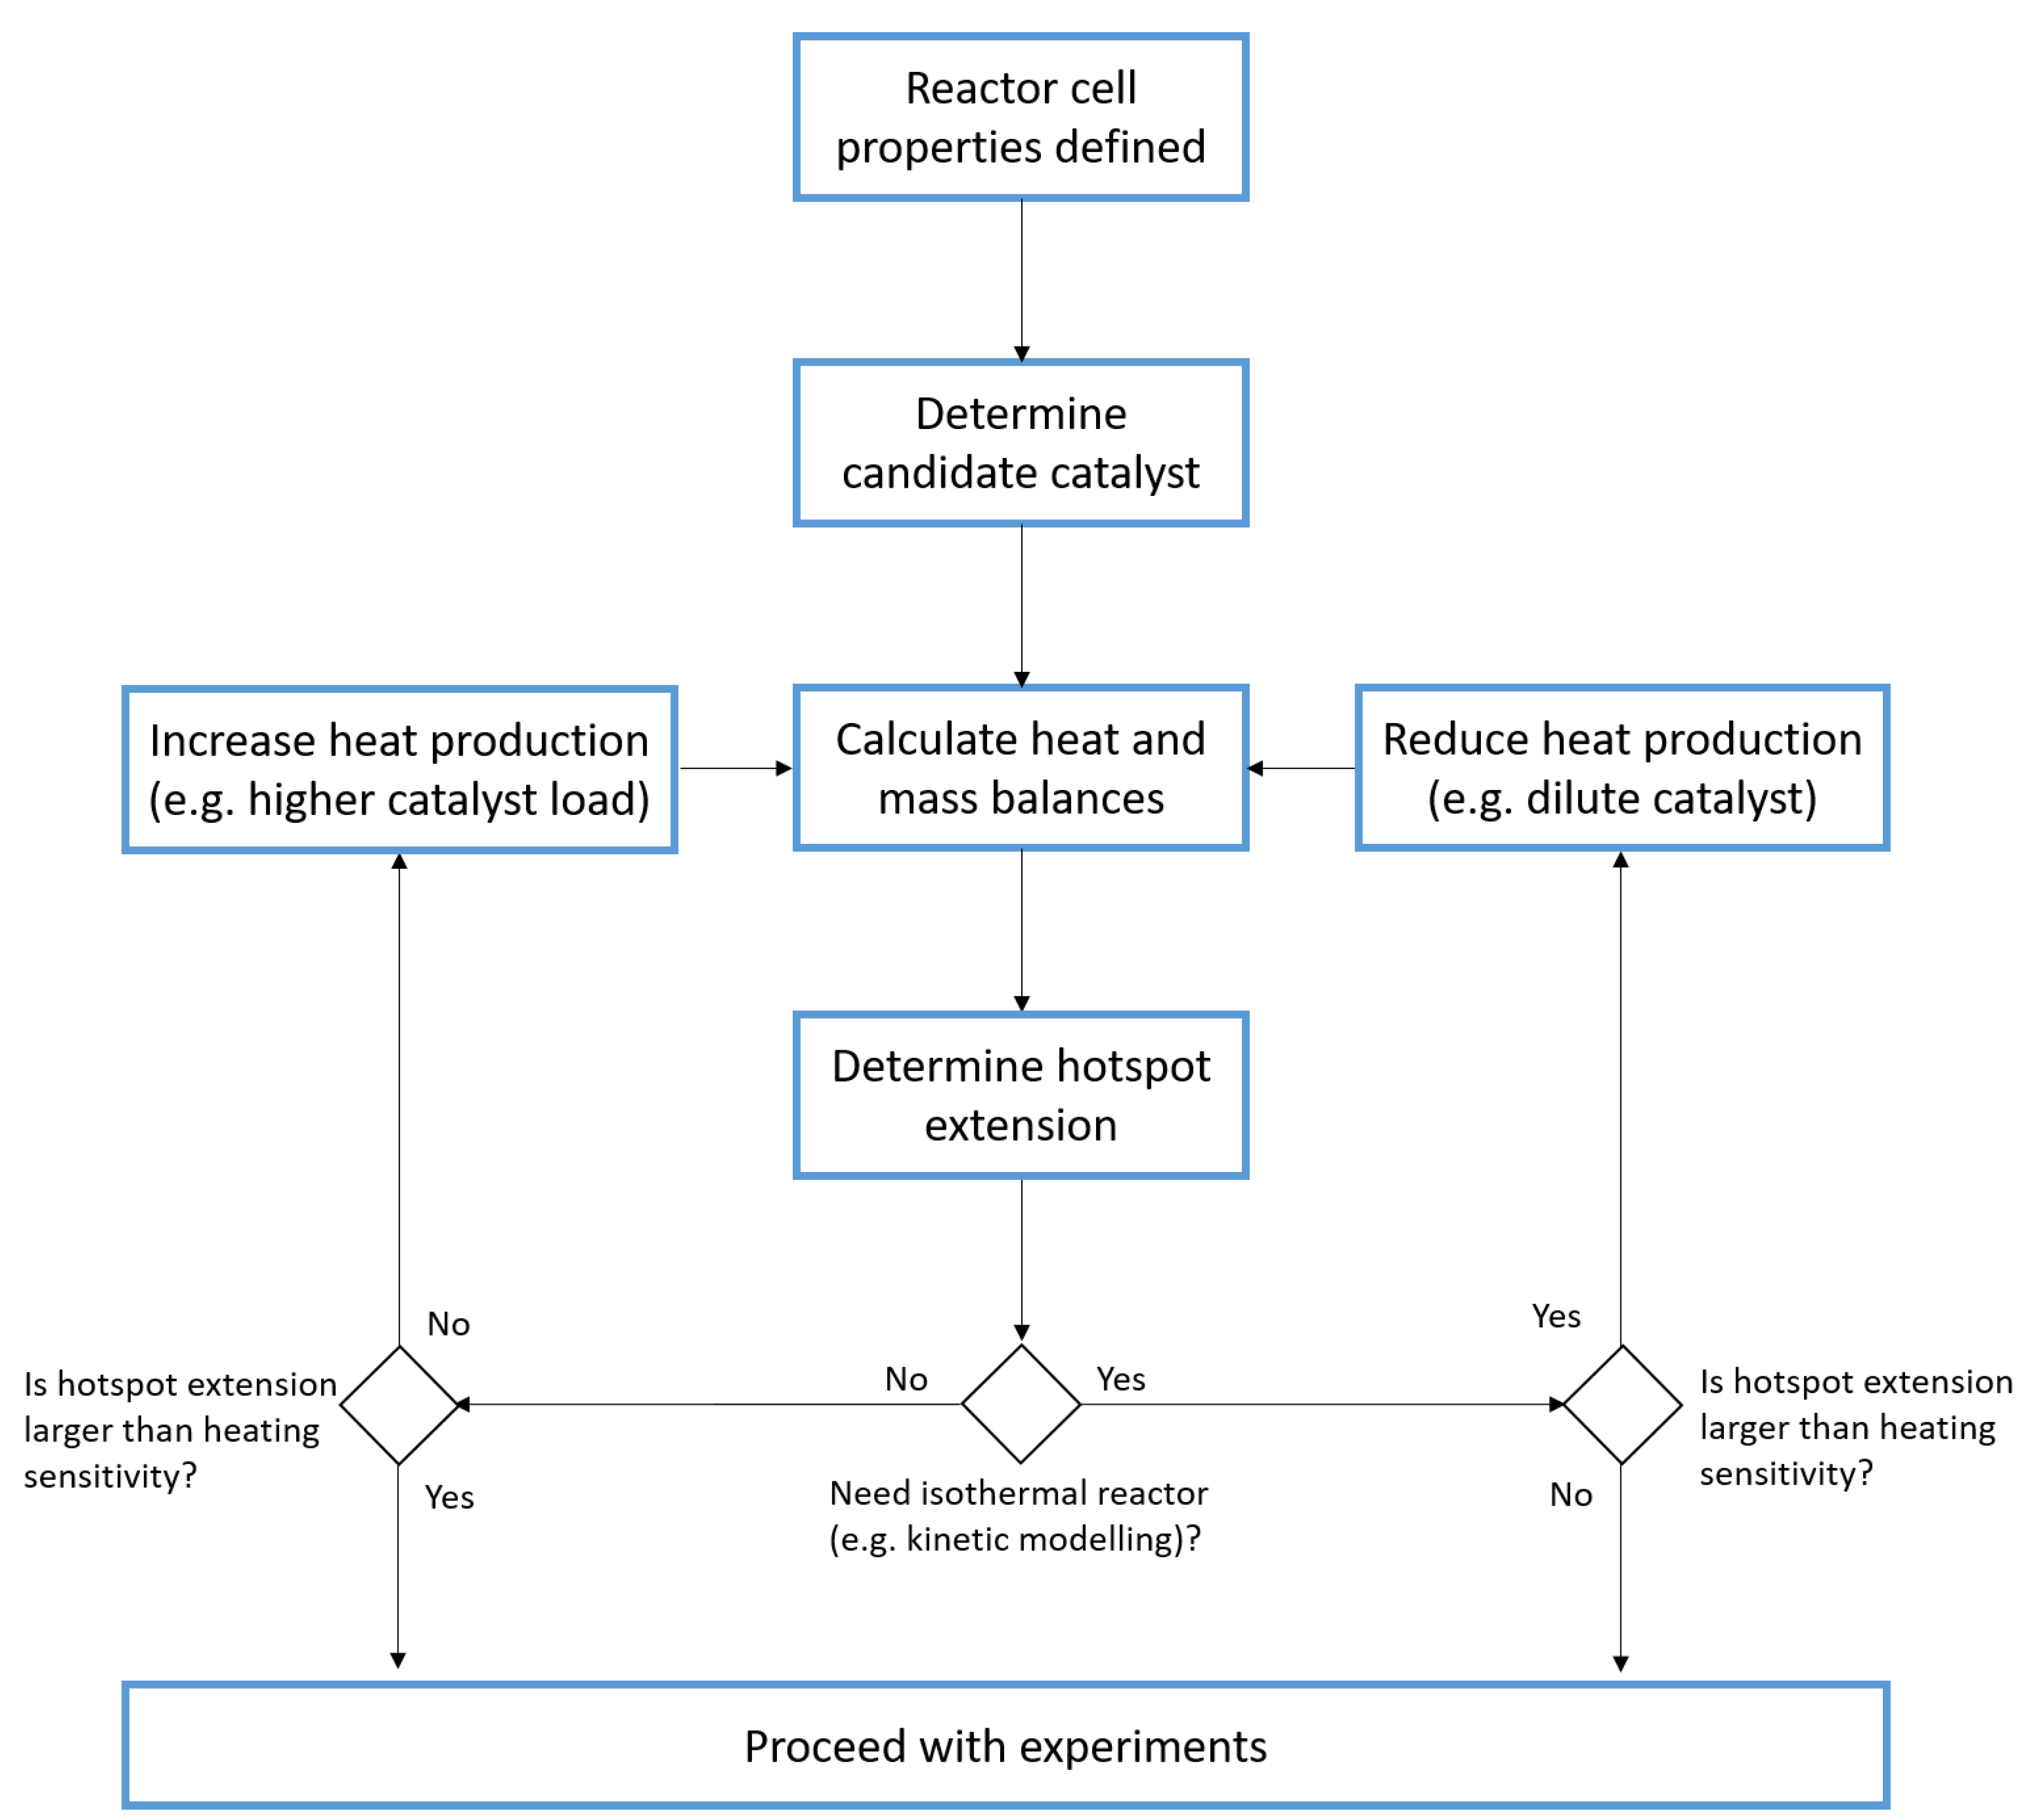
This initial screening is fundamental to determine the suitability of an experimental setup and of a catalytic system for the target application. Even though the preliminary results are not sufficient for a detailed formal analysis of the system, they can significantly increase the probability of success in the IR thermography experiments. In particular, the determination of an appropriate experimental design can decrease the number of experiments required for the target application, allowing for significant cost and time savings. On the base of the considerations exposed in this section, we developed a decision tree for the experimental design of IR thermography tests, which is reported in Figure 7. The initial point of the experimental design follows the determination of the characteristics of the IR thermography hardware, as described in Section 2 (IR camera and IR cell). These tools fix the most important properties for the determination of the heat transfer properties, such as transmissivity and gas flow ranges. On the base of the hardware available, it is possible to select a first candidate catalytic material for the experiments. With the catalyst and reactor properties, it is possible to operate a first approximate simulation of the reaction in the IR cell. This allows the determination of the extension of the reaction hotspot, which is the main parameter to consider for further experimental design. According to the target of the experiments, an isothermal or a non-isothermal reactor may be needed.
Determination of Reactor Requirements
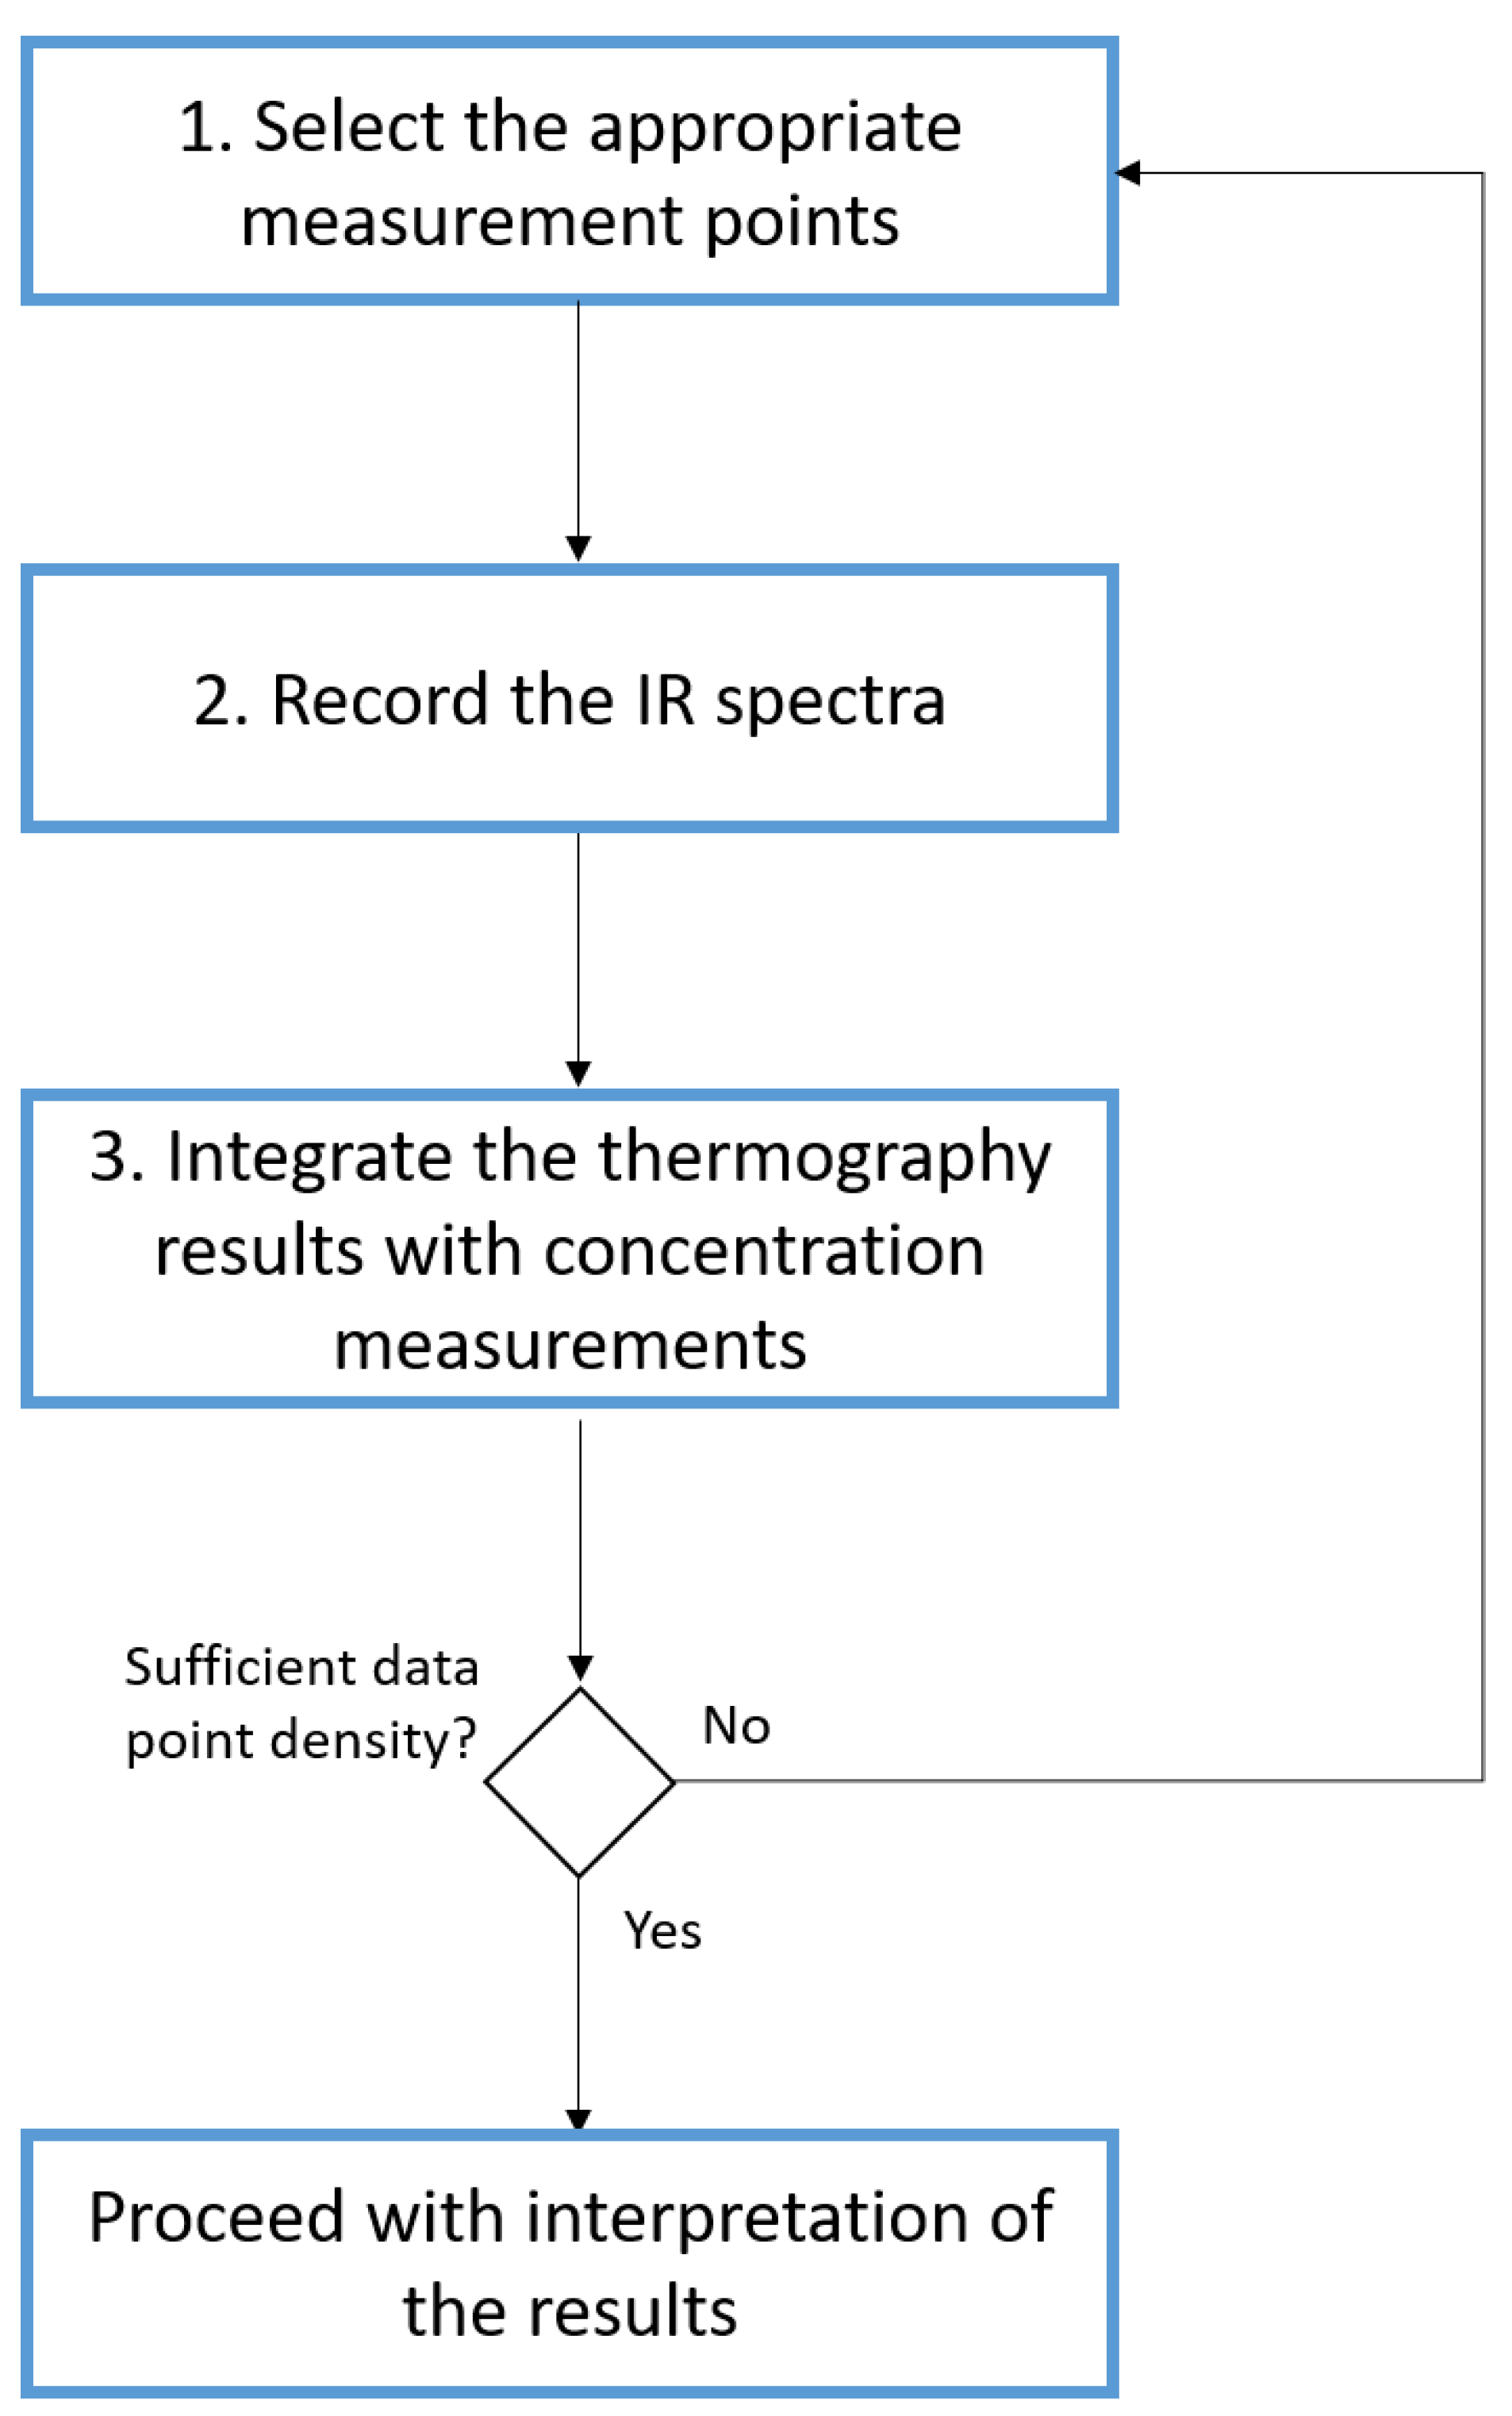
In the former case, which is typical of kinetic modeling experiments, the hotspot (i.e., the zones on the catalytic surface with temperature above the background level) should be limited, so as not to damage the experimental results with parasitic effects present in the hotspot. The critical threshold for the system can be set to a temperature variation in the hotspot equal to 1 K. This temperature is chosen as it is a typical oscillation of a common heating system (see Section 2.2.2). If the calculated difference between the set and the measured temperature is larger than 1 K, it is appropriate to take measures to decrease this phenomenon, for example by diluting the catalyst or the reactive gas flow. In the case of non-isothermal experiments, the situation is reversed. If the calculated hotspot temperature is below 1 K (i.e., the system appears substantially isothermal), it will be necessary to increase the heat production of the system to ensure that the phenomena to investigate are well visible and distinguished. In this case, this can be achieved by increasing the reaction rate (e.g., by using a catalyst with higher load of active phase) or by decreasing the heat losses (e.g., by decreasing the temperature difference between the two sides of the window). Upon verification of all the conditions in the decision tree, the assumptions can be validated by appropriate IR thermography experiments. In Figure 8, a procedure for the realization of these tests is elucidated. IR cameras can determine the temperature of every single pixel in its focal view, but not all these points have a relevance for the analysis. Hence, only the necessary data points should be collected through the IR camera acquisition software. In our case (referring to the picture of Figure 5a), we selected 13 equally spaced points on the middle axis of the reactor. This is reasonable in most of the laboratory experiments, as the axis of the reactor is the stationary point of the Poiseuille curve of laminar flow in the reactor and therefore the location with lowest influence of the borders of the reactors. The selection of these limited amount of data points facilitates the analysis and diminish the need for storage, without decreasing the significance of the experimental dataset. Only in specific applications, such as the validation of CFD calculations, can the entire focal view be of interest. Once the measurement points are selected, the experiment can be performed and the temperature field is recorded (step 2 of Figure 8). In our case study, the presence of a Poiseuille curve for laminar flow during the experiment is evident, confirming the need for recording the data points on the middle axis of the reactor (see Section 4.2). An appropriate time spacing of the recordings should be defined, in order to compromise between the significance of the data and the amount of data recorded. For fast dynamic experiments, an interval of 1 s or lower is suitable. However, for phenomena occurring over large time scales, recording times up to minutes can be appropriate. This is the case, for example, of the analysis of catalyst deactivation [9]. As a last step of the analysis, the temperature data are integrated with appropriate concentration measurements (Figure 8, panel 3). As mentioned in Section 2.2.3, these concentration profiles must be consistent with the temperature measurements and may determine the time scale of the analysis. The coupling of these two analysis opens the way to the detailed investigation of chemical phenomena, with large resolution in time a space. The power of this experimental tool is elucidated in the following section with some specific case studies, concerning both dynamic and steady state catalytic processes.
4. Examples of IR Thermography Experiments
This section is dedicated to the elucidation of selected experimental results obtained with the methodology presented in the previous sections. The complete dataset is accessible in our previous work [18]. The goal of this section is the validation of the methodology with relevant experimental results. Therefore, we focus on specific aspects of the experimental results that elucidate the importance of an appropriate design of the experimental setup in the achievement of significant results.
4.1. Experimental Setup
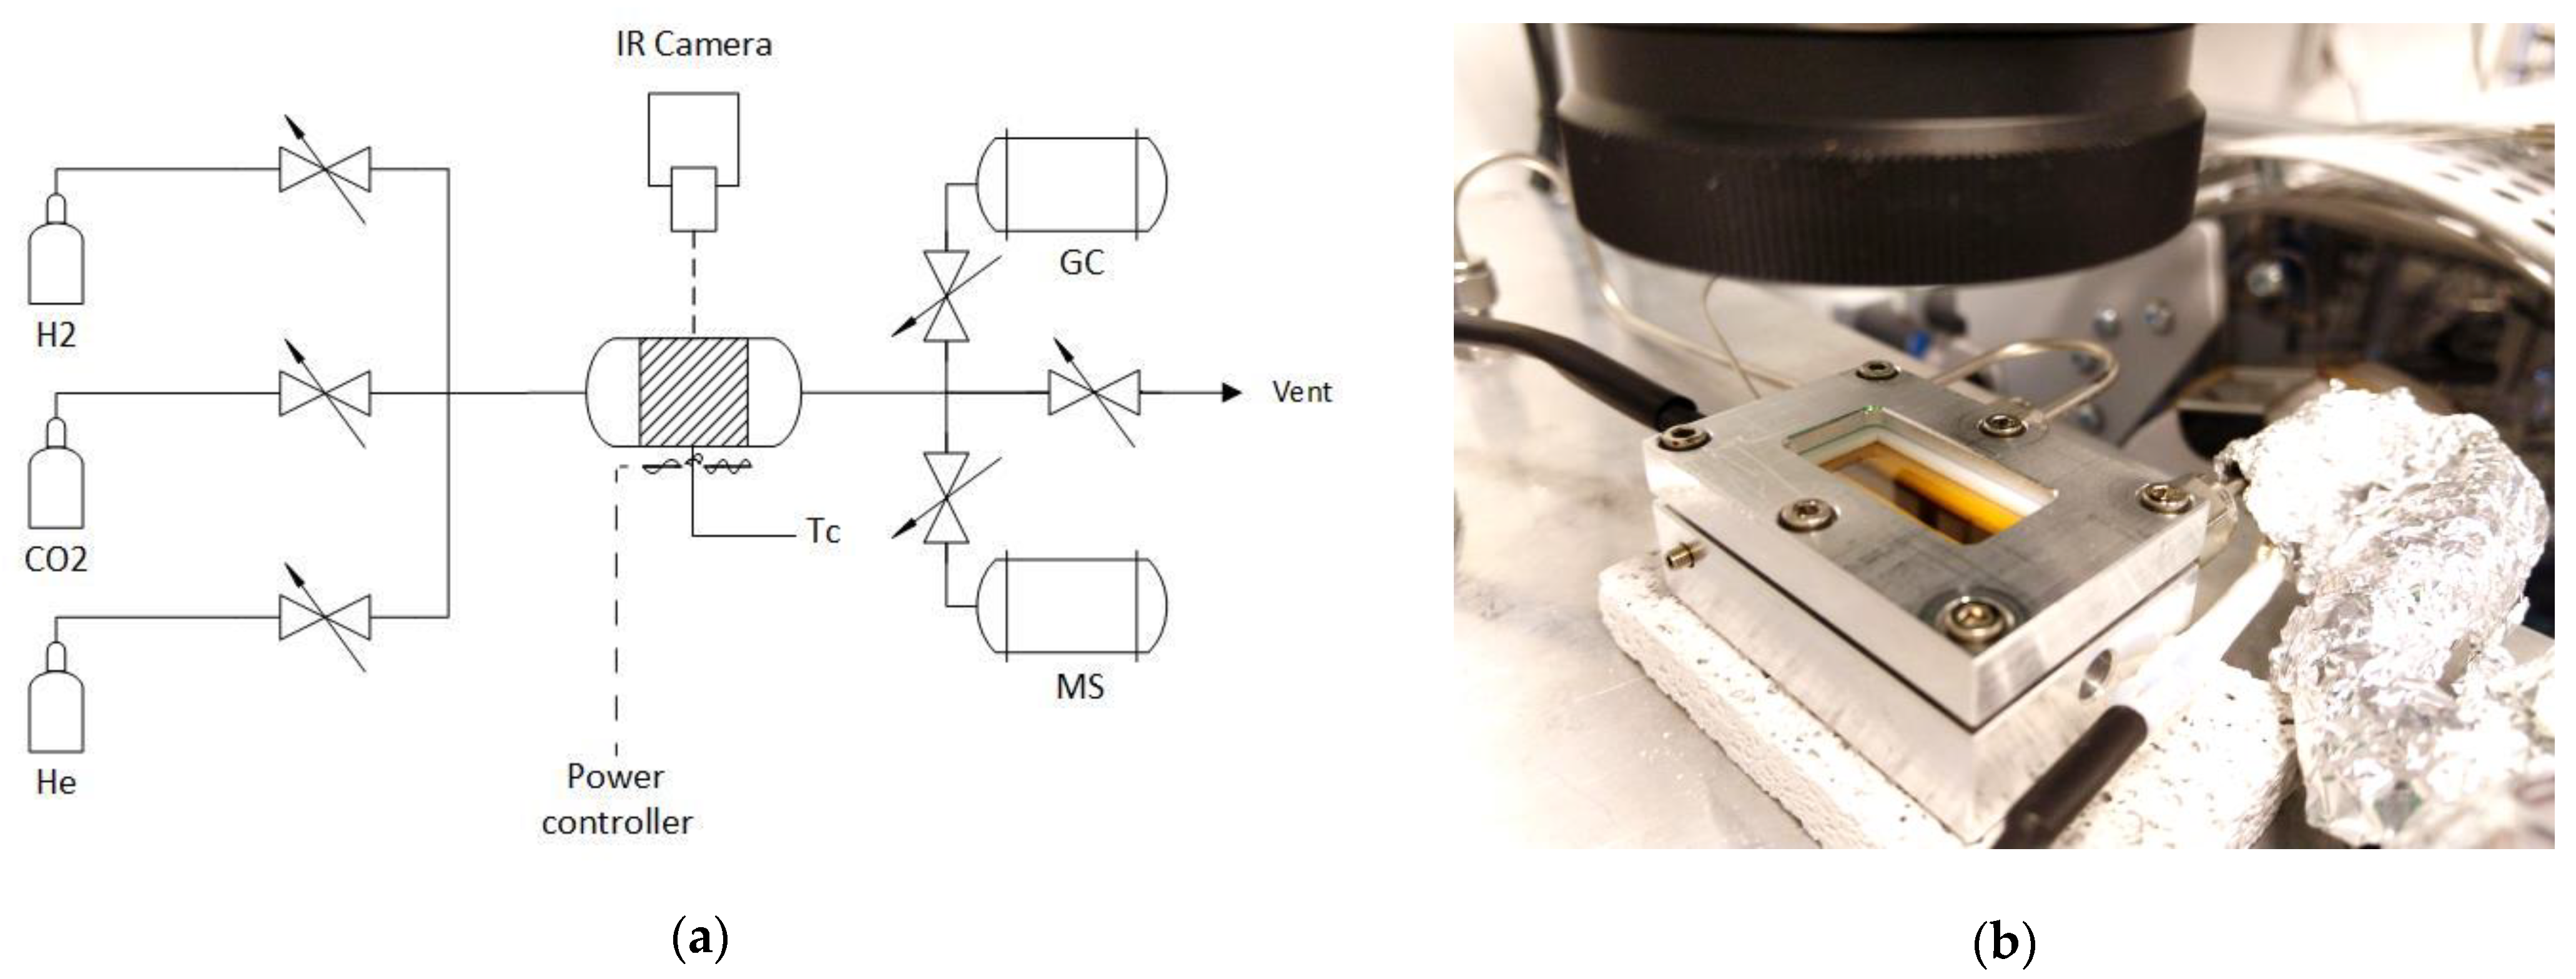
Figure 9 shows the flow diagram of the experimental setup and a picture of the installed reaction cell together with the IR camera. The reaction cell is manufactured from aluminum and is equipped with a zinc selenide window. The catalyst bed is placed below this window. A round heating cartridge (Maxiwatt, Spain) with a maximal power of 250 W is placed below the catalyst bed. A Jumo Imago 500 controller (Fulda, Germany) adapts the power of the heating cartridge to ensure a stable and constant power input. The IR camera used in the experiments is a VarioCAM hr from InfraTec (Dresden, Germany). The camera is operated through the software IRBIS 3.1 PRO, directly provided by the camera supplier. Calibration of the camera was performed in He flow, by adapting the reaction cell temperature between 25 and 280 °C and comparing the measurements with the value recorded by a K-type thermocouple placed below the catalyst bed. Thanks to the calibration procedure, the IRBIS software provides the conversion of the recorded IR spectra into temperature profiles. In order to do so, the apparent emissivity of the system employed is calculated. This parameter measures the amount of IR radiation emitted by the catalyst and not absorbed by the window (i.e., the amount of IR radiation that reaches the camera). For the system here employed, the apparent emissivity is 0.85. The emissivity here calculated includes the emissivity of the 2% Ru/Al2O3 catalyst, reduced by the effect of the window. As the system remained unchanged in all the experiments, we kept a constant value of apparent emissivity. It must be underlined that the emissivity value may vary when using a different window. The reaction cell is loaded with 172 mg of the catalyst. The catalyst is prepared by incipient wetness impregnation following the recipe elucidated in [37]. For a complete overview of the experimental setup, and for further details on the catalyst characterization, please refer to our previous study [18]. The reaction products are analyzed by means of mass spectroscopy (MS). The MS instrument is a Pfeiffer Omnistar GSD320 (Pfeiffer Vacuum (Schweiz), Switzerland). In order to achieve a fast sampling speed (20 ms per spectrum), the MS analysis is limited to the relevant mass for the Sabatier reaction experiments, referring to CH4, CO2, CO and H2 (i.e., m/z 2, 4, 15, 18, 28, 44). The absence of other species in the product stream was verified in preliminary screening experiments where the temperature was slowly risen while a broad m/z spectra between 1 and 100 m/z was scanned. The procedure for quantitative analysis of the MS spectra through the Faraday detector follows our previously developed methodology [34].
4.2. Surface Reduction Experiments
When exposed to an oxidizing atmosphere (e.g., during storage), the Ru/Al2O3 catalyst tends to be superficially oxidized. Therefore, prior to any further experiment, the metallic composition of the catalyst must be recovered by reacting the surface oxygen with H2, following the reaction:
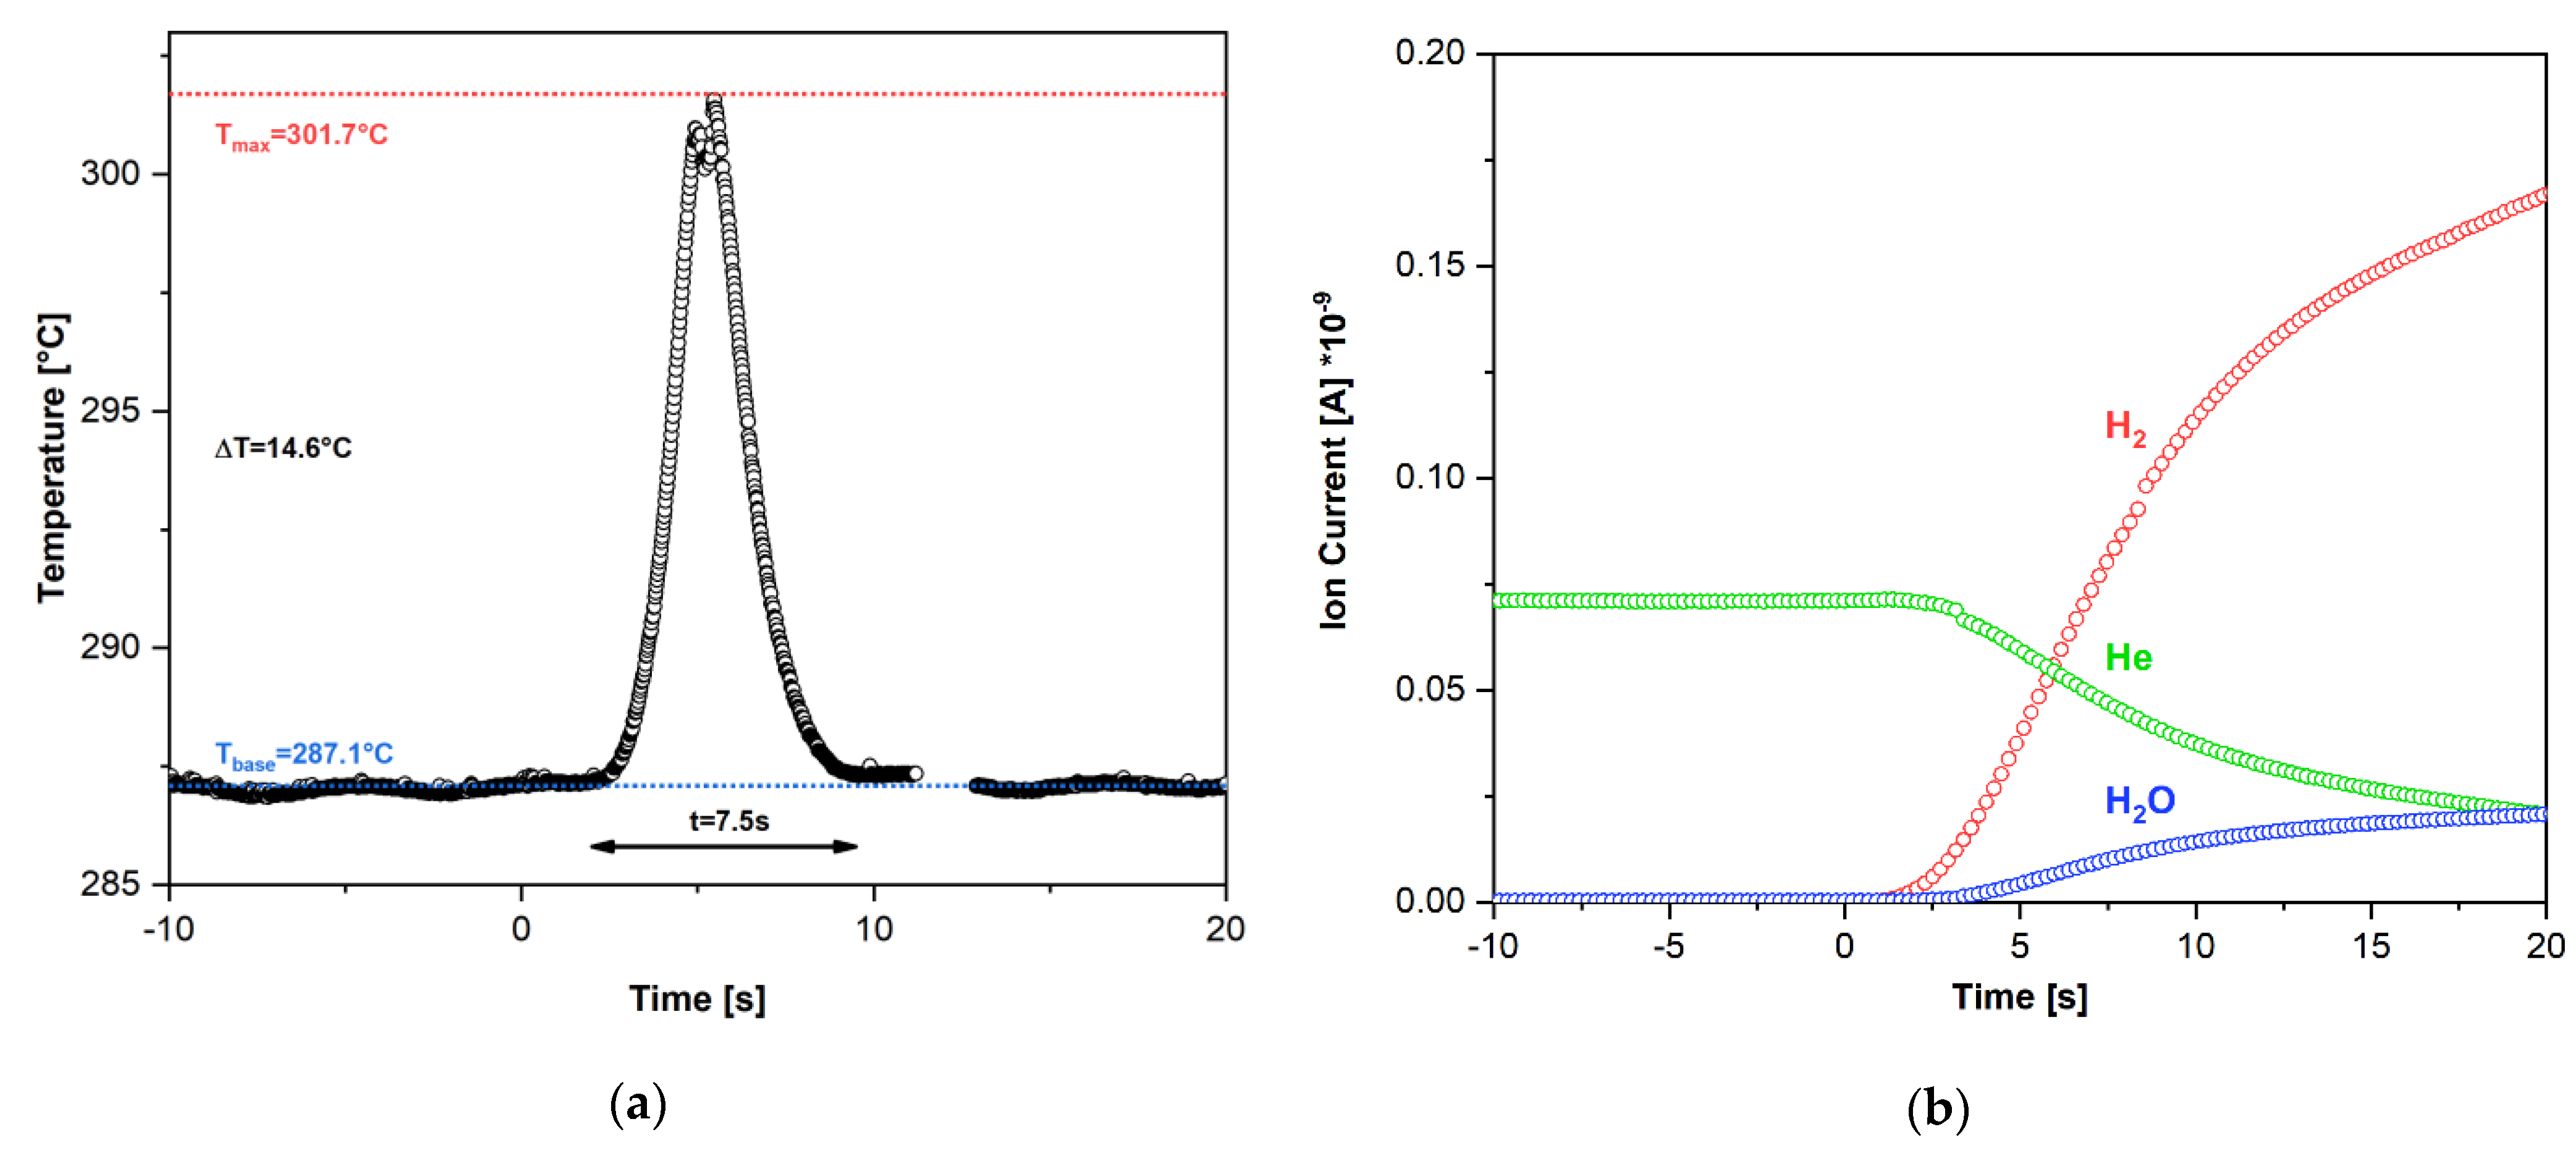
refers to the oxidized form of the Ru catalyst (hence containing adsorbed oxygen). This reaction is highly exothermal and takes place until full reduction of the catalytic surface. A specific procedure for the surface reduction of the catalyst was developed in our previous studies [19,20]. In general, a temperature programmed surface reaction (TPR) is operated to completely remove the oxygen from the catalytic surface, heating the sample from room temperature to 700 °C. However, the reaction takes mainly place in a limited temperature interval, which can be accurately determined thanks to IR thermography. In fact, Reaction (6) is fast and exothermal, so that its occurrence is easy to detect by recording the temperature change on the catalyst surface, but the extension of the reaction can be observed only with an instrument with sufficiently high sampling rate. Thus, the temperature of activation of the surface reduction can be determined by recording with the IR camera the TPR experiment. Preliminary experiments showed that, for the catalyst of this study exposed to the atmosphere, the H2 reduction activation temperature is ca. 290 °C. Hence, we set the baseline temperature of the reaction cell loaded with the oxidized catalyst at this temperature and we fed 10 mL/min of H2. The raw IR thermography data recorded during the surface reduction are reported in Video S1. The recorded temperature at the center of the reactor on the middle axis are displayed in Figure 10a. The temperature used for further elaboration is recorded on the axis of the reaction in order to minimize the influence of wall effects from the laminar flow, which are evident in the full raw IR data. We did not measure a significant change in the emissivity of the catalyst, due to the limited amount of active phase (0.5 to 2%). Furthermore, re-calibration of the system with the fully reduced catalyst shows the same emissivity value as the oxidized catalyst. The corresponding MS spectra are shown in Figure 10b. The complete phenomenon takes place in ca. 7.5 s. During this time, the temperature measured is higher than the baseline temperature. Initially, the temperature rises from the baseline due to the activation of the reaction, showing an initial thermal runaway. When the oxygen on the surface starts depleting, the reaction rate decreases, forming a maximum in the recorded temperature. The extent of the temperature hotspot is ca. 14.6 °C. The temperature decreases then quickly, for the rapid deactivation of the reaction due to full consumption of oxygen. The comparison with the MS spectra recorded at the reactor outlet shows a good agreement with the thermography measurements. In fact, the MS spectra show a progressive increase in the production of H2O, with a clear flex after ca. 7 s. The IR spectra reach steady state conditions after 20 s. This longer time to steady state is due to the presence of dead volumes between the reactor and the spectrometer and reflects the intrinsic averaging occurring in the MS. In fact, while the temperature is recorded exclusively on the reactor axis, the gas concentration is averaged on the entire cross section of the reactor. Therefore, the resulting concentration profile contains particles that underwent different residence times in the reactor and should be considered with care to avoid misinterpretation of the results. This example shows how the different resolution between IR thermography and other analytical techniques challenges the interpretation of results. For example, the use temperature data taken from a punctual location in the reaction may not agree with integral concentration data due to the non-ideality of the system. However, the high resolution of IR thermography is a fundamental help in the characterization of the transient phenomena. Further elaboration of the combined temperature and concentration profile can open the way to the determination of further properties of the system. As an example, by combining the information on the duration of the reaction and on H2 conversion, it was possible to calculate the surface coverage of the catalyst with oxygen, which was quantified as a single layer [18].
The use of IR thermography in the study of dynamic processes evolving towards a steady state can reveal more insights both in the way the system approaches the steady state and in the properties of the steady state operation. In order to elucidate the challenges and opportunities in the study of these kinds of processes, we report some exemplary results in the next section from the study of the Sabatier reaction.
4.3. Sabatier Reaction Experiments
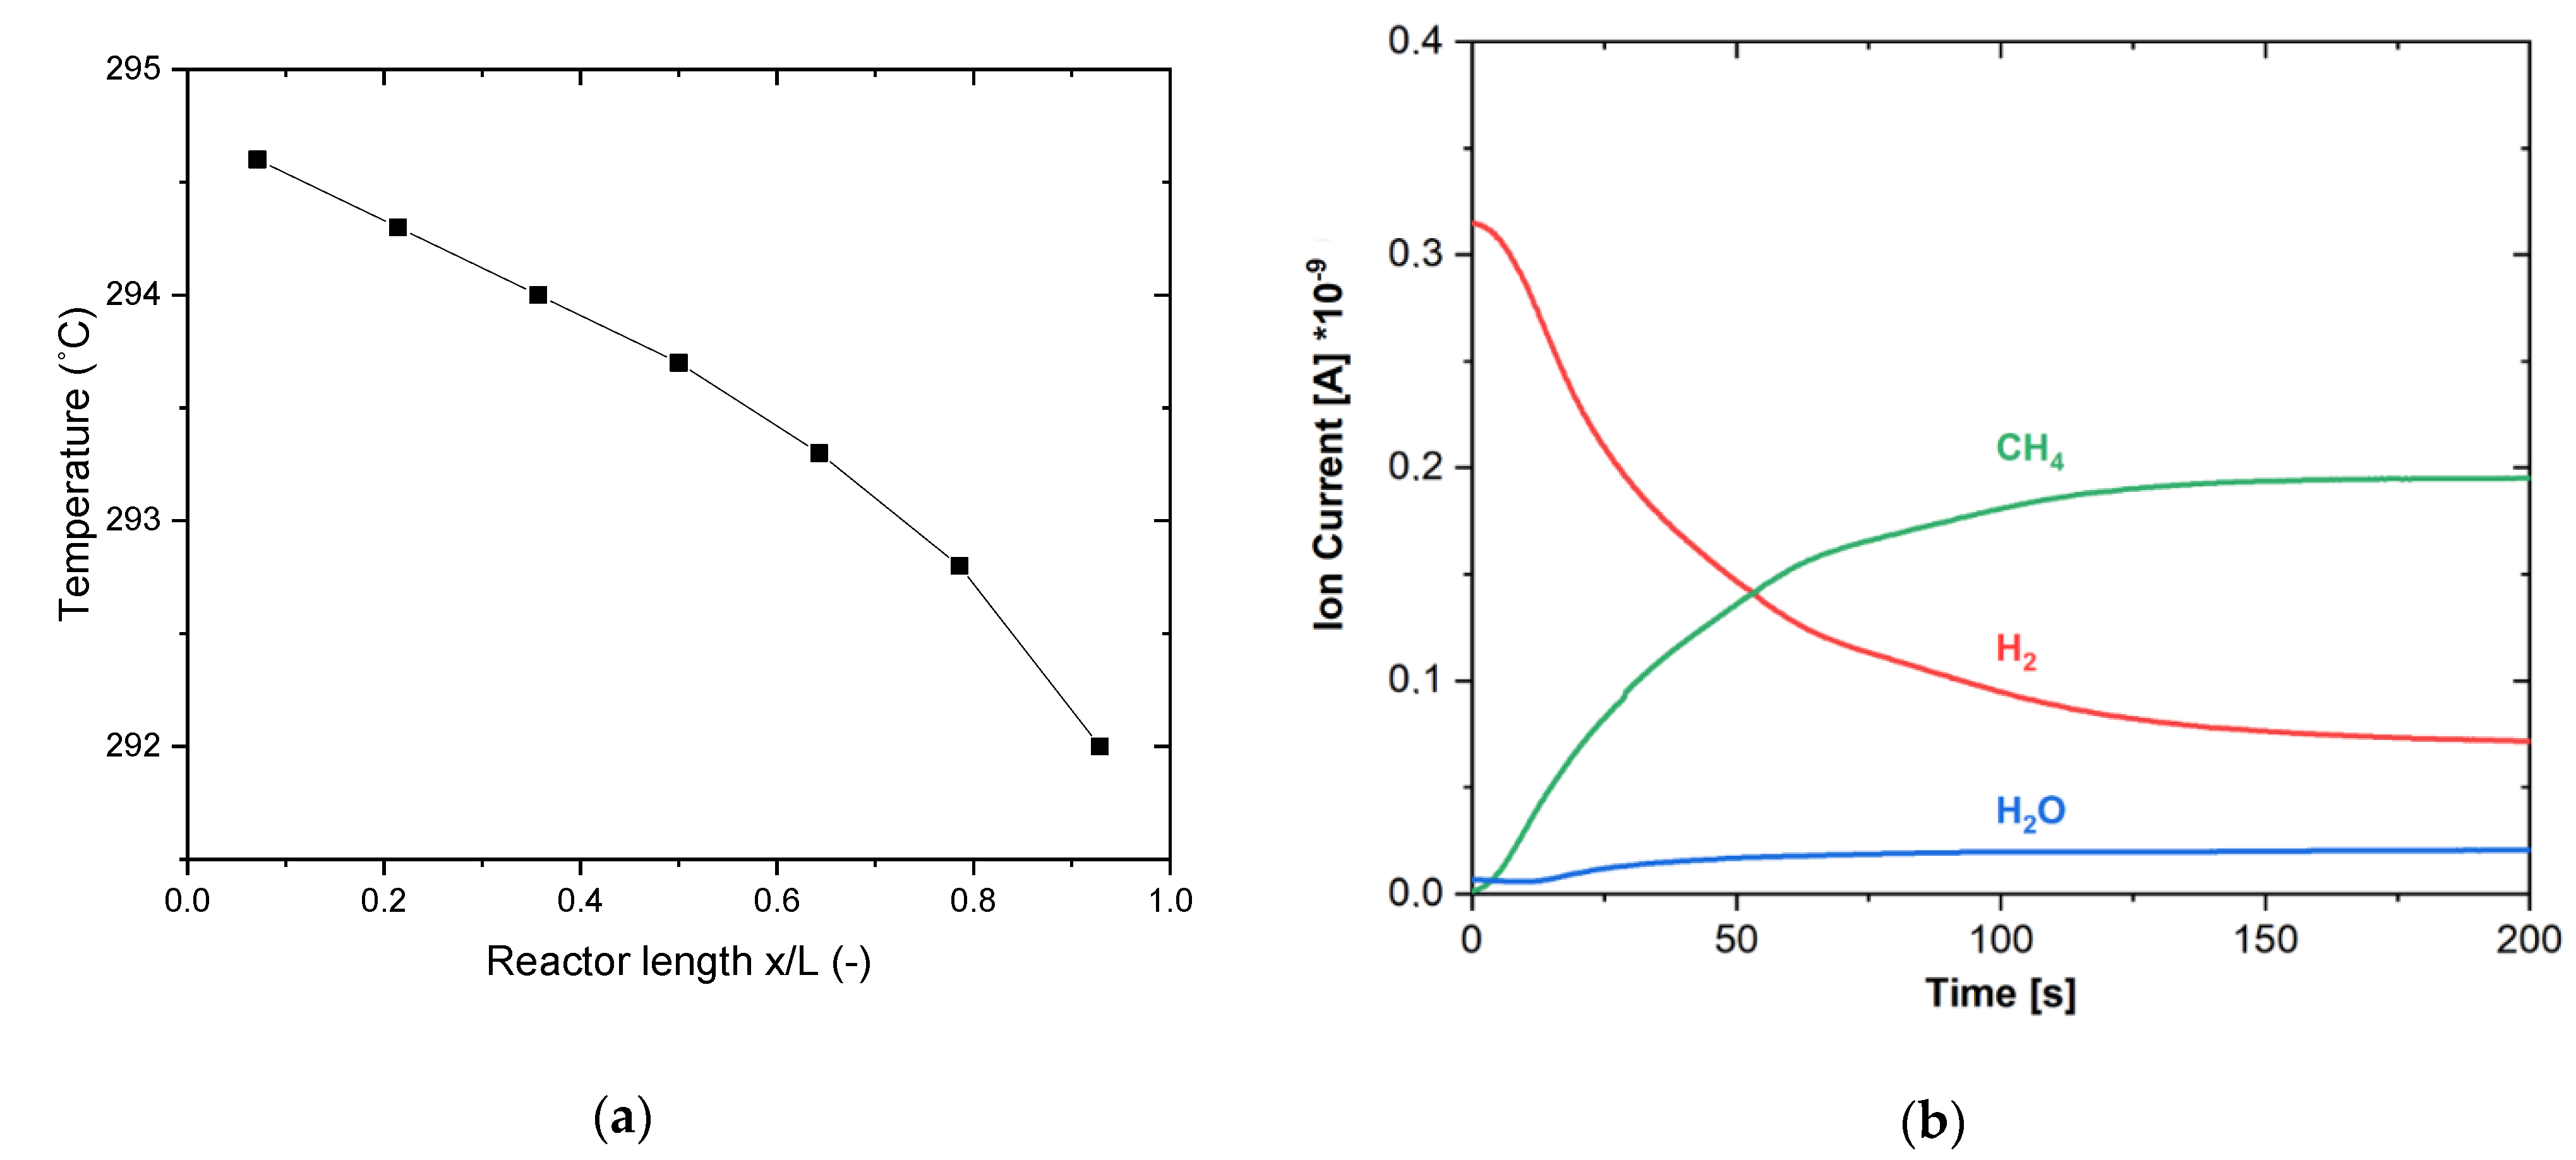
The analysis of the Sabatier reaction shows a double level of challenge, as the reactive phenomena involve both transient and steady state temperature variations. The entire thermograph of the Sabatier reaction experiment is reported in Video S2. Figure 11 shows the steady state temperature profile in the reactor, as well as the Ion currents recorded by the MS instrument over time. We can observe that, in the MS spectra, steady state conditions are reached after ca. 150 s. After this time, the reaction occurs in the reactor showing the characteristic temperature hotspot at the reactor inlet. The steady state concentration and temperature profiles are determined by the interplay of kinetics and thermodynamics [22]. In the lab-scale reaction cell, the extension of this hotspot is limited (ca. 2.5 °C), but it is revealed well by the IR camera. As explained in Section 3.2, the reaction cell was designed with the purpose of making this phenomenon visible. The experimental results are in good agreement with the preliminary modeling results and show the importance of an appropriate model-based experimental design to perform the experiments in a proper way and with the appropriate testing equipment. The quick change in the steady state temperature over the axial coordinate, in particular the closeness of the hotspot to the reactor inlet, makes the determination of the temperature profile by means of thermocouples quite challenging. In fact, even though a moving thermocouple is placed inside the reactor, the position of the hotspot remains difficult to locate and the presence of the thermocouple can influence the reaction. Furthermore, it may be difficult to distinguish the gas and the surface temperature [38]. Therefore, we demonstrate here that the use of IR thermography is an optimal solution for the study of highly exothermal reactions and for the recovery of useful kinetic information to be used in model based reactor design and optimization routines [9,39]. The required effort for the design of an appropriate reaction cell is compensated by the high quality of the obtained experimental data and can be minimized by the routines presented in this study.
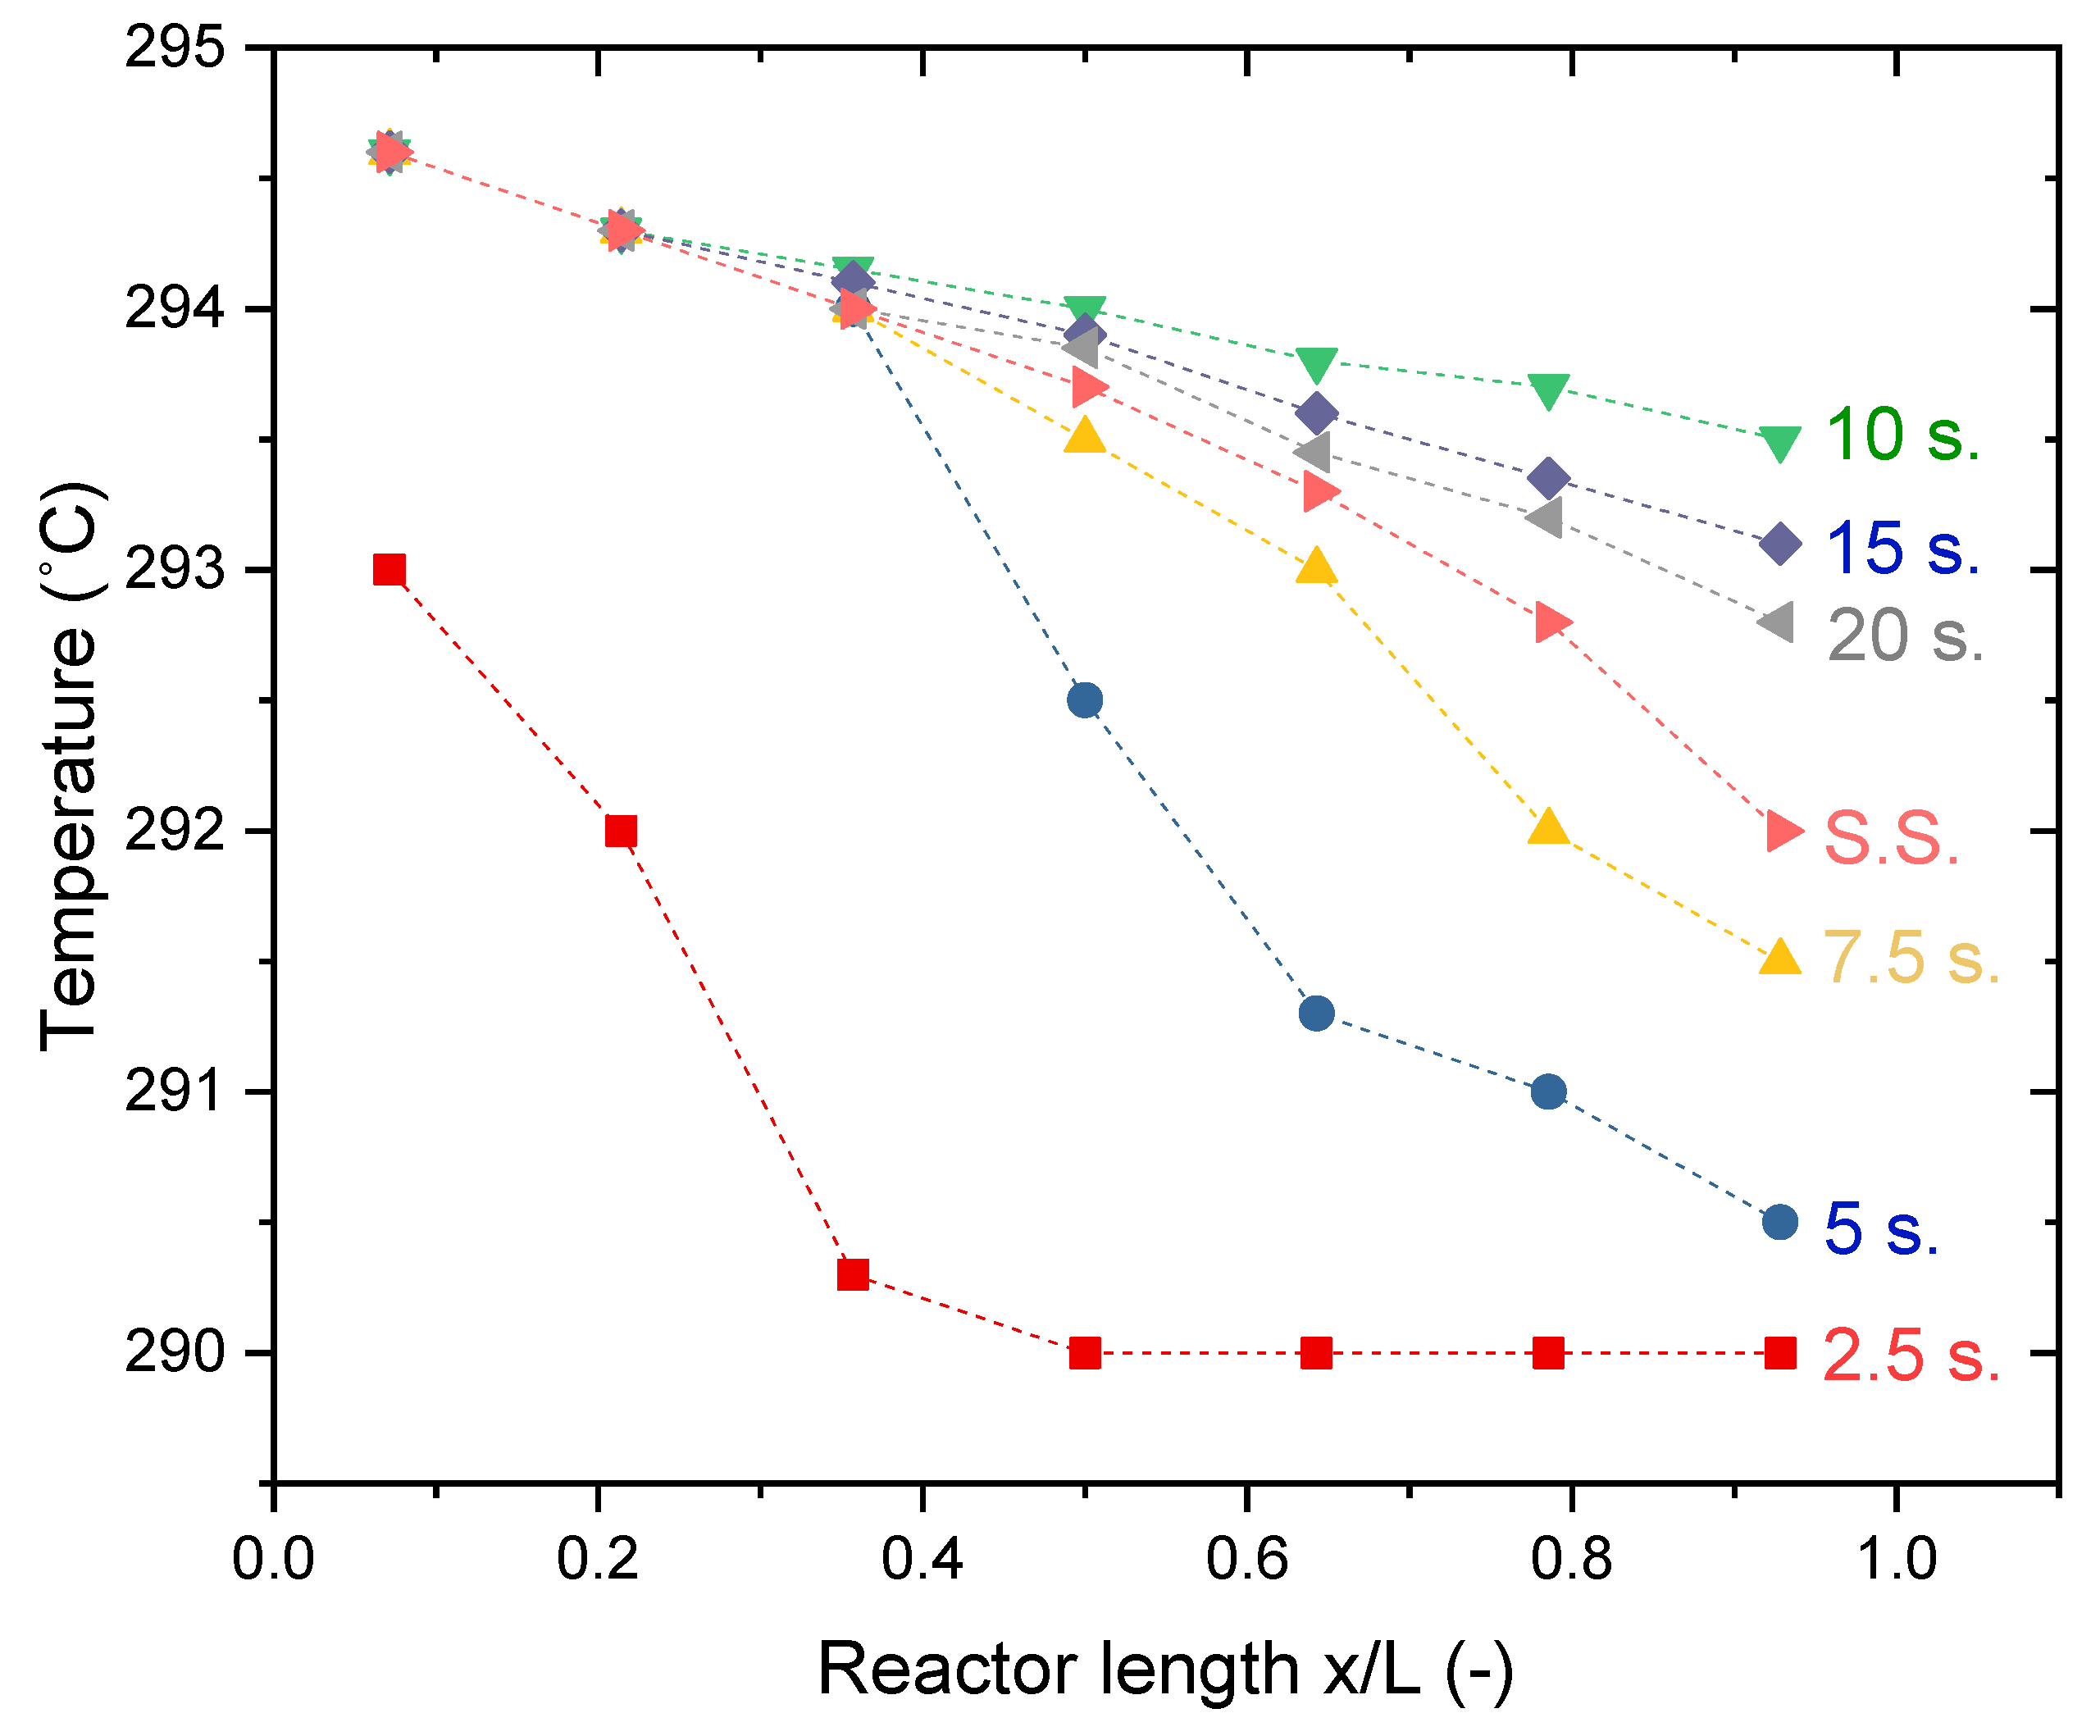
In addition to the steady state results, the designed experimental setup allows the observation of the Sabatier reaction during the initial transient. The evolution of the temperature profile upon feed of a stoichiometric H2/CO2 mixture over the reduced catalyst is shown in Figure 12. The raw thermography results are reported in the Supplementary Materials. The reaction starts immediately upon injection, as stated by the temperature profile after 2.5 s. Initially, only a small fraction of the reactor is involved in the reaction, because the remaining part is still filled with inert gas. When the inert gas is replaced on the entire reactor length, we observe that the temperature increases progressively, due to the course of the reaction heating up the catalyst. The first three measurement points considered quickly reach the steady state conditions, while the rest of the reactor undergoes the formation of a transient hotspot. We observe that the entire catalyst bed reaches a temperature above 294 °C after 10 s and that the temperature at the end of the reactor progressively decreases afterwards. This progressive cooling of the reactor evolves towards the steady state temperature profile afterwards until reaching the steady state conditions, as described above and in Figure 11a. An explanation of this phenomenon can be found by integrating the temperature profiles with the information on product concentration from Figure 11b. The catalyst is initially fully reduced, therefore no oxygen containing species are present on the surface. Hence, upon feed of the stoichiometric H2/CO2 mixture, the local H2 concentration results over-stoichiometric. This shifts the thermodynamic equilibrium, allowing for a higher conversion than in steady state conditions. In this phase, all the O2 fed in the form of CO2 is converted into oxygenated surface species and no H2O product is formed, as visible in Figure 11b (first 10–20 s of the reaction). When the local equilibrium between reduced and oxidized surface species is reached (details about the nature of these species can be found in our previous studies [40,41]), the reaction reaches the steady state conditions, with the characteristics described above.
These examples show how the effective coupling of IR thermography and fast concentration measurements (e.g., by means of MS) allows the efficient performance of transient and steady state experiments, recovering a large amount of high-quality experimental data with low experimental effort (i.e., minimizing the need for manual interaction with the system). Furthermore, the raw data contain a much larger amount of points in the time and space scale, which can be further elaborated later, if required. Additionally, as important advantage compared to standard temperature measurement techniques, the position of the analyzed measurement point can be changed anytime, increasing the robustness of the experimental procedure and reducing the requirement of repeated measurements, thus minimizing the effort for the experimental campaign.
5. Conclusions
In this paper, we derived a systematic methodology for the use of IR thermography in chemical reaction engineering. We defined the requirements of an experimental system to appropriately record the chemical phenomena and to avoid the influence of external occurrences on the measurements. To this scope, we elucidated the characteristics necessary for the reaction cell used in the experiments and the ideal experimental conditions to achieve during the measurements. Furthermore, we provided selected examples of IR thermography experiments to investigate the Sabatier reaction and the lessons learned from these experiments.
IR thermography appears as an ideal tool for the advancement of catalysis and chemical reaction engineering, thanks to the intrinsic capability of providing new insights thanks to the high resolution both in space and in time. In this sense, it can give an important contribution towards development of high-throughput experimental techniques. However, in this paper we observed that the implementation of the technique is challenging and some aspects in the design of the experimental setup must be correctly addressed:
- The IR camera must be chosen in agreement with the temperature of the application and appropriately calibrated. Most of the IR thermography applications in catalysis require that the camera can follow a large temperature window without incurring in signal saturation problems.
- The experimental setup must fulfill both requirements of IR transparency and withstand the process pressure. As a tradeoff exists between IR transmittance and thickness of the window, the appropriate material must be selected. Several materials are appropriate to this scope and should be screened with the routines derived in Section 2 to find the most suitable one.
- The reaction cell must be heated with the appropriate system (i.e., in power control) to avoid contamination of the experimental results by external factors. Additionally, particular attention should be posed to the insulation of the system to avoid the formation of excessive temperature gradients between the two sides of the window. Several heating methods such as cartridge heaters, heating plates and IR transmitting ovens were discussed.
Furthermore, the characteristics of the reaction cell must match the requirements of the reactive system investigated, that is:
- The system must be able to record the effects of the chemical reaction on the catalyst temperature. This means that the oscillation of the temperature baseline must not cover the hotspot of the chemical reaction and the latter must be sufficient to compensate for the heat loss by convection and radiation.
- The system can be optimized prior to the investigation with a model based experimental design routine, so that the experimental effort is minimized by avoiding the trial and error approach. In this sense, we proposed a model-based experimental design routine in Section 3, validated with the case studies presented in this paper.
We observed that, with the help of IR thermography, the investigation of exothermic reactions, such as the Sabatier reaction, could be performed with an important reduction of the experimental effort. This is possible because large datasets of transient and steady state temperature measurements can be obtained from a single experiment, if the system and the experiments are designed appropriately. Hence, the amount of resources required for the preparation of an experimental dataset at the base of a kinetic modeling routine can be substantially reduced and the quality of the data used for model validation and optimization purposes can be greatly improved thanks to the high time and space resolution. We thus expect that IR thermography will play an important role in the advancement of catalysis and chemical reaction engineering in the future, guiding the development of new experimental and numerical methodologies for laboratory and industrial practice.
Supplementary Materials
The following are available online at https://0-www-mdpi-com.brum.beds.ac.uk/2073-4344/11/3/311/s1, details on the reactor model used, modeling of the reaction cell. Video S1: thermograph of the surface reduction. Video S2 thermograph of the Sabatier reaction experiment.
Author Contributions
R.M., conceptualization, methodology, investigation, formal analysis, writing—review and editing. E.M., conceptualization, investigation, formal analysis, data curation, writing—original draft preparation, resources, funding acquisition. All authors have read and agreed to the published version of the manuscript.
Funding
This research received no external funding. The APC was funded by the Lib4Ri library of the research institutes of the ETH Domain (CH).
Data Availability Statement
Data is contained within the article or supplementary material. Additional data on catalyst characterization are available in [18].
Acknowledgments
We thank the organizers of the EFCATS Summer School 2020 for the invitation to contribute to this special issue and the Lib4Ri library of the research institutes of the ETH Domain (CH) for the support to publish open access. We thank three anonymous reviewers for the useful inputs provided during peer-review.
Conflicts of Interest
The authors declare no conflict of interest.
References
- Frenken, J.; Groot, I. Operando Research in Heterogeneous Catalysis; Springer International Publishing AG: Cham, Switzerland, 2017; ISBN 978-3-319-44437-6. [Google Scholar]
- Ring, E.F.J. The historical development of thermometry and thermal imaging in medicine. J. Med. Eng. Technol. 2006, 30, 192–198. [Google Scholar] [CrossRef]
- Green, T.C.; Gresh, R.H.; Cochran, D.A.; Crobar, K.A.; Blass, P.M.; Ostrowski, A.D.; Campbell, D.J.; Xie, C.; Torelli, A.T. Invisibility Cloaks and Hot Reactions: Applying Infrared Thermography in the Chemistry Education Laboratory. J. Chem. Educ. 2020, 97, 710–718. [Google Scholar] [CrossRef]
- Lucchi, E. Applications of the infrared thermography in the energy audit of buildings: A review. Renew. Sustain. Energy Rev. 2018, 82, 3077–3090. [Google Scholar] [CrossRef]
- Milovanović, B.; Pečur, I.B. Review of active IR thermography for detection and characterization of defects in reinforced concrete. J. Imaging 2016, 2, 11. [Google Scholar] [CrossRef]
- Ring, F.J.; Ring, F.J. Pioneering progress in infrared imaging in medicine Pioneering progress in infrared imaging in medicine. Quant. Infrared Thermogr. J. 2014, 11, 57–65. [Google Scholar] [CrossRef]
- Razeghi, M.; Nguyen, B.M. Advances in mid-infrared detection and imaging: A key issues review. Rep. Prog. Phys. 2014, 77. [Google Scholar] [CrossRef]
- Deane, S.; Avdelidis, N.P.; Ibarra-Castanedo, C.; Zhang, H.; Nezhad, H.Y.; Williamson, A.A.; Mackley, T.; Maldague, X.; Tsourdos, A.; Nooralishahi, P. Comparison of cooled and uncooled ir sensors by means of signal-to-noise ratio for ndt diagnostics of aerospace grade composites. Sensors 2020, 20, 3381. [Google Scholar] [CrossRef] [PubMed]
- Schüler, C.; Wolf, M.; Hinrichsen, O. Contactless temperature measurements under static and dynamic reaction conditions in a single-pass fixed bed reactor for CO2 methanation. J. CO2 Util. 2018, 25, 158–169. [Google Scholar] [CrossRef]
- Gräf, I.; Rühl, A.K.; Kraushaar-Czarnetzki, B. Experimental study of heat transport in catalytic sponge packings by monitoring spatial temperature profiles in a cooled-wall reactor. Chem. Eng. J. 2014, 244, 234–242. [Google Scholar] [CrossRef]
- Türks, D.; Mena, H.; Armbruster, U.; Martin, A. Methanation of CO2 on Ni/Al2O3 in a structured fixed-bed reactor—A scale-up study. Catalysts 2017, 7, 152. [Google Scholar] [CrossRef] [Green Version]
- Shakir, O.; Yezerets, A.; Currier, N.W.; Epling, W.S. Spatially resolving concentration and temperature gradients during the oxidation of propylene on Pt/Al2O3. Appl. Catal. A Gen. 2009, 365, 301–308. [Google Scholar] [CrossRef]
- Simeone, M.; Salemme, L.; Menna, L. Methane autothermal reforming in a reverse flow reactor on Rh/Al2O3 catalyst. Int. J. Hydrog. Energy 2012, 37, 9049–9057. [Google Scholar] [CrossRef]
- Russell, A.; Henry, C.; Currier, N.W.; Yezerets, A.; Epling, W.S. Spatially resolved temperature and gas species concentration changes during C3H6 oxidation over a Pt/Al2O3 catalyst following sulfur exposure. Appl. Catal. A Gen. 2011, 397, 272–284. [Google Scholar] [CrossRef]
- Frey, M.; Romero, T.; Roger, A.C.; Edouard, D. Open cell foam catalysts for CO2 methanation: Presentation of coating procedures and in situ exothermicity reaction study by infrared thermography. Catal. Today 2016, 273, 83–90. [Google Scholar] [CrossRef]
- Zech, T.; Bohner, G.; Laus, O.; Klein, J.; Fischer, M. Design, fabrication, and application of a massively parallel single-bead microreactor system for high-throughput experimentation in heterogeneous catalysis. Rev. Sci. Instrum. 2005, 76. [Google Scholar] [CrossRef]
- Kopyscinski, J.; Schildhauer, T.J.; Vogel, F.; Biollaz, S.M.A.; Wokaun, A. Applying spatially resolved concentration and temperature measurements in a catalytic plate reactor for the kinetic study of CO methanation. J. Catal. 2010, 271, 262–279. [Google Scholar] [CrossRef]
- Mutschler, R.; Moioli, E.; Zhao, K.; Lombardo, L.; Oveisi, E.; Porta, A.; Falbo, L.; Visconti, C.G.; Lietti, L.; Züttel, A. Imaging Catalysis: Operando Investigation of the CO2 Hydrogenation Reaction Dynamics by Means of Infrared Thermography. ACS Catal. 2020, 10, 1721–1730. [Google Scholar] [CrossRef]
- Mutschler, R.; Moioli, E.; Züttel, A. Modelling the CO2 hydrogenation reaction over Co, Ni and Ru/Al2O3. J. Catal. 2019, 375, 193–201. [Google Scholar] [CrossRef]
- Falbo, L.; Martinelli, M.; Visconti, C.G.; Lietti, L.; Bassano, C.; Deiana, P. Kinetics of CO2 methanation on a Ru-based catalyst at process conditions relevant for Power-to-Gas applications. Appl. Catal. B Environ. 2018, 225, 354–363. [Google Scholar] [CrossRef]
- Moioli, E.; Mutschler, R.; Borsay, A.; Calizzi, M.; Züttel, A. Synthesis of grid compliant substitute natural gas from a representative biogas mixture in a hybrid Ni/Ru catalysed reactor. Chem. Eng. Sci. X 2020, 8, 100078. [Google Scholar] [CrossRef]
- Moioli, E.; Züttel, A. A model-based comparison of Ru and Ni catalysts for the Sabatier reaction. Sustain. Energy Fuels 2020, 4, 1396–1408. [Google Scholar] [CrossRef]
- Hernandez Lalinde, J.A.; Kofler, K.; Huang, X.; Kopyscinski, J. Improved kinetic data acquisition using an optically accessible catalytic plate reactor with spatially-resolved measurement techniques. Case of study: CO2 methanation. Catalysts 2018, 8, 86. [Google Scholar] [CrossRef] [Green Version]
- Schüler, C.; Hinrichsen, O. Entwicklung eines optisch zugänglichen Reaktors zur Thermographiemessung in einer Katalysatorschüttung. Chemie-Ingenieur-Technik 2016, 88, 1693–1702. [Google Scholar] [CrossRef]
- Frey, M.; Romero, T.; Roger, A.C.; Edouard, D. An intensification of the CO2 methanation reaction: Effect of carbon nanofiber network on the hydrodynamic, thermal and catalytic properties of reactors filled with open cell foams. Chem. Eng. Sci. 2019, 195, 271–280. [Google Scholar] [CrossRef]
- Flir Thermography Cameras. Available online: https://www.flir.eu/browse/professional-tools/thermography-cameras/ (accessed on 23 January 2021).
- InfraTech Camera Series. Available online: https://www.infratec.eu/thermography/infrared-camera/ (accessed on 23 January 2021).
- Yavorskiy, D.; Karpierz, K.; Grynberg, M.; Knap, W.; Łusakowski, J. Indium antimonide detector for spectral characterization of terahertz sources. J. Appl. Phys. 2018, 123. [Google Scholar] [CrossRef]
- Kalchmair, S.; Gansch, R.; Ahn, S.I.; Andrews, A.M.; Detz, H.; Zederbauer, T.; Mujagić, E.; Reininger, P.; Lasser, G.; Schrenk, W.; et al. Detectivity enhancement in quantum well infrared photodetectors utilizing a photonic crystal slab resonator. Opt. Express 2012, 20, 5622. [Google Scholar] [CrossRef]
- Honniball, C.I.; Wright, R.; Lucey, P.G. Spectral Response of Microbolometers for Hyperspectral Imaging. In Proceedings of the SPIE Defense + Security, Anaheim, CA, USA, 9–13 April 2017; Infrared Technology and Applications XLIII. Volume 10177. [Google Scholar] [CrossRef]
- Crystran Ltd. Barium Fluoride Properties. Available online: https://www.crystran.co.uk/optical-materials/barium-fluoride-baf2 (accessed on 23 December 2020).
- The Correct Material for Infrared (IR) Applications. Available online: https://www.edmundoptics.com/knowledge-center/application-notes/optics/the-correct-material-for-infrared-applications/ (accessed on 23 January 2021).
- Optical Materials. Available online: https://www.crystran.co.uk/optical-materials (accessed on 23 January 2021).
- Mutschler, R.; Luo, W.; Moioli, E.; Züttel, A. Fast real time and quantitative gas analysis method for the investigatiin of the CO2 reduction reaction mechanism. Rev. Sci. Instrum. 2018, 89, 114102. [Google Scholar] [CrossRef] [PubMed] [Green Version]
- Kimmerle, B.; Baiker, A.; Grunwaldt, J.D. Oscillatory behaviour of catalytic properties, structure and temperature during the catalytic partial oxidation of methane on Pd/Al2O 3. Phys. Chem. Chem. Phys. 2010, 12, 2288–2291. [Google Scholar] [CrossRef] [PubMed]
- Bosco, M.; Vogel, F. Optically accessible channel reactor for the kinetic investigation of hydrocarbon reforming reactions. Catal. Today 2006, 116, 348–353. [Google Scholar] [CrossRef]
- Porta, A.; Falbo, L.; Visconti, C.G.; Lietti, L.; Bassano, C.; Deiana, P. Synthesis of Ru-based catalysts for CO 2 methanation and experimental assessment of intraporous transport limitations. Catal. Today 2019, 343, 38–47. [Google Scholar] [CrossRef]
- Donazzi, A.; Livio, D.; Beretta, A.; Groppi, G.; Forzatti, P. Surface temperature profiles in CH4 CPO over honeycomb supported Rh catalyst probed with in situ optical pyrometer. Appl. Catal. A Gen. 2011, 402, 41–49. [Google Scholar] [CrossRef]
- Hernandez Lalinde, J.A.; Roongruangsree, P.; Ilsemann, J.; Bäumer, M.; Kopyscinski, J. CO2 methanation and reverse water gas shift reaction. Kinetic study based on in situ spatially-resolved measurements. Chem. Eng. J. 2020, 390, 124629. [Google Scholar] [CrossRef]
- Zhao, K.; Wang, L.; Calizzi, M.; Moioli, E.; Zuttel, A. In situ Control of the Adsorption Species in CO2 Hydrogenation: Determination of Intermediates and Byproducts. J. Phys. Chem. C 2018, 122, 20888–20893. [Google Scholar] [CrossRef]
- Zhao, K.; Wang, L.; Moioli, E.; Calizzi, M.; Züttel, A. Identifying Reaction Species by Evolutionary Fitting and Kinetic Analysis: An Example of CO2 Hydrogenation in DRIFTS. J. Phys. Chem. C 2019, 123, 8785–8792. [Google Scholar] [CrossRef]
Figure 1.
Determination of the wavelength of highest IR emission at different temperatures according to the black body emission spectrum.
Figure 1.
Determination of the wavelength of highest IR emission at different temperatures according to the black body emission spectrum.

Figure 2.
Decision tree for the selection of IR camera for catalytic reaction investigation.

Figure 3.
The IR transmittance of barium fluoride as a function of wavelength and thickness of the window (elaborated from [31]).
Figure 3.
The IR transmittance of barium fluoride as a function of wavelength and thickness of the window (elaborated from [31]).

Figure 4.
Decision tree for the determination of the appropriate material for the IR cell.

Figure 5.
(a) Temperature profiles measured with an IR camera during the Sabatier reaction over a 2% Ru/Al2O3 catalyst. P refers to the measurement points, which are highlighted in the thermograph on the top of the figure. (b) Measured ion currents of the reactant and products in the same reaction as in panel a.

Figure 6.
The predicted (a) temperature profile and (b) CO2 conversion for the Sabatier reaction over a 0.5% (black line) and 2% (red line) Ru/Al2O3 catalyst. For the 2% Ru/Al2O3 catalyst, an important reaction hotspot (ca. 5.5 °C) is predicted.
Figure 6.
The predicted (a) temperature profile and (b) CO2 conversion for the Sabatier reaction over a 0.5% (black line) and 2% (red line) Ru/Al2O3 catalyst. For the 2% Ru/Al2O3 catalyst, an important reaction hotspot (ca. 5.5 °C) is predicted.

Figure 7.
Decision tree for the determination of an appropriate experimental design methodology for IR thermography experiments.
Figure 7.
Decision tree for the determination of an appropriate experimental design methodology for IR thermography experiments.

Figure 8.
Suggested procedure for the data collection in IR thermography experiments. As a first step (1) the appropriate sequence and localization of the measurement points must be selected, to avoid misinterpretation of the thermographs. Later on (2), the IR spectra can be recorded and integrated (3) with appropriate concentration measurements, which must have a sufficiently high time resolution. The coupling of IR thermography and high frequency concentration measurements is essential to fully characterize the reactive phenomena.

Figure 9.
(a) Schematic representation of the experimental setup; (b) a picture of the reaction cell in the focal view of the IR camera.
Figure 9.
(a) Schematic representation of the experimental setup; (b) a picture of the reaction cell in the focal view of the IR camera.

Figure 10.
(a) The temperature profile recorded in the center of the reaction cell during the reduction of the oxidized 2% Ru/Al2O3 in H2 flow; (b) evolution of the MS spectra during the experiment. Experimental conditions: H2 flow: 10 mL/min, P = 1 bar, baseline temperature = 287 °C.
Figure 10.
(a) The temperature profile recorded in the center of the reaction cell during the reduction of the oxidized 2% Ru/Al2O3 in H2 flow; (b) evolution of the MS spectra during the experiment. Experimental conditions: H2 flow: 10 mL/min, P = 1 bar, baseline temperature = 287 °C.

Figure 11.
(a) Axial temperature profile at steady state and (b) Ion current change over time for the main species in the Sabatier reaction. Experimental conditions: total gas flow: 20 mL/min, H2:CO2 = 4:1, P = 1 bar, baseline temperature = 290 °C.
Figure 11.
(a) Axial temperature profile at steady state and (b) Ion current change over time for the main species in the Sabatier reaction. Experimental conditions: total gas flow: 20 mL/min, H2:CO2 = 4:1, P = 1 bar, baseline temperature = 290 °C.

Figure 12.
Evolution of the surface temperature over time upon feed of H2 and CO2. Experimental conditions: total gas flow: 20 mL/min, H2:CO2 = 4:1, P = 1 bar, baseline temperature = 290 °C. (S.S. = Steady State).
Figure 12.
Evolution of the surface temperature over time upon feed of H2 and CO2. Experimental conditions: total gas flow: 20 mL/min, H2:CO2 = 4:1, P = 1 bar, baseline temperature = 290 °C. (S.S. = Steady State).


Table 1.
Characteristics of the main detector types employed in commercial IR thermography cameras [28,29,30].
| Detector Type | Temperature Resolution (°C) | Temperature Range (°C) | Exposure Time (ms) | Frame Rate (fps) | Approximate Spectral Detection Range (μm) |
|---|---|---|---|---|---|
| Microbolometer | 0.075 | From −20 | 12 | 60 | 7–17 |
| Indium antimonide (InSb) | 0.020 | 50 to 350 | 1 | 170 | 3–5 |
| QWIP | 0.025 | −10 to 1500 | 16 | 380 | 6–8 |
Table 2.
Properties of various IR transmitting materials (transmitting wavelength elaborated from [32], transmission at 8 and 4 μm as well as melting temperature are elaborated from [33]).
| Material | Transmitting Wavelength Range (μm) | Modulus of Rupture (RM) (MPa) | Calculated Required Thickness for Bar (mm) | Transmission at 8 μm | Transmission at 4 μm | Melting Temperature (°C) |
|---|---|---|---|---|---|---|
| BaF2 | 0.2–16 | 26.9 | 4.0 | 90% | 94% | 1386 |
| CsI | 0.6–30 | 5.6 | 7.1 | 45% | 90% | 621 |
| CaF2 | 0.2–8 | 36.5 | 2.8 | 95% | 95% | 1360 |
| Fused silica | 0.3–4 | 50 | 2.4 | 1% | 94% | 1600 |
| Ge | 3–14 | 72.4 | 2.0 | 45% | 46% | 936 |
| KBr | 0.3–26 | 1.1 | 16.1 | 90% | 90% | 730 |
| KCl | 0.5–15 | 2.3 | 11.1 | 95% | 94% | 776 |
| LiF | 0.2–6 | 11.2 | 5.1 | 45% | 95% | 848 |
| MgF2 | 0.15–8 | 49.6 | 2.4 | 75% | 95% | 1255 |
| NaCl | 0.3–18 | 2.4 | 10.9 | 90% | 90% | 801 |
| Sapphire | 0.3–6 | 448 | 0.8 | 1% | 85% | 2040 |
| Si | 2–10 | 125 | 1.5 | 1% | 47–54% | 1420 |
| ZnSe | 0.5–16 | 55 | 2.3 | 60% | 70% | 1525 |
| GaAs (material of the lens used) | 2–18 | 71.9 | 2.9 | 55% | 55% | 1511 |
Publisher’s Note: MDPI stays neutral with regard to jurisdictional claims in published maps and institutional affiliations. |
© 2021 by the authors. Licensee MDPI, Basel, Switzerland. This article is an open access article distributed under the terms and conditions of the Creative Commons Attribution (CC BY) license (http://creativecommons.org/licenses/by/4.0/).
Share and Cite
MDPI and ACS Style
Mutschler, R.; Moioli, E. Infrared Thermography as an Operando Tool for the Analysis of Catalytic Processes: How to Use it? Catalysts 2021, 11, 311. https://0-doi-org.brum.beds.ac.uk/10.3390/catal11030311
AMA Style
Mutschler R, Moioli E. Infrared Thermography as an Operando Tool for the Analysis of Catalytic Processes: How to Use it? Catalysts. 2021; 11(3):311. https://0-doi-org.brum.beds.ac.uk/10.3390/catal11030311
Chicago/Turabian StyleMutschler, Robin, and Emanuele Moioli. 2021. "Infrared Thermography as an Operando Tool for the Analysis of Catalytic Processes: How to Use it?" Catalysts 11, no. 3: 311. https://0-doi-org.brum.beds.ac.uk/10.3390/catal11030311
Note that from the first issue of 2016, this journal uses article numbers instead of page numbers. See further details here.